Regime Classifier Oscillator (AiBitcoinTrend)The Regime Classifier Oscillator (AiBitcoinTrend) is an advanced tool for understanding market structure and detecting dynamic price regimes. By combining filtered price trends, clustering algorithms, and an adaptive oscillator, it provides traders with detailed insights into market phases, including accumulation, distribution, advancement, and decline.
This innovative tool simplifies market regime classification, enabling traders to align their strategies with evolving market conditions effectively.
👽 What is a Regime Classifier, and Why is it Useful?
A Regime Classifier is a concept in financial analysis that identifies distinct market conditions or "regimes" based on price behavior and volatility. These regimes often correspond to specific phases of the market, such as trends, consolidations, or periods of high or low volatility. By classifying these regimes, traders and analysts can better understand the underlying market dynamics, allowing them to adapt their strategies to suit prevailing conditions.
👽 Common Uses in Finance
Risk Management: Identifying high-volatility regimes helps traders adjust position sizes or hedge risks.
Strategy Optimization: Traders tailor their approaches—trend-following strategies in trending regimes, mean-reversion strategies in consolidations.
Forecasting: Understanding the current regime aids in predicting potential transitions, such as a shift from accumulation to an upward breakout.
Portfolio Allocation: Investors allocate assets differently based on market regimes, such as increasing cash positions in high-volatility environments.
👽 Why It’s Important
Markets behave differently under varying conditions. A regime classifier provides a structured way to analyze these changes, offering a systematic approach to decision-making. This improves both accuracy and confidence in navigating diverse market scenarios.
👽 How We Implemented the Regime Classifier in This Indicator
The Regime Classifier Oscillator takes the foundational concept of market regime classification and enhances it with advanced computational techniques, making it highly adaptive.
👾 Median Filtering: We smooth price data using a custom median filter to identify significant trends while eliminating noise. This establishes a baseline for price movement analysis.
👾 Clustering Model: Using clustering techniques, the indicator classifies volatility and price trends into distinct regimes:
Advance: Strong upward trends with low volatility.
Decline: Downward trends marked by high volatility.
Accumulation: Consolidation phases with subdued volatility.
Distribution: Topping or bottoming patterns with elevated volatility.
This classification leverages historical price data to refine cluster boundaries dynamically, ensuring adaptive and accurate detection of market states.
Volatility Classification: Price volatility is analyzed through rolling windows, separating data into high and low volatility clusters using distance-based assignments.
Price Trends: The interaction of price levels with the filtered trendline and volatility clusters determines whether the market is advancing, declining, accumulating, or distributing.
👽 Dynamic Cycle Oscillator (DCO):
Captures cyclic behavior and overlays it with smoothed oscillations, providing real-time feedback on price momentum and potential reversals.
Regime Visualization:
Regimes are displayed with intuitive labels and background colors, offering clear, actionable insights directly on the chart.
👽 Why This Implementation Stands Out
Dynamic and Adaptive: The clustering and refit mechanisms adapt to changing market conditions, ensuring relevance across different asset classes and timeframes.
Comprehensive Insights: By combining price trends, volatility, and cyclic behaviors, the indicator provides a holistic view of the market.
This implementation bridges the gap between theoretical regime classification and practical trading needs, making it a powerful tool for both novice and experienced traders.
👽 Applications
👾 Regime-Based Trading Strategies
Traders can use the regime classifications to adapt their strategies effectively:
Advance & Accumulation: Favorable for entering or holding long positions.
Decline & Distribution: Opportunities for short positions or risk management.
👾 Oscillator Insights for Trend Analysis
Overbought/oversold conditions: Early warning of potential reversals.
Dynamic trends: Highlights the strength of price momentum.
👽 Indicator Settings
👾 Filter and Classification Settings
Filter Window Size: Controls trend detection sensitivity.
ATR Lookback: Adjusts the threshold for regime classification.
Clustering Window & Refit Interval: Fine-tunes regime accuracy.
👾 Oscillator Settings
Dynamic Cycle Oscillator Lookback: Defines the sensitivity of cycle detection.
Smoothing Factor: Balances responsiveness and stability.
Disclaimer: This information is for entertainment purposes only and does not constitute financial advice. Please consult with a qualified financial advisor before making any investment decisions.
Cerca negli script per "accumulation"

Institutional Activity AnalysisThe Institutional Activity Analysis (IAA) indicator is a powerful tool designed to help traders identify potential institutional buying and selling activity in the market. By analyzing volume, price movement, and accumulation/distribution trends, this indicator provides insights into market dynamics that may signal significant activity.
This indicator is not a buy or sell recommendation but rather a tool to assist traders in understanding market behavior. It should be used in conjunction with other technical analysis tools and strategies for a comprehensive trading approach.
Key Features:
Smart Money Flow Index (SMFI):
1). Tracks the flow of "smart money" by analyzing price action relative to volume.
2). Helps identify whether institutional activity is bullish or bearish.
Accumulation/Distribution (Acc/Dist):
1). Measures buying and selling pressure in the market.
2). Indicates whether the market is in an accumulation (buying) or distribution (selling) phase.
Volume Spike Detection:
1. Identifies unusual volume spikes that may signal institutional activity.
2. Highlights these spikes with a yellow circle on the chart.
Significant Price Movement:
1. Detects strong price movements accompanied by high volume.
2. Marks these movements with a green triangle on the chart.
Customizable Dashboard:
1. Displays key metrics such as volume flow, smart money flow, accumulation/distribution, and volatility.
2. Includes visual signals for volume spikes and significant moves.
3. The dashboard can be positioned anywhere on the chart or turned off.
Heatmap for Activity Intensity:
1. Visualizes the intensity of market activity by combining volume and price volatility.
How to Read the Indicator:
Smart Money Flow (SMFI):
1. A positive SMFI value indicates bullish institutional activity.
2. A negative SMFI value suggests bearish institutional activity.
3. The blue line on the indicator represents the smoothed SMFI.
Accumulation/Distribution (Acc/Dist):
1. A positive slope indicates accumulation (buying pressure).
2. A negative slope indicates distribution (selling pressure).
3. The purple line on the indicator shows the smoothed Acc/Dist slope.
Volume Spikes:
1. Yellow circles on the chart indicate unusual volume spikes.
2. These spikes may signal institutional interest or significant market activity.
Significant Price Movements:
1. Green triangles on the chart highlight strong price movements with high volume.
2. These movements may indicate potential breakouts or reversals.
Dashboard:
The dashboard provides a quick summary of key metrics:
1. Volume Flow: Indicates whether volume is above or below the average.
2. Smart Money: Shows whether institutional activity is bullish or bearish.
3. Acc/Dist: Displays whether the market is in accumulation or distribution.
4. Volatility: Provides the current volatility level.
5. Signals: Highlights whether there are volume spikes or significant moves.
How to Use the Indicator:
Identify Institutional Activity:
1. Look for confluences between volume spikes, significant price movements, and the direction of the SMFI and Acc/Dist slope.
2. For example, a volume spike combined with a positive SMFI and accumulation may indicate bullish institutional activity.
Confirm Market Trends:
1. Use the indicator to confirm trends by analyzing the direction of the SMFI and Acc/Dist slope.
2. A rising SMFI and positive Acc/Dist slope suggest a strong uptrend, while the opposite indicates a downtrend.
Monitor Volatility:
1. High volatility combined with volume spikes may signal potential breakouts or reversals.
2. Use the volatility metric on the dashboard to gauge market conditions.
Set Alerts:
1. Use the built-in alert conditions to get notified of volume spikes and significant price movements.
2. Alerts can help you stay informed about potential market opportunities.
Important Notes:
1. This is not a buy or sell recommendation. The IAA indicator is a technical analysis tool designed to provide insights into market activity. Always use it in conjunction with other tools and strategies.
2. The indicator works best when combined with other forms of analysis, such as support/resistance levels, trendlines, and candlestick patterns.
3. Past performance is not indicative of future results. Always practice proper risk management and trade responsibly.
Customization:
The indicator includes several customizable settings:
1. Volume Spike Threshold: Adjust the sensitivity for detecting volume spikes.
2. Smoothing Period: Change the period for calculating SMFI and Acc/Dist.
3. Price Movement Threshold: Modify the sensitivity for detecting significant price movements.
4. Dashboard Position: Move the dashboard to any corner of the chart or turn it off.
5. Visual Settings: Customize the colors and transparency of the dashboard and signals.
Example Use Case:
Imagine you're analyzing a stock that has been consolidating for several days. Suddenly, the IAA indicator detects:
1. A volume spike (yellow circle),
2. A significant price movement (green triangle),
3. A positive SMFI (bullish smart money flow),
4. And an accumulation phase (positive Acc/Dist slope).
This confluence of signals may indicate that institutional buyers are entering the market, potentially leading to a breakout. You can then use this information to plan your trade, such as setting alerts or monitoring for confirmation from other indicators.
Disclaimer:
The Institutional Activity Analysis (IAA) indicator is for educational and informational purposes only. It is not financial advice or a recommendation to buy or sell any security. Always conduct your own research and consult with a financial advisor before making trading decisions. Use this tool responsibly and at your own risk.

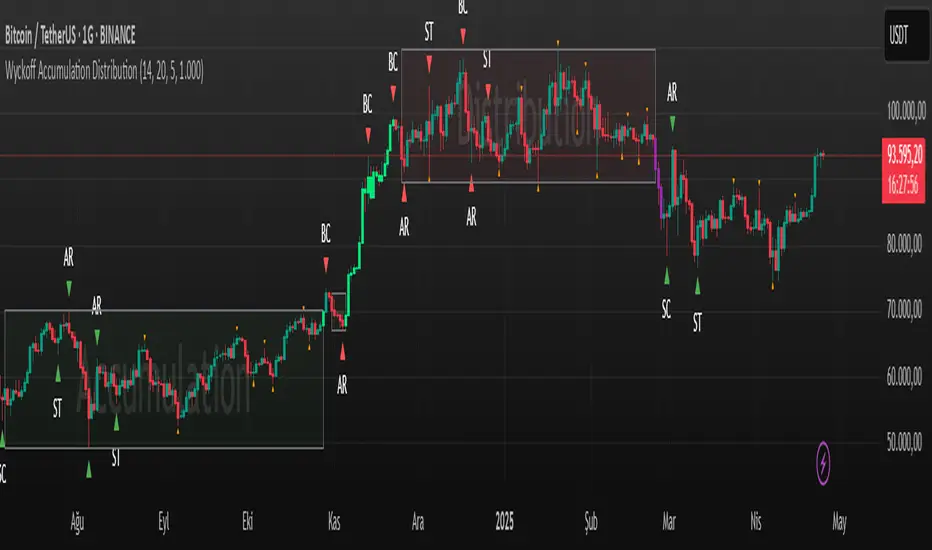
Wyckoff Accumulation Distribution Wyckoff Accumulation & Distribution Indicator (RSI-Based)
This Pine Script is a technical analysis indicator built around the Wyckoff Method, designed to detect accumulation and distribution phases using RSI (Relative Strength Index) and pivot points. It automatically marks key structural turning points on the chart and highlights relevant zones with colored boxes.
What Does It Do?
Draws accumulation and distribution boxes based on RSI behavior.
Automatically detects Wyckoff structural signals:
SC (Selling Climax)
AR (Automatic Rally)
ST (Secondary Test)
BC (Buying Climax)
DAR (Automatic Reaction)
DST (Secondary Test - Distribution)
Identifies trend transitions by detecting sideways RSI movement.
Attempts to detect spring and UTAD-like deviations based on RSI reversals.
Uses RSI extremes in conjunction with pivot points to generate Wyckoff signals.
How Does It Work?
RSI Zone: It identifies sideways markets when RSI stays within ±20 of the 50 level (this range is configurable).
Pivot Points: It detects pivot highs/lows that sync with RSI values (pivotLen is adjustable).
Trend Box Drawing:
When RSI exits the sideways zone, the script draws a gray box between the highest high and lowest low within that range.
If RSI breaks upward, the box becomes green (Accumulation); if downward, it becomes red (Distribution).
Wyckoff Structural Points:
SC/BC: Detected when a pivot occurs with RSI below/above a threshold.
AR/DAR: The next opposite pivot after SC or BC.
ST/DST: The next same-direction pivot after AR or DAR.
How to Use It
Works best on 4H or daily charts for more reliable signals. Shorter timeframes may generate noise.
Primarily used for interpreting RSI structures through the lens of Wyckoff methodology.
Box colors help quickly identify market phase:
Green box: Likely Accumulation
Red box: Likely Distribution
Triangular markers show key signals:
SC, AR, ST: Accumulation points
BC, DAR, DST: Distribution points
Use these signals alongside price action to manually interpret Wyckoff phases.
image.binance.vision
image.binance.vision
What Is the Wyckoff Method?
The Wyckoff Method, developed in the 1930s by Richard Wyckoff, is a market analysis approach that focuses on supply and demand dynamics behind price movements.
Wyckoff’s 5 Phases:
Accumulation: Smart money gradually buying at low prices.
Markup: Price begins trending upwards.
Distribution: Smart money selling to retail traders.
Markdown: Downtrend begins as supply outweighs demand.
Re-accumulation / Re-distribution: Trend-continuation phases with consolidations.
This indicator is specifically designed to detect phase 1 (Accumulation) and phase 3 (Distribution).
Extra Notes
Repainting is minimal, as pivots are confirmed using historical candles.
Labels use plotshape for a clean, minimalist visual style.
Other Wyckoff events (like SOS, LPS, UT, UTAD) could be added in future updates.
This script does not generate buy/sell signals; it is meant for structural interpretation.
ATR Range Accumulation by Standard Deviation and Volume [SS]So, this is an indicator/premise I have been experimenting with, which mixes ATR with Z-Score and Volume metrics.
What does the indicator do?
The indicator, on the lower timeframes, uses an ATR approach to determine short-term ranges. It takes the average ATR range over a designated lookback period and plots out the levels like so:
It then calculates the Z-Score for these ATR targets (shown in the chart above) and calculates, over the designated lookback period, how often price accumulates at that standard deviation level.
The indicator is essentially a hybrid of my Z-Score Support and Resistance indicator and my frequency distribution indicator. It combines both concepts into one.
You also have the option of sorting by volume accumulation. This will display the accumulation of the ranges by volume accumulation, like so:
Larger Timeframes:
If you want to see the accumulation by volume or standard deviation on the larger timeframes, you can. Simply toggle on your preferred setting:
Show Total Accumulation Breakdown:
This will break down the levels, over the lookback period, by standard deviation. This is similar to the Z-Score support and resistance indicator. It will then show you how often price accumulates at these various standard deviation levels. Here is an example on the daily timeframe using the 1D chart settings:
Inversely, you can repeat this, with the Z-Score levels, but show accumulation by volume. This will print 5 boxes, which are between +3 Standard Deviations and -3 Standard Deviations, like so:
Here we can see that 61% of volume accumulation is between -1 and 1 standard deviation.
Using it to Trade:
For swing trading, I suggest using the larger timeframe information. However, for both swing and day traders, it is also helpful to use the ATR display. You can modify the ATR display to show the levels on any timeframe by selecting which timeframe you would like to see ATR ranges for. If you are trading on the 1 or 5-minute chart, I suggest leaving the levels at no shorter than a 60-minute timeframe.
You can also use these levels on the daily for the weekly levels, etc.
The accumulation being shown will be based on the current chart timeframe. This is a function of Pinescript, but in this case, it's actually advantageous because if you are trading on the shorter timeframe, and a level has 0% recent accumulation, it's unlikely we will see that level soon or overly quickly. Intraday retracements will generally happen to areas of high accumulation.
How this indicator is different:
The difference in this indicator comes from its focus on accumulation in relation to Standard Deviation. There is one thing that is consistent among retail traders, algorithms, market makers, and funds, and that is looking at the market in terms of standard deviation. Each person, market maker, and algorithm may be slightly nuanced in how it conceptualizes standard deviation (whether it be since the inception of the ticker (or IPO), or the previous 500 days, or the previous 100 days, etc.), but the premise remains consistent. Standard Deviation is a really important, if not the most important, metric to pay attention to. Another important metric is volume. Thus, the premise is that combining volume accumulation with standard deviation should, theoretically, be telling. We can see the extent of buying at various standard deviations and whether a stock is really a buy or not.
And that's the indicator! Hope you enjoy it. Leave your comments and questions below.
Safe trades!
XAMD/AMDX ICT 01 [TradingFinder] SMC Quarterly Theory Cycles🔵 Introduction
The XAMD/AMDX strategy, combined with the Quarterly Theory, forms the foundation of a powerful market structure analysis. This indicator builds upon the principles of the Power of 3 strategy introduced by ICT, enhancing its application by incorporating an additional phase.
By extending the logic of Power of 3, the XAMD/AMDX tool provides a more detailed and comprehensive view of daily market behavior, offering traders greater precision in identifying key movements and opportunities
This approach divides the trading day into four distinct phases : Accumulation (19:00 - 01:00 EST), Manipulation (01:00 - 07:00 EST), Distribution (07:00 - 13:00 EST), and Continuation or Reversal (13:00 - 19:00 EST), collectively known as AMDX.
Each phase reflects a specific market behavior, providing a structured lens to interpret price action. Building on the fractal nature of time in financial markets, the Quarterly Theory introduces the Four Quarters Method, where a currency pair’s price range is divided into quarters.
These divisions, known as quarter points, highlight critical levels for analyzing and predicting market dynamics. Together, these principles allow traders to align their strategies with institutional trading patterns, offering deeper insights into market trends
🔵 How to Use
The AMDX framework provides a structured approach to understanding market behavior throughout the trading day. Each phase has its own characteristics and trading opportunities, allowing traders to align their strategies effectively. To get the most out of this tool, understanding the dynamics of each phase is essential.
🟣 Accumulation
During the Accumulation phase (19:00 - 01:00 EST), the market is typically quiet, with price movements confined to a narrow range. This phase is where institutional players accumulate their positions, setting the stage for future price movements.
Traders should use this time to study price patterns and prepare for the next phases. It’s a great opportunity to mark key support and resistance zones and set alerts for potential breakouts, as the low volatility makes immediate trading less attractive.
🟣 Manipulation
The Manipulation phase (01:00 - 07:00 EST) is often marked by sharp and deceptive price movements. Institutions create false breakouts to trigger stop-losses and trap retail traders into the wrong direction. Traders should remain cautious during this phase, focusing on identifying the areas of liquidity where these traps occur.
Watching for price reversals after these false moves can provide excellent entry opportunities, but patience and confirmation are crucial to avoid getting caught in the manipulation.
🟣 Distribution
The Distribution phase (07:00 - 13:00 EST) is where the day’s dominant trend typically emerges. Institutions execute large trades, resulting in significant price movements. This phase is ideal for trading with the trend, as the market provides clearer directional signals.
Traders should focus on identifying breakouts or strong momentum in the direction of the trend established during this period. This phase is also where traders can capitalize on setups identified earlier, aligning their entries with the market’s broader sentiment.
🟣 Continuation or Reversal
Finally, the Continuation or Reversal phase (13:00 - 19:00 EST) offers a critical juncture to assess the market’s direction. This phase can either reinforce the established trend or signal a reversal as institutions adjust their positions.
Traders should observe price behavior closely during this time, looking for patterns that confirm whether the trend is likely to continue or reverse. This phase is particularly useful for adjusting open positions or initiating new trades based on emerging signals.
🔵 Settings
Show or Hide Phases.
Adjust the session times for each phase :
Accumulation: 19:00-01:00 EST
Manipulation: 01:00-07:00 EST
Distribution: 07:00-13:00 EST
Continuation or Reversal: 13:00-19:00 EST
Modify Visualization : Customize how the indicator looks by changing settings like colors and transparency.
🔵 Conclusion
AMDX provides traders with a practical method to analyze daily market behavior by dividing the trading day into four key phases: Accumulation, Manipulation, Distribution, and Continuation or Reversal. Each phase highlights specific market dynamics, offering insights into how institutional activity shapes price movements.
From the quiet buildup in the Accumulation phase to the decisive trends of the Distribution phase, and the critical transitions in Continuation or Reversal, this approach equips traders with the tools to anticipate movements and make informed decisions.
By recognizing the significance of each phase, traders can avoid common traps during Manipulation, capitalize on clear trends during Distribution, and adapt to changes in the final phase of the day.
The structured visualization of market phases simplifies decision-making for traders of all levels. By incorporating these principles into your trading strategy, you can enhance your ability to align with market trends, optimize entry and exit points, and achieve more consistent results in your trading journey.

+ Breadth & Volumenote* If you've used my "+ Rate of Change Indicator", I am updating that without the OBV, which has been moved here. Just an FYI.
This "indicator" is basically a variety of indicators that measure volume, or accumulation/distribution. There's a bit of a story about how this came about but
it's not that interesting, so I'll spare you.
Indicators from which you may choose here are On Balance Volume (OBV), Money Flow Index (MFI), Chaikin Money Flow (CMF), Chaikin Oscillator, and Positive & Negative Net Volume.
I'll give a brief overview of these below, and if you want to educate yourself further on them you may. There are many web resources for that.
Most people are probably familiar with OBV. It's one of the more commonly used volume indicators, especially in the crypto crowd (at least amongst those traders I follow). It's basically a cumulative (doesn't oscillate around a midpoint) momentum indicator that measures volume of the current period versus volume of the previous period and adds it if price closed higher, but subtracts it if price closes lower. It's another way of using volume to confirm trend.
The MFI is a momentum indicator that measures the flow of money into and out of an asset over some period of time (user input). It's calculated using the RSI, so it can be used similarly to RSI (divergences, overbought, oversold, etc.), but of course unlike the RSI it's calculated primarily using volume and comparing the most recent candle close to the previous one (similar to OBV).
CMF is a volume-weighted average of accumulation and distribution over a some period of time (typically 21). It's a way of measuring accumulation versus
distribution in an asset, and oscillates around a zero line. You would use it similarly to any other oscillator, in that you can look for divergences, and general positive or negative momentum.
Chaikin Oscillator is basically a MACD (without signal line) of the accumulation and distribution index (or line--which is somehow different than simply accumulation and distribution). I haven't looked into these differences deeply, but if you look below at the calculations, and substituted 'ad' for 'accdist' you get very different readings. I actually did that, and what it looks like it would do is turn the actual Oscillator into a MACD signal line. So, by substituting 'ad' for 'accdist' (or the accumulation/distribution index) you produce a signal line of the Chaikin Oscillator.
Anyway, all that confusion out of the way, as I said, it's a MACD on the accumulation and distribution index, therefore it is another zero line oscillator, and similarly to CMF, it's a way of measuring price movements in the chart versus a/d. The zero line isn't just any old zero line, however, it is actually the accumulation distribution line. I've made an OBV version of this by substituting the OBV for AD, so if you prefer OBV maybe you will like that.
Pos. & Neg Net Volume is actually an indicator I had seen made by RafaelZioni. It basically takes net volume, calculates a cumulative of that, then subtracts a moving average of some period from the cumulative net volume in order to create a volume oscillator. Use it like the other oscillators!
Added Donchian Channels, moving averages, Bollinger Bands, colored everything, and alerts.
Enjoy!
Below I will post images with the different indicators, everything on default settings (except for lookback period, which I have adjusted to my personal preferences).
Above is an image with the MFI being compared to the RSI since they are very similar (MFI being basically a volume derivative of the RSI).
Chaikin Money Flow set to lookback of 13. You could probably extend that a bit if you wanted to smooth the line more.
Chaikin Oscillator and Chaikin Oscillator of OBV, with a zoomed in look below, to see the differences more clearly.
CO and COBV closer look.
Positive & Negative Net Volume.

NormInvTargetSeekerNormInvTargetSeeker
The NormInvTargetSeeker is a trading tool designed to aid traders in identifying and capitalizing on Distribution and Accumulation zones, highlighting specific price levels that could serve as targets for future price movements. Although the indicator itself is not multi-timeframe, an effective trading strategy might involve signal validation across multiple timeframes.
🔶 USAGE
The indicator identifies Distribution and Accumulation zones, providing potential targets for future price moves.
Traders are encouraged to use these zones as profit targets or potential reversal points.
Confluence Zones
These zones are identified as regions where various factors or levels converge, signaling an increased probability of price reaction.
They can be used to reinforce signals or identify levels where price might encounter significant resistance or support.
🔹 Trading Strategy
First, identify a signal on your primary trading timeframe.
Manually check higher timeframes to ensure the signal aligns with them.
Use the identified zones, whether Distribution or Accumulation, as target zones for your trades.
🔶 Order Blocks
The NormInvTargetSeeker identifies "Order Blocks" by examining a specified number of consecutive candles with a specific condition: the current candle must completely engulf the previous candle. This means that both the high and low of the current candle are higher and lower, respectively, than the high and low of the previous candle, signifying a dominant move in the direction of the current candle.
🔹 Trading Strategy
Target Confirmation: Order Blocks can serve to confirm target points, providing additional validation for identified levels.
Market Insight: They offer crucial insights into whether "big hands" or institutional players are positioned as buyers or sellers in the market.
Traders can use Order Blocks as a means to validate targets or key price levels, observing if the price reacts significantly upon reaching these blocks.
They can also provide insights into the general market direction or underlying market strength by identifying where the major market players are placing their orders.
🔶 SETTINGS
The indicator allows users to adjust various parameters to customize the display and logic of the tool to fit their needs.
🔹 Display Settings
Users can customize the colors and displays of various zones and labels to match their preferences.
🔶 LICENSE AND CREDITS
This work is licensed under Attribution-NonCommercial-ShareAlike 4.0 International (CC BY-NC-SA 4.0). More information here: creativecommons.org
This indicator utilizes a TypeScript implementation of the Normal Inverse function as a reference, which can be found here : github.com
Special thanks to the authors of the referenced code for providing a foundation upon which this indicator was built.
🔶 UPDATES
Current Version: 1.0.0
For future updates, please check the comment section.
🔶 CONTACT
For any questions or suggestions, please feel free to contact @RickSimpson on TradingView.

MACDVMACDV = Moving Average Convergence Divergence Volume
The MACDV indicator uses stochastic accumulation / distribution volume inflow and outflow formulas to visualize it in a standard MACD type of appearance.
To be able to merge these formulas I had to normalize the math.
Accumulation / distribution volume is a unique scale.
Stochastic is a 0-100 scale.
MACD is a unique scale.
The normalized output scale range for MACDV is -100 to 100.
100 = overbought
-100 = oversold
Everything in between is either bullish or bearish.
Rising = bullish
Falling = bearish
crossover = bullish
crossunder = bearish
convergence = direction change
divergence = momentum
The default input settings are:
7 = K length, Stochastic accumulation / distribution length
3 = D smoothing, smoothing stochastic accumulation / distribution volume weighted moving average
6 = MACDV fast, MACDV fast length line
color = blue
13 = MACDV slow, MACDV slow length line
color = white
4 = MACDV signal, MACDV histogram length
color rising above 0 = bright green
color falling above 0 = dark green
color falling below 0 = bright red
color rising below 0 = dark red
2 = Stretch, Output multiplier for MACDV visual expansion
Horizontal lines:
100
75
50
25
0
-25
-50
-75
-100
Anchored OBV + A/DAnchored OBV + A/D is a single-pane indicator that allows On-Balance Volume (OBV) and Accumulation/Distribution (A/D) to be plotted together using a period-anchored approach.
OBV and A/D are cumulative by nature, which makes their full-history absolute values arbitrary and often incomparable when plotted side-by-side . This script addresses that limitation by anchoring each indicator to a user-defined period (daily, weekly, monthly, etc.) and plotting their relative change from that baseline rather than their raw values. The result is a comparison that preserves each indicator’s internal structure (trends, inflections, and divergences) while minimizing scale conflicts.
How it Works
At the start of each selected anchor period, the script records the current OBV and A/D values as baselines. All subsequent values are plotted as changes relative to those baselines:
- Percent mode measures the % change from the baseline.
- Delta mode measures the absolute change from the baseline.
Optional anchor markers and a zero line make it easy to see when resets occur and how each indicator behaves relative to the period’s starting point.
Advantages vs using OBV and A/D separately
- Direct visual comparison: Both indicators are on the same anchored scale, making relative movement immediately readable.
- Preserved analytical structure: Trends, inflections, and divergences remain intact; time-based shape is not distorted.
- Cleaner workflow: One indicator, one pane, and less chart clutter.
Interpretation
- Values above zero indicate net accumulation or positive volume pressure since the anchor.
- Values below zero indicate net distribution or negative volume pressure since the anchor.
- Trend confirmation: Rising price accompanied by rising anchored OBV and A/D suggests healthy participation.
- Price Divergence: Price making new highs or lows while one or both indicators fail to confirm can indicate weakening participation or a potential change in behavior.
- OBV vs A/D Interaction: When both move together, volume and close-location effects broadly agree. When they diverge, it highlights differences between net up/down volume (OBV) and intrabar accumulation/distribution (A/D).
Warnings!
- Percent mode can become visually unstable when baseline OBV or A/D values are near zero due to division effects inherent in percent-change calculations.
- It is not recommended to interpret structure across periods as each period is relative to a different baseline. Structure is not preserved across periods - only within each individual period.
Credits
This script is inspired by Multi-Ticker Anchored Candles (MTAC) by @SamRecio . MTAC's anchored-baseline concept and open-source nature provided an important conceptual foundation for adapting the same idea to OBV and A/D. Many thanks to @SamRecio for publishing his work openly.

Wyckoff Effort vs. Result📌 Wyckoff Effort vs. Result (E/R) – Visualizing Supply & Demand Imbalance with Volume Confirmation
📖 Overview
The Wyckoff Effort vs. Result (E/R) indicator is designed to help traders interpret market behavior through the lens of volume vs. price movement — a foundational concept in Richard Wyckoff’s methodology.
This tool aims to highlight moments where the “effort” (volume) is not in proportion to the “result” (price movement) — giving insight into potential accumulation or distribution events.
By detecting high-volume candles and classifying them based on their price direction, the indicator visualizes zones where smart money might be active .
⚙️ How It Works
1. Effort Accumulation (High Volume Down Bar):
• When a candle closes lower than it opens (down bar) and has above-average volume , it’s marked as potential absorption of selling pressure (effort to push down met by buying).
• These candles are colored red and the open level is plotted, acting as a potential support or re-test zone.
2. Effort Distribution (High Volume Up Bar):
• When a candle closes higher than it opens (up bar) and has above-average volume , it’s marked as potential distribution (effort to push up absorbed by sellers).
• These candles are colored green and the open level is plotted , acting as a potential resistance or rejection zone.
3. Average Volume Calculation:
• The script calculates a simple moving average (SMA) of volume over a user-defined lookback period.
• If current volume exceeds the average multiplied by a set threshold, it’s treated as a high-effort bar .
🧪 Inputs
Input Description
Average Volume Lookback - Number of bars used to calculate the volume average
High Volume Multiplier. - Multiplier to define what qualifies as “high volume”
🖥️ Visual Output
• 🔴 Red candles = High volume on a down bar → possible accumulation
• 🟢 Green candles = High volume on an up bar → possible distribution
• 📉 Horizontal lines at bar open price mark the potential zones where effort occurred
These zones can serve as:
• Areas of support/resistance
• Trap zones where smart money absorbs liquidity
• Entry/exit filters when combined with price action
🧠 How to Use
• Use in combination with price structure, support/resistance, and volume profile tools
• Watch how price reacts when it revisits the plotted lines
• Look for effort bars that fail to lead to continuation, signaling potential reversal
• Can be used in scalping, swing trading, or Wyckoff-style phase analysis
🔒 Technical Notes
• ✅ Does not repaint
• ✅ Built with Pine Script v6
• ✅ Lightweight and customizable
• ❌ Does not generate buy/sell signals — it provides context, not predictions

Hidden Liquidity Shift DetectorPurpose
The Hidden Liquidity Shift Detector identifies candles that indicate potential hidden accumulation or distribution activity based on volume and price action behavior. These setups often represent institutional absorption of liquidity ahead of larger moves.
How It Works
The script detects candles with the following characteristics:
Small real body relative to the total candle range
A strong wick (upper or lower) indicating rejection
Volume significantly higher than the recent average
It flags:
Hidden Selling (Distribution) when a bearish candle has a long upper wick and high volume
Hidden Buying (Accumulation) when a bullish candle has a long lower wick and high volume
These candles are often missed by traditional indicators but may precede significant reversals or breakouts.
Features
Automatic detection of absorption-style candles
Volume spike filtering based on configurable multiplier
Wick and body ratio thresholds to fine-tune signal quality
Non-intrusive signal markers (colored circles)
Real-time alerts for hidden buying/selling signals
Usage Tips
Use on 15m to 4H charts for intraday detection, or Daily for swing setups
Combine with support/resistance or volume profile zones for higher conviction
Clusters of signals in the same area increase reversal probability
Can be used alongside Wyckoff-style logic or smart money concepts

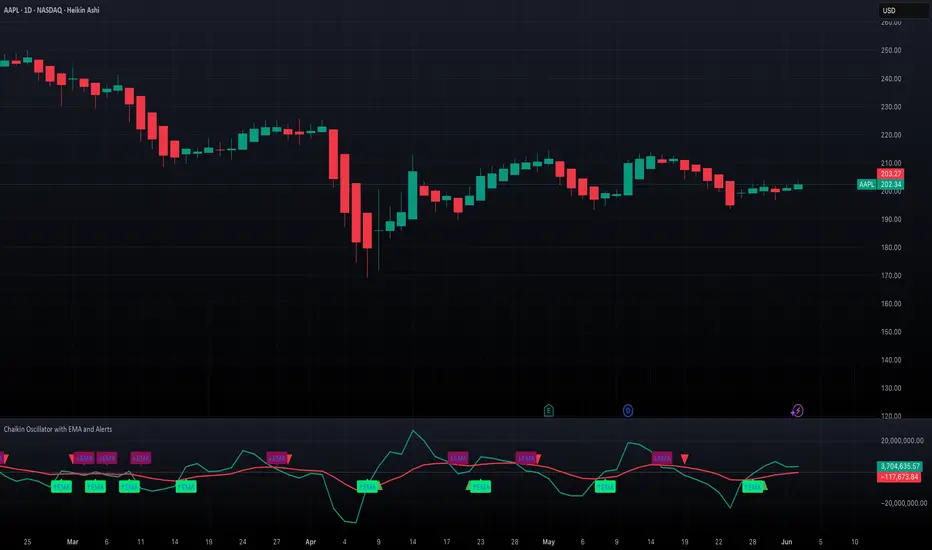
Chaikin Oscillator with EMA and AlertsOverview
This indicator plots the classic Chaikin Oscillator along with an EMA overlay to help identify changes in accumulation or distribution momentum. It includes visual markers and built-in alerts for key crossover events such as crossing the zero line and crossing above or below the Chaikin EMA.
Concepts
The Chaikin Oscillator is calculated as the difference between two EMAs of Accumulation/Distribution (A/D) volume. It is used to measure the momentum behind buying and selling pressure. An EMA is applied to the oscillator itself to smooth out signals and provide an additional layer of trend confirmation. Crossovers above or below zero, and above or below the EMA, are interpreted as potential signals of market sentiment shifts.
How to Use the Indicator
Apply the indicator to any chart and select your preferred short, long, and EMA lengths. The script will plot the Chaikin Oscillator in teal and its EMA in red. Triangles and labels will appear on the chart when the oscillator crosses above or below the zero line, or when it crosses its EMA. Green triangles indicate bullish zero-line crossovers, while red triangles indicate bearish ones. Lime and maroon labels signal EMA crossovers. Use these signals to assess momentum shifts and potential entry or exit points.
Interpretation
When the Chaikin Oscillator is above zero and rising, it suggests strong buying pressure. When it is below zero and falling, it suggests strong selling pressure. A crossover above the EMA may indicate an emerging bullish trend, while a crossover below the EMA may suggest increasing bearish momentum. Using both the zero line and EMA crossover together helps filter noise and improves reliability of momentum-based signals.
Notes
The indicator includes four alert conditions that can be enabled in TradingView to notify you of Chaikin Oscillator crossovers. It works across all asset classes and timeframes. This tool is especially useful for identifying momentum shifts ahead of price moves and for confirming volume-based signals in trend continuation or reversal scenarios. Adjust input lengths to suit your trading style or the volatility of the instrument you are analyzing.
OBV & AD Oscillators with Dual Smoothing OptionsOn Balance Volume and Accumulation/Distribution
Overlaid into 1 and then some,
Now it is an oscillator!
3 customizable moving average types
- Ehlers Deviation Scaled Moving Average
- Volatility Dynamic Moving Average
- Simple Moving Average
Each with customizable periods
And with the ability to overlay a second set too
Default Settings have a longer period MA of 377 using Ehlers DSMA to better capture the standard view of OBV and A/D.
An extra overlay of a shorter period using a Volatility DMA uses Average True Range with its own custom settings, seeks to act more as an RSI

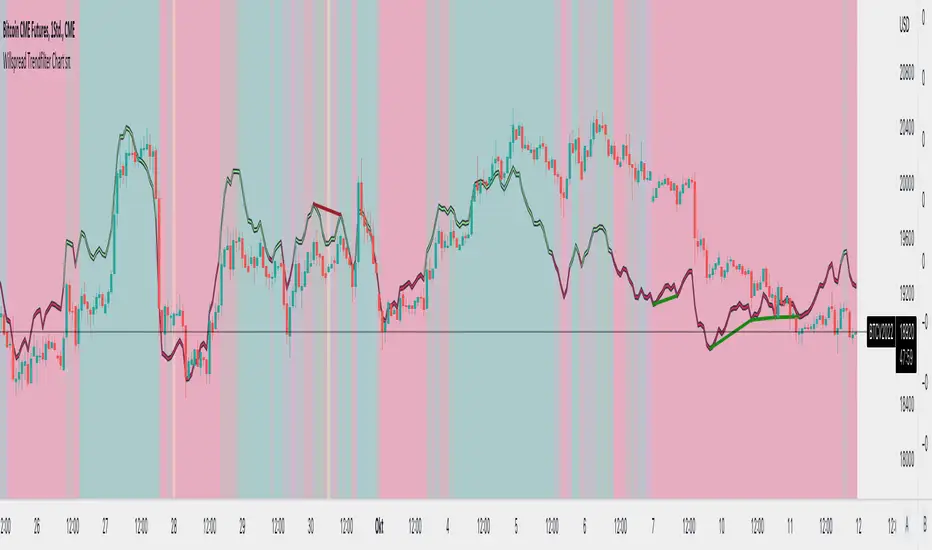
Willspread Chart + POIV & ADVolumen TrendColor sπThe Indicator is a combination of different types of measurements to the Price Action.
1. Spread: The Spread is set to measure your Symbol to another chosen Market like Dollar as Contra . But you can switch also between different markets.
2. Accumulation/Distribution with True Range of High or Low including OpenInterest. This only works with Futures .
--Energies, Metals, Bonds, Softs, Currencies, Livestock, live cattle , feeder cattle, lean hogs , index--
Open Interest for:
ZW, ZC, ZS, ZM, ZL, ZO, ZR, CL, RB, HO, NG, GC, SI, HG, PA, PL, ZN, ZB, ZT, ZF, CC, CT, KC, SB, JO, LB, AUDUSD, GBPUSD, USDCAD, EURUSD, USDJPY, USDCHF, USDMXN, NZDUSD, USDRUB, DX, BTC, ETH, LE, GF, HE, NQ, NDX, ES, SPX, RTY, VIX,
3. Accumulation/Distribution with True Range of High or Low including Volume .
4. The color shows if the Market has positive or negative (Willspread, Volume or Open Interest)
5. The Indicator also shows Divergences to Price and Willspread Movements.
If you want to have more information just give me a message.
Acc/Dist. Cloud with Fractal Deviation Bands by @XeL_ArjonaACCUMULATION / DISTRIBUTION CLOUD with MORPHIC DEVIATION BANDS
Ver. 2.0.beta.23:08:2015
by Ricardo M. Arjona @XeL_Arjona
DISCLAIMER
The Following indicator/code IS NOT intended to be a formal investment advice or recommendation by the author, nor should be construed as such. Users will be fully responsible by their use regarding their own trading vehicles/assets.
The embedded code and ideas within this work are FREELY AND PUBLICLY available on the Web for NON LUCRATIVE ACTIVITIES and must remain as is.
Pine Script code MOD's and adaptations by @XeL_Arjona with special mention in regard of:
Buy (Bull) and Sell (Bear) "Power Balance Algorithm by Vadim Gimelfarb published at Stocks & Commodities V. 21:10 (68-72).
Custom Weighting Coefficient for Exponential Moving Average (nEMA) adaptation work by @XeL_Arjona with contribution help from @RicardoSantos at TradingView @pinescript chat room.
Morphic Numbers (PHI & Plastic) Pine Script adaptation from it's algebraic generation formulas by @XeL_Arjona
Fractal Deviation Bands idea by @XeL_Arjona
CHANGE LOG:
ACCUMULATION / DISTRIBUTION CLOUD: I decided to change it's name from the Buy to Sell Pressure. The code is essentially the same as older versions and they are the center core (VORTEX?) of all derived New stuff which are:
MORPHIC NUMBERS: The "Golden Ratio" expressed by the result of the constant "PHI" and the newer and same in characteristics "Plastic Number" expressed as "PN". For more information about this regard take a look at: HERE!
CUSTOM(K) EXPONENTIAL MOVING AVERAGE: Some code has cleaned from last version to include as custom function the nEMA , which use an additional input (K) to customise the way the "exponentially" is weighted from the custom array. For the purpose of this indicator, I implement a volatility algorithm using the Average True Range of last 9 periods multiplied by the morphic number used in the fractal study. (Golden Ratio as default) The result is very similar in response to classic EMA but tend to accelerate or decelerate much more responsive with wider bars presented in trending average.
FRACTAL DEVIATION BANDS: The main idea is based on the so useful Standard Deviation process to create Bands in favor of a multiplier (As John Bollinger used in it's own bands) from a custom array, in which for this case is the "Volume Pressure Moving Average" as the main Vortex for the "Fractallitly", so then apply as many "Child bands" using the older one as the new calculation array using the same morphic constant as multiplier (Like Fibonacci but with other approach rather than %ratios). Results are AWSOME! Market tend to accelerate or decelerate their Trend in favor of a Fractal approach. This bands try to catch them, so please experiment and feedback me your own observations.
EXTERNAL TICKER FOR VOLUME DATA: I Added a way to input volume data for this kind of study from external tickers. This is just a quicky-hack given that currently TradingView is not adding Volume to their Indexes so; maybe this is temporary by now. It seems that this part of the code is conflicting with intraday timeframes, so You are advised.
This CODE is versioned as BETA FOR TESTING PROPOSES. By now TradingView Admins are changing lot's of things internally, so maybe this could conflict with correct rendering of this study with special tickers or timeframes. I will try to code by itself just the core parts of this study in order to use them at discretion in other areas. ALL NEW IDEAS OR MODIFICATIONS to these indicator(s) are Welcome in favor to deploy a better and more accurate readings. I will be very glad to be notified at Twitter or TradingView accounts at: @XeL_Arjona

Klinger Volume Oscillator (KVO) The Klinger Oscillator (KO) was developed by Stephen J. Klinger. Learning
from prior research on volume by such well-known technicians as Joseph Granville,
Larry Williams, and Marc Chaikin, Mr. Klinger set out to develop a volume-based
indicator to help in both short- and long-term analysis.
The KO was developed with two seemingly opposite goals in mind: to be sensitive
enough to signal short-term tops and bottoms, yet accurate enough to reflect the
long-term flow of money into and out of a security.
The KO is based on the following tenets:
Price range (i.e. High - Low) is a measure of movement and volume is the force behind
the movement. The sum of High + Low + Close defines a trend. Accumulation occurs when
today's sum is greater than the previous day's. Conversely, distribution occurs when
today's sum is less than the previous day's. When the sums are equal, the existing trend
is maintained.
Volume produces continuous intra-day changes in price reflecting buying and selling pressure.
The KO quantifies the difference between the number of shares being accumulated and distributed
each day as "volume force". A strong, rising volume force should accompany an uptrend and then
gradually contract over time during the latter stages of the uptrend and the early stages of
the following downtrend. This should be followed by a rising volume force reflecting some
accumulation before a bottom develops.

Volume Accumulation Oscillator (VAO)The Volume Accumulation Oscillator (VAO) is a powerful momentum-based indicator designed to assess the strength of volume accumulation in a given asset. It helps traders identify periods of intense buying or selling pressure and potential trend reversals.
The VAO calculates the Net Volume Accumulation (NVA) by considering the volume, open, close, high, and low prices. It then applies exponential moving averages (EMAs) to smooth the NVA and calculates the VAO by comparing the smoothed NVA with its EMA over a specified signal period.
The VAO is plotted as a line chart, providing a clear visual representation of its values. Positive VAO values indicate strong bullish volume accumulation, suggesting potential upward price movement. Conversely, negative VAO values indicate significant selling pressure and the possibility of a downtrend.
To enhance the analysis, the indicator includes reference levels such as the zero line and +/-1 levels. These levels serve as important reference points for interpreting the VAO values and identifying key turning points in the market.
Additionally, the VAO histogram is included, which further illustrates the strength and direction of volume accumulation. The histogram bars are color-coded, with green bars representing positive VAO values and red bars representing negative VAO values.
The Volume Accumulation Oscillator is a versatile tool that can be used in various trading strategies. Traders can look for divergences between the VAO and the price chart to identify potential trend reversals. Combining the VAO with other technical analysis techniques can provide valuable insights into market dynamics and help traders make informed trading decisions.
Note: It is recommended to customize the indicator's parameters and conduct thorough backtesting to align it with your specific trading strategy and preferences before using it for live trading.
Disclaimer: This indicator is provided for educational and informational purposes only. Trading involves risks, and it is important to exercise caution and conduct your own analysis before making any investment decisions.

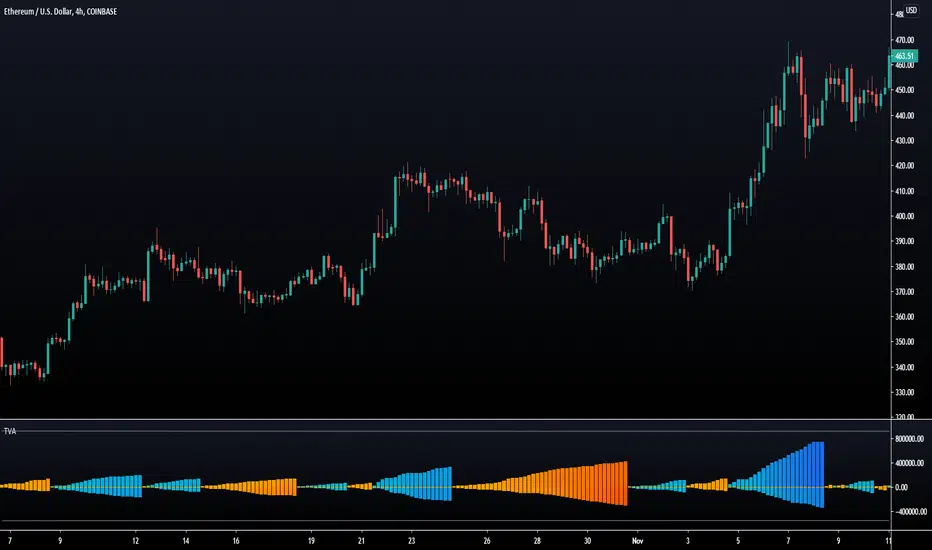
Trend Volume Accumulations [LuxAlgo]Deeply inspired by the Weiss wave indicator, the following indicator aims to return the accumulations of rising and declining volume of a specific trend. Positive waves are constructed using rising volume while negative waves are using declining volume.
The trend is determined by the sign of the rise of a rolling linear regression.
Settings
Length : Period of the indicator.
Src : Source of the indicator.
Linearity : Allows the output of the indicator to look more linear.
Mult : the multiplicative factor of both the upper and lower levels
Gradient : Use a gradient as color for the waves, true by default.
Usages
The trend volume accumulations (TVA) indicator allows determining the current price trend while taking into account volume, with blue colors representing an uptrend and red colors representing a downtrend.
The first motivation behind this indicator was to see if movements mostly made of declining volume were different from ones made of rising volume.
Waves of low amplitude represent movements with low trading activity.
Using higher values of Linearity allows giving less importance to individual volumes values, thus returning more linear waves as a result.
The indicator includes two levels, the upper one is derived from the cumulative mean of the waves based on rising volume, while the lower one is based on the cumulative mean of the waves based on declining volume, when a wave reaches a level we can expect the current trend to reverse. You can use different values of mult to control the distance from 0 of each level.
Lakshmi - Low Volatility Range Breakout (LVRB)⚡️ Overview
The Low Volatility Range Breakout (LVRB) indicator is designed to identify consolidation phases characterized by suppressed volatility and generate actionable signals when price breaks out of these ranges. The underlying premise is rooted in the market principle that periods of low volatility often precede significant directional moves—volatility contraction leads to expansion.
Important Note on Optimization: The default parameter settings of this indicator have been specifically optimized for BTCUSDT on the 2-hour (2H) timeframe. While the indicator can be applied to other instruments and timeframes, users are encouraged to adjust the parameters accordingly to suit different trading conditions and asset characteristics.
This indicator automates the detection of "quiet" accumulation/distribution zones and provides clear visual cues and alerts when a breakout occurs.
⚡️ How to Use
1. Add the indicator to your chart. Default settings are optimized for BTCUSDT 2H.
2. Wait for a gray box to appear—this indicates a qualified low-volatility range is forming.
3. Monitor for breakout signals:
• LONG (green triangle below bar): Price broke above the range. Consider entering a long position.
• SHORT (red triangle above bar): Price broke below the range. Consider entering a short position.
4. Set alerts using "LVRB LONG" or "LVRB SHORT" to receive notifications on confirmed breakouts.
5. Adjust parameters as needed for different instruments or timeframes.
Tip: Combine with volume analysis or trend filters for higher-probability setups.
⚡️ How It Works
1. Low Volatility Bar Detection
A bar is classified as "low volatility" when it meets the following criteria:
• True Range (TR) is at or below the average TR (Simple Moving Average) multiplied by a user-defined threshold.
• (Optional) Candle Body is at or below the average body size multiplied by a separate threshold.
This dual-filter approach helps isolate bars that exhibit genuine compression in both range and directional commitment.
2. Range Box Formation
When consecutive low-volatility bars are detected, the indicator begins constructing a consolidation box:
• The box expands to encompass the high and low of qualifying bars.
• A minimum number of bars and a minimum fraction of low-volatility bars are required for the box to become "qualified" (active).
• A configurable tolerance allows for a limited number of consecutive non-low-vol bars within the sequence, accommodating minor noise without invalidating the range.
• If the box height exceeds a maximum threshold (defined as a multiple of the base ATR at sequence start), the range is invalidated.
3. Breakout Detection
Once a qualified range is established, the indicator monitors for breakouts:
• Wick Mode: Requires both a wick pierce beyond the range boundary AND a close outside the range.
• Close Mode: Requires only a close beyond the range boundary.
• (Optional) Breakout Body Filter: The breakout candle's body must exceed a multiple of the average body size at range formation.
• (Optional) Candle Direction Filter: Bullish breakouts require a green candle; bearish breakouts require a red candle.
Signals are displayed in real-time and confirmed upon bar close.
⚡️ Inputs & Parameters
• Volatility Window: Lookback period for calculating average TR and average body size.
• TR Multiplier: A bar's TR must be ≤ avgTR × this value to qualify as low-vol.
• Body Multiplier: A bar's body must be ≤ avgBody × this value (if body filter is enabled).
• Use Body Filter: Toggle the body size filter on/off.
• Min Bars in Box: Minimum number of bars required for a range to become qualified.
• Min Low-Vol Fraction: Minimum proportion of bars in the sequence that must be low-vol.
• Allowed Consecutive Non-Low-Vol Bars: Tolerance for consecutive bars that do not meet low-vol criteria.
• Max Box Height: Maximum allowed range height as a multiple of the base ATR.
• Breakout Mode: Choose between "Wick" (pierce + close) or "Close" (close only).
• Breakout Body Multiplier: Require breakout candle body ≥ avgBody × this value (1.0 = OFF).
• Require Candle Direction: Enforce green candle for LONG, red candle for SHORT.
⚡️ Visual Features
• Consolidation Boxes: Displayed in neutral (gray) color during formation. Upon a confirmed breakout, the box is colored green for bullish breakouts or red for bearish breakouts.
• Breakout Signals:
• LONG: Green upward triangle displayed below the price bar with "LONG" label.
• SHORT: Red downward triangle displayed above the price bar with "SHORT" label.
• Range Levels: Optional horizontal plots for the active range's high and low.
• Invalidated Boxes: Optionally retained in neutral (gray) color or deleted from the chart.
• Full Customization: Colors, transparency, and border width are all adjustable.
⚡️ Alerts
Two alert conditions are available:
• LVRB LONG: Triggered on a confirmed bullish breakout (bar close).
• LVRB SHORT: Triggered on a confirmed bearish breakout (bar close).
⚡️ Use Cases
• Breakout Trading: Enter positions when price escapes a well-defined low-volatility range.
• Volatility Expansion Plays: Anticipate increased volatility following periods of compression.
• Filtering Choppy Markets: Avoid trading during extended consolidation; wait for confirmed breakouts.
• Multi-Timeframe Analysis: Use on higher timeframes to identify major consolidation zones.
⚡️ Notes
• Best used in conjunction with volume analysis, trend context, or support/resistance levels for confirmation.
• Performance varies across instruments and timeframes; backtesting and parameter optimization are recommended.
⚡️ Credits
Developed by Lakshmi. Inspired by volatility contraction principles and range breakout methodologies.
⚡️ Disclaimer
This indicator is provided for educational and informational purposes only. It does not constitute financial advice, investment recommendations, or a guarantee of profits. Trading financial instruments involves substantial risk, and you may lose more than your initial investment. Past performance, whether indicated by backtesting or historical analysis, does not guarantee future results. The use of this indicator does not ensure or promise any profits or protection against losses. Users are solely responsible for their own trading decisions and should conduct their own research and/or consult with a qualified financial advisor before making any investment decisions. By using this indicator, you acknowledge and accept that you bear full responsibility for any trading outcomes.

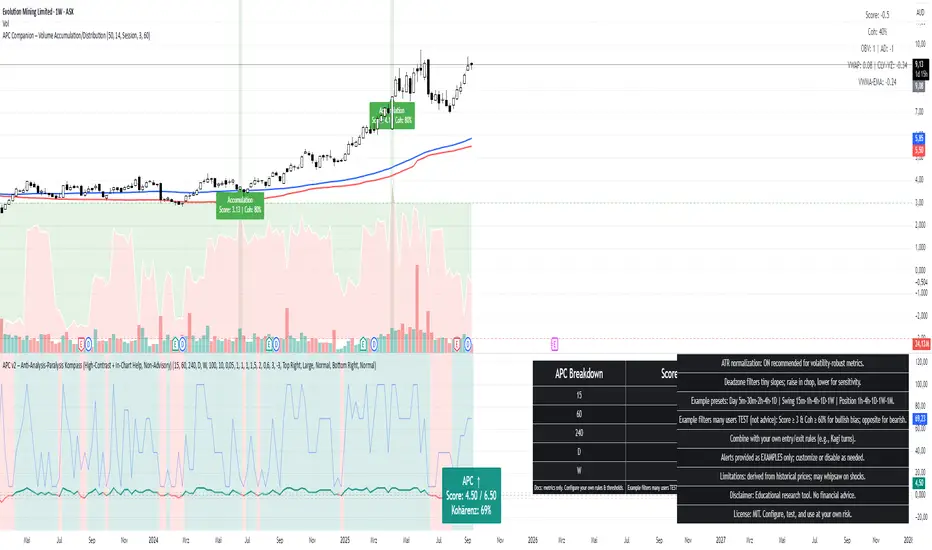
APC Companion – Volume Accumulation/DistributionIndicator Description (TradingView – Open Source)
APC Companion – Volume Accumulation/Distribution Filter
(Designed to work standalone or together with the APC Compass)
What this indicator does
The APC Companion measures whether markets are under Accumulation (buying pressure) or Distribution (selling pressure) by combining:
Chaikin A/D slope – volume flow into price moves
On-Balance Volume momentum – confirms trend strength
VWAP spread – price vs. fair value by traded volume
CLV × Volume Z-Score – detects intrabar absorption / selling pressure
VWMA vs. EMA100 – confirms whether weighted volume supports price action
The result is a single Acc/Dist Score (−5 … +5) and a Coherence % showing how many signals agree.
How to interpret
Score ≥ +3 & Coherence ≥ 60% → Accumulation (green) → market supported by buyers
Score ≤ −3 & Coherence ≥ 60% → Distribution (red) → market pressured by sellers
Anything in between = neutral (no strong bias)
Using with APC Compass
Long trades: Only take Compass Long signals when Companion shows Accumulation.
Short trades: Only take Compass Short signals when Companion shows Distribution.
Neutral Companion: Skip or reduce size if there is no confirmation.
This filter greatly reduces false signals and improves trade quality.
Best practice
Swing trading: 4H / 1D charts, lenZ 40–80, lenSlope 14–20
Intraday: 5m–30m charts, lenZ 20–30, lenSlope 10–14
Position sizing: Increase with higher Coherence %, reduce when below 60%
Exits: Reduce or close if Score drops back to neutral or flips opposite
Disclaimer
This script is published open source for educational purposes only.
It is not financial advice. Test thoroughly before using in live trading.
Exchanges Combined Volume📊 Exchanges Combined Volume
(Aggregated Multi-Exchange Volume: Binance, OKX, Bybit, etc.) by BIGTAKER*
🔍 Purpose
The Exchanges Combined Volume indicator aggregates real-time trading volumes from multiple global exchanges for a specific asset (e.g., a cryptocurrency).
Instead of relying on a single market, it provides a broader view of market activity, helping users detect abnormal volume behavior and increased participation across the entire market.
⚙️ Supported Exchanges
* USDT Markets
`Binance`, `OKX`, `Bybit`, `Bitget`, `Gate.io`
* USD Markets
`Coinbase`, `Bitfinex`, `Bitstamp`
* Default
Includes the current chart symbol’s native volume by default.
🧮 Core Calculation Logic
1. 📛 Symbol Normalization (cleanSymbol)
Prefixes such as `1000`, `10000`, `100000`, or `1M` (common in leveraged tickers) are automatically removed to extract the base token.
> Example:
> `1000PEPEUSDT` → `PEPEUSDT`
2. 📈 Volume Requests from External Exchanges
Volume is retrieved using the `` format (e.g., `'BINANCE:PEPEUSDT'`, `'COINBASE:BTCUSD'`).
Invalid or delisted pairs are safely ignored using `ignore_invalid_symbol=true`.
3. 📊 Total Volume Calculation
totalVolume = usdtVolume + usdVolume + currentSymbolVolume
The indicator sums the volume from all target exchanges plus the volume from the current chart symbol.
4. 📏 Comparison to Average Volume
* Period: `length = 60` (Simple Moving Average over 60 candles)
* A candle is considered **high-intensity** if:
5. 🎨 Visual Styling
| Condition | Color | Meaning |
| -------------------------- | --------------------- | ----------------------- |
| High-volume Bullish Candle | Light Green (#30db78) | Strong Buying Activity |
| High-volume Bearish Candle | Bright Red (#ff0000) | Strong Selling Activity |
| Normal Bullish Candle | Dark Green (#3c7058) | Regular Buying Volume |
| Normal Bearish Candle | Dark Red (#682e2c) | Regular Selling Volume |
📌 Use Cases
* Detect synchronized volume surges across major global exchanges.
* Identify pre-pump accumulation phases on altcoins.
* Combine with premium gap indicators (e.g., Kimchi Premium) to identify leading market sentiment.
* Confirm breakout momentum with multi-exchange volume validation.
📘 Notes & Warnings
* Listing differences across exchanges may result in **zero volume** on some platforms.
* Prefixes like `1000`, `1M`, etc., are automatically removed to **improve symbol matching accuracy**.
* As volume units are not standardized, this indicator is best suited for **absolute value analysis**, not ratio-based comparisons.

Farley's Accumulation-Distribution Accelerator (ADA)Farley's ADA (From The Master Swing Trader)
What it is :
ADA is designed to track volume oscillations in the market and reduce the impact of shock events.
It observes the supply-demand dynamics within the market, which can trigger natural levels of price reversals.
How It Works
Volume and Price Relationship: ADA measures the lag between price and volume movements. It highlights when volume leads or lags behind price changes, helping traders identify potential reversals or trends.
Signal Generation: ADA can generate faster and cleaner signals compared to traditional indicators like On-Balance Volume (OBV).
Usage
Support and Resistance: ADA formations can help identify support and resistance levels and trendlines.
detect natural levels where price reversals might occur.
Trend Identification: Look for significant divergences between ADA and price action to identify potential trend reversals.
Volume Analysis: Use ADA to anticipate pauses in price movements when volume leads, and expect dynamic trends when ADA significantly moves ahead of price action.

Volume DockThis oscillator has two different modes:
The first one called RSIs is a comparison between the Relative strength index of the Accumulation/Distribution (and the On Balance Volume) and the normal price, to analyze the differences in momentum between the price with volume and without.
The second one, called Dock, is similar except for the fact that the lines are smoothed using the hull moving average formula, this mode is great to signal entries and for reversal analyzing.
