16. SMC Strategy with SL - low TimeframeOverview
The "SMC Strategy with SL - low Timeframe" is a comprehensive trading strategy that uses key concepts from Smart Money Theory to identify favorable areas in the market for buying or selling. This strategy takes advantage of price imbalances, support and resistance zones, and swing highs/lows to generate high-probability trade signals.
The key features of this strategy include:
Swing High/Low Analysis: Used to determine the Premium, Equilibrium, and Discount Zones.
Order Block Integration: An added layer of confluence to identify valid buy and sell signals.
Trend Direction Confirmation: Using a Simple Moving Average (SMA) to determine the overall trend.
Entry and Exit Rules: Based on price position relative to key zones and moving average, along with optional stop-loss and take-profit levels.
Detailed Description
Swing High and Swing Low Analysis
The script calculates Swing High and Swing Low based on the most recent price highs and lows over a specified look-back period (swingHighLength and swingLowLength, set to 8 by default).
It then derives the Premium, Equilibrium, and Discount Zones:
Premium Zone: Represents potential resistance, calculated based on recent swing highs.
Discount Zone: Represents potential support, calculated based on recent swing lows.
Equilibrium: The midpoint between Swing High and Swing Low, dividing the price range into Premium (above equilibrium) and Discount (below equilibrium) areas.
Zone Visualization
The strategy plots the Premium Zone (resistance) in red, the Discount Zone (support) in green, and the Equilibrium level in blue on the chart. This helps visually assess the current price relative to these important areas.
Simple Moving Average (SMA)
A 50-period Simple Moving Average (SMA) is added to help identify the trend direction.
Buy signals are valid only if the price is above the SMA, indicating an uptrend.
Sell signals are valid only if the price is below the SMA, indicating a downtrend.
Entry Rules
The script generates buy or sell signals when certain conditions are met:
A buy signal is triggered when:
Price is below the Equilibrium and within the Discount Zone.
Price is above the SMA.
The buy signal is further confirmed by the presence of an Order Block (recent lowest price area).
A sell signal is triggered when:
Price is above the Equilibrium and within the Premium Zone.
Price is below the SMA.
The sell signal is further confirmed by the presence of an Order Block (recent highest price area).
Order Block
The strategy defines Order Blocks as recent highs and lows within a look-back period (orderBlockLength set to 20 by default).
These blocks represent areas where large players (smart money) have historically been active, increasing the probability of the price reacting in these areas again.
Trade Management and Trade Direction
The user can set Trade Direction to either "Long Only," "Short Only," or "Both." This allows the strategy to adapt based on market conditions or trading preferences.
Based on the Trade Direction, the strategy either:
Closes open trades that are against new signals.
Allows only specific directional trades (either long or short).
Stop-loss levels are defined based on a fixed percentage (stop_loss_percent), which helps to manage risk and minimize losses.
Exit Rules
The strategy uses stop-loss levels for risk management.
A stop-loss price is set at a fixed percentage below the entry price for long positions or above the entry price for short positions.
When the price hits the defined stop-loss level, the trade is closed.
Liquidity Zones
The script identifies recent Swing Highs and Lows as potential liquidity zones. These are levels where price could react strongly, as they represent areas of interest for large traders.
The liquidity zones are plotted as crosses on the chart, marking areas where price may encounter significant buying or selling pressure.
Visual Feedback
The script uses visual markers (green for buy signals and red for sell signals) to indicate potential entries on the chart.
It also plots liquidity zones to help traders identify areas where stop hunts and liquidity grabs might occur.
Monthly Performance Dashboard
The script includes a performance tracking feature that displays monthly profit and loss metrics on the chart.
This dashboard allows the trader to see a visual representation of trading performance over time, providing insights into profitability and consistency.
The table shows profit or loss for each month and year, allowing the user to track the overall success of the strategy.
Key Benefits
Smart Money Concepts (SMC): This strategy incorporates SMC principles like order blocks and liquidity zones, which are used by institutional traders to determine potential market moves.
Zone Analysis: The use of Premium, Discount, and Equilibrium zones provides a solid framework for determining where to enter and exit trades based on price discounts or premiums.
Confluence: Signals are not taken in isolation. They are confirmed by factors like trend direction (SMA) and order blocks, providing greater trade accuracy.
Risk Management: By integrating stop-loss functionality, traders can manage their risks effectively.
Visual Performance Metrics: The monthly and yearly performance dashboard gives valuable feedback on how well the strategy has performed historically.
Practical Use
Buy in Discount Zone: Traders would be looking to buy when the price is discounted relative to its recent range and is above the SMA, indicating an overall uptrend.
Sell in Premium Zone: Conversely, traders would be looking to sell when the price is at a premium relative to its recent range and below the SMA, indicating an overall downtrend.
Order Block Confirmation: Ensures that buying or selling is supported by historical price behavior at significant levels, providing confidence that the market is likely to react at these areas.
This strategy is designed to help traders take advantage of price inefficiencies and areas where institutional traders are likely to be active, increasing the odds of successful trades. By leveraging Smart Money concepts and strong technical confluence, it aims to provide high-probability trade setups.
Cerca negli script per "accuracy"

QuantifyPS - 1Library "QuantifyPS"
normdist(z)
Parameters:
z (float) : (float): The z-score for which the CDF is to be calculated.
Returns: (float): The cumulative probability corresponding to the input z-score.
Notes:
- Uses an approximation method for the normal distribution CDF, which is computationally efficient.
- The result is accurate for most practical purposes but may have minor deviations for extreme values of `z`.
Formula:
- Based on the approximation formula:
`Φ(z) ≈ 1 - f(z) * P(t)` if `z > 0`, otherwise `Φ(z) ≈ f(z) * P(t)`,
where:
`f(z) = 0.3989423 * exp(-z^2 / 2)` (PDF of standard normal distribution)
`P(t) = Σ [c * t^i]` with constants `c` and `t = 1 / (1 + 0.2316419 * |z|)`.
Implementation details:
- The approximation uses five coefficients for the polynomial part of the CDF.
- Handles both positive and negative values of `z` symmetrically.
Constants:
- The coefficients and scaling factors are chosen to minimize approximation errors.
gamma(x)
Parameters:
x (float) : (float): The input value for which the Gamma function is to be calculated.
Must be greater than 0. For x <= 0, the function returns `na` as it is undefined.
Returns: (float): Approximation of the Gamma function for the input `x`.
Notes:
- The Lanczos approximation provides a numerically stable and efficient method to compute the Gamma function.
- The function is not defined for `x <= 0` and will return `na` in such cases.
- Uses precomputed Lanczos coefficients for accuracy.
- Includes handling for small numerical inaccuracies.
Formula:
- The Gamma function is approximated as:
`Γ(x) ≈ sqrt(2π) * t^(x + 0.5) * e^(-t) * Σ(p / (x + k))`
where `t = x + g + 0.5` and `p` is the array of Lanczos coefficients.
Implementation details:
- Lanczos coefficients (`p`) are precomputed and stored in an array.
- The summation iterates over these coefficients to compute the final result.
- The constant `g` controls the precision of the approximation (commonly `g = 7`).
t_cdf(t, df)
Parameters:
t (float) : (float): The t-statistic for which the CDF value is to be calculated.
df (int) : (int): Degrees of freedom of the t-distribution.
Returns: (float): Approximate CDF value for the given t-statistic.
Notes:
- This function computes a one-tailed p-value.
- Relies on an approximation formula using gamma functions and standard t-distribution properties.
- May not be as accurate as specialized statistical libraries for extreme values or very high degrees of freedom.
Formula:
- Let `x = df / (t^2 + df)`.
- The approximation formula is derived using:
`CDF(t, df) ≈ 1 - * x^((df + 1) / 2) / 2`,
where Γ represents the gamma function.
Implementation details:
- Computes the gamma ratio for normalization.
- Applies the t-distribution formula for one-tailed probabilities.
tStatForPValue(p, df)
Parameters:
p (float) : (float): P-value for which the t-statistic needs to be calculated.
Must be in the interval (0, 1).
df (int) : (int): Degrees of freedom of the t-distribution.
Returns: (float): The t-statistic corresponding to the given p-value.
Notes:
- If `p` is outside the interval (0, 1), the function returns `na` as an error.
- The function uses binary search with a fixed number of iterations and a defined tolerance.
- The result is accurate to within the specified tolerance (default: 0.0001).
- Relies on the cumulative density function (CDF) `t_cdf` for the t-distribution.
Formula:
- Uses the cumulative density function (CDF) of the t-distribution to iteratively find the t-statistic.
Implementation details:
- `low` and `high` define the search interval for the t-statistic.
- The midpoint (`mid`) is iteratively refined until the difference between the cumulative probability
and the target p-value is smaller than the tolerance.
jarqueBera(n, s, k)
Parameters:
n (float) : (series float): Number of observations in the dataset.
s (float) : (series float): Skewness of the dataset.
k (float) : (series float): Kurtosis of the dataset.
Returns: (float): The Jarque-Bera test statistic.
Formula:
JB = n *
Notes:
- A higher JB value suggests that the data deviates more from a normal distribution.
- The test is asymptotically distributed as a chi-squared distribution with 2 degrees of freedom.
- Use this value to calculate a p-value to determine the significance of the result.
skewness(data)
Parameters:
data (float) : (series float): Input data series.
Returns: (float): The skewness value.
Notes:
- Handles missing values (`na`) by ignoring invalid points.
- Includes error handling for zero variance to avoid division-by-zero scenarios.
- Skewness is calculated as the normalized third central moment of the data.
kurtosis(data)
Parameters:
data (float) : (series float): Input data series.
Returns: (float): The kurtosis value.
Notes:
- Handles missing values (`na`) by ignoring invalid points.
- Includes error handling for zero variance to avoid division-by-zero scenarios.
- Kurtosis is calculated as the normalized fourth central moment of the data.
regression(y, x, lag)
Parameters:
y (float) : (series float): Dependent series (observed values).
x (float) : (series float): Independent series (explanatory variable).
lag (int) : (int): Number of lags applied to the independent series (x).
Returns: (tuple): Returns a tuple containing the following values:
- n: Number of valid observations.
- alpha: Intercept of the regression line.
- beta: Slope of the regression line.
- t_stat: T-statistic for the beta coefficient.
- p_value: Two-tailed p-value for the beta coefficient.
- r_squared: Coefficient of determination (R²) indicating goodness of fit.
- skew: Skewness of the residuals.
- kurt: Kurtosis of the residuals.
Notes:
- Handles missing data (`na`) by ignoring invalid points.
- Includes basic error handling for zero variance and division-by-zero scenarios.
- Computes residual-based statistics (skewness and kurtosis) for model diagnostics.
ABCD Harmonic Pattern [TradingFinder] ABCD Pattern indicator🔵 Introduction
The ABCD harmonic pattern is a tool for identifying potential reversal zones (PRZ) by using Fibonacci ratios to pinpoint critical price reversal points on price charts.
This pattern consists of four key points, labeled A, B, C, and D. In this structure, the AB and CD waves move in the same direction, while the BC wave acts as a corrective wave in the opposite direction.
The ABCD pattern follows specific Fibonacci ratios that enhance its accuracy in identifying PRZ. Typically, point C lies within the 0.382 to 0.886 Fibonacci retracement of the AB wave, indicating the correction extent of the BC wave.
Subsequently, the CD wave, as the final wave in this pattern, reaches point D with a Fibonacci extension between 1.13 and 2.618 of the BC wave. Point D, which marks the PRZ, is where a potential price reversal is likely to occur.
The ABCD pattern appears in both bullish and bearish forms. In the bullish ABCD pattern, prices tend to increase at point D, which defines the PRZ; in the bearish ABCD pattern, prices typically decrease upon reaching the PRZ at point D.
These characteristics make the ABCD pattern a popular tool for identifying PRZ and price reversal points in financial markets, including forex, cryptocurrencies, and stocks.
Bullish Pattern :
Beaish Pattern :
🔵 How to Use
🟣 Bullish ABCD Pattern
The bullish ABCD pattern is another harmonic structure used to identify a potential reversal zone (PRZ) where the price is likely to rise after a downward movement. This pattern includes four main points A, B, C, and D. In the bullish ABCD, the AB and CD waves move downward, and the BC wave acts as a corrective, upward wave. This setup creates a PRZ at point D, where the price may reverse and move upward.
To identify a bullish ABCD pattern, begin with the downward AB wave. The BC wave retraces upward between 0.382 and 0.886 of the AB wave, indicating the extent of the correction.
After the BC retracement, the CD wave forms and extends from point C down to point D, with an extension of around 1.13 to 2.618 of the BC wave. Point D, as the PRZ, represents the area where the price may reverse upwards, making it a strategic level for potential buy positions.
When the price reaches point D in the bullish ABCD pattern, traders look for upward reversal signals. This can include bullish candlestick formations, such as hammer or morning star patterns, near the PRZ to confirm the trend reversal. Entering a long position after confirmation near point D provides a calculated entry point.
Additionally, placing a stop loss slightly below point D helps protect against potential loss if the reversal does not occur. The ABCD pattern, with its precise Fibonacci structure and PRZ identification, gives traders a disciplined approach to spotting bullish reversals in markets, particularly in forex, cryptocurrency, and stock trading.
Bullish Pattern in COINBASE:BTCUSD :
🟣 Bearish ABCD Pattern
The bearish ABCD pattern is a harmonic structure that indicates a potential reversal zone (PRZ) where price may shift downward after an initial upward movement. This pattern consists of four main points A, B, C, and D. In a bearish ABCD, the AB and CD waves move upward, while the BC wave acts as a corrective wave in the opposite, downward direction. This reversal zone (PRZ) can be identified with specific Fibonacci ratios.
To identify a bearish ABCD pattern, start by observing the AB wave, which forms as an upward price movement. The BC wave, which follows, typically retraces between 0.382 to 0.886 of the AB wave. This retracement indicates how far the correction goes and sets the foundation for the next wave.
Finally, the CD wave extends from point C to reach point D with a Fibonacci extension of approximately 1.13 to 2.618 of the BC wave. Point D represents the PRZ where the potential reversal may occur, making it a critical area for traders to consider short positions.
Once point D in the bearish ABCD pattern is reached, traders can anticipate a downward price movement. At this potential reversal zone (PRZ), traders often wait for additional bearish signals or candlestick patterns, such as engulfing or evening star formations, to confirm the price reversal.
This confirmation around the PRZ enhances the accuracy of the entry point for a bearish position. Setting a stop loss slightly above point D can help manage risk if the price doesn’t reverse as anticipated. The ABCD pattern, with its reliance on Fibonacci ratios and clearly defined points, offers a strategic approach for traders looking to capitalize on potential bearish reversals in financial markets, including forex, stocks, and cryptocurrencies.
Bearish Pattern in OANDA:XAUUSD :
🔵 Setting
🟣 Logical Setting
ZigZag Pivot Period : You can adjust the period so that the harmonic patterns are adjusted according to the pivot period you want. This factor is the most important parameter in pattern recognition.
Show Valid Forma t: If this parameter is on "On" mode, only patterns will be displayed that they have exact format and no noise can be seen in them. If "Off" is, the patterns displayed that maybe are noisy and do not exactly correspond to the original pattern.
Show Formation Last Pivot Confirm : if Turned on, you can see this ability of patterns when their last pivot is formed. If this feature is off, it will see the patterns as soon as they are formed. The advantage of this option being clear is less formation of fielded patterns, and it is accompanied by the latest pattern seeing and a sharp reduction in reward to risk.
Period of Formation Last Pivot : Using this parameter you can determine that the last pivot is based on Pivot period.
🟣 Genaral Setting
Show : Enter "On" to display the template and "Off" to not display the template.
Color : Enter the desired color to draw the pattern in this parameter.
LineWidth : You can enter the number 1 or numbers higher than one to adjust the thickness of the drawing lines. This number must be an integer and increases with increasing thickness.
LabelSize : You can adjust the size of the labels by using the "size.auto", "size.tiny", "size.smal", "size.normal", "size.large" or "size.huge" entries.
🟣 Alert Setting
Alert : On / Off
Message Frequency : This string parameter defines the announcement frequency. Choices include: "All" (activates the alert every time the function is called), "Once Per Bar" (activates the alert only on the first call within the bar), and "Once Per Bar Close" (the alert is activated only by a call at the last script execution of the real-time bar upon closing). The default setting is "Once per Bar".
Show Alert Time by Time Zone : The date, hour, and minute you receive in alert messages can be based on any time zone you choose. For example, if you want New York time, you should enter "UTC-4". This input is set to the time zone "UTC" by default.
🟣 Conclusion
The ABCD harmonic pattern offers a structured approach in technical analysis, helping traders accurately identify potential reversal zones (PRZ) where price movements may shift direction. By leveraging the relationships between points A, B, C, and D, alongside specific Fibonacci ratios, traders can better anticipate points of market reversal and make more informed decisions.
Both the bearish and bullish ABCD patterns enable traders to pinpoint ideal entry points that align with anticipated market shifts. In a bearish ABCD, point D within the PRZ often signals a downward trend reversal, while in a bullish ABCD, this same point typically suggests an upward reversal. The adaptability of the ABCD pattern across different markets, such as forex, stocks, and cryptocurrencies, further highlights its utility and reliability.
Integrating the ABCD pattern into a trading strategy provides a methodical and calculated approach to entry and exit decisions. With accurate application of Fibonacci ratios and confirmation of the PRZ, traders can enhance their trading precision, reduce risks, and boost overall performance. The ABCD harmonic pattern remains a valuable resource for traders aiming to leverage structured patterns for consistent results in their technical analysis.

ICT Setup 03 [TradingFinder] Judas Swing NY 9:30am + CHoCH/FVG🔵 Introduction
Judas Swing is an advanced trading setup designed to identify false price movements early in the trading day. This advanced trading strategy operates on the principle that major market players, or "smart money," drive price in a certain direction during the early hours to mislead smaller traders.
This deceptive movement attracts liquidity at specific levels, allowing larger players to execute primary trades in the opposite direction, ultimately causing the price to return to its true path.
The Judas Swing setup functions within two primary time frames, tailored separately for Forex and Stock markets. In the Forex market, the setup uses the 8:15 to 8:30 AM window to identify the high and low points, followed by the 8:30 to 8:45 AM frame to execute the Judas move and identify the CISD Level break, where Order Block and Fair Value Gap (FVG) zones are subsequently detected.
In the Stock market, these time frames shift to 9:15 to 9:30 AM for identifying highs and lows and 9:30 to 9:45 AM for executing the Judas move and CISD Level break.
Concepts such as Order Block and Fair Value Gap (FVG) are crucial in this setup. An Order Block represents a chart region with a high volume of buy or sell orders placed by major financial institutions, marking significant levels where price reacts.
Fair Value Gap (FVG) refers to areas where price has moved rapidly without balance between supply and demand, highlighting zones of potential price action and future liquidity.
Bullish Setup :
Bearish Setup :
🔵 How to Use
The Judas Swing setup enables traders to pinpoint entry and exit points by utilizing Order Block and FVG concepts, helping them align with liquidity-driven moves orchestrated by smart money. This setup applies two distinct time frames for Forex and Stocks to capture early deceptive movements, offering traders optimized entry or exit moments.
🟣 Bullish Setup
In the Bullish Judas Swing setup, the first step is to identify High and Low points within the initial time frame. These levels serve as key points where price may react, forming the basis for analyzing the setup and assisting traders in anticipating future market shifts.
In the second time frame, a critical stage of the bullish setup begins. During this phase, the price may create a false break or Fake Break below the low level, a deceptive move by major players to absorb liquidity. This false move often causes smaller traders to enter positions incorrectly. After this fake-out, the price reverses upward, breaking the CISD Level, a critical point in the market structure, signaling a potential bullish trend.
Upon breaking the CISD Level and reversing upward, the indicator identifies both the Order Block and Fair Value Gap (FVG). The Order Block is an area where major players typically place large buy orders, signaling potential price support. Meanwhile, the FVG marks a region of supply-demand imbalance, signaling areas where price might react.
Ultimately, after these key zones are identified, a trader may open a buy position if the price reaches one of these critical areas—Order Block or FVG—and reacts positively. Trading at these levels enhances the chance of success due to liquidity absorption and support from smart money, marking an opportune time for entering a long position.
🟣 Bearish Setup
In the Bearish Judas Swing setup, analysis begins with marking the High and Low levels in the initial time frame. These levels serve as key zones where price could react, helping to signal possible trend reversals. Identifying these levels is essential for locating significant bearish zones and positioning traders to capitalize on downward movements.
In the second time frame, the primary bearish setup unfolds. During this stage, price may exhibit a Fake Break above the high, causing a brief move upward and misleading smaller traders into incorrect positions. After this false move, the price typically returns downward, breaking the CISD Level—a crucial bearish trend indicator.
With the CISD Level broken and a bearish trend confirmed, the indicator identifies the Order Block and Fair Value Gap (FVG). The Bearish Order Block is a region where smart money places significant sell orders, prompting a negative price reaction. The FVG denotes an area of supply-demand imbalance, signifying potential selling pressure.
When the price reaches one of these critical areas—the Bearish Order Block or FVG—and reacts downward, a trader may initiate a sell position. Entering trades at these levels, due to increased selling pressure and liquidity absorption, offers traders an advantage in profiting from price declines.
🔵 Settings
Market : The indicator allows users to choose between Forex and Stocks, automatically adjusting the time frames for the "Opening Range" and "Trading Permit" accordingly: Forex: 8:15–8:30 AM for identifying High and Low points, and 8:30–8:45 AM for capturing the Judas move and CISD Level break. Stocks: 9:15–9:30 AM for identifying High and Low points, and 9:30–9:45 AM for executing the Judas move and CISD Level break.
Refine Order Block : Enables finer adjustments to Order Block levels for more accurate price responses.
Mitigation Level OB : Allows users to set specific reaction points within an Order Block, including: Proximal: Closest level to the current price. 50% OB: Midpoint of the Order Block. Distal: Farthest level from the current price.
FVG Filter : The Judas Swing indicator includes a filter for Fair Value Gap (FVG), allowing different filtering based on FVG width: FVG Filter Type: Can be set to "Very Aggressive," "Aggressive," "Defensive," or "Very Defensive." Higher defensiveness narrows the FVG width, focusing on narrower gaps.
Mitigation Level FVG : Like the Order Block, you can set price reaction levels for FVG with options such as Proximal, 50% OB, and Distal.
CISD : The Bar Back Check option enables traders to specify the number of past candles checked for identifying the CISD Level, enhancing CISD Level accuracy on the chart.
🔵 Conclusion
The Judas Swing indicator helps traders spot reliable trading opportunities by detecting false price movements and key levels such as Order Block and FVG. With a focus on early market movements, this tool allows traders to align with major market participants, selecting entry and exit points with greater precision, thereby reducing trading risks.
Its extensive customization options enable adjustments for various market types and trading conditions, giving traders the flexibility to optimize their strategies. Based on ICT techniques and liquidity analysis, this indicator can be highly effective for those seeking precision in their entry points.
Overall, Judas Swing empowers traders to capitalize on significant market movements by leveraging price volatility. Offering precise and dependable signals, this tool presents an excellent opportunity for enhancing trading accuracy and improving performance

Old Price OscillatorThe Old Price Oscillator (OPO) is a momentum indicator widely used by traders and analysts to gauge the direction and strength of price trends. It works by calculating the difference between two moving averages—a shorter-term moving average and a longer-term moving average—of a security’s price. This difference is plotted as an oscillating line, helping traders visualize the momentum and determine when price reversals or continuations might occur. Typically, when the oscillator value is positive, the price is trending upwards, suggesting potential buy signals; conversely, when the oscillator turns negative, it indicates downward momentum, which could signal a potential sell.
The OPO is similar to other oscillators, like the Moving Average Convergence Divergence (MACD), in that it uses moving averages to smooth out price fluctuations and clarify trends. Traders often customize the length of the short- and long-term moving averages to better suit specific assets or market conditions. Generally, this indicator is especially useful in markets that exhibit clear trends. However, it may generate false signals during sideways or highly volatile periods, so many traders combine the OPO with other technical indicators or filters to improve accuracy.
Moving Average Pullback Signals [UAlgo]The "Moving Average Pullback Signals " indicator is designed to identify potential trend continuation or reversal points based on moving average (MA) pullback patterns. This tool combines multiple types of moving averages, customized trend validation parameters, and candlestick wick patterns to provide reliable buy and sell signals. By leveraging several advanced MA methods (such as TEMA, DEMA, ZLSMA, and McGinley-D), this script can adapt to different market conditions, providing traders with flexibility and more precise trend-based entries and exits. The addition of a gradient color-coded moving average line and wick validation logic enables traders to visualize market sentiment and trend strength dynamically.
🔶 Key Features
Multiple Moving Average (MA) Calculation Methods: This indicator offers various MA calculation types, including SMA, EMA, DEMA, TEMA, ZLSMA, and McGinley-D, allowing traders to select the MA that best fits their strategy.
Trend Validation and Pattern Recognition: The indicator includes a customizable trend validation length, ensuring that the trend is consistent before buy/sell signals are generated. The "Trend Pattern Mode" setting provides flexibility between "No Trend in Progress," "Trend Continuation," and "Both," tailoring signals to the trader’s preferred style.
Wick Validation Logic: To enhance the accuracy of entries, this indicator identifies specific wick patterns for bullish or bearish pullbacks, which signal potential trend continuation or reversal. Wick length and validation factor are adjustable to suit various market conditions and timeframes.
Gradient Color-coded MA Line: This feature provides a quick visual cue for trend strength, with color changes reflecting relative highs and lows of the MA, enhancing market sentiment interpretation.
Alerts for Buy and Sell Signals: Alerts are triggered when either a bullish or bearish pullback is detected, allowing traders to receive instant notifications without continuously monitoring the chart.
Visual Labels for Reversal Points: The indicator plots labels ("R") at potential reversal points, with color-coded labels for bullish (green) and bearish (red) pullbacks, highlighting pullback opportunities that align with the trend or reversal potential.
🔶 Disclaimer
Use with Caution: This indicator is provided for educational and informational purposes only and should not be considered as financial advice. Users should exercise caution and perform their own analysis before making trading decisions based on the indicator's signals.
Not Financial Advice: The information provided by this indicator does not constitute financial advice, and the creator (UAlgo) shall not be held responsible for any trading losses incurred as a result of using this indicator.
Backtesting Recommended: Traders are encouraged to backtest the indicator thoroughly on historical data before using it in live trading to assess its performance and suitability for their trading strategies.
Risk Management: Trading involves inherent risks, and users should implement proper risk management strategies, including but not limited to stop-loss orders and position sizing, to mitigate potential losses.
No Guarantees: The accuracy and reliability of the indicator's signals cannot be guaranteed, as they are based on historical price data and past performance may not be indicative of future results.

Enhanced Market Analyzer with Adaptive Cognitive LearningThe "Enhanced Market Analyzer with Advanced Features and Adaptive Cognitive Learning" is an advanced, multi-dimensional trading indicator that leverages sophisticated algorithms to analyze market trends and generate predictive trading signals. This indicator is designed to merge traditional technical analysis with modern machine learning techniques, incorporating features such as adaptive learning, Monte Carlo simulations, and probabilistic modeling. It is ideal for traders who seek deeper market insights, adaptive strategies, and reliable buy/sell signals.
Key Features:
Adaptive Cognitive Learning:
Utilizes Monte Carlo simulations, reinforcement learning, and memory feedback to adapt to changing market conditions.
Adjusts the weighting and learning rate of signals dynamically to optimize predictions based on historical and real-time data.
Hybrid Technical Indicators:
Custom RSI Calculation: An RSI that adapts its length based on recursive learning and error adjustments, making it responsive to varying market conditions.
VIDYA with CMO Smoothing: An advanced moving average that incorporates Chander Momentum Oscillator for adaptive smoothing.
Hamming Windowed VWMA: A volume-weighted moving average that applies a Hamming window for smoother calculations.
FRAMA: A fractal adaptive moving average that responds dynamically to price movements.
Advanced Statistical Analysis:
Skewness and Kurtosis: Provides insights into the distribution and potential risk of market trends.
Z-Score Calculations: Identifies extreme market conditions and adjusts trading thresholds dynamically.
Probabilistic Monte Carlo Simulation:
Runs thousands of simulations to assess potential price movements based on momentum, volatility, and volume factors.
Integrates the results into a probabilistic signal that informs trading decisions.
Feature Extraction:
Calculates a variety of market metrics, including price change, momentum, volatility, volume change, and ATR.
Normalizes and adapts these features for use in machine learning algorithms, enhancing signal accuracy.
Ensemble Learning:
Combines signals from different technical indicators, such as RSI, MACD, Bollinger Bands, Stochastic Oscillator, and statistical features.
Weights each signal based on cumulative performance and learning feedback to create a robust ensemble signal.
Recursive Memory and Feedback:
Stores and averages past RSI calculations in a memory array to provide historical context and improve future predictions.
Adaptive memory factor adjusts the influence of past data based on current market conditions.
Multi-Factor Dynamic Length Calculation:
Determines the length of moving averages based on volume, volatility, momentum, and rate of change (ROC).
Adapts to various market conditions, ensuring that the indicator is responsive to both high and low volatility environments.
Adaptive Learning Rate:
The learning rate can be adjusted based on market volatility, allowing the system to adapt its speed of learning and sensitivity to changes.
Enhances the system's ability to react to different market regimes.
Monte Carlo Simulation Engine:
Simulates thousands of random outcomes to model potential future price movements.
Weights and aggregates these simulations to produce a final probabilistic signal, providing a comprehensive risk assessment.
RSI with Dynamic Adjustments:
The initial RSI length is adjusted recursively based on calculated errors between true RSI and predicted RSI.
The adaptive RSI calculation ensures that the indicator remains effective across various market phases.
Hybrid Moving Averages:
Short-Term and Long-Term Averages: Combines FRAMA, VIDYA, and Hamming VWMA with specific weights for a unique hybrid moving average.
Weighted Gradient: Applies a color gradient to indicate trend strength and direction, improving visual clarity.
Signal Generation:
Generates buy and sell signals based on the ensemble model and multi-factor analysis.
Uses percentile-based thresholds to determine overbought and oversold conditions, factoring in historical data for context.
Optional settings to enable adaptation to volume and volatility, ensuring the indicator remains effective under different market conditions.
Monte Carlo and Learning Parameters:
Users can customize the number of Monte Carlo simulations, learning rate, memory factor, and reward decay for tailored performance.
Applications:
Scalping and Day Trading:
The fast response of the adaptive RSI and ensemble learning model makes this indicator suitable for short-term trading strategies.
Swing Trading:
The combination of long-term moving averages and probabilistic models provides reliable signals for medium-term trends.
Volatility Analysis:
The ATR, Bollinger Bands, and adaptive moving averages offer insights into market volatility, helping traders adjust their strategies accordingly.
PDF Smoothed Moving Average [BackQuant]PDF Smoothed Moving Average
Introducing BackQuant’s PDF Smoothed Moving Average (PDF-MA) — an innovative trading indicator that applies Probability Density Function (PDF) weighting to moving averages, creating a unique, trend-following tool that offers adaptive smoothing to price movements. This advanced indicator gives traders an edge by blending PDF-weighted values with conventional moving averages, helping to capture trend shifts with enhanced clarity.
Core Concept: Probability Density Function (PDF) Smoothing
The Probability Density Function (PDF) provides a mathematical approach to applying adaptive weighting to data points based on a specified variance and mean. In the PDF-MA indicator, the PDF function is used to weight price data, adding a layer of probabilistic smoothing that enhances the detection of trend strength while reducing noise.
The PDF weights are controlled by two key parameters:
Variance: Determines the spread of the weights, where higher values spread out the weighting effect, providing broader smoothing.
Mean : Centers the weights around a particular price value, influencing the trend’s directionality and sensitivity.
These PDF weights are applied to each price point over the chosen period, creating an adaptive and smooth moving average that more closely reflects the underlying price trend.
Blending PDF with Standard Moving Averages
To further improve the PDF-MA, this indicator combines the PDF-weighted average with a traditional moving average, selected by the user as either an Exponential Moving Average (EMA) or Simple Moving Average (SMA). This blended approach leverages the strengths of each method: the responsiveness of PDF smoothing and the robustness of conventional moving averages.
Smoothing Method: Traders can choose between EMA and SMA for the additional moving average layer. The EMA is more responsive to recent prices, while the SMA provides a consistent average across the selected period.
Smoothing Period: Controls the length of the lookback period, affecting how sensitive the average is to price changes.
The result is a PDF-MA that provides a reliable trend line, reflecting both the PDF weighting and traditional moving average values, ideal for use in trend-following and momentum-based strategies.
Trend Detection and Candle Coloring
The PDF-MA includes a built-in trend detection feature that dynamically colors candles based on the direction of the smoothed moving average:
Uptrend: When the PDF-MA value is increasing, the trend is considered bullish, and candles are colored green, indicating potential buying conditions.
Downtrend: When the PDF-MA value is decreasing, the trend is considered bearish, and candles are colored red, signaling potential selling or shorting conditions.
These color-coded candles provide a quick visual reference for the trend direction, helping traders make real-time decisions based on the current market trend.
Customization and Visualization Options
This indicator offers a range of customization options, allowing traders to tailor it to their specific preferences and trading environment:
Price Source : Choose the price data for calculation, with options like close, open, high, low, or HLC3.
Variance and Mean : Fine-tune the PDF weighting parameters to control the indicator’s sensitivity and responsiveness to price data.
Smoothing Method : Select either EMA or SMA to customize the conventional moving average layer used in conjunction with the PDF.
Smoothing Period : Set the lookback period for the moving average, with a longer period providing more stability and a shorter period offering greater sensitivity.
Candle Coloring : Enable or disable candle coloring based on trend direction, providing additional clarity in identifying bullish and bearish phases.
Trading Applications
The PDF Smoothed Moving Average can be applied across various trading strategies and timeframes:
Trend Following : By smoothing price data with PDF weighting, this indicator helps traders identify long-term trends while filtering out short-term noise.
Reversal Trading : The PDF-MA’s trend coloring feature can help pinpoint potential reversal points by showing shifts in the trend direction, allowing traders to enter or exit positions at optimal moments.
Swing Trading : The PDF-MA provides a clear trend line that swing traders can use to capture intermediate price moves, following the trend direction until it shifts.
Final Thoughts
The PDF Smoothed Moving Average is a highly adaptable indicator that combines probabilistic smoothing with traditional moving averages, providing a nuanced view of market trends. By integrating PDF-based weighting with the flexibility of EMA or SMA smoothing, this indicator offers traders an advanced tool for trend analysis that adapts to changing market conditions with reduced lag and increased accuracy.
Whether you’re trading trends, reversals, or swings, the PDF-MA offers valuable insights into the direction and strength of price movements, making it a versatile addition to any trading strategy.
DSL Strategy [DailyPanda]
Overview
The DSL Strategy by DailyPanda is a trading strategy that synergistically combines the idea from indicators to create a more robust and reliable trading tool. By integrating these indicators, the strategy enhances signal accuracy and provides traders with a comprehensive view of market trends and momentum shifts. This combination allows for better entry and exit points, improved risk management, and adaptability to various market conditions.
Combining ideas from indicators adds value by:
Enhancing Signal Confirmation : The strategy requires alignment between trend and momentum before generating trade signals, reducing false entries.
Improving Accuracy : By integrating price action with momentum analysis, the strategy captures more reliable trading opportunities.
Providing Comprehensive Market Insight : The combination offers a better perspective on the market, considering both the direction (trend) and the strength (momentum) of price movements.
How the Components Work Together
1. Trend Identification with DSL Indicator
Dynamic Signal Lines : Calculates upper and lower DSL lines based on a moving average (SMA) and dynamic thresholds derived from recent highs and lows with a specified offset. These lines adapt to market conditions, providing real-time trend insights.
ATR-Based Bands : Adds bands around the DSL lines using the Average True Range (ATR) multiplied by a width factor. These bands account for market volatility and help identify potential stop-loss levels.
Trend Confirmation : The relationship between the price, DSL lines, and bands determines the current trend. For example, if the price consistently stays above the upper DSL line, it indicates a bullish trend.
2. Momentum Analysis
RSI Calculation : Computes the RSI over a specified period to measure the speed and change of price movements.
Zero-Lag EMA (ZLEMA) : Applies a ZLEMA to the RSI to minimize lag and produce a more responsive oscillator.
DSL Application on Oscillator : Implements the DSL concept on the oscillator by calculating dynamic upper and lower levels. This helps identify overbought or oversold conditions more accurately.
Signal Generation : Detects crossovers between the oscillator and its DSL lines. A crossover above the lower DSL line signals potential bullish momentum, while a crossover below the upper DSL line signals potential bearish momentum.
3. Integrated Signal Filtering
Confluence Requirement : A trade signal is generated only when both the DSL indicator and oscillator agree. For instance, a long entry requires both an uptrend confirmation from the DSL indicator and a bullish momentum signal from the oscillator.
Risk Management Integration : The strategy uses the DSL indicator's bands for setting stop-loss levels and calculates take-profit levels based on a user-defined risk-reward ratio. This ensures that every trade has a predefined risk management plan.
--------------------------------------------------------------------------------------------
Originality and Value Added to the Community
Unique Synergy : While both indicators are available individually, this strategy is original in how it combines them to enhance their strengths and mitigate their weaknesses, offering a novel approach not present in existing scripts.
Enhanced Reliability : By requiring confirmation from both trend and momentum indicators, the strategy reduces false signals and increases the likelihood of successful trades.
Versatility : The customizable parameters allow traders to adapt the strategy to different instruments, timeframes, and trading styles, making it a valuable tool for a wide range of trading scenarios.
Educational Contribution : The script demonstrates an effective method of combining indicators for improved trading performance, providing insights that other traders can learn from and apply to their own strategies.
--------------------------------------------------------------------------------------------
How to Use the Strategy
Adding the Strategy to Your Chart
Apply the DSL Strategy to your desired trading instrument and timeframe on TradingView.
--------------------------------------------------------------------------------------------
Configuring Parameters
DSL Indicator Settings :
Length (len) : Adjusts the sensitivity of the DSL lines (default is 34).
Offset : Determines the look-back period for threshold calculations (default is 30).
Bands Width (width) : Changes the distance of the ATR-based bands from the DSL lines (default is 1).
DSL-BELUGA Oscillator Settings :
Beluga Length (len_beluga) : Sets the period for the RSI calculation in the oscillator (default is 10).
DSL Lines Mode (dsl_mode) : Chooses between "Fast" (more responsive) and "Slow" (smoother) modes for the oscillator's DSL lines.
Risk Management :
Risk Reward (risk_reward) : Defines your desired risk-reward ratio for calculating take-profit levels (default is 1.5).
--------------------------------------------------------------------------------------------
Interpreting Signals
Long Entry Conditions :
Trend Confirmation : Price is above the upper DSL line and the upper DSL band (dsl_up1 > dsl_dn).
Price Behavior : The last three candles have both their opens and closes above the upper DSL line.
Momentum Signal : The DSL-BELUGA oscillator crosses above its lower DSL line (up_signal), indicating bullish momentum.
Short Entry Conditions :
Trend Confirmation : Price is below the lower DSL line and the lower DSL band (dsl_dn < dsl_up1).
Price Behavior : The last three candles have both their opens and closes below the lower DSL band.
Momentum Signal : The DSL-BELUGA oscillator crosses below its upper DSL line (dn_signal), indicating bearish momentum.
Exit Conditions :
Stop-Loss : Automatically set at the DSL indicator's band level (upper band for longs, lower band for shorts).
Take-Profit : Calculated based on the risk-reward ratio and the initial risk determined by the stop-loss distance.
Visual Aids
Signal Arrows : Upward green arrows for long entries and downward blue arrows for short entries appear on the chart when conditions are met.
Stop-Loss and Take-Profit Lines : Red and green lines display the calculated stop-loss and take-profit levels for active trades.
Background Highlighting : The chart background subtly changes color to indicate when a signal has been generated.
Backtesting and Optimization
Use TradingView's strategy tester to backtest the strategy over historical data.
Adjust parameters to optimize performance for different instruments or market conditions.
Regularly review backtesting results to ensure the strategy remains effective.

RVI Crossover Strategy[Kopottaja]Overview of the RVI Crossover Strategy
Strategy Name: RVI Crossover Strategy
Purpose: The RVI Crossover Strategy is based on the crossover signals between the Relative Vigor Index (RVI) and its moving average signal line. This strategy aims to identify potential buy and sell signals by evaluating the market’s directional trend.
Key Indicator Features
Relative Vigor Index (RVI): This indicator measures the momentum of price changes over a specified period and helps identify the market’s current trend. The RVI is based on the idea that prices generally close higher than they open in an uptrend (and lower in a downtrend). The RVI helps provide an indication of the strength and direction of a trend.
Signal Line: A moving average (e.g., SMA) is applied to the RVI values, creating a "signal line." When the RVI crosses above or below this line, it signals a potential trading opportunity.
Calculations and Settings
Calculating the RVI: The RVI is calculated by comparing the difference between the close and open prices to the difference between high and low prices. This provides information about the direction and momentum of price movement:
RVI= Sum(SWMA(high−low))Sum(SWMA(close−open))
where SWMA is a smoothed weighted moving average over a specified period.
Signal Line Calculation: The RVI value is smoothed by applying a simple moving average (SMA) to create the signal line. This signal line helps filter crossover signals for improved accuracy.
Buy and Sell Conditions: Buy and sell conditions are identified based on crossovers between the RVI and its signal line.
Buy Signal: A buy condition is triggered when the RVI crosses above the signal line, provided that the "Bearish" condition (trend confirmation) is met.
Sell Signal: A sell condition occurs when the RVI crosses below the signal line, alongside the "Bullish" trend confirmation.
Volume-Weighted Moving Averages (VWMA): VWMA indicators are used to assess price-volume relationships over different timeframes:
Fast VWMA: A short-period volume-weighted moving average.
Slow VWMA: A longer-period volume-weighted moving average. These values are used to strengthen the buy and sell conditions by confirming trend directions (Bullish or Bearish).
Disclaimer: This is an educational and informational tool. Past performance is not indicative of future results. Always backtest before using in live markets
EMD Oscillator (Zeiierman)█ Overview
The Empirical Mode Decomposition (EMD) Oscillator is an advanced indicator designed to analyze market trends and cycles with high precision. It breaks down complex price data into simpler parts called Intrinsic Mode Functions (IMFs), allowing traders to see underlying patterns and trends that aren’t visible with traditional indicators. The result is a dynamic oscillator that provides insights into overbought and oversold conditions, as well as trend direction and strength. This indicator is suitable for all types of traders, from beginners to advanced, looking to gain deeper insights into market behavior.
█ How It Works
The core of this indicator is the Empirical Mode Decomposition (EMD) process, a method typically used in signal processing and advanced scientific fields. It works by breaking down price data into various “layers,” each representing different frequencies in the market’s movement. Imagine peeling layers off an onion: each layer (or IMF) reveals a different aspect of the price action.
⚪ Data Decomposition (Sifting): The indicator “sifts” through historical price data to detect natural oscillations within it. Each oscillation (or IMF) highlights a unique rhythm in price behavior, from rapid fluctuations to broader, slower trends.
⚪ Adaptive Signal Reconstruction: The EMD Oscillator allows traders to select specific IMFs for a custom signal reconstruction. This reconstructed signal provides a composite view of market behavior, showing both short-term cycles and long-term trends based on which IMFs are included.
⚪ Normalization: To make the oscillator easy to interpret, the reconstructed signal is scaled between -1 and 1. This normalization lets traders quickly spot overbought and oversold conditions, as well as trend direction, without worrying about the raw magnitude of price changes.
The indicator adapts to changing market conditions, making it effective for identifying real-time market cycles and potential turning points.
█ Key Calculations: The Math Behind the EMD Oscillator
The EMD Oscillator’s advanced nature lies in its high-level mathematical operations:
⚪ Intrinsic Mode Functions (IMFs)
IMFs are extracted from the data and act as the building blocks of this indicator. Each IMF is a unique oscillation within the price data, similar to how a band might be divided into treble, mid, and bass frequencies. In the EMD Oscillator:
Higher-Frequency IMFs: Represent short-term market “noise” and quick fluctuations.
Lower-Frequency IMFs: Capture broader market trends, showing more stable and long-term patterns.
⚪ Sifting Process: The Heart of EMD
The sifting process isolates each IMF by repeatedly separating and refining the data. Think of this as filtering water through finer and finer mesh sieves until only the clearest parts remain. Mathematically, it involves:
Extrema Detection: Finding all peaks and troughs (local maxima and minima) in the data.
Envelope Calculation: Smoothing these peaks and troughs into upper and lower envelopes using cubic spline interpolation (a method for creating smooth curves between data points).
Mean Removal: Calculating the average between these envelopes and subtracting it from the data to isolate one IMF. This process repeats until the IMF criteria are met, resulting in a clean oscillation without trend influences.
⚪ Spline Interpolation
The cubic spline interpolation is an advanced mathematical technique that allows smooth curves between points, which is essential for creating the upper and lower envelopes around each IMF. This interpolation solves a tridiagonal matrix (a specialized mathematical problem) to ensure that the envelopes align smoothly with the data’s natural oscillations.
To give a relatable example: imagine drawing a smooth line that passes through each peak and trough of a mountain range on a map. Spline interpolation ensures that line is as smooth and close to reality as possible. Achieving this in Pine Script is technically demanding and demonstrates a high level of mathematical coding.
⚪ Amplitude Normalization
To make the oscillator more readable, the final signal is scaled by its maximum amplitude. This amplitude normalization brings the oscillator into a range of -1 to 1, creating consistent signals regardless of price level or volatility.
█ Comparison with Other Signal Processing Methods
Unlike standard technical indicators that often rely on fixed parameters or pre-defined mathematical functions, the EMD adapts to the data itself, capturing natural cycles and irregularities in real-time. For example, if the market becomes more volatile, EMD adjusts automatically to reflect this without requiring parameter changes from the trader. In this way, it behaves more like a “smart” indicator, intuitively adapting to the market, unlike most traditional methods. EMD’s adaptive approach is akin to AI’s ability to learn from data, making it both resilient and robust in non-linear markets. This makes it a great alternative to methods that struggle in volatile environments, such as fixed-parameter oscillators or moving averages.
█ How to Use
Identify Market Cycles and Trends: Use the EMD Oscillator to spot market cycles that represent phases of buying or selling pressure. The smoothed version of the oscillator can help highlight broader trends, while the main oscillator reveals immediate cycles.
Spot Overbought and Oversold Levels: When the oscillator approaches +1 or -1, it may indicate that the market is overbought or oversold, signaling potential entry or exit points.
Confirm Divergences: If the price movement diverges from the oscillator's direction, it may indicate a potential reversal. For example, if prices make higher highs while the oscillator makes lower highs, it could be a sign of weakening trend strength.
█ Settings
Window Length (N): Defines the number of historical bars used for EMD analysis. A larger window captures more data but may slow down performance.
Number of IMFs (M): Sets how many IMFs to extract. Higher values allow for a more detailed decomposition, isolating smaller cycles within the data.
Amplitude Window (L): Controls the length of the window used for amplitude calculation, affecting the smoothness of the normalized oscillator.
Extraction Range (IMF Start and End): Allows you to select which IMFs to include in the reconstructed signal. Starting with lower IMFs captures faster cycles, while ending with higher IMFs includes slower, trend-based components.
Sifting Stopping Criterion (S-number): Sets how precisely each IMF should be refined. Higher values yield more accurate IMFs but take longer to compute.
Max Sifting Iterations (num_siftings): Limits the number of sifting iterations for each IMF extraction, balancing between performance and accuracy.
Source: The price data used for the analysis, such as close or open prices. This determines which price movements are decomposed by the indicator.
-----------------
Disclaimer
The information contained in my Scripts/Indicators/Ideas/Algos/Systems does not constitute financial advice or a solicitation to buy or sell any securities of any type. I will not accept liability for any loss or damage, including without limitation any loss of profit, which may arise directly or indirectly from the use of or reliance on such information.
All investments involve risk, and the past performance of a security, industry, sector, market, financial product, trading strategy, backtest, or individual's trading does not guarantee future results or returns. Investors are fully responsible for any investment decisions they make. Such decisions should be based solely on an evaluation of their financial circumstances, investment objectives, risk tolerance, and liquidity needs.
My Scripts/Indicators/Ideas/Algos/Systems are only for educational purposes!

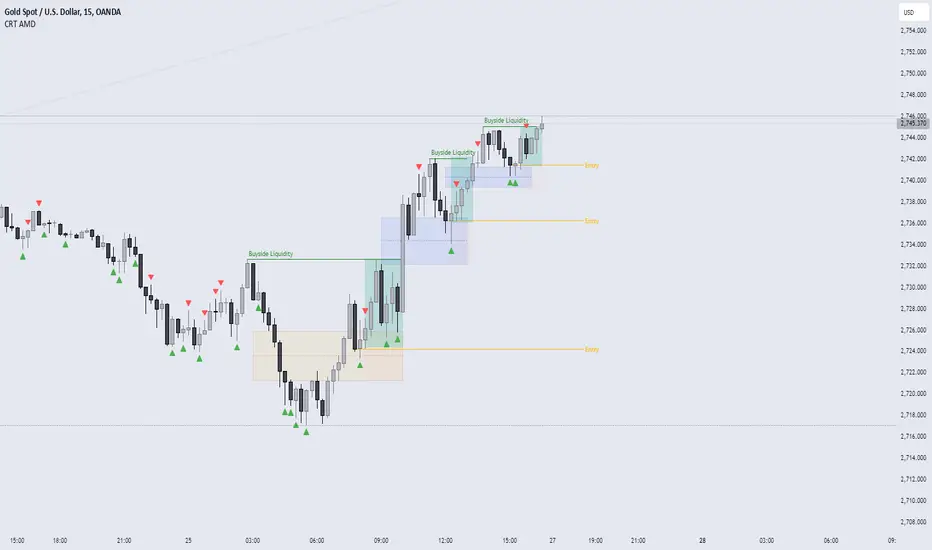
CRT AMD indicatorThis indicator is based on the Power of three (Accumulation Manipulation Distribution) Cycle, by marking the candle that Sweep the low or high of the previous candle and then closed back inside the range of the previous candle, indicating a possibility of a Manipulation or Reversal.
Combining the indicator with HTF Array and LTF Setup Entry will significantly improve the accuracy.
Ultimate Machine Learning MACD (Deep Learning Edition)This script is a "Deep Learning MACD" indicator that combines traditional MACD calculations with advanced machine learning techniques, including recursive feedback, adaptive learning rates, Monte Carlo simulations, and volatility-based adjustments. Here’s a breakdown of its key components:
Inputs
Lookback: The length of historical data (1000 by default) used for learning and volatility measurement.
Momentum and Volatility Weighting: Adjusts how much momentum and volatility contribute to the learning process (momentum weight: 1.2, volatility weight: 1.5).
MACD Lengths: Defines the range for MACD fast and slow lengths, starting at minimum of 1 and max of 1000.
Learning Rate: Defines how much the model learns from its predictions (very small learning rate by default).
Adaptive Learning: Enables dynamic learning rates based on market volatility.
Memory Factor: A feedback factor that determines how much weight past performance has in the current model.
Simulations: The number of Monte Carlo simulations used for probabilistic modeling.
Price Change: Calculated as the difference between the current and previous close.
Momentum: Measured using a lookback period (1000 bars by default).
Volatility: Standard deviation of closing prices.
ATR: Average true range over 14 periods for measuring market volatility.
Custom EMA Calculation
Implements an exponential moving average (EMA) formula from scratch using a recursive calculation with a smoothing factor.
Dynamic Learning Rate
Adjusts the learning rate based on market volatility. When volatility is high, the learning rate increases, and when volatility is low, it decreases. This makes the model more responsive during volatile markets and more stable during calm periods.
Error Calculation and Adjustment
Error Calculation: Measures the difference between the predicted value (via Monte Carlo simulations) and the true MACD value.
Adjust MACD Length: Uses the error to adjust the fast and slow MACD lengths dynamically, so the system can learn from market conditions.
Probabilistic Monte Carlo Simulation
Runs multiple simulations (200 by default) to generate probabilistic predictions. It uses random values weighted by momentum and volatility to simulate various market scenarios, enhancing
prediction accuracy.
MACD Calculation (Learning-Enhanced)
A custom MACD function that calculates:
Fast EMA and Slow EMA for MACD line.
Signal Line: An EMA of the MACD line.
Histogram: The difference between the MACD and signal lines.
Adaptive MACD Calculation
Adjusts the fast and slow MACD lengths based on the error from the Monte Carlo prediction.
Calculates the adaptive MACD, signal, and histogram using dynamically adjusted lengths.
Recursive Memory Feedback
Stores previous MACD values in an array (macdMemory) and averages them to create a feedback loop. This adds a "memory" to the system, allowing it to learn from past behaviors and refine future predictions.
Volatility-Based Reinforcement
Introduces a volatility reinforcement factor that influences the signal based on market conditions. It adds volatility awareness to the feedback system, making the system more reactive during high volatility periods.
Smoothed MACD
After all the adjustments, the MACD line is further smoothed based on the current market volatility, resulting in a final smoothed MACD.
Key Features
Monte Carlo Simulation: Runs multiple simulations to enhance predictions based on randomness and market behavior.
Adaptive Learning: Dynamic adjustments of learning rates and MACD lengths based on market conditions.
Recursive Feedback: Uses past data as feedback to refine the system’s predictions over time.
Volatility Awareness: Integrates market volatility into the system, making the MACD more responsive to market fluctuations.
This combination of traditional MACD with machine learning creates an adaptive indicator capable of learning from past behaviors and adjusting its sensitivity based on changing market conditions.

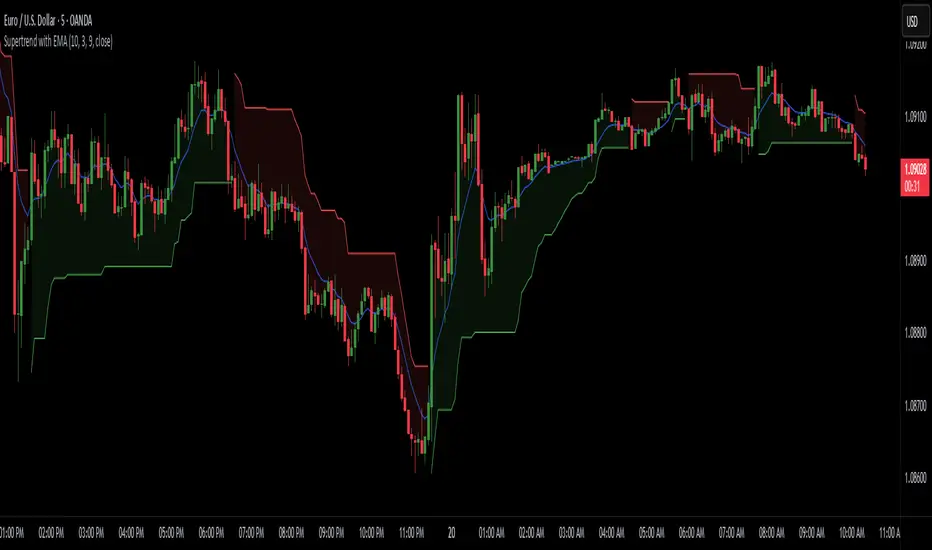
Supertrend with EMASupertrend + EMA Indicator
This custom indicator combines the popular Supertrend and Exponential Moving Average (EMA) indicators to enhance trend analysis and signal accuracy. The Supertrend tracks price volatility to identify potential trend directions, while the EMA provides a smooth moving average to help refine entries and exits based on trend momentum.
Features:
Supertrend: Detects trend reversals by using price action and volatility, making it effective in trending markets.
Exponential Moving Average (EMA): Smoothens price fluctuations, helping you gauge the trend’s strength and filter out false signals.
Versatile for multiple timeframes and asset classes.
Ideal for traders looking to catch sustained trends and avoid false breakouts, this indicator offers an improved way to follow market momentum and confirm trend strength. Customize the Supertrend ATR multiplier and EMA length to suit your trading style and timeframe.
Trend Magic Enhanced [AlgoAlpha]🔥✨ Trend Magic Enhanced - Boost Your Trend Analysis! 🚀📈
Introducing the Trend Magic Enhanced indicator by AlgoAlpha, a powerful tool designed to help you identify market trends with greater accuracy. This advanced indicator combines the Commodity Channel Index (CCI) and Average True Range (ATR) to calculate dynamic support and resistance levels, known as the Trend Magic. By smoothing the Trend Magic with various moving average types, this indicator provides clearer trend signals and helps you make more informed trading decisions.
Key Features :
🎯 Unique Trend Identification : Combines CCI and ATR to detect market trends and potential reversals.
🔄 Customizable Smoothing : Choose from SMA, EMA, SMMA, WMA, or VWMA to smooth the Magic Trend for clearer signals.
🎨 Flexible Appearance Settings : Customize colors for bullish and bearish trends to suit your charting preferences.
⚙️ Adjustable Parameters : Modify CCI period, ATR period, ATR multiplier, and smoothing length to align with your trading strategy.
🔔 Alert Notifications : Set alerts for trend shifts to stay ahead of market movements.
📈 Visual Signals : Displays trend direction changes directly on the chart with up and down arrows.
Quick Guide to Using the Trend Magic Enhanced Indicator
🛠 Add the Indicator : Add the indicator to your chart by pressing the star icon to add it to favorites. Customize settings such as CCI period, ATR multiplier, ATR period, smoothing options, and colors to match your trading style.
📊 Analyze the Chart : Observe the Trend Magic line and the color-coded trend signals. When the Trend Magic line turns bullish (e.g., green), it indicates an upward trend, and when it turns bearish (e.g., red), it indicates a downward trend. Use the visual arrows to spot trend direction changes.
🔔 Set Alerts : Enable alerts to receive notifications when a trend shift is detected, so you can act promptly on trading opportunities without constantly monitoring the chart.
How It Works:
The Trend Magic Enhanced indicator integrates the Commodity Channel Index (CCI) and Average True Range (ATR) to calculate a dynamic Trend Magic line. By adjusting price levels based on CCI values—upward when CCI is positive and downward when negative—and factoring in ATR for market volatility, it creates adaptive support and resistance levels. Optionally smoothed with various moving averages to reduce noise, the indicator changes line color based on trend direction, highlights trend changes with arrows, and provides alerts for significant shifts, aiding traders in identifying potential entry and exit points.
Enhancements Over the Original Trend Magic Indicator
The Trend Magic Enhanced indicator significantly refines the trend identification method of the original Trend Magic script by introducing customizable smoothing options and additional analytical features. While the original indicator determines trend direction solely based on the Commodity Channel Index (CCI) crossing above or below zero and adjusts the Magic Trend line using the Average True Range (ATR), the enhanced version allows users to smooth the Magic Trend line with various moving average types (SMA, EMA, SMMA, WMA, VWMA). This smoothing reduces market noise and provides clearer trend signals. Additionally, the enhanced indicator incorporates price action analysis by detecting crossovers and crossunders of price with the Magic Trend line, and it visually marks trend changes with up and down arrows on the chart. These improvements offer a more responsive and accurate trend detection compared to the original method, enabling traders to identify potential entry and exit points more effectively.
Enhance your trading strategy with the Trend Magic Enhanced indicator by AlgoAlpha and gain a clearer perspective on market trends! 🌟📈

Volume Trend Swing Points | viResearchVolume Trend Swing Points | viResearch
Conceptual Foundation and Innovation
The "Volume Trend Swing Points" script is designed to identify pivotal swing points in market trends by leveraging the Price Volume Trend (PVT) indicator. This unique approach combines price and volume movements to highlight moments when a market may experience a significant trend reversal. By detecting the highest and lowest points of the PVT over customizable periods, this script aims to provide traders with valuable insights into potential bullish or bearish market behavior.
The simplicity of the script, combined with its use of the PVT, offers an effective way for traders to anticipate key market swings based on both price and volume momentum.
Technical Composition and Calculation
The core of the "Volume Trend Swing Points" script is built around the Price Volume Trend (PVT) indicator, which adjusts price changes according to trading volume. The script focuses on identifying the highest and lowest values of the PVT over user-defined lookback periods:
Price Volume Trend (PVT): The PVT is used to calculate the momentum of price movements, taking volume into account. By incorporating both price and volume, the PVT offers a more dynamic and responsive indicator of trend direction compared to price alone.
Swing Point Detection: The script identifies the highest and lowest PVT values over user-defined lookback periods (x for highs and y for lows). When the current PVT matches either the highest or lowest value, it signals a potential trend reversal or continuation, depending on whether the high or low is detected.
Entry and Exit Signals: A long signal (bullish) is generated when the current PVT matches the highest value over the lookback period, while a short signal (bearish) is generated when the current PVT matches the lowest value. These signals can be visualized with alerts and background colors.
Features and User Inputs
The "Volume Trend Swing Points" script allows traders to customize several parameters to better suit their trading strategies and market conditions:
Lookback Periods (x and y): The script allows for two customizable lookback periods—one for detecting the highest PVT and another for the lowest. Adjusting these values can help refine the sensitivity of the swing points.
Bar Coloring: The script includes an optional setting to color the bars based on detected bullish or bearish trends, making it easier to visualize potential market shifts.
Background Colors: The background color changes dynamically based on whether a high or low swing point is detected, providing traders with a clear visual indication of potential trend reversals.
Alerts: The script includes alert conditions for both long and short signals, enabling traders to set notifications for when potential swing points are detected.
Practical Applications
The "Volume Trend Swing Points" script is ideal for traders who focus on price and volume dynamics when making trading decisions. Its application is particularly useful in the following scenarios:
Detecting Trend Reversals: By identifying the highest and lowest PVT values over a given period, the script can help traders spot potential reversal points, allowing for more timely entries or exits.
Confirming Trend Continuations: When the PVT continues to match the highest or lowest values, it may indicate that the trend is likely to continue, helping traders maintain their positions with greater confidence.
Volume-Based Trend Analysis: Since the script uses the PVT, it is particularly effective in markets where volume plays a significant role in driving price movements, offering insights that go beyond simple price-based indicators.
Advantages and Strategic Value
This script enhances traditional trend analysis by incorporating both price and volume through the PVT, providing a more comprehensive view of market momentum. The customizable lookback periods allow traders to adapt the script to different assets and timeframes, making it a versatile tool for swing trading and trend-following strategies.
The visual cues provided by bar coloring and background shading help traders quickly identify potential market shifts, improving decision-making speed and accuracy.
Summary and Usage Tips
The "Volume Trend Swing Points" script is a straightforward yet powerful tool for identifying market reversals and trend continuations based on both price and volume. By adjusting the lookback periods, traders can fine-tune the script to better suit their trading style and the assets they are monitoring. The visual and alert features further enhance the script's usability, making it easy to incorporate into a trading strategy.
Remember to backtest the script across various market conditions to better understand its performance. Past performance is not necessarily indicative of future results, so using this script in conjunction with other technical tools is recommended for optimal decision-making.

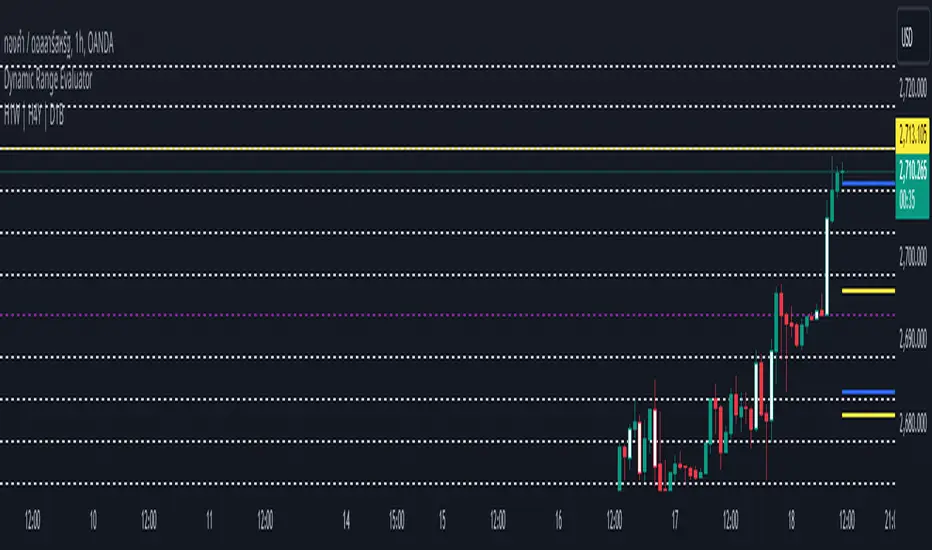
Dynamic Range EvaluatorThe Dynamic Range Evaluator script or indicator analyzes the dynamic movement of price ranges in the market, offering several key advantages:
---------------------------------------------------------------------------------
1. Identifies Market Volatility
It detects when price ranges expand or contract, helping traders gauge the market's current volatility—whether it is highly volatile (wide range) or calm (narrow range).
2. Adapts Strategies Based on Market Conditions
The script allows traders to implement suitable strategies:
Use Breakout strategies when the range expands.
Use Mean Reversion strategies when the price moves within a tight range.
3. Accurate Entry and Exit Points
By identifying dynamic price zones, it helps spot potential reversals or areas near key support/resistance levels, reducing the risk of poor entry decisions in unclear market phases.
4. Versatile Across Market Phases
Whether in a bullish, bearish, or sideways market, the Dynamic Range Evaluator adjusts smoothly to shifting conditions, minimizing the need for frequent modifications.
5. Effective Across Multiple Time Frames
It works well on both lower and higher time frames. For instance:
On lower time frames, it helps identify short-term trade entries/exits.
On higher time frames, it assists with analyzing broader trends.
6. Customizable Dynamic Parameters
Traders can modify range thresholds or evaluation criteria to suit specific asset classes or currency pairs, providing flexibility and improved accuracy.
---------------------------------------------------------------------------------
Use Cases
Combine with ATR (Average True Range) to identify optimal average ranges.
Align Take Profit / Stop Loss levels with current market ranges.
Integrate with Breakout Strategies by monitoring for range expansion and waiting for key support/resistance breakouts.
MTF RSI+CMO PROThis RSI+CMO script combines the Relative Strength Index (RSI) and Chande Momentum Oscillator (CMO), providing a powerful tool to help traders analyze price momentum and spot potential turning points in the market. Unlike using RSI alone, the CMO (especially with a 14-period length) moves faster and accentuates price pops and dips in the histogram, making price shifts more apparent.
Indicator Features:
➡️RSI and CMO Combined: This indicator allows traders to track both RSI and CMO values simultaneously, highlighting differences in their movement. RSI and CMO values are both plotted on the histogram, while CMO values are also drawn as a line moving through the histogram, giving a visual representation of their relationship. The often faster-moving CMO accentuates short-term price movements, helping traders spot subtle shifts in momentum that the RSI might smooth out.
➡️Multi-Time Frame Table: A real-time, multi-time frame table displays RSI and CMO values across various timeframes. This gives traders an overview of momentum across different intervals, making it easier to spot trends and divergences across short and long-term time frames.
➡️Momentum Chart Label: A chart label compares the current RSI and CMO values with values from 1 and 2 bars back, providing an additional metric to gauge momentum. This feature allows traders to easily see if momentum is increasing or decreasing in real-time.
➡️RSI/CMO Bullish and Bearish Signals: Colored arrow plot shapes (above the histogram) indicate when RSI and CMO values are signaling bullish or bearish conditions. For example, green arrows appear when RSI is above 65, while purple arrows show when RSI is below 30 and CMO is below -40, indicating strong bearish momentum.
➡️Divergences in Histogram: The histogram can make it easier for traders to spot divergences between price and momentum. For instance, if the price is making new highs but the RSI or CMO is not, a bearish divergence may be forming. Similarly, bullish divergences can be spotted when prices are making lower lows while RSI or CMO is rising.
➡️Alert System: Alerts are built into the indicator and will trigger when specific conditions are met, allowing traders to stay informed of potential entry or exit points based on RSI and CMO levels without constantly monitoring the chart. These are set manually. Look for the 3 dots in the indicator name.
How Traders Can Use the Indicator:
💥Identifying Momentum Shifts: The RSI+CMO combination is ideal for spotting momentum shifts in the market. Traders can monitor the histogram and the CMO line to determine if the market is gaining or losing strength.
💥Confirming Trade Entries/Exits: Use the real-time RSI and CMO values across multiple time frames to confirm trades. For instance, if the 1-hour RSI is above 70 but the 1-minute RSI is turning down, it could indicate short-term overbought conditions, signaling a potential exit or reversal.
💥Spotting Divergences: Divergences are critical for predicting potential reversals. The histogram can be used to spot divergences when RSI and CMO values deviate from price action, offering an early signal of market exhaustion.
💥Tracking Multi-Time Frame Trends: The multi-time frame table provides insight into the market’s overall trend across several timeframes, helping traders ensure their decisions align with both short and long-term trends.
RSI vs. CMO: Why Use Both?
While both RSI and CMO measure momentum, the CMO often moves faster with a value of 14 for example, reacting to price changes more quickly. This makes it particularly effective for detecting sharp price movements, while RSI helps smooth out price action. By using both, traders get a clearer picture of the market's momentum, particularly during volatile periods.
Confluence and Price Fluidity:
One of the powerful ways to enhance the effectiveness of this indicator is by using it in conjunction with other technical analysis tools to create confluence. Confluence occurs when multiple indicators or price action signals align, providing stronger confirmation for a trade decision. For example:
🎯Support and Resistance Levels: Traders can use RSI+CMO in combination with key support and resistance zones. If the price is nearing a support level and RSI+CMO values start to signal a bullish reversal, this alignment strengthens the case for entering a long position.
🎯Moving Averages: When the RSI+CMO signals a potential trend reversal and this is confirmed by a crossover in moving averages (such as a 50-day and 200-day moving average), traders gain additional confidence in the trade direction.
🎯Momentum Indicators: Traders can also look for momentum indicators like the MACD to confirm the strength of a trend or potential reversal. For instance, if the RSI+CMO values start to decrease rapidly while both the RSI+CMO also shows overbought conditions, this could provide stronger confirmation to exit a long trade or enter a short position.
🎯Candlestick Patterns: Price fluidity can be monitored using candlestick formations. For example, a bearish engulfing pattern with decreasing RSI+CMo values offers confluence, adding confidence to the signal to close or short the trade.
By combining the MTF RSI+CMO PRO with other tools, traders ensure that they are not relying on a single indicator. This layered approach can reduce the likelihood of false signals and improve overall trading accuracy.

Chandelier Exit Pro w/ExtensionsChandelier Exit Pro w/Extensions
The Chandelier Exit Pro w/Extensions indicator is designed to assist traders in managing risk and identifying trend reversals. The strategy is based on the Chandelier Exit concept, originally created by Charles Le Beau. It uses the Average True Range (ATR) to calculate dynamic stop levels that adjust based on market volatility. This script not only implements the standard Chandelier Exit, but also introduces extension levels and alerts to enhance decision-making.
Key Features:
➡️Dynamic Stop Levels: The indicator calculates stop levels for both long and short positions based on an ATR multiple. This allows traders to determine exit points by monitoring when the price crosses above or below these levels. These levels adapt in real-time based on price volatility, making them a versatile tool for trend-following strategies.
➡️Extension Levels: In addition to the primary stop levels, the script includes extension levels for more advanced stop-loss management. Traders can view active and extension levels separately, providing more flexibility in their exit strategies.
➡️Labels and Visual Cues: The indicator provides dynamic labels that automatically update and follow the plotted stop levels. Labels include the ATR multiplier value (e.g., "2.5" or "2.5ext"), clearly showing the significance of each level. When price crosses below or above a level, the corresponding label is highlighted, aiding traders in quickly identifying the most relevant stop level.
➡️Bar Confirmation and Alerts: The script includes an "await bar confirmation" option to ensure that the stop levels and alerts only trigger after the bar has closed. Alerts are customizable and will notify traders when price crosses critical levels, helping to make timely decisions without the need to constantly monitor charts.
➡️Multiple ATR Levels for Enhanced Precision: The indicator supports up to four different ATR levels, each with customizable multipliers. This allows traders to set different thresholds for exits based on varying degrees of volatility. For example, Level 1 (2.5x ATR) might represent a tighter stop, while Level 4 (10x ATR) could serve as a wider stop for long-term positions.
➡️Calc_bars_count: Improves efficiency of the indicator by reducing the on-chart calculations in to the past. This input can be found at the bottom of the INPUTS tab.
How it Helps Traders:
💥Trend Identification: By using the Chandelier Exit levels, traders can identify when the trend is likely to reverse. When the price crosses below the stop level in a long trade or above the stop level in a short trade, it signals a potential exit point.
💥Volatility-based Adjustments: Unlike static stop-loss methods, the ATR-based stop levels dynamically adjust based on the market’s volatility. This means tighter stops during low volatility periods and wider stops during high volatility periods, reducing the chance of being stopped out prematurely.
💥Risk Management: The dynamic stop levels and extension levels provide a structured way to manage risk. Traders can set tighter stops for short-term trades and wider stops for longer-term trades. The script's visual labels make it easy to track these levels in real-time.
💥Automation with Alerts: The built-in alert system ensures that traders are notified when key levels are crossed. This helps to avoid emotional decision-making and allows for better execution of trading strategies.
Confluence and Price Fluidity:
One of the powerful ways to enhance the effectiveness of the Chandelier Exit indicator is by using it in conjunction with other technical analysis tools to create confluence. Confluence occurs when multiple indicators or price action signals align, providing stronger confirmation for a trade decision. For example:
🎯Support and Resistance Levels: Traders can use the Chandelier Exit levels in combination with key support and resistance zones. If the price is nearing a support level and the Chandelier Exit signals a bullish reversal, this alignment strengthens the case for entering a long position.
🎯Moving Averages: When the Chandelier Exit signals a trend reversal and this is confirmed by a crossover in moving averages (such as a 50-day and 200-day moving average), traders gain additional confidence in the trade direction.
🎯Momentum Indicators: Traders can also look for momentum indicators like RSI or MACD to confirm the strength of a trend or potential reversal. For instance, if the Chandelier Exit triggers a short signal and the RSI also shows overbought conditions, this could provide stronger confirmation to exit a long trade or enter a short position.
🎯Candlestick Patterns: Price fluidity can be monitored using candlestick formations. For example, a bearish engulfing pattern near a Chandelier Exit resistance level offers confluence, adding confidence to the signal to close or short the trade.
By combining the Chandelier Exit with other tools, traders ensure that they are not relying on a single indicator. This layered approach can reduce the likelihood of false signals and improve overall trading accuracy.
Practical Use Case:
Imagine a trader enters a long position, and the price moves favorably. Using the Chandelier Exit, the trader sets the initial stop level at 2.5x ATR below the highest close. As the price continues to rise, the stop level follows the price, locking in profits. If the market suddenly turns, the price crossing below the stop level signals an exit, helping the trader preserve gains. With extension levels, the trader can further refine exits, adjusting based on their risk tolerance and market conditions.
Good luck and I hope that you can find a place in your tool bag to use this dynamic indicator 🙏

Scalping Strategy By TradingConTotoScript Description: "Scalping Strategy By TradingConToto"
This scalping strategy is designed to trade in volatile markets, taking advantage of rapid price movements. It uses pivots to identify key entry and exit points, along with exponential moving averages (EMAs) to determine the overall trend.
Key Features:
Dynamic Pivots: Calculates pivot highs and lows to identify support and resistance zones, improving entry accuracy.
Market Trend Analysis: Utilizes a 100-period EMA for long-term trend analysis and a 25-period EMA for short-term trends, facilitating informed decision-making.
Automated Entry and Exit: Generates buy and sell signals based on EMA crossovers and specific market conditions, ensuring you don't miss opportunities.
Risk Management: Allows you to set take profit and stop loss levels tailored to market volatility, using the ATR for effective risk management.
User-Friendly Interface: Easily customize strategy parameters such as pivot range, stop loss and take profit pips, and spread.
Requirements:
Ideal for use on short time frames during high activity sessions, like the configured scalping session.
Activate buy and sell options according to your preference and analyze performance using TradingView’s tools.
Note:
This script is a tool and does not guarantee results. It is recommended to test in a simulated environment before applying it to real accounts.
Optimize your scalping operations and enhance your market performance with this effective strategy!
Alternative Shark Harmonic Pattern [TradingFinder] ALT Shark🔵 Introduction
The Alternative Shark harmonic pattern, similar to the original Shark harmonic pattern introduced by Scott Carney, is a powerful tool in technical analysis used to identify potential reversal zones (PRZ) in financial markets.
These harmonic patterns help traders spot key turning points in market trends by relying on specific Fibonacci ratios. The Alternative Shark pattern is particularly unique due to its distinct Fibonacci retracements within the PRZ, which differentiate it from the standard Shark pattern and provide traders with more precise entry and exit signals.
By focusing on harmonic patterns and utilizing tools like the Harmonic Pattern Indicator, traders can easily identify both the Shark and Alternative Shark patterns, making it easier to find PRZs and capture potential trend reversals. This enhanced detection of potential reversal zones allows for better trade optimization and improved risk management.
Incorporating the Alternative Shark pattern into your technical analysis strategy enables you to enhance your trading performance by identifying market reversals with greater accuracy, improving the timing of your trades, and reducing risks associated with sudden market shifts.
🟣 Understanding the Types of Alternative Shark Pattern
The Alternative Shark harmonic pattern, much like the original Shark pattern, forms at the end of price trends and is divided into two types: Bullish and Bearish Alternative Shark patterns.
Bullish Alternative Shark Pattern :
This pattern typically forms at the end of a downtrend, signaling a potential reversal into an uptrend. Traders can use this pattern to identify buy entry points. The image below illustrates the core components of the Bullish Alternative Shark Pattern.
Bearish Alternative Shark Pattern :
Conversely, the Bearish Alternative Shark Pattern appears at the end of an uptrend and signals a potential reversal to a downtrend. This variation allows traders to adjust their strategies for selling. The image below outlines the characteristics of the Bearish Alternative Shark Pattern.
🟣 Differences Between Shark and Alternative Shark Patterns
Although both patterns share similar structures and serve as tools for identifying price reversals, there is one key difference between them :
AB to XA Ratio : In the Shark pattern, the AB leg retraces between 1 and 2 of the XA leg, whereas in the Alternative Shark pattern, this retracement is reduced to 0.382 to 0.618 of the XA leg. This difference in the retracement ratio leads to slightly different trade signals and can affect the timing of entry and exit points.
Other ratios and reversal signals remain consistent between the two patterns, but this difference in the AB to XA ratio provides traders with more nuanced opportunities to optimize their trades.
🔵 How to Use
🟣 Trading with the Bullish Alternative Shark Pattern
The Bullish Alternative Shark Pattern functions similarly to the traditional Bullish Shark, acting as a reversal pattern that helps traders recognize the end of a downtrend and the beginning of an uptrend.
The main distinction lies in the reduced AB retracement, which can offer more refined entry signals. Once the pattern completes, traders can look to enter buy trades and place a stop-loss below the lowest point of the pattern for effective risk management.
🟣 Trading with the Bearish Alternative Shark Pattern
The Bearish Alternative Shark Pattern operates much like the Bearish Shark pattern but with the adjusted AB to XA ratio. This difference provides traders with unique entry points for sell trades. Once the pattern is fully identified, traders can enter short positions, placing a stop-loss above the highest point of the pattern to safeguard against market fluctuations.
🔵 Setting
🟣 Logical Setting
ZigZag Pivot Period : You can adjust the period so that the harmonic patterns are adjusted according to the pivot period you want. This factor is the most important parameter in pattern recognition.
Show Valid Forma t: If this parameter is on "On" mode, only patterns will be displayed that they have exact format and no noise can be seen in them. If "Off" is, the patterns displayed that maybe are noisy and do not exactly correspond to the original pattern.
Show Formation Last Pivot Confirm : if Turned on, you can see this ability of patterns when their last pivot is formed. If this feature is off, it will see the patterns as soon as they are formed. The advantage of this option being clear is less formation of fielded patterns, and it is accompanied by the latest pattern seeing and a sharp reduction in reward to risk.
Period of Formation Last Pivot : Using this parameter you can determine that the last pivot is based on Pivot period.
🟣 Genaral Setting
Show : Enter "On" to display the template and "Off" to not display the template.
Color : Enter the desired color to draw the pattern in this parameter.
LineWidth : You can enter the number 1 or numbers higher than one to adjust the thickness of the drawing lines. This number must be an integer and increases with increasing thickness.
LabelSize : You can adjust the size of the labels by using the "size.auto", "size.tiny", "size.smal", "size.normal", "size.large" or "size.huge" entries.
🟣 Alert Setting
Alert : On / Off
Message Frequency : This string parameter defines the announcement frequency. Choices include: "All" (activates the alert every time the function is called), "Once Per Bar" (activates the alert only on the first call within the bar), and "Once Per Bar Close" (the alert is activated only by a call at the last script execution of the real-time bar upon closing). The default setting is "Once per Bar".
Show Alert Time by Time Zone : The date, hour, and minute you receive in alert messages can be based on any time zone you choose. For example, if you want New York time, you should enter "UTC-4". This input is set to the time zone "UTC" by default.
🔵 Conclusion
The Alternative Shark harmonic pattern, despite its structural similarity to the traditional Shark pattern, introduces a key difference in the AB to XA ratio, making it a valuable addition to the trader’s toolkit. This subtle variation enables traders to pinpoint reversal points with greater accuracy and fine-tune their trading strategies.
As with any technical pattern, it is crucial to use the Alternative Shark pattern in combination with other technical indicators and strong risk management practices. Incorporating this pattern into a broader trading strategy can help traders enhance their ability to detect and capitalize on market reversals more effectively.

MTF Regression with Forecast### **MTF Regression with Forecast, Treasury Yield, Additional Variable & VWAP Filter - Enhanced with Long Regression**
Unlock advanced market insights with our **MTF Regression** indicator, meticulously designed for traders seeking comprehensive multi-timeframe analysis combined with powerful forecasting tools. Whether you're a seasoned trader or just starting out, this indicator offers a suite of features to enhance your trading strategy.
#### **🔍 Key Features:**
- **Multi-Timeframe (MTF) Regression:**
- **Fast, Slow, & Long Regressions:** Analyze price trends across multiple timeframes to capture both short-term movements and long-term trends.
- **Customizable Price Inputs:**
- **Flexible Price Selection:** Choose between Close, Open, High, or Low prices to suit your trading style.
- **Price Transformation:** Option to apply Exponential Moving Averages (EMA) for smoother trend analysis.
- **Diverse Regression Methods:**
- **Multiple Algorithms:** Select from Linear, Exponential, Hull Moving Average (HMA), Weighted Moving Average (WMA), or Spline regressions to best fit your analysis needs.
- **Integrated External Data:**
- **10-Year Treasury Yield:** Incorporate macroeconomic indicators to refine regression accuracy.
- **Additional Variables:** Enhance your analysis by integrating data from other tickers (e.g., NASDAQ:AAPL).
- **Advanced Filtering Options:**
- **VWAP Filter:** Align signals with the Volume Weighted Average Price for improved trade entries.
- **Price Action Filter:** Ensure price behavior supports the generated signals for higher reliability.
- **Enhanced Signal Generation:**
- **Bullish & Bearish Signals:** Identify potential trend reversals and continuations with clear visual cues.
- **Predictive Signals:** Forecast future price movements with forward-looking arrows based on regression slopes.
- **Slope & Acceleration Thresholds:** Customize minimum slope and acceleration levels to fine-tune signal sensitivity.
- **Forecasting Capabilities:**
- **Projection Lines:** Visualize future price trends by extending regression lines based on current slope data.
- **User-Friendly Interface:**
- **Organized Settings Groups:** Easily navigate through price inputs, regression settings, integration options, and more.
- **Customizable Alerts:** Stay informed with configurable alerts for bullish, bearish, and predictive signals.
#### **📈 Why Choose MTF Regression Indicator?**
- **Comprehensive Analysis:** Combines multiple regression techniques and external data sources for a well-rounded market view.
- **Flexibility:** Highly customizable to fit various trading strategies and preferences.
- **Enhanced Decision-Making:** Provides clear signals and forecasts to support informed trading decisions.
- **Efficiency:** Optimized to deliver reliable performance without overloading your trading platform.
Elevate your trading game with the **MTF Regression with Forecast, Treasury Yield, Additional Variable & VWAP Filter** indicator. Harness the power of multi-timeframe analysis and predictive forecasting to stay ahead in the dynamic markets.
---
*Feel free to reach out for more information or support. Happy Trading!*
Volatility Gaussian Bands [BigBeluga]The Volatility Gaussian Bands indicator is a cutting-edge tool designed to analyze market trends and volatility with high precision. By applying a Gaussian filter to smooth price data and implementing dynamic bands based on market volatility, this indicator provides clear signals for trend direction, strength, and potential reversals. With updated volatility calculations, it enhances the accuracy of trend detection, making it a powerful addition to any trader's toolkit.
⮁ KEY FEATURES & USAGE
● Gaussian Filter Trend Bands:
The Gaussian Filter forms the foundation of this indicator by smoothing price data to reveal the underlying trend. The trend is visualized through upper and lower bands that adjust dynamically based on market volatility. These bands provide clear visual cues for traders: a crossover above the upper band indicates a potential uptrend, while a cross below the lower band signals a potential downtrend. This feature allows traders to identify trends with greater accuracy and act accordingly.
● Dynamic Trend Strength Gauges:
The indicator includes trend strength gauges positioned at the top and bottom of the chart. These gauges dynamically measure the strength of the uptrend and downtrend, based on the middle Gaussian line. Even if the trend is downward, a rising midline will cause the upward trend strength gauge to show an increase, offering a nuanced view of the market’s momentum.
Weakening of the trend:
● Fast Trend Change Indicators:
Triangles with a "+" symbol appear on the chart to signal rapid changes in trend direction. These indicators are particularly useful when the trend changes swiftly while the midline continues to grow in its previous direction. For instance, during a downtrend, if the trend suddenly shifts upward while the midline is still declining, a triangle with a "+" will indicate this quick reversal. This feature is crucial for traders looking to capitalize on rapid market movements.
● Retest Signals:
Retest signals, displayed as triangles, highlight potential areas where the price may retest the Gaussian line during a trend. These signals provide an additional layer of analysis, helping traders confirm trend continuations or identify possible reversals. The retest signals can be customized based on the trader’s preferences.
⮁ CUSTOMIZATION
● Length Adjustment:
The length of the Gaussian filter can be customized to control the sensitivity of trend detection. Shorter lengths make the indicator more responsive, while longer lengths offer a smoother, more stable trend line.
● Volatility Calculation Mode:
Traders can select from different modes (AVG, MEDIAN, MODE) to calculate the Gaussian filter, allowing for flexibility in how trends are detected and analyzed.
● Retest Signals Toggle:
Enable or disable the retest signals based on your trading strategy. This toggle allows traders to choose whether they want these additional signals to appear on the chart, providing more control over the information displayed during their analysis.
⮁ CONCLUSION
The Volatility Gaussian Bands indicator is a versatile and powerful tool for traders focused on trend and volatility analysis. By combining Gaussian-filtered trend lines with dynamic volatility bands, trend strength gauges, and rapid trend change indicators, this tool provides a comprehensive view of market conditions. Whether you are following established trends or looking to catch early reversals, the Volatility Gaussian Bands offers the precision and adaptability needed to enhance your trading strategy.
