Uptrick: RSI Histogram
1. **Introduction to the RSI and Moving Averages**
2. **Detailed Breakdown of the Uptrick: RSI Histogram**
3. **Calculation and Formula**
4. **Visual Representation**
5. **Customization and User Settings**
6. **Trading Strategies and Applications**
7. **Risk Management**
8. **Case Studies and Examples**
9. **Comparison with Other Indicators**
10. **Advanced Usage and Tips**
---
## 1. Introduction to the RSI and Moving Averages
### **1.1 Relative Strength Index (RSI)**
The Relative Strength Index (RSI) is a momentum oscillator developed by J. Welles Wilder and introduced in his 1978 book "New Concepts in Technical Trading Systems." It is widely used in technical analysis to measure the speed and change of price movements.
**Purpose of RSI:**
- **Identify Overbought/Oversold Conditions:** RSI values range from 0 to 100. Traditionally, values above 70 are considered overbought, while values below 30 are considered oversold. These thresholds help traders identify potential reversal points in the market.
- **Trend Strength Measurement:** RSI also indicates the strength of a trend. High RSI values suggest strong bullish momentum, while low values indicate bearish momentum.
**Calculation of RSI:**
1. **Calculate the Average Gain and Loss:** Over a specified period (e.g., 14 days), calculate the average gain and loss.
2. **Compute the Relative Strength (RS):** RS is the ratio of average gain to average loss.
3. **RSI Formula:** RSI = 100 - (100 / (1 + RS))
### **1.2 Moving Averages (MA)**
Moving Averages are used to smooth out price data and identify trends by filtering out short-term fluctuations. Two common types are:
**Simple Moving Average (SMA):** The average of prices over a specified number of periods.
**Exponential Moving Average (EMA):** A type of moving average that gives more weight to recent prices, making it more responsive to recent price changes.
**Smoothed Moving Average (SMA):** Used to reduce the impact of volatility and provide a clearer view of the underlying trend. The RMA, or Running Moving Average, used in the USH script is similar to an EMA but based on the average of RSI values.
## 2. Detailed Breakdown of the Uptrick: RSI Histogram
### **2.1 Indicator Overview**
The Uptrick: RSI Histogram (USH) is a technical analysis tool that combines the RSI with a moving average to create a histogram that reflects momentum and trend strength.
**Key Components:**
- **RSI Calculation:** Determines the relative strength of price movements.
- **Moving Average Application:** Smooths the RSI values to provide a clearer trend indication.
- **Histogram Plotting:** Visualizes the deviation of the smoothed RSI from a neutral level.
### **2.2 Indicator Purpose**
The primary purpose of the USH is to provide a clear visual representation of the market's momentum and trend strength. It helps traders identify:
- **Bullish and Bearish Trends:** By showing how far the smoothed RSI is from the neutral 50 level.
- **Potential Reversal Points:** By highlighting changes in momentum.
### **2.3 Indicator Design**
**RSI Moving Average (RSI MA):** The RSI MA is a smoothed version of the RSI, calculated using a running moving average. This smooths out short-term fluctuations and provides a clearer indication of the underlying trend.
**Histogram Calculation:**
- **Neutral Level:** The histogram is plotted relative to the neutral level of 50. This level represents a balanced market where neither bulls nor bears have dominance.
- **Histogram Values:** The histogram bars show the difference between the RSI MA and the neutral level. Positive values indicate bullish momentum, while negative values indicate bearish momentum.
## 3. Calculation and Formula
### **3.1 RSI Calculation**
The RSI calculation involves:
1. **Average Gain and Loss:** Calculated over the specified length (e.g., 14 periods).
2. **Relative Strength (RS):** RS = Average Gain / Average Loss.
3. **RSI Formula:** RSI = 100 - (100 / (1 + RS)).
### **3.2 Moving Average Calculation**
For the USH indicator, the RSI is smoothed using a running moving average (RMA). The RMA formula is similar to that of the EMA but is based on averaging RSI values over the specified length.
### **3.3 Histogram Calculation**
The histogram value is calculated as:
- **Histogram Value = RSI MA - 50**
**Plotting the Histogram:**
- **Positive Histogram Values:** Indicate that the RSI MA is above the neutral level, suggesting bullish momentum.
- **Negative Histogram Values:** Indicate that the RSI MA is below the neutral level, suggesting bearish momentum.
## 4. Visual Representation
### **4.1 Histogram Bars**
The histogram is plotted as bars on the chart:
- **Bullish Bars:** Colored green when the RSI MA is above 50.
- **Bearish Bars:** Colored red when the RSI MA is below 50.
### **4.2 Customization Options**
Traders can customize:
- **RSI Length:** Adjust the length of the RSI calculation to match their trading style.
- **Bull and Bear Colors:** Choose colors for histogram bars to enhance visual clarity.
### **4.3 Interpretation**
**Bullish Signal:** A histogram bar that moves from red to green indicates a potential shift to a bullish trend.
**Bearish Signal:** A histogram bar that moves from green to red indicates a potential shift to a bearish trend.
## 5. Customization and User Settings
### **5.1 Adjusting RSI Length**
The length parameter determines the number of periods over which the RSI is calculated and smoothed. Shorter lengths make the RSI more sensitive to price changes, while longer lengths provide a smoother view of trends.
### **5.2 Color Settings**
Traders can adjust:
- **Bull Color:** Color of histogram bars indicating bullish momentum.
- **Bear Color:** Color of histogram bars indicating bearish momentum.
**Customization Benefits:**
- **Visual Clarity:** Traders can choose colors that stand out against their chart’s background.
- **Personal Preference:** Adjust settings to match individual trading styles and preferences.
## 6. Trading Strategies and Applications
### **6.1 Trend Following**
**Identifying Entry Points:**
- **Bullish Entry:** When the histogram changes from red to green, it signals a potential entry point for long positions.
- **Bearish Entry:** When the histogram changes from green to red, it signals a potential entry point for short positions.
**Trend Confirmation:** The histogram helps confirm the strength of a trend. Strong, consistent green bars indicate robust bullish momentum, while strong, consistent red bars indicate robust bearish momentum.
### **6.2 Swing Trading**
**Momentum Analysis:**
- **Entry Signals:** Look for significant shifts in the histogram to time entries. A shift from bearish to bullish (red to green) indicates potential for upward movement.
- **Exit Signals:** A shift from bullish to bearish (green to red) suggests a potential weakening of the trend, signaling an exit or reversal point.
### **6.3 Range Trading**
**Market Conditions:**
- **Consolidation:** The histogram close to zero suggests a range-bound market. Traders can use this information to identify support and resistance levels.
- **Breakout Potential:** A significant move away from the neutral level may indicate a potential breakout from the range.
### **6.4 Risk Management**
**Stop-Loss Placement:**
- **Bullish Positions:** Place stop-loss orders below recent support levels when the histogram is green.
- **Bearish Positions:** Place stop-loss orders above recent resistance levels when the histogram is red.
**Position Sizing:** Adjust position sizes based on the strength of the histogram signals. Strong trends (indicated by larger histogram bars) may warrant larger positions, while weaker signals suggest smaller positions.
## 7. Risk Management
### **7.1 Importance of Risk Management**
Effective risk management is crucial for long-term trading success. It involves protecting capital, managing losses, and optimizing trade setups.
### **7.2 Using USH for Risk Management**
**Stop-Loss and Take-Profit Levels:**
- **Stop-Loss Orders:** Use the histogram to set stop-loss levels based on trend strength. For instance, place stops below support levels in bullish trends and above resistance levels in bearish trends.
- **Take-Profit Targets:** Adjust take-profit levels based on histogram changes. For example, lock in profits as the histogram starts to shift from green to red.
**Position Sizing:**
- **Trend Strength:** Scale position sizes based on the strength of histogram signals. Larger histogram bars indicate stronger trends, which may justify larger positions.
- **Volatility:** Consider market volatility and adjust position sizes to mitigate risk.
## 8. Case Studies and Examples
### **8.1 Example 1: Bullish Trend**
**Scenario:** A trader notices a transition from red to green histogram bars.
**Analysis:**
- **Entry Point:** The transition indicates a potential bullish trend. The trader decides to enter a long position.
- **Stop-Loss:** Set stop-loss below recent support levels.
- **Take-Profit:** Consider taking profits as the histogram moves back towards zero or turns red.
**Outcome:** The bullish trend continues, and the histogram remains green, providing a profitable trade setup.
### **8.2 Example 2: Bearish Trend**
**Scenario:** A trader observes a transition from green to red histogram bars.
**Analysis:**
- **Entry Point:** The transition suggests a potential
bearish trend. The trader decides to enter a short position.
- **Stop-Loss:** Set stop-loss above recent resistance levels.
- **Take-Profit:** Consider taking profits as the histogram approaches zero or shifts to green.
**Outcome:** The bearish trend continues, and the histogram remains red, resulting in a successful trade.
## 9. Comparison with Other Indicators
### **9.1 RSI vs. USH**
**RSI:** Measures momentum and identifies overbought/oversold conditions.
**USH:** Builds on RSI by incorporating a moving average and histogram to provide a clearer view of trend strength and momentum.
### **9.2 RSI vs. MACD**
**MACD (Moving Average Convergence Divergence):** A trend-following momentum indicator that uses moving averages to identify changes in trend direction.
**Comparison:**
- **USH:** Provides a smoothed RSI perspective and visual histogram for trend strength.
- **MACD:** Offers signals based on the convergence and divergence of moving averages.
### **9.3 RSI vs. Stochastic Oscillator**
**Stochastic Oscillator:** Measures the level of the closing price relative to the high-low range over a specified period.
**Comparison:**
- **USH:** Focuses on smoothed RSI values and histogram representation.
- **Stochastic Oscillator:** Provides overbought/oversold signals and potential reversals based on price levels.
## 10. Advanced Usage and Tips
### **10.1 Combining Indicators**
**Multi-Indicator Strategies:** Combine the USH with other technical indicators (e.g., Moving Averages, Bollinger Bands) for a comprehensive trading strategy.
**Confirmation Signals:** Use the USH to confirm signals from other indicators. For instance, a bullish histogram combined with a moving average crossover may provide a stronger buy signal.
### **10.2 Customization Tips**
**Adjust RSI Length:** Experiment with different RSI lengths to match various market conditions and trading styles.
**Color Preferences:** Choose histogram colors that enhance visibility and align with personal preferences.
### **10.3 Continuous Learning**
**Backtesting:** Regularly backtest the USH with historical data to refine strategies and improve accuracy.
**Education:** Stay updated with trading education and adapt strategies based on market changes and personal experiences.
Cerca negli script per "accuracy"

Machine Learning Signal FilterIntroducing the "Machine Learning Signal Filter," an innovative trading indicator designed to leverage the power of machine learning to enhance trading strategies. This tool combines advanced data processing capabilities with user-friendly customization options, offering traders a sophisticated yet accessible means to optimize their market analysis and decision-making processes. Importantly, this indicator does not repaint, ensuring that signals remain consistent and reliable after they are generated.
Machine Learning Integration
The "Machine Learning Signal Filter" employs machine learning algorithms to analyze historical price data and identify patterns that may not be immediately apparent through traditional technical analysis. By utilizing techniques such as regression analysis and neural networks, the indicator continuously learns from new data, refining its predictive capabilities over time. This dynamic adaptability allows the indicator to adjust to changing market conditions, potentially improving the accuracy of trading signals.
Key Features and Benefits
Dynamic Signal Generation: The indicator uses machine learning to generate buy and sell signals based on complex data patterns. This approach enables it to adapt to evolving market trends, offering traders timely and relevant insights. Crucially, the indicator does not repaint, providing reliable signals that traders can trust.
Customizable Parameters: Users can fine-tune the indicator to suit their specific trading styles by adjusting settings such as the temporal synchronization and neural pulse rate. This flexibility ensures that the indicator can be tailored to different market environments.
Visual Clarity and Usability: The indicator provides clear visual cues on the chart, including color-coded signals and optional display of signal curves. Users can also customize the table's position and text size, enhancing readability and ease of use.
Comprehensive Performance Metrics: The indicator includes a detailed metrics table that displays key performance indicators such as return rates, trade counts, and win/loss ratios. This feature helps traders assess the effectiveness of their strategies and make data-driven decisions.
How It Works
The core of the "Machine Learning Signal Filter" is its ability to process and learn from large datasets. By applying machine learning models, the indicator identifies potential trading opportunities based on historical data patterns. It uses regression techniques to predict future price movements and neural networks to enhance pattern recognition. As new data is introduced, the indicator refines its algorithms, improving its accuracy and reliability over time.
Use Cases
Trend Following: Ideal for traders seeking to capitalize on market trends, the indicator helps identify the direction and strength of price movements.
Scalping: With its ability to provide quick signals, the indicator is suitable for scalpers aiming for rapid profits in volatile markets.
Risk Management: By offering insights into trade performance, the indicator aids in managing risk and optimizing trade setups.
In summary, the "Machine Learning Signal Filter" is a powerful tool that combines the analytical strength of machine learning with the practical needs of traders. Its ability to adapt and provide actionable insights makes it an invaluable asset for navigating the complexities of financial markets.
The "Machine Learning Signal Filter" is a tool designed to assist traders by providing insights based on historical data and machine learning techniques. It does not guarantee profitable trades and should be used as part of a comprehensive trading strategy. Users are encouraged to conduct their own research and consider their financial situation before making trading decisions. Trading involves significant risk, and it is possible to lose more than the initial investment. Always trade responsibly and be aware of the risks involved.

Price & Volume Breakout Fibonacci Probability [TradeDots]📝 OVERVIEW
The "Price & Volume Breakout Fibonacci Probability" indicator is designed to detect the probability of the maximum run-up and drawdown of each breakout trade on an asset, assisting traders in optimizing their take profit and stop loss strategies.
🧮 CALCULATIONS
The algorithm detects price and volume breakouts to activate the Fibonacci levels displayed on the chart. It calculates these levels using the period pivot high and low, with the close price of the breakout bar as the reference price.
The indicator then forward-tests within an user-selected number of bars, detecting the maximum run-up and drawdown during that period. Consequently, it calculates the probability of the price hitting either side of the Fibonacci levels, showing the likelihood of reaching take profit and stop loss targets for each breakout trade.
📊 EXAMPLE
The above example shows two breakout trades, circled within the yellow rectangle zone.
The first trade has a maximum run-up above the +0.382 Fibonacci level zone and a maximum drawdown below the -0.618 Fibonacci level zone.
When the price reaches the maximum run-up, it only has a ~45% probability of moving further upward into the last two zones (25% + 19.44%). This indicates that setting a take profit at a higher level may have less than a 50% chance of success.
Conversely, when the price reaches its maximum drawdown, there is only an ~8% probability of moving further downward into the last drawdown zone. This could indicate a potential reversal.
⚙️ SETTINGS
Breakout Condition: Determines the type of breakout condition to track: "Price", "Volume", "Price & Volume".
Backtest Period: The maximum run-up and drawdown are detected within this bar period.
Price Breakout Period: Specifies the number of bars the price needs to break out from.
Volume Breakout Period: Specifies the number of bars the volume needs to break out from.
Trendline Confirmation: Confirms that the close price needs to be above the trendline.
📈 HOW TO USE
By understanding the probabilities of price movements to both the upside and downside, traders can set take profit and stop loss targets with greater accuracy.
For instance, placing a stop loss order below the zone with the highest probability minimizes the chances of being stopped out of a profitable trade. Conversely, setting a take profit target at the zone with the highest probability increases the win rate.
Additionally, if the price breaches multiple Fibonacci levels during the breakout period, it may indicate an abnormal state, signaling a potential reversal or pullback. This can help traders exit trades in a timely manner.
Traders can adjust their take profit and stop loss levels based on their individual risk tolerance.
RISK DISCLAIMER
Trading entails substantial risk, and most day traders incur losses. All content, tools, scripts, articles, and education provided by TradeDots serve purely informational and educational purposes. Past performances are not definitive predictors of future results.

RSI Slope Filtered Signals [UAlgo]The "RSI Slope Filtered Signals " is a technical analysis tool designed to enhance the accuracy of RSI (Relative Strength Index) signals by incorporating slope analysis. This indicator not only considers the RSI value but also analyzes the slope of the RSI over a specified number of bars, providing a more refined signal that accounts for the momentum and trend strength. By utilizing both positive and negative slope arrays, the indicator dynamically adjusts its thresholds, ensuring that signals are responsive to changing market conditions. This tool is particularly useful for traders looking to identify overbought and oversold conditions with a higher degree of precision, filtering out noise and providing clear visual cues for potential market reversals.
🔶 Key Features
Dynamic Slope Analysis: Measures the slope of RSI over a customizable number of bars, offering insights into the momentum and trend direction.
Adaptive Thresholds: Uses historical slope data to calculate dynamic thresholds, adjusting signal sensitivity based on market conditions.
Normalized Slope Calculation: Normalizes the slope values to provide a consistent measure across different market conditions, making the indicator more versatile.
Clear Signal Visualization: The indicator plots both positive and negative normalized slopes with color gradients, visually representing the strength of the trend.
Overbought and Oversold Signals: Plots overbought and oversold signals directly on the chart when the calculated value reaches the user-specified threshold, helping traders identify potential reversal points.
Customizable Settings: Allows users to adjust the RSI length, slope measurement bars, and lookback periods, providing flexibility to tailor the indicator to different trading strategies.
🔶 Interpreting the Indicator
The "RSI Slope Filtered Signals " indicator is designed to be easy to interpret. Here's how you can use it:
Normalized Slope: The indicator plots the normalized slope of the RSI, with values above zero indicating positive momentum and values below zero indicating negative momentum. A higher positive slope suggests a strong upward trend, while a deeper negative slope indicates a strong downward trend.
Reversal Signals: The indicator plots several horizontal lines at different thresholds (+3, +2, +1, 0, -1, -2, -3). These levels are used to gauge the strength of the momentum based on the normalized slope. For example, a normalized slope crossing above the +2 threshold may indicate a strong bullish trend, while crossing below the -2 threshold may suggest a strong bearish trend. These thresholds help in understanding the intensity of the current trend and provide context for interpreting the indicator's signals.
This indicator generates overbought and oversold signals not solely based on the RSI entering extreme levels (above 70 for overbought and below 30 for oversold), but also by considering the behavior of the normalized slope relative to specific thresholds. Specifically, the Overbought Signal (🔽) is triggered when the RSI is above 70 and the normalized slope from the previous bar is greater than or equal to the upper threshold, with the current slope being lower than the previous slope, indicating a potential bearish reversal as momentum may be slowing down.
Similarly, the Oversold Signal (🔼) is generated when the RSI is below 30 and the normalized slope from the previous bar is less than or equal to the lower threshold, with the current slope being higher than the previous slope, signaling a potential bullish reversal as the downward momentum may be weakening.
Area Plots: The indicator also plots the positive and negative slopes as filled areas, providing a quick visual cue for the strength and direction of the trend. Green areas represent positive slopes (upward momentum), while red areas represent negative slopes (downward momentum).
By combining these elements, the "RSI Slope Filtered Signals " provides a comprehensive view of the market's momentum, helping traders make more informed decisions by filtering out false signals and focusing on the significant trends.
🔶 Disclaimer
Use with Caution: This indicator is provided for educational and informational purposes only and should not be considered as financial advice. Users should exercise caution and perform their own analysis before making trading decisions based on the indicator's signals.
Not Financial Advice: The information provided by this indicator does not constitute financial advice, and the creator (UAlgo) shall not be held responsible for any trading losses incurred as a result of using this indicator.
Backtesting Recommended: Traders are encouraged to backtest the indicator thoroughly on historical data before using it in live trading to assess its performance and suitability for their trading strategies.
Risk Management: Trading involves inherent risks, and users should implement proper risk management strategies, including but not limited to stop-loss orders and position sizing, to mitigate potential losses.
No Guarantees: The accuracy and reliability of the indicator's signals cannot be guaranteed, as they are based on historical price data and past performance may not be indicative of future results.

Market Structure Based Stop LossMarket Structure Based Dynamic Stop Loss
Introduction
The Market Structure Based Stop Loss indicator is a strategic tool for traders designed to be useful in both rigorous backtesting and live testing, by providing an objective, “guess-free” stop loss level. This indicator dynamically plots suggested stop loss levels based on market structure, and the concepts of “interim lows/highs.”
It provides a robust framework for managing risk in both long and short positions. By leveraging historical price movements and real time market dynamics, this indicator helps traders identify quantitatively consistent risk levels while optimizing trade returns.
Legend
This indicator utilizes various inputs to customize its functionality, including "Stop Loss Sensitivity" and "Wick Depth," which dictate how closely the stop loss levels hug the price's highs and lows. The stop loss levels are plotted as lines on the trading chart, providing clear visual cues for position management. As seen in the chart below, this indicator dynamically plots stop loss levels for both long and short positions at every point in time.
A “Stop Loss Table” is also included, in order to enhance precision trading and increase backtesting accuracy. It is customizable in both size and positioning.
Case Study
Methodology
The methodology behind this indicator focuses on the precision placement of stop losses using market structure as a guide. It calculates stop losses by identifying the "lowest close" and the corresponding "lowest low" for long setups, and inversely for short setups. By adjusting the sensitivity settings, traders can tweak the indicator's responsiveness to price changes, ensuring that the stop losses are set with a balance between tight risk control and enough room to avoid premature exits due to market noise. The indicator's ability to adapt to different trading styles and time frames makes it an essential tool for traders aiming for efficiency and effectiveness in their risk management strategies.
An important point to make is the fact that the stop loss levels are always placed within the wicks. This is important to avoid what can be described as a “floating stop loss”. A stop loss placed outside of a wick is susceptible to an outsized degree of slippage. This is because traders always cluster their stop losses at high/low wicks, and a stop loss placed outside of this level will inevitably be caught in a low liquidity cascade or “wash-out.” When price approaches a cluster of stop losses, it is highly probable that you will be stopped out anyway, so it is prudent to attempt to be the trader who gets stopped out first in order to avoid high slippage, and losses above what you originally intended.
// For long positions: stop-loss is slightly inside the lowest wick
float dynamic_SL_Long = lowestClose - (lowestClose - lowestLow) * (1 - WickDepth)
// For short positions: stop-loss is slightly inside the highest wick
float dynamic_SL_Short = highestClose + (highestHigh - highestClose) * (1 - WickDepth)
The percentage depth of the wick in which the stop loss is placed is customisable with the “Wick Depth” variable, in order to customize stop loss strategies around the liquidity of the market a trader is executing their orders in.

Zero-lag TEMA Crosses Strategy[Pakun]Here's the adjusted strategy description in English, aligned with the house rules:
---
### Strategy Name: Zero-lag TEMA Cross Strategy
**Purpose:** This strategy aims to identify entry and exit points in the market using Zero-lag Triple Exponential Moving Averages (TEMA). It focuses on minimizing lag and improving the accuracy of trend-following signals.
### Uniqueness and Usefulness
**Uniqueness:** This strategy employs the less commonly used Zero-lag TEMA, compared to standard moving averages. This unique approach reduces lag and provides more timely signals.
**Usefulness:** This strategy is valuable for traders looking to capture trend reversals or continuations with reduced lag. It has the potential to enhance the profitability and accuracy of trades.
### Entry Conditions
**Long Entry:**
- **Condition:** A crossover occurs where the short-term Zero-lag TEMA surpasses the long-term Zero-lag TEMA.
- **Signal:** A buy signal is generated, indicating a potential uptrend.
**Short Entry:**
- **Condition:** A crossunder occurs where the short-term Zero-lag TEMA falls below the long-term Zero-lag TEMA.
- **Signal:** A sell signal is generated, indicating a potential downtrend.
### Exit Conditions
**Exit Strategy:**
- **Stop Loss:** Positions are closed if the price moves against the trade and hits the predefined stop loss level. The stop loss is set based on recent highs/lows.
- **Take Profit:** Positions are closed when the price reaches the profit target. The profit target is calculated as 1.5 times the distance between the entry price and the stop loss level.
### Risk Management
**Risk Management Rules:**
- This strategy incorporates a dynamic stop loss mechanism based on recent highs/lows over a specified period.
- The take profit level ensures a reward-to-risk ratio of 1.5 times the stop loss distance.
- These measures aim to manage risk and protect capital.
**Account Size:** ¥500,000
**Commissions and Slippage:** 94 pips per trade and 1 pip slippage
**Risk per Trade:** 1% of account equity
### Configurable Options
**Configurable Options:**
- Lookback Period: The number of bars to calculate recent highs/lows.
- Fast Period: Length of the short-term Zero-lag TEMA (69).
- Slow Period: Length of the long-term Zero-lag TEMA (130).
- Signal Display: Option to display buy/sell signals on the chart.
- Bar Color: Option to change bar colors based on trend direction.
### Adequate Sample Size
**Sample Size Justification:**
- To ensure the robustness and reliability of the strategy, it should be tested with a sufficiently long period of historical data.
- It is recommended to backtest across multiple market cycles to adapt to different market conditions.
- This strategy was backtested using 10 days of historical data, including 184 trades.
### Notes
**Additional Considerations:**
- This strategy is designed for educational purposes and should be thoroughly tested in a demo environment before live trading.
- Settings should be adjusted based on the asset being traded and current market conditions.
### Credits
**Acknowledgments:**
- The concept and implementation of Zero-lag TEMA are based on contributions from technical analysts and the trading community.
- Special thanks to John Doe for the TEMA concept.
- Thanks to Zero-lag TEMA Crosses .
- This strategy has been enhanced by adding new filtering algorithms and risk management rules to the original TEMA code.
### Clean Chart Description
**Chart Appearance:**
- This strategy provides a clean and informative chart by plotting Zero-lag TEMA lines and optional entry/exit signals.
- The display of signals and color bars can be toggled to declutter the chart, improving readability and analysis.

BTC Hash Rate to Price RatioDescription:
The BTC Hash Rate to Price Ratio indicator is a sophisticated tool designed to assist traders in identifying potential market turning points for Bitcoin by combining network health, market sentiment, and valuation metrics. This indicator integrates three key components—Hash Rate, RSI (Relative Strength Index), and MVRV (Market Value to Realized Value)—to provide a comprehensive analysis of Bitcoin's market dynamics.
Key Features:
Hash Rate Analysis: Assesses the computational power of the Bitcoin network, reflecting network health and miner confidence. Changes in the hash rate can signal shifts in market sentiment.
RSI (Relative Strength Index): A momentum oscillator that measures the speed and change of price movements, identifying overbought or oversold conditions. Smoothed RSI provides clearer insights into market momentum.
MVRV (Market Value to Realized Value): A valuation metric comparing Bitcoin's market value to its realized value, offering insights into whether Bitcoin is overvalued or undervalued. Smoothed MVRV enhances signal accuracy.
How It Works:
Red Zones (Sell Signals): Highlighted when both the MVRV and RSI are above the hash rate, indicating potential market tops.
Green Zones (Buy Signals): Highlighted when both the MVRV and RSI are below the hash rate and MVRV is under 15, suggesting potential market bottoms.
Customizable Parameters: Allows traders to adjust smoothing periods and signal thresholds, tailoring the indicator to different trading strategies and market conditions.
Visual Aids: Includes dotted lines at key RSI levels (15 and 75) for quick reference to potential overbought and oversold conditions.
Benefits:
Comprehensive Analysis: Combines technical, fundamental, and network metrics to offer a well-rounded perspective on market conditions.
Early Warning Signals: Aims to provide early indications of potential market reversals, helping traders make informed decisions.
Flexibility: Suitable for both short-term and long-term trading strategies, allowing for adaptation to various market environments.
Usage Tips:
Use this indicator in conjunction with other technical analysis tools and fundamental insights for best results.
Consider the broader market context and macroeconomic factors when interpreting signals.
Practice sound risk management techniques to optimize trading performance.
Unlock the potential of your Bitcoin trading strategy with the BTC Hash Rate to Price Ratio indicator, and gain deeper insights into market dynamics to make more informed trading decisions.

No Lag SupertrendNo Lag Supertrend indicator improves upon the original supertrend by incorporating calculation methods that enhance responsiveness and accuracy. Traditional supertrend indicators often suffer from lag, which can delay signals and affect trading decisions. No Lag Supertrend addresses this issue through the use of KAMA (Kaufman’s Adaptive Moving Average) and Hull ATR (Average True Range) calculations.
Goals of No Lag Supertrend:
- Lag reduction: one of the main issues with traditional supertrend indicators is their lag, which can result in delayed entry and exit signals. By integrating KAMA and Hull ATR, the no lag supertrend minimizes this delay, providing more timely signals.
- Market Noise Filtering: The combined use of KAMA and Hull ATR effectively filters out market noise, ensuring that signals are based on significant price movements rather than minor fluctuations.
- Consistency Across Different Market Conditions: The adaptive nature of KAMA and the smooth responsiveness of Hull ATR ensure that the No Lag Supertrend performs consistently across various market conditions, from trending to volatile markets.
Credits: This code is based on the TradingView supertrend but improved the ATR calculations.
Advanced ADX [CryptoSea]The Advanced ADX Analysis is a sophisticated tool designed to enhance market analysis through detailed ADX calculations. This tool is built for traders who seek to identify market trends, strength, and potential reversals with higher accuracy. By leveraging the Average Directional Index (ADX), Directional Indicator Plus (DI+), and Directional Indicator Minus (DI-), this indicator offers a comprehensive view of market dynamics.
New Overlay Feature: This script uses the new 'force overlay' feature which lets you plot on the chart as well as plotting in an oscillator pane at the same time.
force_overlay=true
Key Features
Comprehensive ADX Tracking: Tracks ADX values along with DI+ and DI- to provide a complete view of market trend strength and direction. The ADX measures the strength of the trend, while DI+ and DI- indicate the trend direction. This combined analysis helps traders identify strong and weak trends with precision.
Trend Duration Monitoring: Monitors the duration of strong and weak trends, offering insights into trend persistence and potential reversals. By keeping track of how long the ADX has been above or below a certain threshold, traders can gauge the sustainability of the current trend.
Customizable Alerts: Features multiple alert options for strong trends, weak trends, and DI crossovers, ensuring traders are notified of significant market events. These alerts can be tailored to notify traders when certain conditions are met, such as when the ADX crosses a threshold or when DI+ crosses DI-.
Adaptive Display Options: Includes customizable background color settings and extended statistics display for in-depth market analysis. Users can choose to highlight strong or weak trends on the chart background, making it easier to visualize market conditions at a glance.
In the example below, we have a bullish scenario play out where the DI+ has been above the DI- for 11 candles and our dashboard shows the average is 10.48 candles. With the ADX above its threshold this would be a bullish signal.
This ended up in a 20%+ move to the upside. The dashboard will help point out things to consider when looking to exit the position, the DI+ getting close to the max DI+ duration would be a sign that momentum is weakening and that price may cool off or even reverse.
How it Works
ADX Calculation: Computes the ADX, DI+, and DI- values using a user-defined period. The ADX is derived from the smoothed average of the absolute difference between DI+ and DI-. This calculation helps determine the strength of a trend without considering its direction.
Trend Duration Analysis: Tracks and calculates the duration of strong and weak trends, as well as DI+ and DI- durations. This analysis provides a detailed view of how long a trend has been in place, helping traders assess the reliability of the trend.
Alert System: Provides a robust alert system that triggers notifications for strong trends, weak trends, and DI crossovers. The alerts are based on specific conditions such as the duration of the trend or the crossover of directional indicators, ensuring traders are informed about critical market movements.
Visual Enhancements: Utilizes color gradients and background settings to visually represent trend strength and duration. This feature enhances the visual analysis of trends, making it easier for traders to identify significant market changes at a glance.
In the example below, we see the ADX weakening after we have just had a move up, if you are looking to get into this position you want to see the ADX growing with either the DI+ or DI- breaking their average durations.
As you can see below, although the ADX manages to move above the threshold, there are no DI+/- breaks which is shown by price moving sideways. Not something most traders would be interested in.
Application
Strategic Decision-Making: Assists traders in making informed decisions by providing detailed analysis of ADX movements and trend durations. By understanding the strength and direction of trends, traders can better time their entries and exits.
Trend Confirmation: Reinforces trading strategies by confirming potential reversals and trend strength through ADX and DI analysis. This confirmation helps traders validate their trading signals, reducing the risk of false signals.
Customized Analysis: Adapts to various trading styles with extensive input settings that control the display and sensitivity of trend data. Traders can customize the indicator to suit their specific needs, making it a versatile tool for different trading strategies.
The Advanced ADX Analysis by is an invaluable addition to a trader's toolkit, offering depth and precision in market trend analysis to navigate complex market conditions effectively. With its comprehensive tracking, alert system, and customizable display options, this indicator provides traders with the tools they need to stay ahead of the market.

Uptrick: MACD Slope Buy/Sell SignalsThe "Uptrick: MACD Slope Buy/Sell Signals" indicator is an advanced technical analysis tool meticulously crafted to provide traders with precise buy and sell signals derived from the slope changes of the Moving Average Convergence Divergence (MACD) signal line. This indicator integrates user-defined parameters for the MACD calculation, including the fast length, slow length, and signal smoothing period. These parameters allow traders to customize the indicator according to their specific trading strategies and timeframes, ensuring adaptability across various market conditions.
The primary function of this indicator is to monitor the slope of the MACD signal line and detect significant shifts that indicate potential changes in market momentum. The indicator calculates the slope by comparing the current value of the signal line to its previous value, and further determines the change in slope to identify acceleration or deceleration in the trend. A buy signal is generated when the slope of the signal line transitions from negative to positive, signaling an upward momentum, while a sell signal is triggered when the slope moves from positive to negative, indicating a downward trend. To enhance signal accuracy, the indicator distinguishes between regular and strong signals. A strong buy signal requires the slope change to be greater than the simple moving average (SMA) of recent slope changes, whereas a strong sell signal necessitates the slope change to be less than the negative SMA of recent slope changes.
A unique feature of this indicator is its dynamic and intuitive visualization. When a strong buy or sell signal is identified, it plots labels ('B' for buy and 'S' for sell) directly on the price chart. These labels are strategically positioned below or above the respective bars to ensure clear visibility and reduce chart clutter. The indicator also includes an option to connect consecutive signals with lines, which enhances the visual tracking of signal sequences and provides a coherent view of the trend's progression. The color intensity of the plotted signals varies based on the absolute value of the slope, offering an immediate visual cue on the strength of the detected trend changes. A steeper slope results in a darker color, signaling a stronger trend.
To facilitate comprehensive analysis, the indicator also plots the MACD and signal lines on the chart, providing traders with a reference to the underlying data that drives the buy and sell signals. These lines are color-coded for easy differentiation: the MACD line is typically blue, and the signal line is orange. This visual aid ensures that traders have a clear understanding of the indicator's basis and can cross-reference the generated signals with the MACD behavior.
The calculation of this indicator is grounded in well-established technical analysis principles. It employs the MACD function to derive the MACD line and signal line based on the user-defined parameters. The slope of the signal line is then computed, followed by the calculation of the slope change. The buy and sell signals are determined by comparing the current and previous slopes, and the strong signals are filtered through an additional layer of slope change analysis relative to its moving average.
The accuracy and reliability of the "Uptrick: MACD Slope Buy/Sell Signals" indicator stem from its thorough and methodical approach to signal generation. By combining user customization, detailed slope analysis, and robust visual elements, this indicator serves as a powerful tool for traders seeking precise entry and exit points in the market. Its ability to adapt to different trading styles and market conditions, coupled with its clear visual cues, makes it a valuable addition to any trader's toolkit, enhancing decision-making and improving trading outcomes.

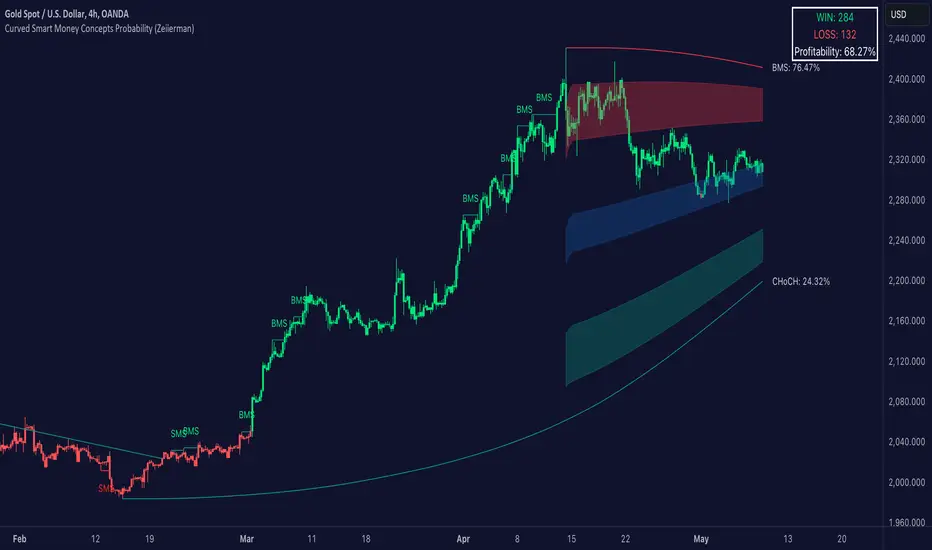
Curved Smart Money Concepts Probability (Zeiierman)█ Overview
The Curved Smart Money Concepts Probability indicator, developed by Zeiierman, is a sophisticated trading tool designed to leverage the principles of Smart Money trading. This indicator identifies key market structure points and adapts to changing market conditions, providing traders with actionable insights into market trends and potential reversals. The trading tool stands out due to its unique curved structure and advanced probability features, which enhance its effectiveness and usability for traders.
█ How It Works
The indicator operates by analyzing market data to identify pivotal moments where institutional investors might be influencing price movements. It employs a combination of adaptive trend lengths, multipliers for sensitivity adjustments, and pivot periods to accurately capture market structure shifts. The indicator calculates upper and lower bands based on adaptive sizes and identifies zones of overbought (premium) and oversold (discount) conditions.
Key Features of Probability Calculations
The Curved Smart Money Concepts Probability indicator integrates sophisticated probability calculations to enhance trading decision-making:
Win/Loss Tracking: The indicator tracks the number of successful (win) and unsuccessful (loss) trades based on the identified market structure points (ChoCH, SMS, BMS). This provides a historical context of the indicator's performance.
Probability Percentages: For each market structure point (ChoCH, SMS, BMS), the indicator calculates the probability of the next move being successful or not. This is presented as a percentage, giving traders a quantifiable measure of confidence in the signals.
Dynamic Adaptation: The probability calculations adapt to market conditions by considering the frequency and success rate of the signals, allowing traders to adjust their strategies based on the indicator’s historical accuracy.
Visual Representation: Probabilities are displayed on the chart, helping traders quickly assess the likelihood of future price movements based on past performance.
Key benefits of the Curved Structure
The Curved Smart Money Concepts Probability indicator features a unique curved structure that offers several advantages over traditional linear structures:
Noise Reduction: The curved structure smooths out short-term market fluctuations, reducing the noise often seen in linear structures. This helps traders focus on the true trend direction rather than getting distracted by minor price movements.
Adaptive Sensitivity: The curved structure adjusts its sensitivity based on market conditions. This means it can effectively capture both short-term and long-term trends by dynamically adapting to changes in market volatility, something linear structures struggle with.
Enhanced Trend Detection: By providing a more gradual transition between market phases, the curved structure helps in identifying trends more accurately. This is particularly useful in volatile markets where linear structures might give false signals due to their rigid nature.
Improved Market Structure Analysis: The curved structure's ability to adapt and smooth out irregularities provides a clearer picture of the overall market structure. This clarity is essential for identifying premium and discount zones, as well as mid-range support and resistance levels, which are crucial for effective ICT Smart Money Trading.
█ Terminology
ChoCH (Change of Character): Indicates a potential reversal in market direction. It is identified when the price breaks a significant high or low, suggesting a shift from a bullish to bearish trend or vice versa.
SMS (Smart Money Shift): Represents the transition phase in market structure where smart money begins accumulating or distributing assets. It typically follows a BMS and indicates the start of a new trend.
BMS (Bullish/Bearish Market Structure): Confirms the trend direction. Bullish Market Structure (BMS) confirms an uptrend, while Bearish Market Structure (BMS) confirms a downtrend. It is characterized by a series of higher highs and higher lows (bullish) or lower highs and lower lows (bearish).
Premium: A zone where the price is considered overbought. It is calculated as the upper range of the current market structure and indicates a potential area for selling or shorting.
Mid Range: The midpoint between the high and low of the market structure. It often acts as a support or resistance level, helping traders identify potential reversal or continuation points.
Discount: A zone where the price is considered oversold. It is calculated as the lower range of the current market structure and indicates a potential area for buying or going long.
█ How to Use
Identifying Trends and Reversals: Traders can use the indicator to identify the overall market trend and potential reversal points. By observing the ChoCH, SMS, and BMS signals, traders can gauge whether the market is transitioning into a new trend or continuing the current trend.
Example Strategies
⚪ Trend Following Strategy:
Identify the current market trend using BMS signals.
Enter a trade in the direction of the trend when the price retraces to the mid-range zone.
Set a stop-loss just below the mid-range (for long trades) or above the mid-range (for short trades).
Take profit in the premium/discount zone or when a ChoCH signal indicates a potential reversal.
⚪ Reversal Strategy:
Wait for a ChoCH signal to identify a potential market reversal.
Enter a trade in the direction of the new trend as indicated by the SMS signal.
Set a stop-loss just beyond the recent high (for short trades) or low (for long trades).
Take profit when the price reaches the premium or discount zone opposite to the entry.
█ Settings
Curved Trend Length: Determines the length of the trend used to calculate the adaptive size of the structure. Adjusting this length allows traders to capture either longer-term trends (for smoother curves) or short-term trends (for more reactive curves).
Curved Multiplier: Scales the adjustment factors for the upper and lower bands. Increasing the multiplier widens the bands, reducing sensitivity to price changes. Decreasing it narrows the bands, making the structure more responsive.
Pivot Period: Sets the period for capturing trends. A higher period captures broader trends, while a lower period focuses on short-term trends.
Response Period: Adjusts the structure’s responsiveness. A low value focuses on short-term changes, while a high value smoothens the structure.
Premium/Discount Range: Allows toggling between displaying the active range or previous range to analyze real-time or historical levels.
Structure Candles: Enables the display of curved structure candles on the chart, providing a modified view of price action.
-----------------
Disclaimer
The information contained in my Scripts/Indicators/Ideas/Algos/Systems does not constitute financial advice or a solicitation to buy or sell any securities of any type. I will not accept liability for any loss or damage, including without limitation any loss of profit, which may arise directly or indirectly from the use of or reliance on such information.
All investments involve risk, and the past performance of a security, industry, sector, market, financial product, trading strategy, backtest, or individual's trading does not guarantee future results or returns. Investors are fully responsible for any investment decisions they make. Such decisions should be based solely on an evaluation of their financial circumstances, investment objectives, risk tolerance, and liquidity needs.
My Scripts/Indicators/Ideas/Algos/Systems are only for educational purposes!
Infinite Impulse Response Filter ForLoop [InvestorUnknown]Overview
The Infinite Impulse Response Filter ForLoop indicator is designed for seeking quick and accurate trend identification. Leveraging the Infinite Impulse Response (IIR) filter technique, this indicator provides fast and responsive signals to aid in market timing and trend following.
User Inputs
Start and End Lengths: Define the range of lengths over which the IIRF values are calculated.
Moving Average Type: Choose from EMA, SMA, WMA, VWMA, or TMA for trend smoothing.
Moving Average Length: Specify the length for the chosen MA type.
Calculation Source: Select the price data used for calculations (default is close price).
Signal Calculation
Signal Mode (sigmode): Determines the type of signal generated by the indicator. Options are "Fast", "Slow", "Thresholds Crossing", and "Fast Threshold".
1. Slow: is a simple crossing of the midline (0).
2. Fast: positive signal depends if the current MA > MA or MA is above 0.99, negative signals comes if MA < MA or MA is below -0.99.
3. Thresholds Crossing: simple ta.crossover and ta.crossunder of the user defined threshold for Long and Short.
4. Fast Threshold: signal changes if the value of MA changes by more than user defined threshold against the current signal
col1 = MA > 0 ? colup : coldn
var color col2 = na
if MA > MA or MA > 0.99
col2 := colup
if MA < MA or MA < -0.99
col2 := coldn
var color col3 = na
if ta.crossover(MA,longth)
col3 := colup
if ta.crossunder(MA,shortth)
col3 := coldn
var color col4 = na
if (MA > MA + fastth)
col4 := colup
if (MA < MA - fastth)
col4 := coldn
color col = switch sigmode
"Slow" => col1
"Fast" => col2
"Thresholds Crossing" => col3
"Fast Threshold" => col4
Visualization Settings
Bull Color (colup): The color used to indicate bullish signals.
Bear Color (coldn): The color used to indicate bearish signals.
Color Bars (barcol): Option to color the bars based on the signal.
Custom function
// Function to calculate an array of IIRF values over a range of lengths
IIRFforLoop(a, b, c, s) =>
// Initialize an array to store IIRF values
var Array = array.new_float(b - a + 1, 0.0)
// Loop over the range from 'a' to 'b'
for x = 0 to (b - a)
// Calculate the length for the current iteration
len = a + x
// Calculate the IIRF alpha parameter
iirfAlpha = 2 / (len + 1)
// Calculate the lag for the IIRF calculation
iirfLag = math.round(1 / iirfAlpha - 1)
// Initialize the IIRF value
iirf = 0.0
// Update the IIRF value using the IIR filter formula
iirf := iirfAlpha * (s + ta.change(s, iirfLag)) + (1 - iirfAlpha) * nz(iirf )
// Determine the trend based on the current and previous IIRF values
trend = iirf > iirf ? 1 : -1
// Store the trend value in the array
array.set(Array, x, trend)
// Calculate the average of the IIRF values in the array
Avg = array.avg(Array)
// Calculate the moving average of the average IIRF values based on the selected MA type
float MA = switch maType
"EMA" => ta.ema(Avg, c) // Exponential Moving Average
"SMA" => ta.sma(Avg, c) // Simple Moving Average
"WMA" => ta.wma(Avg, c) // Weighted Moving Average
"VWMA" => ta.vwma(Avg, c) // Volume Weighted Moving Average
"TMA" => ta.trima(Avg, c) // Triangular Moving Average
=>
runtime.error("No matching MA type found.") // Error handling for invalid MA type
float(na)
// Return the array of IIRF values, their average, and the moving average
Important Considerations
Rapid Signal Response: The IIRF ForLoop is designed to provide very fast trend signals, making it suitable for short-term trading and quick decision-making.
Complementary Tool: While powerful, the IIRF ForLoop should be used in conjunction with other indicators and market analysis techniques to confirm signals and improve trading accuracy.
Conclusion
The Infinite Impulse Response Filter ForLoop indicator is a highly responsive and flexible tool that can significantly enhance your trading strategy. Its ability to quickly identify trends and generate signals based on various moving average types and customizable thresholds makes it invaluable for active traders. For the best results, use this indicator alongside other technical analysis tools to confirm signals and ensure robust trading decisions.

RV - Relative Strength Index Buy/SellIntroduction
The RV - RSI B/S V1.2 indicator leverages the RSI to identify overbought and oversold conditions in the market. The RSI line color changes according to bullish, bearish, oversold, and overbought zones, helping users identify direction and avoid false trades. By plotting the RSI along with user-defined moving averages and Bollinger Bands, it offers a multi-faceted approach to analyzing market momentum.
Indicator Overview
The indicator RSI line color changes as per the bullish, bearish, oversold, and overbought zones. This helps users find out the direction and the zones. The oversold and overbought zones are colored to help users avoid false trades.
Trading Strategy
Long Trades (Bullish Setup):
Entry: A long trade is initiated when the RSI crosses from 60 up to 80.
Exit: Long trades are generally exited when the RSI is between 80 and 90.
Condition: No long trades are taken if the RSI exceeds 80.
Short Trades (Bearish Setup):
Entry: A short trade is initiated when the RSI crosses from 40 down to 20.
Exit: Short trades are generally exited when the RSI is between 20 and 10.
Condition: No short trades are taken if the RSI falls below 20.
RSI Color Coding and Interpretation
The RV - RSI B/S V1.2 indicator uses color coding to provide a visual representation of RSI values, making it easier to identify critical levels at a glance:
Green (RSI 60-80): Indicates a bullish zone where long trades can be considered.
Red (RSI > 80): Signals an overbought condition where long trades should be avoided.
Orange (RSI 20-40): Indicates a bearish zone where short trades can be considered.
Pink (RSI < 20): Signals an oversold condition where short trades should be avoided.
RSI Settings and Their Importance
RSI Length: The default length is set to 12, which is the standard period for RSI calculation. This setting can be adjusted to increase or decrease sensitivity.
Source: The source of the data for the RSI calculation is typically the closing price.
MA Type: Various moving averages can be applied to the RSI, including SMA, EMA, SMMA (RMA), WMA, and VWMA. Each type offers different smoothing properties and can be selected based on
trading preferences.
MA Length: The default length is set to 20, aligning with the RSI length for consistency.
Bollinger Bands: When using Bollinger Bands, the standard deviation multiplier is set to 2.0 by default, but it can be adjusted to suit different volatility conditions.
Disclaimer
This indicator provides valuable signals for potential trading opportunities based on RSI levels and moving averages. However, it is crucial to incorporate directional price action analysis to confirm signals and improve trading accuracy. The RV - RSI B/S V1.2 should be used as part of a broader trading strategy, considering other technical and fundamental factors.

MTF WaveTrend [CryptoSea]The MTF WaveTrend Indicator is a sophisticated tool designed to enhance market analysis through multi-timeframe WaveTrend calculations. This tool is built for traders who seek to identify market momentum and potential reversals with higher accuracy.
In the example below, we can see all the choosen timeframes agree on bearish momentum.
Key Features
Multi-Timeframe WaveTrend Analysis: Tracks WaveTrend values across multiple timeframes to provide a comprehensive view of market momentum.
Customizable Colour Rules: Offers three different colour rules (Traditional, WT1 0 Rule, WT1 & WT2 0 Rule) to suit various trading strategies.
Timeframe Visibility Control: Allows users to enable or disable specific timeframes, providing flexibility in analysis.
Clear Visual Indicators: Uses color-coded squares and labels to clearly display WaveTrend status across different timeframes.
Candle Colouring Option: Includes a setting for neutral candle coloring to enhance chart readability.
This example shows what can happen when all timeframes start alligning with eachother.
How it Works
WaveTrend Calculation: Computes the WaveTrend oscillator by applying a series of exponential moving averages and scaling calculations.
Multi-Timeframe Data Aggregation: Utilizes the `request.security` function to gather and display WaveTrend values from various timeframes without repainting issues.
Conditional Plotting: Displays visual cues only when higher timeframes align with the selected timeframe, ensuring relevant and reliable signals.
Dynamic Colour Rules: Adjusts the indicator colors based on the chosen rule, whether it's a traditional crossover, WT1 crossing zero, or both WT1 & WT2 crossing zero.
Traditional: Colors are determined by the relationship between WT1 and WT2. If WT1 is greater than WT2, it is bullish (bullColour), otherwise bearish (bearColour).
WT1 0 Rule: Colors are based on whether WT1 is above or below zero. WT1 above zero is bullish (bullColour), below zero is bearish (bearColour).
WT1 & WT2 0 Rule: A more complex rule where both WT1 and WT2 need to be above zero for a bullish signal (bullColour) or both below zero for a bearish signal (bearColour). If WT1 and WT2 are not in agreement, a neutral color (neutralColour) is displayed.
This indicator will make sure that the lowest timeframe you can see data from will be the timeframe you are on. This is to avoid false signals as you cannot display 3 x 5 minute candles whilst looking at the 15 minute candle.
Application
Strategic Decision-Making: Assists traders in making informed decisions by providing detailed analysis of WaveTrend movements across different timeframes.
Trend Confirmation: Reinforces trading strategies by confirming potential reversals with multi-timeframe WaveTrend analysis.
Customized Analysis: Adapts to various trading styles with extensive input settings that control the display and sensitivity of WaveTrend data.
The MTF WaveTrend Indicator by is an invaluable addition to a trader's toolkit, offering depth and precision in market trend analysis to navigate complex market conditions effectively.
Supertrend + BB + Consecutive Candles + QQE + EMA [Pineify]Overview
This indicator, developed by Pineify, is a comprehensive tool designed to assist traders in making informed decisions by combining multiple technical analysis methods. It integrates Supertrend, Bollinger Bands (BB), Consecutive Candles, Quantitative Qualitative Estimation (QQE), and Exponential Moving Averages (EMA) into a single, cohesive script. This multi-faceted approach allows traders to analyze market trends, volatility, and potential buy/sell signals with greater accuracy.
Key Features
1. Supertrend: Utilizes the Supertrend indicator to identify the prevailing market trend. It provides clear buy and sell signals based on the direction of the trend.
2. Bollinger Bands (BB): Measures market volatility and identifies overbought or oversold conditions. The script calculates the middle, upper, and lower bands, along with the Bollinger Band Width (BBW) and Bollinger Band %B (BBR).
3. Consecutive Candles: Detects sequences of consecutive bullish or bearish candles, providing signals when a specified number of consecutive candles are detected.
4. Quantitative Qualitative Estimation (QQE): Combines the Relative Strength Index (RSI) with a smoothing factor to generate buy and sell signals based on the QQE methodology.
5. Exponential Moving Averages (EMA): Includes both fast and slow EMAs to identify potential crossovers, which are used as buy and sell signals.
How It Works
- Supertrend: The Supertrend indicator is calculated using a factor and ATR length. It plots the trend direction and generates buy/sell signals when the trend changes.
- Bollinger Bands: The BB indicator calculates the middle band as a Simple Moving Average (SMA) of the closing prices. The upper and lower bands are derived by adding and subtracting a multiple of the standard deviation from the middle band.
- Consecutive Candles: This feature counts the number of consecutive candles that close higher or lower than the previous candle. When the count reaches a specified threshold, it generates a buy or sell signal.
- QQE: The QQE indicator smooths the RSI values and calculates the QQE Fast and QQE Slow lines. Buy and sell signals are generated based on the crossover of these lines.
- EMA: The script calculates fast and slow EMAs and generates buy/sell signals based on their crossovers.
How to Use
1. Inputs: Customize the indicator settings through the input parameters:
- Supertrend Factor and ATR Length
- BB Length
- Consecutive Candles Counting
- QQE RSI Length
- Fast and Slow EMA Lengths
- Enable/Disable Alerts for various signals
2. Alerts: Set up alerts for Supertrend, Consecutive Candles, and EMA crossovers. Alerts can be enabled or disabled based on user preference.
3. Visualization: The indicator plots the Supertrend, Bollinger Bands, and EMA lines on the chart. It also marks buy and sell signals with arrows and labels for easy identification.
Concepts Underlying Calculations
- Supertrend: Based on the Average True Range (ATR) to determine the trend direction and potential reversal points.
- Bollinger Bands: Utilizes standard deviation to measure market volatility and identify overbought/oversold conditions.
- Consecutive Candles: A method to detect momentum by counting consecutive bullish or bearish candles.
- QQE: Enhances the traditional RSI by smoothing it and using a dynamic threshold to generate signals.
- EMA: A widely used moving average that gives more weight to recent prices, making it responsive to market changes.
This indicator is a powerful tool for traders looking to combine multiple technical analysis methods into a single, easy-to-use script. By integrating these diverse techniques, it provides a comprehensive view of market conditions and potential trading opportunities.

Standard Error Bands**Standard Error Bands Indicator: A Statistically Robust Tool for Trend Analysis**
The Standard Error Bands (SEB) indicator is a powerful technical analysis tool designed to help traders identify and assess trends with greater accuracy. Unlike traditional band indicators (e.g., Bollinger Bands) that rely on price averages, SEB leverages linear regression and statistical measures of volatility to offer deeper insights into market dynamics.
**How It Works**
1. **Linear Regression:** The indicator first calculates a linear regression line to model the underlying price trend. This line represents the "best fit" of price data over the specified lookback period.
2. **Standard Error:** Next, it calculates the standard error of the regression. This statistical measure quantifies the average distance between actual prices and the regression line, effectively acting as a volatility gauge.
3. **Smoothing:** Both the linear regression line and the standard error values are smoothed using a Simple Moving Average (SMA) to reduce noise and enhance the visual clarity of the bands.
4. **Band Construction:** The upper and lower bands are formed by adding/subtracting a multiple of the smoothed standard error from the smoothed linear regression line. The default multiplier is 2, representing approximately 95% of price action expected within the bands under normal market conditions.
**Key Insights**
* **Trend Strength:** Tight bands suggest a strong, well-defined trend with low volatility. Prices tend to adhere closely to the regression line, indicating a high probability of trend continuation.
* **Trend Weakness/Change:** Widening or expanding bands signal increased volatility and potential trend weakness. Prices deviating from the regression line may suggest an impending trend reversal or a shift into a sideways consolidation phase.
* **Entry/Exit Signals:**
* Consider entering a trade when prices break out of the bands in the direction of the trend, especially if the bands were previously tight.
* Conversely, consider exiting a trade when prices pierce the bands against the trend or when the bands start to widen significantly.
**Use Cases**
* **Trend Identification:** SEB can help traders identify trends earlier and more accurately than moving average-based indicators.
* **Trend Confirmation:** The bands can be used to confirm the validity and strength of an existing trend.
* **Volatility Assessment:** Changes in band width provide valuable insights into market volatility, aiding risk management decisions.
* **Entry/Exit Timing:** SEB can be incorporated into trading strategies to generate timely entry and exit signals.
**Important Considerations**
* **Parameter Optimization:** Experiment with different lookback periods, smoothing values, and standard error multipliers to find the optimal settings for your preferred trading style and market conditions.
* **Supplementary Indicators:** Combine SEB with other technical indicators (e.g., momentum oscillators, volume analysis) for a more comprehensive market assessment.
* **Backtesting:** Thoroughly backtest any SEB-based trading strategy to ensure its effectiveness before deploying it in live markets.
**Disclaimer:** Technical indicators like SEB are valuable tools but should not be used in isolation. Always consider price action or fundamental factors and risk management principles when making trading decisions.

[Pandora] Error Function Treasure Trove - ERF/ERFI/Sigmoids+PRAISE:
At this time, I have to graciously thank the wonderful minds behind the new "Pine Profiler Mode" (PPM). Directly prior to this release, it allowed me to ascertain script performance even more. While I usually write mostly in highly optimized Pine code, PPM visually identified a few bottlenecks that would otherwise be hard to identify. Anyone who contributed to PPMs creation and testing before release... BRAVO!!! I commend all of those who assisted in it's state-of-the-art engineering and inception, well done!
BACKSTORY:
This script is specifically being released in defense of another member, an exceptionally unique PhD. It was brought to my attention that a script-mod-event occurred, regarding the publishing of a measly antiquated error function (ERF) calculation within his script. This sadly resulted in the now former member jumping ship after receiving unmannerly responses amidst his curious inquiries as to why his erf() was modded. To forbid rusty and rudimentary formulations because a mod-on-duty is temporally offended by a non-nefarious release of code, is in MY opinion an injustice to principles of perpetuating open-source code intended to benefit thousands to millions of community members. While Pine is the heart and soul of TV, the mathematical concepts contributed from the minds of members is the inspirational fuel of curiosity that powers it's pertinent reason to exist and evolve.
It is an indisputable fact that most members are not greatly skilled Pine Poets. Many members may be incapable of innovating robust function code in Pine, even if they have one or more PhDs. We ALL come from various disciplines of mathematical comprehension and education. Some mathematicians are not greatly skilled at coding, while some coders are not exceptional at math. So... what am I to do to attempt to resolve this circumstantial challenge??? Those who know me best are aware that I will always side with "the right side of history" in order to accomplish my primary self-defined missions I choose to accept. Serving as an algorithmic advocate, I felt compelled to intercede by compiling numerous error functions into elegant code of very high caliber that any and every TV member may choose to employ, so this ERROR never happens again.
After weeks of contemplation into algorithms I knew little about, I prioritized myself to resolve an unanticipated matter by creating advanced formulas of exquisitely crafted error functions refined to the best of my current abilities. My aversion for unresolved problems motivated me to eviscerate error function insufficiencies with many more rigid formulations beyond what is thought to exist. ERF needed a proper algorithmic exorcism anyways. In my furiosity, I contemplated an array of madMAXimum diplomatic demolition methods, choosing the chain saw massacre technique to slaughter dysfunctionalities I encountered on a battered ERF roadway. This resulted in prolific solutions that should assuredly endure the test of time. Poetically, as you will come to see, I am ripping the lid off of Pandora's box of error functions in this case to correct wrongs into a splendid bundle of rights for members.
INTENTION:
Error function (ERF) enthusiasts... PREPARE FOR GLORY!! The specific purpose of this script is to deprecate classic error functions with the creation of a fierce and formidable army of superior formulations, each having varying attributes of computational complexity with differing absolute error ranges in their results for multiple compute scenarios. This is NOT an indicator... It is intended to allow members to embark on endeavors to advance the profound knowledge base of this growing worldwide community of 60+ million inquisitive minds. For those of you who believe computational mathematics and statistics is near completion at its finest; I am here to inform you, this is ridiculous to ponder. We are no where near statistical excellence that can and will exist eventually. At this time, metaphorically speaking, we are merely scratching microns off of the surface of the skin of a statistical apple Isaac Newton once pondered.
THIS RELEASE:
Following weeks of pondering methodical experiments beyond the ordinary, I am liberating these wild notions of my error function explorations to the entire globe as copyleft code, not just Pine. This Pandora's basket of ERFs is being openly disclosed for the sake of the sanctity of mathematics, empirical science (not the garbage we are told by CONTROLocrats to blindly trust), revolutionary cutting edge engineering, cosmology, physics, information technology, artificial intelligence, and EVERY other mathematical branch of human knowledge being discovered over centuries. I do believe James Glaisher would favor my aims concerning ERF aspirations embracing the "Power of Pine".
The included functions are intended for TV members to use in any way they see fit. This is a gift to ALL members to foster future innovative excellence on this platform. Any attempt to moderate this code without notification of "self-evident clear and just cause" will be considered an irrevocable egregious action. The original foundational PURPOSE of establishing script moderation (I clearly remember) was primarily to maintain active vigilance over a growing community against intentional nefarious actions and/or behaviors in blatant disrespect to other author's works AND also thwart rampant copypasting bandit operations, all while accommodating balanced principles of fairness for an educational community cause via open source publishing that should support future algorithmic inventions well beyond my lifespan.
APPLICATIONS:
The related error functions are used in probability theory, statistics, and numerous and engineering scientific disciplines. Its key characteristics and applications are innumerable in computational realms. Its versatility and significance make it a fundamental tool in arenas of quantitative analysis and scientific research...
Probability Theory - Is widely used in probability theory to calculate probabilities and quantiles of the normal distribution.
Statistics - It's related to the Gaussian integral and plays a crucial role in statistics, especially in hypothesis testing and confidence interval calculations.
Physics - In physics, it arises in the study of diffusion equations, quantum mechanics, and heat conduction problems.
Engineering - Applications exist in engineering disciplines such as signal processing, control theory, and telecommunications.
Error Analysis - It's employed in error analysis and uncertainty quantification.
Numeric Approximations - Due to its lack of a closed-form expression, numerical methods are often employed to approximate erf/erfi().
AI, LLMs, & MACHINE LEARNING:
The error function (ERF) is indispensable to various AI applications, particularly due to its relation to Gaussian distributions and error analysis. It is used in Gaussian processes for regression and classification, probabilistic inference for Bayesian networks, soft margin computation in SVMs, neural networks involving Gaussian activation functions or noise, and clustering algorithms like Gaussian Mixture Models. Improved ERF approximations can enhance precision in these applications, reduce computational complexity, handle outliers and noise better, and improve optimization and convergence, possibly leading to more accurate, efficient, and robust AI systems.
BONUS ALGORITHMS:
While ERFs are versatile, its opposite also exists in the form of inverse error functions (ERFIs). I have also included a modified form of the inverse fisher transform along side MY sigmoid (sigmyod). I am uncertain what sigmyod() may be used for, but it's a culmination of my examinations deep into "sigmoid domains", something I am fascinated by. Whatever implications it may possess, I am unveiling it along with it's cousin functions. For curious minds, this quality of composition seen here is ideally what underlies what I would term "Pandora functionality" that empowers my Pandora indication. I go through hordes of formulations, testing, and inspection to find what appears to be the most beneficial logical/mathematical equation to apply...
SCRIPT OPERATION:
To showcase the characteristics and performance of my ERF/ERFI formulations, I devised a multi-modal script. By using bar_index , I generated a broad sequence of numeric values to input into the first ERF/ERFI parameter. These sequences allow you to inspect the contours of the error function's outputs for both ERF and ERFI. When combined with compute-intensive precision functions (CIPFs), the polynomial function output values can be subtracted from my CIPFs to obtain results of absolute error, displaying the accuracy of the many polynomial estimation functions I tuned in testing for Pine's float environment.
A host of numeric input settings are wildly adjustable to inspect values/curvatures across the range of numeric input sequences. Very large numbers, such as Divisor:100,000,100/Offset:200,000,000 for ERF modes or... Divisor:100,000,100/Offset:100,000,000 for ERFI modes, will display miniscule output values calculated from input values in close proximity to 0.0 for the various estimates, similar to a microscope. ERFI approximations very near in proximity to +/-1.0 will always yield large deviations of absolute error. Dragging/zooming your chart or using the Offset input will aid with visually clipping off those ERFI extremes where float precision functions cannot suffice.
NOTICE:
perf() and perfi() are intended for precision computation (as good as it basically gets) in a float environment. However, they are CPU intensive (especially perfi). I wouldn't recommend these being used in ANY Pine script unless it's an "absolute necessity" to do so to accomplish your goal. I only built them to obtain "absolute error curvatures" of the error functions for the polynomial approximations. These are visible in the accuracy modes in the indicator Settings.
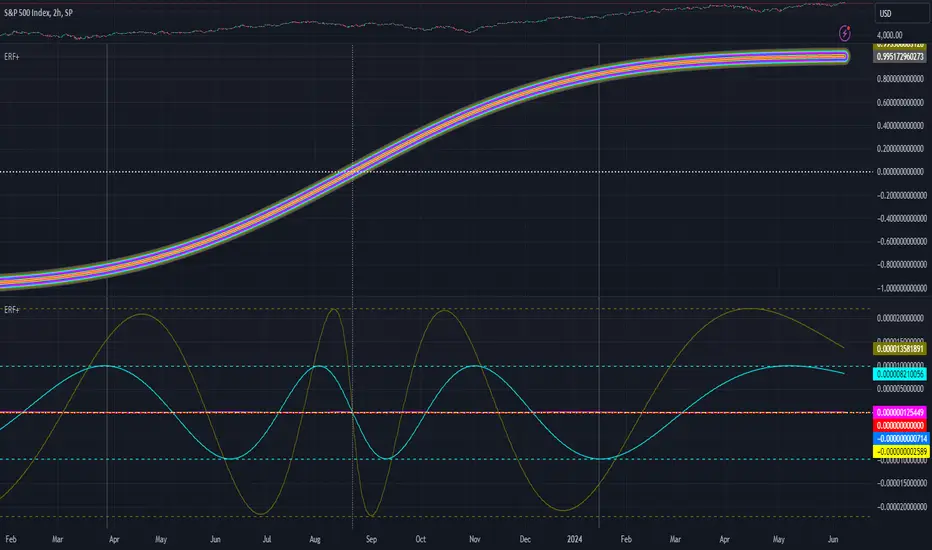
Advanced Fractal and Hurst IndicatorAdvanced Fractal and Hurst Indicator (AFHI)
Description:
The Advanced Fractal and Hurst Indicator (AFHI) is a custom technical analysis tool designed to identify market trends and potential reversals by leveraging the concepts of Fractal Dimension and the Hurst Exponent . These advanced mathematical concepts provide insights into the complexity and persistence of price movements, making this indicator a powerful addition to any trader's toolkit.
How It Works:
Fractal Dimension (FD) :
The Fractal Dimension measures the complexity of price movements. A higher Fractal Dimension indicates a more complex, choppy market, while a lower value suggests smoother trends.
The FD is calculated using the log difference of price movements over a specified length.
Hurst Exponent (HE) :
The Hurst Exponent indicates the tendency of a time series to either regress to the mean or cluster in a direction. Values below 0.5 indicate a tendency to revert to the mean (mean-reverting), while values above 0.5 suggest a trending market.
The HE is calculated using the rescaled range method, comparing the range of price movements to the standard deviation.
Composite Indicator :
The Composite Indicator combines the smoothed Fractal Dimension and Hurst Exponent to provide a single value indicating market conditions. This is done by normalizing the FD and HE values and combining them into one metric.
A positive Composite Indicator suggests an uptrend, while a negative value indicates a downtrend.
Smoothing :
Both FD and HE values are smoothed using a simple moving average to reduce noise and provide clearer signals.
Trend Confirmation :
A 50-period moving average (MA) is used to confirm the trend direction. The price being above the MA indicates an uptrend, while below the MA indicates a downtrend.
Background Shading :
The indicator pane is shaded green during uptrend conditions (positive Composite Indicator and price above MA) and red during downtrend conditions (negative Composite Indicator and price below MA).
How Traders Can Use It:
Identifying Trends :
Traders can use the AFHI to identify current market trends. The background shading in the indicator pane provides a visual cue for trend direction, with green indicating an uptrend and red indicating a downtrend.
Trend Confirmation :
The Composite Indicator line, plotted in purple, helps confirm the trend. Positive values suggest a strong uptrend, while negative values indicate a strong downtrend.
Entry and Exit Signals :
Traders can use the transitions of the Composite Indicator and the background shading to time their entry and exit points. For instance, a shift from red to green shading suggests a potential buy opportunity, while a shift from green to red suggests a potential sell opportunity.
Alerts :
The script includes alert conditions that can notify traders when the Composite Indicator signals a new trend direction. Alerts can be set up for both uptrends and downtrends, helping traders stay informed of key market changes.
Strategy Development :
By integrating AFHI into their trading strategies, traders can develop more robust systems that account for market complexity and persistence. The indicator can be used alongside other technical tools to enhance decision-making and improve trade accuracy.

Leading MACDThe Moving Average Convergence Divergence (MACD) indicator is one of the most popular and versatile tools used by traders to identify potential buy and sell signals. It helps traders determine the strength and direction of a trend by comparing different moving averages of a security's price. The traditional MACD uses two exponential moving averages (EMAs), a fast EMA (typically 12 periods) and a slow EMA (typically 26 periods), along with a signal line (typically a 9-period EMA of the MACD line) to generate trading signals.
Our "Custom MACD with Leading Length" script for TradingView enhances the traditional MACD by introducing an additional smoothing factor called the "leading length." This customization aims to reduce noise and provide a potentially earlier indication of trend changes, making it a valuable tool for traders seeking to optimize their trading strategies.
- **Purpose:** This additional smoothing factor is designed to reduce noise and provide a potentially leading signal, enhancing the accuracy of trend identification.
## How It Works
1. **Calculate the MACD Line:**
The MACD line is calculated by subtracting the slow EMA from the fast EMA. This difference represents the convergence or divergence between the two EMAs.
2. **Calculate the Signal Line:**
The signal line is an EMA of the MACD line. This additional smoothing helps to generate clearer buy and sell signals based on crossovers with the MACD line.
3. **Calculate the Histogram:**
The histogram represents the difference between the MACD line and the signal line. It visually indicates the strength and direction of the trend. A positive histogram suggests a bullish trend, while a negative histogram indicates a bearish trend.
4. **Apply Leading Length Smoothing:**
To incorporate the leading length, the script applies a simple moving average (SMA) to both the MACD and signal lines using the leading length parameter. This additional smoothing helps to further reduce noise and potentially provides earlier signals of trend changes.
## Benefits of the Leading MACD
### Reduced Noise
The leading length parameter adds an extra layer of smoothing to the MACD and signal lines, helping to filter out market noise. This can be particularly beneficial in volatile markets, where frequent price fluctuations can generate false signals.
### Potential Early Signals
By smoothing the MACD and signal lines, the leading length can help to provide earlier indications of trend changes. This can give traders a potential edge in entering or exiting trades before the broader market reacts.
### Enhanced Trend Identification
The combination of the traditional MACD with the leading length smoothing can enhance the accuracy of trend identification. Traders can use this tool to confirm the strength and direction of trends, making it easier to make informed trading decisions.
### Versatility
The Custom MACD with Leading Length can be applied to various timeframes and asset classes, including stocks, forex, commodities, and cryptocurrencies. Its adaptability makes it a valuable tool for traders with different strategies and preferences.
## Practical Applications
### Buy Signal
A typical buy signal occurs when the MACD line crosses above the signal line. With the additional smoothing provided by the leading length, traders might receive this signal slightly earlier, allowing them to enter a long position sooner. This can be particularly advantageous in capturing the beginning of a bullish trend.
### Sell Signal
Conversely, a sell signal is generated when the MACD line crosses below the signal line. The leading length smoothing can help to provide this signal earlier, enabling traders to exit a long position or enter a short position before the trend reversal is fully recognized by the market.
### Divergence Analysis
Traders can also use the Custom MACD with Leading Length for divergence analysis. Bullish divergence occurs when the price makes a new low, but the MACD line forms a higher low. This suggests that the downward momentum is weakening, potentially leading to a bullish reversal. Bearish divergence is the opposite, where the price makes a new high, but the MACD line forms a lower high, indicating a potential bearish reversal.
### Confirmation Tool
The Custom MACD with Leading Length can be used in conjunction with other technical indicators to confirm trading signals. For example, traders might use it alongside support and resistance levels, trendlines, or other momentum indicators to validate their trade entries and exits.
## Conclusion
The Custom MACD with Leading Length is a powerful enhancement of the traditional MACD indicator. By introducing an additional smoothing factor, it aims to reduce noise and provide earlier signals of trend changes. This makes it a valuable tool for traders seeking to improve their market analysis and trading strategies.
Whether you are a day trader, swing trader, or long-term investor, the Custom MACD with Leading Length can help you make more informed decisions by offering clearer insights into market trends. Its adaptability to different timeframes and asset classes further enhances its utility, making it a versatile addition to any trader's toolkit.
Experiment with the parameters to find the optimal settings that suit your trading style and preferences. Use the Custom MACD with Leading Length to gain a deeper understanding of market dynamics and enhance your trading performance.
OrderFlow Absorption IndicatorWhat it Does
The OrderFlow Absorption Indicator marks areas where the price absorbs a large volume of aggressive market trades. This indicates areas where price may bounce back due to large limit (resting) orders absorbing significant aggressor volume (market orders). Absorption can also be seen as "preventing" or "stopping" the other side from breaking through a price level (e.g. bids stopping an influx of sell market orders). Absorption may signal a change in sentiment, potentially leading to a pullback or reversal.
An Example of Absorption
Of course, it is not always the case that such bullish absorption will initiate a trend as the example above. The OrderFlow Absorption Indicator merely serves as a tool for spotting possible absorption points in the market which you can incorporate into your trading arsenal.
How it Works
The indicator actively monitors price changes and records volume accumulated at a price level. If the price bounces back to at least where it was before the current price move, the indicator records this as absorption, provided it meets the Volume Requirement and optional Time Requirement.
How to Use it
1. Set Parameters
Choose your desired tick size and volume filter value. If unsure, refer to the table on the top right of the chart for recommended values. An automatic volume limit filter mode is also available.
Automatic Limit Mode : Enable this mode to have the indicator automatically select a volume filter value. It calculates the standard deviation of the last n minutes of volume and multiplies it by a volume multiplier. You can adjust these parameters.
Higher Volume Filter : Setting a higher volume filter value results in fewer, but higher quality detections, reducing noise.
2. Enabling the Time Limit
Enabling the time limit further improves detection quality by filtering out price levels that can defend against quick, sudden aggressive orders, acting as confirmation and indicating strong sentiment and resilient liquidity.
3. Enabling Historical Data Absorption
The indicator can also detect absorption in historical data, though less accurately than in real-time due to OHLCV aggregation.
You can select the granularity of historical data.
Lower granularity (e.g., 1 second) : Provides more accurate detections but may slow down the indicator.
Higher granularity : Improves speed but reduces detection accuracy.
Other Features
Hovering : When hovering over an absorption point, the interface reveals the price where the absorption occurred, along with the volume absorbed by the bids and asks, as well as the volume filter value used.
Delta Mode : In Delta mode, the system calculates the difference between the volume absorbed by bids and asks, revealing points only when the absolute value of this difference exceeds the volume filter value. Especially useful for larger tick sizes.
Troubleshooting
If the indicator doesn't mark anything, it means the traded volume hasn't exceeded the set volume filter value within the specified price intervals(tick size) and time limit. Adjust these settings as necessary.
Volume Breaker Blocks [UAlgo]The "Volume Breaker Blocks " indicator is designed to identify breaker blocks in the market based on volume and price action. It is a concept that emerges when an order block fails, leading to a change in market structure. It signifies a pivotal point where the market shifts direction, offering traders opportunities to enter trades based on anticipated trend continuation.
🔶 Key Features
Identifying Breaker Blocks: The indicator identifies breaker blocks by detecting pivot points in price action and corresponding volume spikes.
Breaker Block Sensitivity: Traders can adjust breaker block detection sensitivity, length to be used to find pivot points.
Mitigation Method (Close or Wick): Traders can choose between "Close" and "Wick" as the mitigation method. This choice determines whether the indicator considers closing prices or wicks in identifying breaker blocks. Selecting "Close" implies that breaker blocks will be considered broken when the closing price violates the block, while selecting "Wick" implies that the wick of the candle must violate the block for it to be considered broken.
Show Last X Breaker Blocks: Users can specify how many of the most recent breaker blocks to display on the chart.
Visualization: Volume breaker blocks are visually represented on the chart with customizable colors and text labels, allowing for easy interpretation of market conditions. Each breaker block is accompanied by informational text, including whether it's bullish or bearish and the corresponding volume, aiding traders in understanding the significance of each block.
🔶 Disclaimer
Educational Purpose: The "Volume Breaker Blocks " indicator is provided for educational and informational purposes only. It does not constitute financial advice or a recommendation to engage in trading activities.
Risk of Loss: Trading in financial markets involves inherent risks, including the risk of loss of capital. Users should carefully consider their financial situation, risk tolerance, and investment objectives before engaging in trading activities.
Accuracy Not Guaranteed: While the indicator aims to identify potential reversal points in the market, its accuracy and effectiveness may vary. Users should conduct thorough testing and analysis before relying solely on the indicator for trading decisions.
Past Performance: Past performance is not indicative of future results. Historical data and backtesting results may not accurately reflect actual market conditions or future performance.

Advanced Stochastic [CryptoSea]The Advanced Stochastic Indicator is a sophisticated tool designed to enhance market analysis through detailed stochastic calculations. This tool is built for traders who seek to identify market divergences and pivot points with higher accuracy.
Key Features
Multi-Layer Stochastic Analysis: Tracks both standard and smoothed stochastic values to provide a granular view of market momentum.
Divergence Detection: Automatically detects both regular and hidden bullish and bearish divergences, offering critical insights into potential market reversals.
Adaptive Oscillator Display: Features customizable display options for the stochastic oscillator, allowing traders to view data in Default, Histogram, or Both modes.
Customizable Lookback Periods: Users can set specific lookback periods for divergence analysis and stochastic calculations, tailoring the tool to fit various trading strategies.
In the example below, there is a bearish divergence above 0. You would first want the stoch to break below the 0 level as a show of strength, this would be an aggressive entry, a higher probability option would be to wait for the stoch to retest and reject from 0 which is what we have a few candles later.
How it Works
Stochastic Calculation: Computes the stochastic oscillator by smoothing the %K line over a user-defined period, then applying a second smoothing for the %D line.
Pivot Point Analysis: Utilizes advanced algorithms to find low and high pivot points based on the oscillator values, crucial for spotting trend reversals.
Colour-Coded Divergence Alerts: Utilizes color codes to highlight divergence signals directly on the chart, aiding in quick visual analysis.
Responsive Threshold Settings: Includes options to adjust the sensitivity of divergence detection, ensuring that only significant divergences are highlighted.
In the example below, we have 2 divergence signals. The first a bullish one which fails to break above 0. The second signal is given above 0 so you would want a retest and a show of strength when the stoch returns to 0 but it fails to hold. Both of these divergence signals are invalidated.
Application
Strategic Decision-Making: Assists traders in making informed decisions by providing detailed analysis of stochastic movements and divergence.
Trend Confirmation: Reinforces trading strategies by confirming potential reversals with pivot point detection and divergence analysis.
Customized Analysis: Adapts to various trading styles with extensive input settings that control the display and sensitivity of oscillator data.
The Advanced Stochastic Indicator by is an invaluable addition to a trader's toolkit, offering depth and precision in market trend analysis to navigate complex market conditions effectively.

Multiple MAs Signals with RSI MA Filter & Signal About the Script
The "Multiple Moving Averages Signals with RSI MA Filter and Golden Signals" script is a comprehensive trading tool designed to provide traders with detailed insights and actionable signals based on multiple moving averages and RSI (Relative Strength Index). This script combines traditional moving average crossovers with RSI filtering to enhance the accuracy of trading signals and includes "golden" signals to highlight significant long-term trend changes.
This script integrates several technical indicators and concepts to create a robust and versatile trading tool. Here's why this combination is both original and useful:
1. Multiple Moving Averages:
- Why Use Multiple MAs: Different types of moving averages (SMA, EMA, SMMA, WMA, VWMA, Hull) offer unique perspectives on price trends and volatility. Combining them allows traders to capture a more comprehensive view of the market.
- Purpose: Using multiple moving averages helps identify trend direction, support/resistance levels, and potential reversal points.
2. RSI MA Filter:
- Why Use RSI: RSI is a momentum oscillator that measures the speed and change of price movements. It is used to identify overbought or oversold conditions in a market.
- Purpose: Filtering signals with RSI moving averages ensures that trades are taken in line with the prevailing momentum, reducing the likelihood of false signals.
3. Golden Signals:
- Why Use Golden Crosses: A golden cross (50-period MA crossing above the 200-period MA) is a well-known bullish signal, while a death cross (50-period MA crossing below the 200-period MA) is bearish. These signals are widely followed by traders and institutions.
- Purpose: Highlighting these significant long-term signals helps traders identify major buy or sell opportunities and align with broader market trends.
How the Script Works
1. Moving Average Calculations:
- The script calculates multiple moving averages (MA1 to MA5) based on user-selected types (SMA, EMA, SMMA, WMA, VWMA, Hull) and periods (9, 21, 50, 100, 200).
- Golden Moving Averages: Separately calculates 50-period and 200-period moving averages for generating golden signals.
2. RSI and RSI MA Filter:
- RSI Calculation: Computes the RSI for the given period.
- RSI MA: Calculates a moving average of the RSI to smooth out the RSI values and reduce noise.
- RSI MA Filter: Traders can enable/disable RSI filtering and set custom thresholds to refine long and short signals based on RSI momentum.
3. Long & Short Signal Generation:
- Long Signal: Generated when the short-term moving average crosses above both the mid-term and long-term moving averages, and the RSI MA is below the specified threshold (if enabled).
- Short Signal: Generated when the short-term moving average crosses below both the mid-term and long-term moving averages, and the RSI MA is above the specified threshold (if enabled).
4. Golden Signals:
- Golden Long Signal: Triggered when the 50-period golden moving average crosses above the 200-period golden moving average.
- Golden Short Signal: Triggered when the 50-period golden moving average crosses below the 200-period golden moving average.
How to Use the Script
1. Customize Inputs:
- Moving Averages: Choose the type of moving averages and set the periods for up to five different moving averages.
- RSI Settings: Adjust the RSI period and its moving average period. Enable or disable RSI filtering and set custom thresholds for long and short signals.
- Signal Colors: Customize the colors for long, short, and golden signals.
- Enable/Disable Signals: Toggle the visibility of long, short, and golden signals.
2. Observe Plots and Signals:
- The script plots the selected moving averages on the chart.
- Long and short signals are marked with labels on the chart, with customizable colors for easy identification.
- Golden signals are highlighted with specific labels to indicate significant long-term trend changes.
3. Analyze and Trade:
- Use the generated signals as part of your trading strategy. The script provides visual cues to help you make informed decisions about entering or exiting trades based on multiple technical indicators.
Unique Features
1. Integration of Multiple Moving Averages: Combines various moving average types to provide a holistic view of market trends.
2. RSI MA Filtering: Enhances signal accuracy by incorporating RSI momentum, reducing the likelihood of false signals.
3. Golden Signals: Highlights significant long-term trend changes, aligning with broader market movements.
4. Customizability: Offers extensive customization options, allowing traders to tailor the script to their specific trading strategies and preferences.
feel free to comments.
