Cerca negli script per "accuracy"
MistaB SMC Navigation ToolkitMistaB SMC Navigation Toolkit
A complete Smart Money Concepts (SMC) toolkit designed for precision navigation of market structure, order flow, and premium/discount trading zones. Perfect for traders following ICT-style concepts and multi-timeframe confluence.
Features
✅ Order Blocks (OBs)
• Automatic bullish & bearish OB detection
• Optional displacement & high-volume filters
• Midline display for quick equilibrium view
• Auto-expiry and broken OB cleanup
✅ Fair Value Gaps (FVGs)
• Bullish & bearish gap detection
• HTF bias filtering for higher accuracy
• Compact boxes with labels
• Automatic removal when filled
✅ Market Structure (BoS / CHoCH)
• Fractal-based swing detection
• Break of Structure & Change of Character labeling
• Dynamic HTF bias dimming
✅ Premium / Discount Zones
• Auto-calculated mid-level
• Highlighted zones for optimal trade placement
✅ Higher Timeframe (HTF) Confirmation
• Configurable confirmation timeframe
• On-chart HTF status label (Bullish / Bearish / Not Required)
✅ Automatic Cleanup System
• Fast or delayed cleanup for expired/broken zones
• Dimmed colors for invalidated levels
How to Use
Set your preferred HTF in the settings.
Look for OB/FVGs aligned with HTF bias.
Enter in discount zones for longs or premium zones for shorts.
Confirm with BoS / CHoCH signals before entry.
Manage trades towards opposing liquidity zones or HTF levels.
Disclaimer
This indicator is for educational purposes only. It does not provide financial advice or guarantee future results. Always practice proper risk management and test thoroughly before live trading.

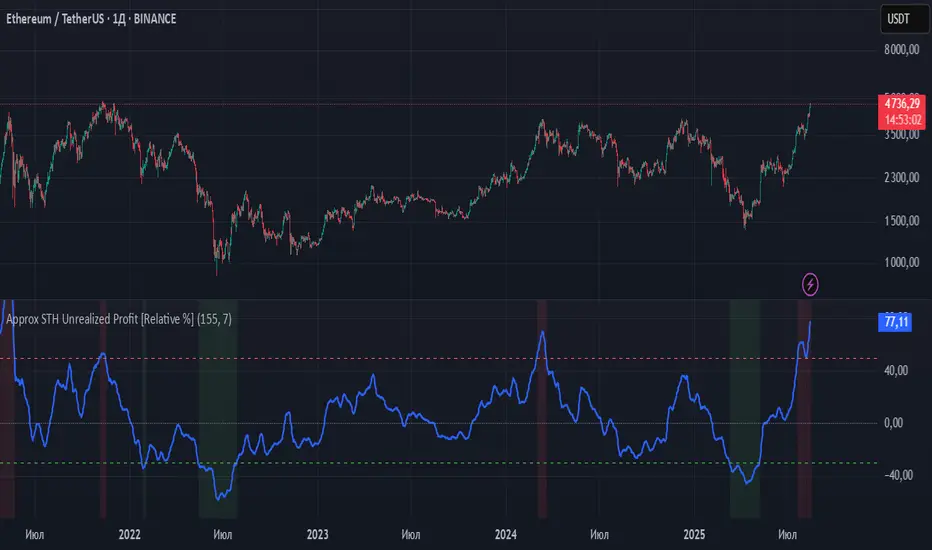
Approx STH Unrealized Profit [Relative %]This indicator estimates the unrealized profit or loss of short-term holders (STH) without requiring on-chain data. Instead of using actual STH Realized Price (average purchase price), it employs a 155-day Simple Moving Average (SMA) to approximate the behavior of "recent buyers."
How It Works
The indicator calculates the percentage deviation between the current price and the 155-day SMA using the formula:
(Current Price - 155 SMA) / 155 SMA * 100%.
Positive values indicate profit, while negative values show loss. Key threshold levels are set at +50% (overbought) and -30% (oversold).
Trading Applications
Profit > 50% - STH are experiencing significant profits, suggesting potential correction. Consider taking partial profits.
0% < Profit < 50% - Moderate profits indicate the trend may continue. Maintain positions.
Profit ≈ 0% - Price is near STH's average entry point, showing market indecision.
-30% < Profit < 0% - STH are at a loss, potentially signaling accumulation opportunities.
Profit < -30% - Extreme oversold conditions may present buying opportunities.
Limitations
SMA only approximates STH behavior.
May produce false signals during sideways markets.
SMA lag can be noticeable in strong trending markets.
Recommendation
For improved accuracy, combine this indicator with trend-following tools (200 EMA, Volume analysis) and other technical indicators. It serves best as a supplementary tool for identifying overbought/oversold market conditions within your trading strategy.
Enhanced RSI KDE | Advanced FiltersThis is an enhanced version of the excellent RSI (Kernel Optimized) indicator originally created by @fluxchart. Full credit goes to fluxchart for the innovative KDE (Kernel Density Estimation) concept and the solid foundation that made this enhancement possible.
🙏 CREDITS & ACKNOWLEDGMENTS
Original Creator: @fluxchart - RSI (Kernel Optimized)
Original Concept: Kernel Density Estimation applied to RSI pivot analysis
Enhancement: Advanced filtering system and signal optimization- profitgang
License: Mozilla Public License 2.0
🚀 WHAT'S NEW IN THIS ENHANCED VERSION
Building upon fluxchart's brilliant KDE RSI foundation, this version adds:
🔥 Advanced Filtering System:
Multi-Timeframe Confluence - Confirms signals across higher timeframes
Volume Confirmation - Only signals on above-average volume
Volatility Range Filter - Avoids signals in choppy or extreme conditions
Trend Context Analysis - Considers overall market direction
Adaptive Pivot Detection - Adjusts sensitivity based on market volatility
🎯 Signal Quality Improvements:
Confluence Scoring - Each signal gets a quality score (1-6)
Label Cooldown System - Prevents chart clutter with smart spacing
Higher Activation Thresholds - More selective signal generation
Risk Management Integration - Auto stop-loss and take-profit levels
📊 Enhanced Dashboard:
Real-time filter status monitoring
KDE probability percentages
Confluence scores for both directions
Volume and volatility readings
⚙️ HOW IT WORKS
The indicator maintains fluxchart's core KDE methodology:
Collects RSI values at historical pivot points
Creates probability density functions using Gaussian/Uniform/Sigmoid kernels
Identifies high-probability zones for potential reversals
NEW: Multiple filters must align before generating signals, dramatically reducing false positives while maintaining the accuracy of high-probability setups.
🎛️ RECOMMENDED SETTINGS
Confluence Score: 5/6 (very selective)
Activation Threshold: Medium or High
Multi-Timeframe: Enabled with 2/2 alignment
Volume Filter: Enabled (1.5x threshold)
All other filters: Enabled for maximum quality
📈 BEST USE CASES
Swing Trading - Higher timeframe confirmation reduces whipsaws
Quality over Quantity - Fewer but much higher probability signals
Risk Management - Built-in stop/target levels for each signal
Multi-Asset Analysis - Works on stocks, crypto, forex, commodities
⚠️ IMPORTANT NOTES
This is a quality-focused indicator - expect fewer but better signals
Backtest thoroughly on your specific assets and timeframes
The original fluxchart indicator remains excellent for different trading styles
Consider this an alternative approach, not a replacement
🤝 COLLABORATION & FEEDBACK
Special thanks to @fluxchart for creating the original innovative KDE RSI concept. This enhancement wouldn't exist without that solid foundation.
Feel free to suggest improvements or share your results! The goal is to build upon great work in the community.

Nifty Smart Zones & Breakout Bars(5min TF only) by Chaitu50cNifty Smart Zones & Breakout Bars is a purpose-built intraday trading tool, tested extensively on Nifty50 and recommended for Nifty50 use only.
All default settings are optimised specifically for Nifty50 on the 5-minute timeframe for maximum accuracy and clarity.
Why Last Bar of the Session Matters
The last candle of a trading session often represents the final battle between buyers and sellers for that day.
It encapsulates closing sentiment, influenced by end-of-day positioning, profit booking, and institutional activity.
The high and low of this bar frequently act as strong intraday support/resistance in the following sessions.
Price often reacts around these levels, especially when combined with volume surges.
Core Features
Session Last-Candle Zones
Plots a horizontal box at the high and low of the last candle in each session.
Boxes extend to the right to track carry-over levels into new sessions.
Uses a stateless approach — past zones reappear if relevant.
Smart Suppression System
When more than your Base Sessions (No Suppression) are shown, newer zones overlapping or within a proximity distance (in points) of older zones are hidden.
Older zones take priority, reducing chart clutter while keeping critical levels.
Breakout Bar Coloring
Highlights breakout bars in four categories:
Up Break (1-bar)
Down Break (1-bar)
Up Break (2-bar)
Down Break (2-bar)
Breakouts use a break buffer (in ticks) to filter noise.
Toggle coloring on/off instantly.
Volume Context (User Tip)
For best use, pair with volume analysis.
High-volume breakouts from last-session zones have greater conviction and can signal sustained momentum.
Usage Recommendations
Instrument: Nifty50 only (tested & optimised).
Timeframe: 5-minute chart for best results.
Approach:
Watch for price interaction with the plotted last-session zones.
Combine zone breaks with bar color signals and volume spikes for higher-probability trades.
Use suppression to focus on key, non-redundant levels.
Why This Tool is Different
Unlike standard support/resistance plotting, this indicator focuses on session-closing levels, which are more reliable than arbitrary highs/lows because they capture the final market consensus for the session.
The proximity-based suppression ensures your chart stays clean, while breakout paints give instant visual cues for momentum shifts.

WaveRider Momentum OscillatorWaveRider Momentum Oscillator
The WaveRider Momentum Oscillator applies principles inspired by fluid dynamics to model price momentum as a flowing system, rather than relying on traditional static calculations. By interpreting market movement through the lens of velocity, viscosity, and turbulence—core concepts in fluid mechanics—this indicator offers a more adaptive and nuanced view of momentum that adjusts dynamically to changing market conditions.
Conceptual Foundation
Velocity: Just as fluid velocity measures the speed of flow at a point, WaveRider calculates momentum velocity by measuring the rate of price change over a specified period, smoothed to reduce noise.
Viscosity: In fluid dynamics, viscosity represents internal friction that resists flow. Here, viscosity is modeled based on volatility, modulating momentum signals to account for the “thickness” or noise level of the market. High volatility increases viscosity’s damping effect, reducing false signals during turbulent price action.
Turbulence: Turbulence characterizes sudden, chaotic changes in fluid flow. WaveRider detects rapid acceleration bursts in momentum analogous to turbulence, highlighting moments when momentum is shifting sharply and potentially signaling strong upcoming price moves.
Technical Features and Interpretation
Adaptive Momentum Calculation: Momentum is scaled by volatility-adjusted viscosity, making the oscillator less prone to whipsaws and more responsive during stable trends.
Turbulence Burst Detection: The oscillator incorporates a turbulence factor, identifying abrupt momentum accelerations that traditional oscillators often miss. This feature provides early warning signals of potential breakout or reversal points.
HSV Gradient Color Mapping: The oscillator visualizes acceleration using a continuous hue gradient—ranging from red (deceleration) through yellow (neutral) to green (acceleration). This continuous color transition provides intuitive, real-time insight into momentum dynamics beyond mere numeric values.
Pivot Point Identification: WaveRider automatically marks momentum pivots, signaling local maxima and minima in momentum flow. These points serve as critical confirmation markers for potential entry and exit decisions.
How to Interpret WaveRider
Colors:
Green hues indicate positive acceleration — momentum is increasing, favoring bullish positions.
Yellow hues represent neutral momentum — the market is consolidating or pausing.
Red hues signal negative acceleration — momentum is weakening, suggesting caution or bearish bias.
Oscillator Direction:
An upward sloping oscillator line reflects strengthening momentum.
A downward slope indicates weakening momentum or a potential reversal.
Pivot Labels:
▲ (Pivot Low): Denotes local momentum troughs; potential points to consider initiating long positions.
▼ (Pivot High): Marks local momentum peaks; useful for identifying possible short entries or profit-taking zones.
Summary
By grounding momentum analysis in fluid dynamics, WaveRider transcends the limitations of traditional oscillators. It accounts for the market’s inherent volatility and captures real-time acceleration changes, enabling traders to detect meaningful momentum shifts with greater accuracy and clarity.
WaveRider is designed for traders seeking a scientifically informed tool that adapts fluidly with market conditions—offering deeper insight into momentum flow and better timing for entries and exits.

Sniper NAS100 Swiss Knife IndicatorSniper Trading System – Master Indicator
Description:
“Trade with the precision of the market makers themselves.”
The Sniper Trading System – Master Indicator is the crown jewel of institutional-level trading tools, engineered for those who demand perfect timing, deadly accuracy, and surgical execution in any market.
Designed by a 3× ASCAP Award-winning, multi–funded prop firm trader, this system fuses algorithmic precision with battle-tested price action logic, delivering an unmatched trading edge across Forex, Futures, Indices, and Crypto.
Core Features
Dealer Range Mapping – Auto-detects the hidden accumulation/distribution zones that drive market direction.
Multi-Standard Deviation Targets – Projected with gradient precision (+1 to +4 / -1 to -4) for scalps or swing holds.
12 AM Bias Candle Logic – Reveals the true daily directional bias before the herd even wakes up.
Liquidity Sweep Detection – Spots equal highs/lows & engineered stop hunts before the main move.
Kill Zone Time Windows – Pre-programmed with the London Session Sniper Hours & New York Precision Plays.
Multi-Timeframe RSI Filter – Filters false signals & highlights exhaustion points for sniper entries.
Dynamic Alerts – Fire real-time push, email, or webhook notifications for entry, exit, and confluence events.
How It Works
Identify Bias – Use the 12 AM candle + DXY/RSI overlays to confirm bullish or bearish control.
Wait for Liquidity Sweep – Let the market makers hunt stops; your job is to wait.
Execute at Kill Zones – Follow the preloaded precision entry times for God-tier sniper plays.
Ride to Target Zones – Exit at projected standard deviation levels for mathematically consistent profits.
Ideal For
Day Traders looking for clean entries and exits.

Buy/Sell Alert Strong Signals [TCMaster]This indicator combines Smoothed Moving Averages (SMMA), Stochastic Oscillator, and popular candlestick patterns (Engulfing, 3 Line Strike) to highlight potential trend reversal zones.
Main features:
4 SMMA lines (21, 50, 100, 200) for short-, medium-, and long-term trend analysis.
Trend Fill: Background shading when EMA(2) and SMMA(200) are aligned, visually confirming trend direction.
Stochastic Filter: Filters signals based on overbought/oversold conditions to help reduce noise.
Candlestick pattern recognition:
Bullish/Bearish Engulfing
Bullish/Bearish 3 Line Strike
Alerts for each pattern when Stochastic conditions are met.
⚠️ Note: This is a technical analysis tool. It does not guarantee accuracy and is not financial advice. Always combine with other analysis methods and practice proper risk management.
🛠 How to Use:
1. SMMA Settings
21 SMMA & 50 SMMA: Short- and medium-term trend tracking.
100 SMMA: Optional mid/long-term filter (toggle on/off).
200 SMMA: Major trend direction reference.
2. Trend Fill
EMA(2) > SMMA(200): Background shaded green (uptrend bias).
EMA(2) < SMMA(200): Background shaded red (downtrend bias).
Can be enabled/disabled in settings.
3. Stochastic Filter
K Length, D Smoothing, Smooth K: Adjust sensitivity.
Overbought & Oversold: Default 80 / 20 thresholds.
Buy signals only valid if Stochastic is oversold.
Sell signals only valid if Stochastic is overbought.
4. Candlestick Patterns
3 Line Strike:
Bullish: Three consecutive bullish candles followed by one bearish candle closing below the previous, with potential reversal.
Bearish: Three consecutive bearish candles followed by one bullish candle closing above the previous, with potential reversal.
Engulfing:
Bullish: Green candle fully engulfs the prior red candle body.
Bearish: Red candle fully engulfs the prior green candle body.
5. Alerts
Alerts available for each pattern when Stochastic conditions are met.
Example: "Bullish Engulfing + Stochastic confirm".
📌 Important Notes
Do not use this indicator as the sole basis for trading decisions.
Test on a demo account before applying to live trades.
Combine with multi-timeframe analysis, volume, and proper position sizing.
The Daily Bias Dashboard📜 Overview
This indicator is a powerful statistical tool designed to provide traders with a probable Daily Bias based on historical price action. It is built upon the concepts of Quarterly Theory, which divides the 24-hour trading day into 4 distinct sessions to analyze market behavior.
This tool analyzes how the market has behaved in the past to give you a statistical edge. It answers the question: "Based on the last X number of days, what is the most likely way the price will move during the Newyork AM & PM Sessions based on Asian & London Sessions?"
⚙️ How It Works
The indicator divides the 24-hour day (based on the America/New_York timezone) into two 12-hour halves:
First Half - 12 Hour Candle: The Accumulation/Manipulation or Asian/London Sessions (6 PM to 6 AM NY Time)
This period covers the Asian session and the start of the London session.
The indicator's only job here is to identify the highest high and lowest low of this 12-hour block, establishing the initial daily range.
Second Half - 12 Hour Candle: The Distribution/Continuation or NY AM/PM Sessions (6 AM to 6 PM NY Time)
This period covers the main London session and the full New York session.
The indicator actively watches to see if, and in what order, the price breaks out of the range established in Session 1 (FIrst Half of the day).
By tracking this behavior over hundreds of days, the indicator compiles statistics on four possible daily scenarios.
📊 The Four Scenarios & The Dashboard
The indicator presents its findings in a clean, easy-to-read dashboard, calculating the historical probability of each of the following scenarios:
↓ Low, then ↑ High: The price first breaks the low of Session 1 (often a liquidity sweep or stop hunt) before reversing to break the high of Session 1. This suggests a "sweep and reverse" bullish day.
↑ High, then ↓ Low: The price first breaks the high of Session 1 before reversing to break the low of Session 1. This suggests a "sweep and reverse" bearish day.
One-Sided Breakout: The price breaks only one of the boundaries (either the high or the low) and continues in that direction without taking the other side. This indicates a strong, trending day.
No Breakout (Inside Bar): The price fails to break either the high or the low of Session 1, remaining contained within its range. This indicates a day of consolidation and low volatility.
🧠 How to Use This Indicator
This is a confluence tool, not a standalone trading system. Its purpose is to help you frame a high-probability narrative for the trading day.
Establish a Bias: Start checking the dashboard at 06:00 AM Newyork time, which is the start of next half day trading session. If one scenario has a significantly higher probability (e.g., "One-Sided Breakout" at 89%), you have a statistically-backed directional bias in the direction of Breakout.
🔧 Features & Settings
Historical Days to Analyze: Set how many past days the indicator should use for its statistical analysis (default is 500).
Session Timezone : The calculation is locked to America/New_York as it is central to the Quarterly Theory concept, but this setting ensures correct alignment.
Dashboard Display: Fully customize the on-screen table, including its position and text size, or hide it completely.
⚠️ Important Notes
For maximum accuracy, use this indicator on hourly (H1) or lower timeframes.
The statistical probabilities are based on past performance and are not a guarantee of future results.
This tool is designed to sharpen your analytical skills and provide a robust, data-driven framework for your daily trading decisions. Use it to build confidence in your directional bias and to better understand the rhythm of the market.
Disclaimer: This indicator is for educational and informational purposes only and does not constitute financial advice. All trading involves risk.

Bbhafiz ALERT SIGNAL📌 Indicator Overview
Uses EMA20 & EMA50 to detect trend direction and identify crossover/crossunder points.
RSI filter (default ON) to improve accuracy — BUY only when RSI > 50, SELL only when RSI < 50.
Displays a BUY label below the candle and a SELL label above the candle when signals appear.
AlertCondition added so TradingView can send push notifications, pop-ups, or emails when a signal appears.
⚡ Main Logic:
BUY → EMA20 crosses above EMA50 + RSI > 50 (if filter is ON) + price above EMA20.
SELL → EMA20 crosses below EMA50 + RSI < 50 (if filter is ON) + price below EMA20.
🎯 Advantages of This Version:
No need to stare at the chart — alerts will notify you when a valid setup appears.
Can be used for scalping (M1, M5) or swing trading (H1, H4).
Perfect for busy traders since alerts only trigger on confirmed setups.

Global Bond Yields Monitor [MarktQuant]Global Bond Yields Monitor
The Global Bond Yields Monitor is designed to help users track and compare government bond yields across major economies. It provides an at-a-glance view of short- and long-term interest rates for multiple countries, enabling users to observe shifts in global fixed-income markets.
Key Features:
Multi-Country Coverage: Includes major advanced and emerging economies such as the United States, China, Japan, Germany, United Kingdom, Canada, Australia, and more.
Multiple Maturities: Displays yields for the 2-year, 5-year, 10-year, and 30-year maturities (20-year for Russia).
Dynamic Yield Data: Plots real-time yields for the selected country directly from TradingView’s data sources.
Weekly Change Tracking: Calculates and displays the yield change from one week ago ( ) for each maturity.
Table Visualization: Option to display a compact data table showing current yields and weekly changes, color-coded for easier interpretation.
Visual Yield Curve Comparison: Plots yield lines for short- and long-term maturities, with shaded areas between curves for visual clarity.
Customizable Display: Choose table placement and whether to show or hide the weekly change table.
Use Cases
This script is intended for analysts, traders, and investors who want to monitor shifts in sovereign bond markets. Changes in yields can reflect adjustments in monetary policy expectations, inflation outlook, or broader macroeconomic trends.
❗Important Note❗
This indicator is for market monitoring and educational purposes only. It does not generate trading signals, and it should not be interpreted as financial advice. All data is sourced from TradingView’s available market feeds, and accuracy may depend on the source data.

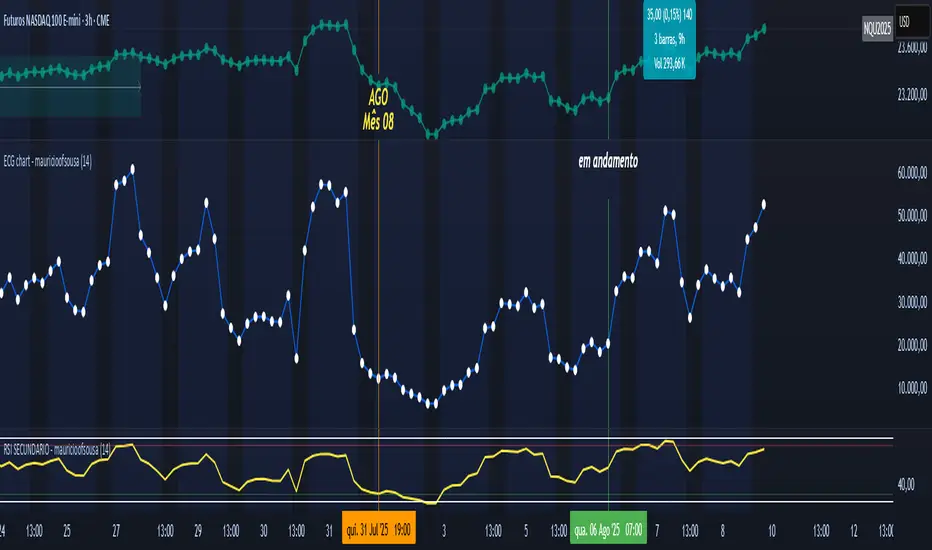
ECG chart - mauricioofsousaMGO Primary – Matriz Gráficos ON
The Blockchain of Trading applied to price behavior
The MGO Primary is the foundation of Matriz Gráficos ON — an advanced graphical methodology that transforms market movement into a logical, predictable, and objective sequence, inspired by blockchain architecture and periodic oscillatory phenomena.
This indicator replaces emotional candlestick reading with a mathematical interpretation of price blocks, cycles, and frequency. Its mission is to eliminate noise, anticipate reversals, and clearly show where capital is entering or exiting the market.
What MGO Primary detects:
Oscillatory phenomena that reveal the true behavior of orders in the book:
RPA – Breakout of Bullish Pivot
RPB – Breakout of Bearish Pivot
RBA – Sharp Bullish Breakout
RBB – Sharp Bearish Breakout
Rhythmic patterns that repeat in medium timeframes (especially on 12H and 4H)
Wave and block frequency, highlighting critical entry and exit zones
Validation through Primary and Secondary RSI, measuring the real strength behind movements
Who is this indicator for:
Traders seeking statistical clarity and visual logic
Operators who want to escape the subjectivity of candlesticks
Anyone who values technical precision with operational discipline
Recommended use:
Ideal timeframes: 12H (high precision) and 4H (moderate intensity)
Recommended assets: indices (e.g., NASDAQ), liquid stocks, and futures
Combine with: structured risk management and macro context analysis
Real-world performance:
The MGO12H achieved a 92% accuracy rate in 2025 on the NASDAQ, outperforming the average performance of major global quantitative strategies, with a net score of over 6,200 points for the year.
Cycle Phase & ETA Tracker [Robust v4]
Cycle Phase & ETA Tracker
Description
The Cycle Phase & ETA Tracker is a powerful tool for analyzing market cycles and predicting the completion of the current cycle (Estimated Time of Arrival, or ETA). It visualizes the cycle phase (0–100%) using a smoothed signal and displays the forecasted completion date with an optional confidence band based on cycle length variability. Ideal for traders looking to time their trades based on cyclical patterns, this indicator offers flexible settings for robust cycle analysis.
Key Features
Cycle Phase Visualization: Tracks the current cycle phase (0–100%) with color-coded zones: green (0–33%), blue (33–66%), orange (66–100%).
ETA Forecast: Shows a vertical line and label indicating the estimated date of cycle completion.
Confidence Band (±σ): Displays a band around the ETA to reflect uncertainty, calculated using the standard deviation of cycle lengths.
Multiple Averaging Methods: Choose from three methods to calculate average cycle length:
Median (Robust): Uses the median for resilience against outliers.
Weighted Mean: Prioritizes recent cycles with linear or quadratic weights.
Simple Mean: Applies equal weights to all cycles.
Adaptive Cycle Length: Automatically adjusts cycle length based on the timeframe or allows a fixed length.
Debug Histogram: Optionally displays the smoothed signal for diagnostic purposes.
Setup and Usage
Add the Indicator:
Search for "Cycle Phase & ETA Tracker " in TradingView’s indicator library and apply it to your chart.
Configure Parameters:
Core Settings:
Track Last N Cycles: Sets the number of recent cycles used to calculate the average cycle length (default: 20). Higher values provide stability but may lag market shifts.
Source: Selects the data source for analysis (e.g., close, open, high; default: close price).
Use Adaptive Cycle Length?: Enables automatic cycle length adjustment based on timeframe (e.g., shorter for intraday, longer for daily) or uses a fixed length if disabled.
Fixed Cycle Length: Defines the cycle length in bars when adaptive mode is off (default: 14). Smaller values increase sensitivity to short-term cycles.
Show Debug Histogram: Enables a histogram of the smoothed signal for debugging signal behavior.
Cycle Length Estimation:
Average Mode: Selects the method for calculating average cycle length: "Median (Robust)", "Weighted Mean", or "Simple Mean".
Weights (for Weighted Mean): For "Weighted Mean", chooses "linear" (moderate emphasis on recent cycles) or "quadratic" (strong emphasis on recent cycles).
ETA Visualization:
Show ETA Line & Label: Toggles the display of the ETA line and date label.
Show ETA Confidence Band (±σ): Toggles the confidence band around the ETA, showing the uncertainty range.
Band Transparency: Adjusts the transparency of the confidence band (0 = fully transparent, 100 = fully opaque; default: 85).
ETA Color: Sets the color for the ETA line, label, and confidence band (default: orange).
Interpretation:
The cycle phase (0–100%) indicates progress: green for the start, blue for the middle, and orange for the end of the cycle.
The ETA line and label show the predicted cycle completion date.
The confidence band reflects the uncertainty range (±1 standard deviation) of the ETA.
If a warning "Insufficient cycles for ETA" appears, wait for the indicator to collect at least 3 cycles.
Limitations
Requires at least 3 cycles for reliable ETA and confidence band calculations.
On low timeframes or low-volatility markets, zero-crossings may be infrequent, delaying ETA updates.
Accuracy depends on proper cycle length settings (adaptive or fixed).
Notes
Test the indicator across different assets and timeframes to optimize settings.
Use the debug histogram to troubleshoot if the ETA appears inaccurate.
For feedback or suggestions, contact the author via TradingView.
Cycle Phase & ETA Tracker
Описание
Индикатор Cycle Phase & ETA Tracker предназначен для анализа рыночных циклов и прогнозирования времени завершения текущего цикла (ETA — Estimated Time of Arrival). Он отслеживает фазы цикла (0–100%) на основе сглаженного сигнала и отображает предполагаемую дату завершения цикла с опциональной доверительной полосой, основанной на стандартном отклонении длин циклов. Индикатор идеально подходит для трейдеров, которые хотят выявлять циклические закономерности и планировать свои действия на основе прогнозируемого времени.
Ключевые особенности
Фазы цикла: Визуализирует текущую фазу цикла (0–100%) с цветовой кодировкой: зеленый (0–33%), синий (33–66%), оранжевый (66–100%).
Прогноз ETA: Показывает вертикальную линию и метку с предполагаемой датой завершения цикла.
Доверительная полоса (±σ): Отображает зону неопределенности вокруг ETA, основанную на стандартном отклонении длин циклов.
Гибкие методы усреднения: Поддерживает три метода расчета средней длины цикла:
Median (Robust): Медиана, устойчивая к выбросам.
Weighted Mean: Взвешенное среднее, где недавние циклы имеют больший вес (линейный или квадратичный).
Simple Mean: Простое среднее с равными весами.
Адаптивная длина цикла: Автоматически подстраивает длину цикла под таймфрейм или позволяет задать фиксированную длину.
Отладочная гистограмма: Опционально отображает сглаженный сигнал для анализа.
Настройка и использование
Добавьте индикатор:
Найдите "Cycle Phase & ETA Tracker " в библиотеке индикаторов TradingView и добавьте его на график.
Настройте параметры:
Core Settings:
Track Last N Cycles: Количество последних циклов для расчета средней длины (по умолчанию 20). Большие значения дают более стабильные результаты, но могут запаздывать.
Source: Источник данных (по умолчанию цена закрытия).
Use Adaptive Cycle Length?: Включите для автоматической настройки длины цикла по таймфрейму или отключите для использования фиксированной длины.
Fixed Cycle Length: Длина цикла в барах, если адаптивная длина отключена (по умолчанию 14).
Show Debug Histogram: Включите для отображения сглаженного сигнала (полезно для отладки).
Cycle Length Estimation:
Average Mode: Выберите метод усреднения: "Median (Robust)", "Weighted Mean" или "Simple Mean".
Weights (for Weighted Mean): Для режима "Weighted Mean" выберите "linear" (умеренный вес для новых циклов) или "quadratic" (сильный вес для новых циклов).
ETA Visualization:
Show ETA Line & Label: Включите для отображения линии и метки ETA.
Show ETA Confidence Band (±σ): Включите для отображения доверительной полосы.
Band Transparency: Прозрачность полосы (0 — полностью прозрачная, 100 — полностью непрозрачная, по умолчанию 85).
ETA Color: Цвет для линии, метки и полосы (по умолчанию оранжевый).
Интерпретация:
Фаза цикла (0–100%) показывает прогресс текущего цикла: зеленый — начало, синий — середина, оранжевый — конец.
Линия и метка ETA указывают предполагаемую дату завершения цикла.
Доверительная полоса показывает диапазон неопределенности (±1 стандартное отклонение).
Если отображается предупреждение "Insufficient cycles for ETA", дождитесь, пока индикатор соберет минимум 3 цикла.
Ограничения
Требуется минимум 3 цикла для надежного расчета ETA и доверительной полосы.
На низких таймфреймах или рынках с низкой волатильностью пересечения нуля могут быть редкими, что замедляет обновление ETA.
Эффективность зависит от правильной настройки длины цикла (fixedL или адаптивной).
Примечания
Протестируйте индикатор на разных таймфреймах и активах, чтобы подобрать оптимальные параметры.
Используйте отладочную гистограмму для анализа сигнала, если ETA кажется неточным.
Для вопросов или предложений по улучшению свяжитесь через TradingView.

Razor Precision — Buy/SellRazor Precision Stock Action Indicator
The Razor Precision indicator is an advanced, multi-layered market analysis tool designed for traders who demand accuracy and alignment across multiple timeframes. It combines price action, moving average crossovers, volume confirmation, swing structure mapping, and indicator confluence (RSI, MACD, ATR, OBV) to generate actionable buy/sell strength ratings.
Key Features:
Price Action Detection: Identifies higher highs/lows (uptrend) and lower highs/lows (downtrend).
MA Crossover Momentum: Monitors 50/200 moving average crossovers to detect trend shifts.
Volume Surge Analysis: Confirms breakouts or pullbacks with significant volume spikes.
Swing Structure Tracking: Maps internal/external breaks to align with Smart Money Concepts.
Indicator Confluence: Aggregates signals from RSI, MACD, ATR, and OBV for precision confirmation.
Multi-Timeframe Alignment: Compares trends across 15m, 1H, 4H, and Daily charts for stacked or conflicting signals.
Strength Levels: Signals range from SELL, STRONG SELL, ULTRA STRONG SELL to BUY, STRONG BUY, ULTRA STRONG BUY.
Dynamic Table Display: Updates every 5 minutes or when overall action changes, showing per-timeframe analysis and the aggregated decision.
Ideal for swing traders, scalpers, and intraday momentum players who want high-confidence trade direction filtered through multiple technical layers.

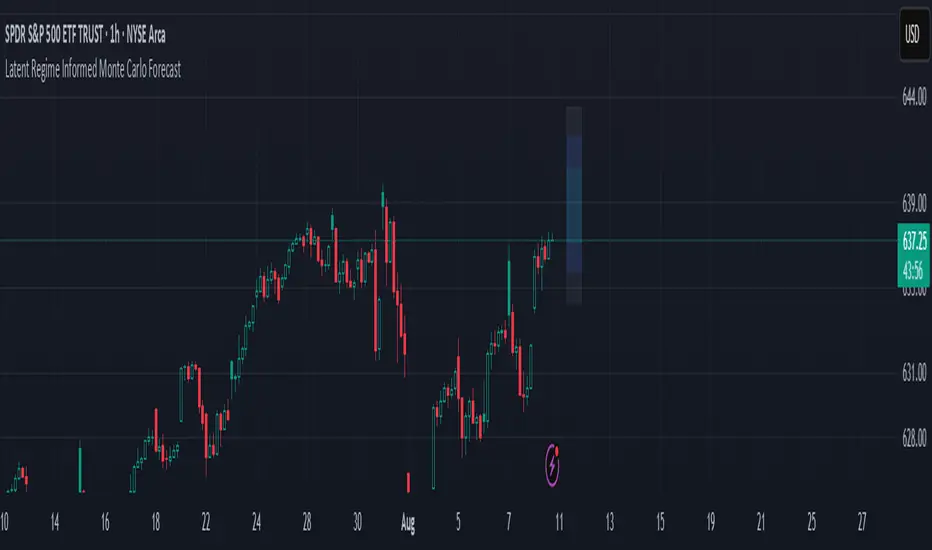
Latent Regime Informed Monte Carlo ForecastThis script uses a Monte Carlo simulation to forecast where price might be a set number of bars into the future (default 6 bars ahead). It generates hundreds of possible future price paths based on an average move (drift) and random shocks (volatility). The result is a distribution of outcomes, displayed as probability zones: the median (most likely), inner bands (50% confidence), and wider bands (80% and 95% confidence). Due to the randomness assumption in Monte Carlo simulations, the paths are not very important so to minimize cluttering on the graphs we only plot bands. These zones help you visualize uncertainty, set stops and targets based on probabilities, and spot when market behavior changes.
The accuracy of any Monte Carlo forecast depends heavily on how well you estimate trend and volatility. By default and no prior information the Monte Carlo simulation gives you a parabolic forecast that assumes absolute randomness. This is where the Kalman filter comes in. The filter (derived from control theory) aims to detect latent (unobservable) traits about the system by continuously updating its transition probabilities to better understand how the latent traits affect the observable measurement (price). With each new observable state we get better and better transition probabilities and enhances our understanding about the latent and unobservable market characteristics like trend and volatility. Both crucial measurements for short term market sentiment.
Extracting these measurements for market sentiment informs us how to better parametrize the Monte Carlo simulation for a better forecast. Each bar, the KF updates its estimates based on how close its last prediction was to reality. In calm periods, it holds estimates steady; in volatile periods, it adapts quickly. This gives you real-time, low-lag measurements of both trend and volatility.
By feeding these adaptive estimates into the Monte Carlo simulation, the forecast becomes much more responsive to current market conditions. In trends, the predicted paths tilt toward the direction of movement; in choppy markets, they spread wider but stay centered; when volatility spikes, the probability zones expand immediately. The result is a dynamic forecast tool that adjusts on every bar, giving you a clearer, probability-based picture of where the market could go next.
This is my very first script and I would love feedback/ideas for different topics.
My background is in economics/mathematics and interests lie in time series analysis/exploring financial features for DS
BBMA OA - AI GPT-5This indicator is an AI-assisted implementation of the BBMA OA (Bollinger Bands + Moving Average) trading strategy, originally introduced by Malaysian trader Oma Ally. The code was generated and optimized using the GPT-5 AI model to ensure clean Pine Script v6 structure and compatibility.
The system combines Bollinger Bands (20, 2) with EMA50, EMA200, and MA5/10 High-Low to identify the four main BBMA OA patterns:
Extreme
Market Hilang Volume (MHV)
Candle Arah Kukuh (CSAK)
Re-entry (RRE, REE, REM)
Features:
Multi Time Frame confirmation for higher accuracy
Automatic signal detection with visual markers
Trend ribbon and candle coloring
Optimized Pine Script v6, free from errors/warnings
⚠ This is an adaptation of Oma Ally’s concept for educational purposes, not an official version. Past performance does not guarantee future results.
Bitcoin: Pi Cycle Top & Bottom Indicator Z ScoreIndicator Overview
The Pi Cycle Top Indicator has historically been effective in picking out the timing of market cycle highs within 3 days.
It uses the 111 day moving average (111DMA) and a newly created multiple of the 350 day moving average, the 350DMA x 2.
Note: The multiple is of the price values of the 350DMA, not the number of days.
For the past three market cycles, when the 111DMA moves up and crosses the 350DMA x 2 we see that it coincides with the price of Bitcoin peaking.
It is also interesting to note that 350 / 111 is 3.153, which is very close to Pi = 3.142. In fact, it is the closest we can get to Pi when dividing 350 by another whole number.
It once again demonstrates the cyclical nature of Bitcoin price action over long time frames. However, in this instance, it does so with a high degree of accuracy over Bitcoin's adoption phase of growth.
Bitcoin Price Prediction Using This Tool
The Pi Cycle Top Indicator forecasts the cycle top of Bitcoin’s market cycles. It attempts to predict the point where Bitcoin price will peak before pulling back. It does this on major high time frames and has picked the absolute tops of Bitcoin’s major price moves throughout most of its history.
How It Can Be Used
Pi Cycle Top is useful to indicate when the market is very overheated. So overheated that the shorter-term moving average, which is the 111-day moving average, has reached an x2 multiple of the 350-day moving average. Historically, it has proved advantageous to sell Bitcoin around this time in Bitcoin's price cycles.
It is also worth noting that this indicator has worked during Bitcoin's adoption growth phase, the first 15 years or so of Bitcoin's life. With the launch of Bitcoin ETF's and Bitcoin's increased integration into the global financial system, this indicator may cease to be relevant at some point in this new market structure.
Added the Z-Score metric for easy classification of the value of Bitcoin according to this indicator.
Created for TRW

Bollinger Bands (SMA) with Trend Filtered Buy/SellOverview
This indicator is a trend-following Bollinger Bands tool based on SMA, enhanced with a 200 SMA filter to display BUY/SELL signals only in the direction of the prevailing trend.
Instead of showing every possible reversal, it focuses on high-probability entries aligned with the trend.
Key Features
Feature Description
Bollinger Bands (SMA) Plots upper, lower, and middle bands using Simple Moving Average (SMA) and standard deviation.
200 SMA Trend Filter Determines the overall market trend (bullish or bearish).
BUY/SELL Signals Generates signals when price reacts from Bollinger Bands.
Trend Filtering Only BUY signals above the 200 SMA, only SELL signals below the 200 SMA.
Alert Function TradingView alerts can be triggered when a signal occurs.
Toggle ON/OFF Option to enable or disable signal display.
Signal Logic
BUY Signal
Price is above the 200 SMA (uptrend)
Previous candle closed below the lower Bollinger Band
Current candle closes back inside the band → Confirmed rebound → BUY signal
SELL Signal
Price is below the 200 SMA (downtrend)
Previous candle closed above the upper Bollinger Band
Current candle closes back inside the band → Confirmed pullback → SELL signal
How to Use
Trend-Following Entries:
Enter trades only in the trend direction, improving accuracy and reducing countertrend trades.
Filter Out False Signals:
The 200 SMA filter removes noise from opposite-trend signals.
Alerts:
Receive notifications when a valid BUY/SELL setup appears without watching the chart constantly.
This indicator is ideal for traders who want to focus on high-probability trend-following setups, especially in markets like Forex or Gold, where strong one-way moves often occur.
このインジケーターは、SMAベースのボリンジャーバンドにトレンドフィルター(200SMA)を追加し、トレンドフォロー型のBUY/SELLシグナルを表示するツールです。
短期の逆張りではなく、大きなトレンド方向に沿ったシグナルだけを出すように設計されています。
主な機能
機能 説明
ボリンジャーバンド (SMA) 期間を指定した単純移動平均(SMA)を基準に、標準偏差で上下のバンドを表示
200SMA(トレンド判定) 現在の相場が上昇トレンドか下降トレンドかを判断
BUY/SELLシグナル ボリンジャーバンドの反発を検出してシグナル表示
トレンドフィルター 200SMAより上ならBUYのみ、200SMAより下ならSELLのみ表示
アラート機能 BUY/SELLシグナル発生時にTradingViewのアラートで通知可能
ON/OFF切替 BUY/SELLシグナルの表示はスイッチでON/OFF可能
シグナルロジック
BUYシグナル
200SMAより上にいる
前の足で価格がボリンジャーバンド下限を下抜け
現在の足でバンド内に戻る → 反発確認 → BUYシグナル表示
SELLシグナル
200SMAより下にいる
前の足で価格がボリンジャーバンド上限を上抜け
現在の足でバンド内に戻る → 反落確認 → SELLシグナル表示
トレードでの使い方
トレンドフォロー型エントリー
→ 200SMAを基準に、相場の方向に沿ったエントリーだけを狙う
逆張りのフィルタリング
→ トレンドに逆らう無駄なシグナルを表示しない
アラート通知
→ チャートを見ていなくても、シグナル発生時に通知可能
このインジケーターは「トレンドフォローの精度を高めたいトレーダー」向けです。
特にゴールドやFXで、一方向の強いトレンドが出やすい相場で有効です。
Ayman – Full Smart Suite Auto/Manual Presets + PanelIndicator Name
Ayman – Full Smart Suite (OB/BoS/Liq/FVG/Pin/ADX/HTF) + Auto/Manual Presets + Panel
This is a multi-condition trading tool for TradingView that combines advanced Smart Money Concepts (SMC) with classic technical filters.
It generates BUY/SELL signals, draws Stop Loss (SL) and Take Profit (TP1, TP2) levels, and displays a control panel with all active settings and conditions.
1. Main Features
Smart Money Concepts Filters:
Order Block (OB) Zones
Break of Structure (BoS)
Liquidity Sweeps
Fair Value Gaps (FVG)
Pin Bar patterns
ADX filter
Higher Timeframe EMA filter (HTF EMA)
Two Operating Modes:
Auto Presets: Automatically adjusts all settings (buffers, ATR multipliers, RR, etc.) based on your chart timeframe (M1/M5/M15).
Manual Mode: Fully customize all parameters yourself.
Trade Management Levels:
Stop Loss (SL)
TP1 – partial profit
TP2 – full profit
Visual Panel showing:
Current settings
Filter status
Trend direction
Last swing levels
SL/TP status
Alerts for BUY/SELL conditions
2. Entry Conditions
A BUY signal is generated when all these are true:
Trend: Price above EMA (bullish)
HTF EMA: Higher timeframe trend also bullish
ADX: Trend strength above threshold
OB: Price in a valid bullish Order Block zone
BoS: Structure break to the upside
Liquidity Sweep: Sweep of recent lows in bullish context
FVG: A bullish Fair Value Gap is present
Pin Bar: Bullish Pin Bar pattern detected (if enabled)
A SELL signal is generated when the opposite conditions are met.
3. Stop Loss & Take Profits
SL: Placed just beyond the last swing low (BUY) or swing high (SELL), with a small ATR buffer.
TP1: Partial profit target, defined as a ratio of the SL distance.
TP2: Full profit target, based on Reward:Risk ratio.
4. How to Use
Step 1 – Apply Indicator
Open TradingView
Go to your chart (recommended: XAUUSD, M1/M5 for scalping)
Add the indicator script
Step 2 – Choose Mode
AUTO Mode: Leave “Use Auto Presets” ON – parameters adapt to your timeframe.
MANUAL Mode: Turn Auto OFF and adjust all lengths, buffers, RR, and filters.
Step 3 – Filters
In the Filters On/Off section, enable/disable specific conditions (OB, BoS, Liq, FVG, Pin Bar, ADX, HTF EMA).
Step 4 – Trading the Signals
Wait for a BUY or SELL arrow to appear.
SL and TP levels will be plotted automatically.
TP1 can be used for partial close and TP2 for full exit.
Step 5 – Alerts
Set alerts via BUY Signal or SELL Signal to receive notifications.
5. Best Practices
Scalping: Use M1 or M5 with AUTO mode for gold or forex pairs.
Swing Trading: Use M15+ and adjust buffers/ATR manually.
Combine with price action confirmation before entering trades.
For higher accuracy, wait for multiple filter confirmations rather than acting on the first arrow.
6. Summary Table
Feature Purpose Can Disable?
Order Block Finds key supply/demand zones ✅
Break of Structure Detects trend continuation ✅
Liquidity Sweep Finds stop-hunt moves ✅
Fair Value Gap Confirms imbalance entries ✅
Pin Bar Price action reversal filter ✅
ADX Trend strength filter ✅
HTF EMA Higher timeframe confirmation ✅

DeltaTrace ForecastDeltaTrace Forecast is a forward-looking projection tool that visualizes the probable directional path of price using a multi-timeframe momentum model rooted in volatility-adjusted nonlinear dynamics. Rather than relying on traditional indicators that react to price after the fact, DeltaTrace estimates future price motion by tracing the progression of momentum changes across expanding timeframes—then scaling those deltas using adaptive volatility to forecast a plausible path forward.
At its core, DeltaTrace constructs a momentum vector from a series of smoothed z-scores derived from increasing multiples of the current chart's timeframe. These z-scores are normalized using a hyperbolic tangent function (tanh), which compresses extreme values and emphasizes meaningful deviations without being overly sensitive to outliers. This nonlinear normalization ensures that explosive moves are weighted with less distortion, while still preserving the shape and direction of the underlying trend.
Once the z-scores are calculated for a range of 12 timeframes (from 1× the current timeframe up to 12×), the indicator computes the first difference between each adjacent pair. These differences—or deltas—represent the change in momentum from one timeframe to the next. In this structure, a strong positive delta implies momentum is strengthening as we look into higher timeframes, while a negative delta reflects waning or reversing strength.
However, not all deltas are treated equally. To make the projection adaptive to market volatility and temporally meaningful, each delta is scaled by the square root of its corresponding timeframe multiple, weighted by the ATR (Average True Range) of the base timeframe. This square-root volatility scaling mirrors the behavior of Brownian motion and reflects the natural geometric diffusion of price over time. By applying this scaling, the model tempers its forecast according to recent volatility while maintaining proportional distance over longer time horizons.
The result is a chain of projected price steps—11 in total—starting from the current closing price. These steps are cumulative, meaning each one builds upon the previous, forming a continuously adjusted polyline that represents the most recent forecast path of price. Each point in the forecast line is directional: if the next projected point is above the last, the segment is colored green (upward momentum); if below, it is colored red (downward momentum). This color coding gives immediate visual feedback on the nature of the projected path and allows for intuitive at-a-glance interpretation.
What makes DeltaTrace unique is its combination of ideas from signal processing, time-series momentum analysis, and volatility theory. Instead of relying on static support/resistance levels or lagging moving averages, it dynamically adapts to both momentum curvature and volatility structure. This allows it to be used not just for trend confirmation, but also for top-down bias fading, reversal anticipation, and path-following strategies.
Traders can use DeltaTrace in a variety of ways depending on their style:
For trend traders, a consistent upward or downward curve in the forecast suggests directional continuation and can be used for position sizing or confirmation of bias.
For mean-reversion traders, exaggerated divergence between the current price and the first few forecast points may indicate temporary exhaustion or overextension.
For scalpers or intraday traders, the short-term bend or flattening of the initial segments can reveal early signs of weakening momentum or build-up before breakout.
For swing traders, the full shape of the polyline gives an evolving map of market rhythm across time compression, allowing for context-aware decision-making.
It’s important to understand that this is a path projection tool, not a precise price target predictor. The forecast does not attempt to predict exact price levels at exact bars, but rather illustrates how the market might evolve if the current multi-timeframe momentum structure persists. Like all models, it should be interpreted probabilistically and used in conjunction with other confirmation signals, risk management tools, or strategy frameworks.
Inputs allow customization of the z-score calculation length and ATR window to tune the sensitivity of the model. The color scheme for up/down forecast segments can also be adjusted for personal preference. Additionally, users can toggle the polyline forecast on or off, which may be useful for pairing this indicator with others in a crowded chart layout.
Because the forecast path is calculated only on the last bar, it does not repaint or shift once the candle closes—preserving historical accuracy for visual inspection and backtesting reference. However, it is also sensitive to changes in volatility and momentum structure, meaning it updates each bar as conditions evolve, making it most effective in real-time decision support.
DeltaTrace Forecast is particularly well-suited for traders who want a deeper understanding of hidden momentum shifts across timeframes without relying on traditional trend-following tools. It reveals the shape of future possibility based on present dynamics, offering a compact yet powerful visualization of directional bias, transition risk, and path strength.
To maximize its utility, consider pairing DeltaTrace with volume profiles, order flow tools, higher timeframe zones, or market structure indicators. Used in context, it becomes a powerful companion to both systematic and discretionary trading styles—especially for those who appreciate a blend of mathematics and intuition in their market analysis.
This indicator is not based on magic or black-box logic; every component—from the z-score standardization to the volatility-adjusted deltas—is fully transparent and grounded in simple, interpretable mechanics. If you're looking for a reliable way to visualize multi-timeframe bias and momentum diffusion, DeltaTrace provides a unique lens through which to interpret future potential in an ever-shifting market landscape.

Power Metcalfe's + Fibonacci Channel## Metcalfe's Law + Fibonacci Channel - Optimized Bitcoin Valuation Model
This indicator presents an enhanced variation of the classic Bitcoin Metcalfe's Law model, combining logarithmic regression analysis with Fibonacci retracement levels to create a comprehensive valuation framework.
**Key Features:**
- **Optimized Metcalfe's Law calculation** using historical cycle data (2013-2022) for improved accuracy
- **Fibonacci channel overlay** with key levels: 0.382, 0.618, 1.272, 1.618, 2.000, 2.618, 3.000
- **Dynamic trading zones** with visual buy/sell signals based on price position relative to the channel
- **Real-time targets** displaying current Fibonacci projections and fair value estimates
**What makes it different:**
Unlike standard Metcalfe's Law implementations, this version integrates logarithmic growth principles and uses a refined dataset that accounts for Bitcoin's maturation cycles. The Fibonacci overlay provides clearer entry/exit points while maintaining the long-term growth trajectory based on network adoption.
**Best suited for:** Long-term Bitcoin holders and macro traders looking for mathematical support/resistance levels based on network adoption dynamics and scarcity.
The model automatically updates calculations and provides a comprehensive information table showing current formula parameters and key price targets.

Volatility Wick Trap — Smart Reversal EngineThe Volatility Wick Trap — Smart Reversal Engine is a precision reversal detection tool designed for traders who rely on smart money footprints, volatility compression, and liquidity wick exhaustion to time entries near market turns.
💡 Core Components:
Volatility Squeeze Detection: Identifies candles where range compresses significantly compared to the 14-period average true range, highlighting potential breakout zones.
Liquidity Wick Exhaustion: Detects candles with dominant upper or lower wicks, signaling failed liquidity grabs or stop hunts.
Contextual EMA Filter: Uses a 21-period EMA to filter signals, improving accuracy by aligning with market structure bias.
🔍 How It Works:
Green diamond lines mark bullish hidden reversal zones.
Red diamond lines mark bearish hidden reversal traps.
These lines only appear when volatility compresses and wick traps are confirmed within the trend context.
✅ Clean. Minimal. Tactical.
Ideal for scalpers, swing traders, and smart money enthusiasts looking to fade emotional price spikes.

Contrarian Investor📌 Indicator Overview
Name:Contrarian investor
Purpose: Identify oversold or overbought conditions for simple reversal trades.
Key Features:
Uses the 200-period moving average (200MA) to determine the market trend.
Uses RSI to detect oversold and overbought levels.
Includes a signal interval filter to prevent excessive signals.
📌 Signal Conditions
BUY (Reversal Buy)
Price is below the 200MA
RSI is below the oversold threshold (default: 30)
When both conditions are met, a "BUY" label is plotted below the bar.
SELL (Reversal Sell)
Price is above the 200MA
RSI is above the overbought threshold (default: 70)
When both conditions are met, a "SELL" label is plotted above the bar.
📌 Parameters
MA Length: Default 200 (used for trend detection)
RSI Length: Default 14
RSI Oversold: Default 30 (trigger for BUY signals)
RSI Overbought: Default 70 (trigger for SELL signals)
Signal Interval (bars): Default 10 (prevents duplicate signals)
📌 How to Use
Use the 200MA to confirm the trend direction.
Wait for RSI to reach extreme levels (oversold or overbought).
When a "BUY" or "SELL" label appears, consider a potential entry.
For better accuracy, combine with support/resistance or price action confirmation.
📌 Notes
This indicator is designed as a supplementary tool, not a standalone entry system.
Adjust the signal interval based on your trading style (e.g., shorter for scalping, longer for swing trading).
In strong trending markets, reversal signals may fail frequently, so additional confluence is recommended.
You need to adjust the settings depending on the market conditions.
This indicator is not intended for use during strong trending markets, such as after major economic news releases.
It is best suited for range-bound markets and scalping within a few-dollar price range.
📌 インジケーターの概要
名前:Contrarian investor
目的:過剰に売られた/買われたタイミングでの逆張りシグナルを簡単に確認
特徴:
200MAを基準にトレンド方向を判定
RSIで売られすぎ・買われすぎを検出
過剰なシグナルを防ぐための「シグナル間隔制限」付き
📌 シグナルの条件
BUY(逆張り買い)
現在の価格が 200MAより下
RSIが 設定値(初期値30)以下
この条件で「BUY」ラベルがチャート下に表示されます。
SELL(逆張り売り)
現在の価格が 200MAより上
RSIが 設定値(初期値70)以上
この条件で「SELL」ラベルがチャート上に表示されます。
📌 パラメータ設定
MA期間:デフォルト200(200MAで長期トレンドを判定)
RSI期間:デフォルト14
RSI売られすぎ:デフォルト30(BUYの発生条件)
RSI買われすぎ:デフォルト70(SELLの発生条件)
シグナル間隔(バー):デフォルト10(重複シグナル防止)
📌 使い方
200MAでトレンド方向を確認
RSIが極端な水準に達したら逆張りシグナル発生
「BUY」または「SELL」のラベルが出たら検討
他のテクニカル(サポレジ・プライスアクション)と組み合わせると精度向上
📌 注意点
単独でのエントリー判断には使わず、補助的に活用するのが推奨
シグナル間隔は調整可能(例:スキャルピングなら短め、スイングなら長め)
トレンドが強い相場では逆張りシグナルが連続して外れる可能性あり
相場環境によって設定を変える必要がある
指標発表後など強いトレンドが出る時ではなくレンジ相場で数ドル幅のスキャルピングをするのに向いている。
