Dynamic Liquidity Depth [BigBeluga]
Dynamic Liquidity Depth
A liquidity mapping engine that reveals hidden zones of market vulnerability. This tool simulates where potential large concentrations of stop-losses may exist — above recent highs (sell-side) and below recent lows (buy-side) — by analyzing real price behavior and directional volume. The result is a dynamic two-sided volume profile that highlights where price is most likely to gravitate during liquidation events, reversals, or engineered stop hunts.
🔵 KEY FEATURES
Two-Sided Liquidity Profiles:
Plots two separate profiles on the chart — one above price for potential sell-side liquidity , and one below price for potential buy-side liquidity . Each profile reflects the volume distribution across binned zones derived from historical highs and lows.
Real Stop Zone Simulation:
Each profile is offset from the current high or low using an ATR-based buffer. This simulates where traders might cluster their stop-losses above swing highs (short stops) or below swing lows (long stops).
Directional Volume Analysis:
Buy-side volume is accumulated only from bullish candles (close > open), while sell-side volume is accumulated only from bearish candles (close < open). This directional filtering enhances accuracy by capturing genuine pressure zones.
Dynamic Volume Heatmap:
Each liquidity bin is rendered as a horizontal box with a color gradient based on volume intensity:
- Low activity bins are shaded lightly.
- High-volume zones appear more vividly in red (sell) or lime (buy).
- The maximum volume bin in each profile is emphasized with a brighter fill and a volume label.
Extended POC Zones:
The Point of Control (PoC) — the bin with the most volume — is extended backwards across the entire lookback period to mark critical resistance (sell-side) or support (buy-side) levels.
Total Volume Summary Labels:
At the center of each profile, a summary label displays Total Buy Liquidity and Total Sell Liquidity volume.
This metric helps assess directional imbalance — when buy liquidity is dominant, the market may favor upward continuation, and vice versa.
Customizable Profile Granularity:
You can fine-tune both Resolution (Bins) and Offset Distance to adjust how far profiles are displaced from price and how many levels are calculated within the ATR range.
🔵 HOW IT WORKS
The indicator calculates an ATR-based buffer above highs and below lows to define the top and bottom of the liquidity zones.
Using a user-defined lookback period, it scans historical candles and divides the buffered zones into bins.
Each bin checks if bullish (or bearish) candles pass through it based on price wicks and body.
Volume from valid candles is summed into the corresponding bin.
When volume exists in a bin, a horizontal box is drawn with a width scaled by relative volume strength.
The bin with the highest volume is highlighted and optionally extended backward as a zone of importance.
Total buy/sell liquidity is displayed with a summary label at the side of the profile.
🔵 USAGE/b]
Identify Stop Hunt Zones: High-volume clusters near swing highs/lows are likely liquidation zones targeted during fakeouts.
Fade or Follow Reactions: Price hitting a high-volume bin may reverse (fade opportunity) or break with strength (confirmation breakout).
Layer with Other Tools: Combine with market structure, order blocks, or trend filters to validate entries near liquidity.
Adjust Offset for Sensitivity: Use higher offset to simulate wider stop placement; use lower for tighter scalping zones.
🔵 CONCLUSION
Dynamic Liquidity Depth transforms raw price and volume into a spatial map of liquidity. By revealing areas where stop orders are likely hidden, it gives traders insight into price manipulation zones, potential reversal levels, and breakout traps. Whether you're hunting for traps or trading with the flow, this tool equips you to navigate liquidity with precision.
Cerca negli script per "accuracy"

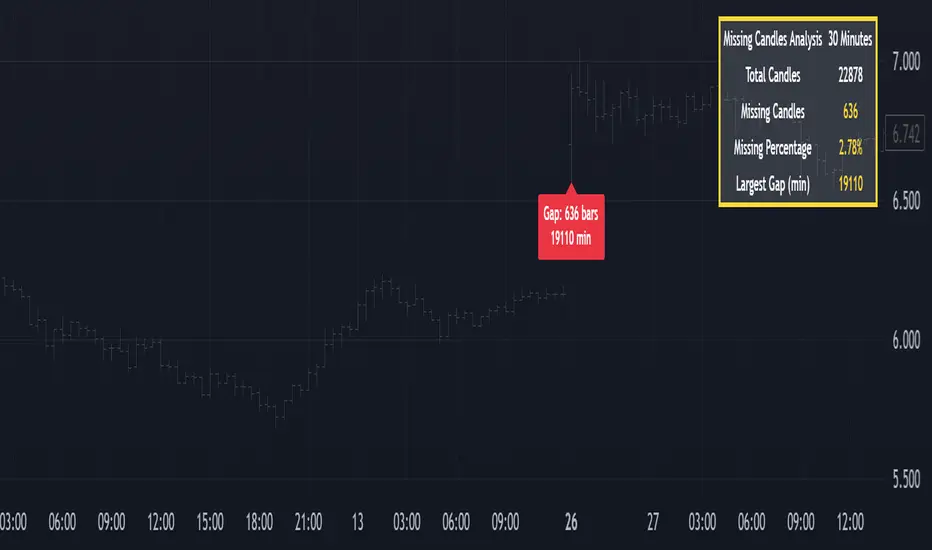
Missing Candle AnalyzerMissing Candle Analyzer: Purpose and Importance
Overview The Missing Candle Analyzer is a Pine Script tool developed to detect and analyze gaps in candlestick data, specifically for cryptocurrency trading. In cryptocurrency markets, it is not uncommon to observe missing candles—time periods where no price data is recorded. These gaps can occur due to low liquidity, exchange downtime, or data feed issues.
Purpose The primary purpose of this tool is to identify missing candles in a given timeframe and provide detailed statistics about these gaps. Missing candles can introduce significant errors in trading strategies, particularly those relying on continuous price data for technical analysis, backtesting, or automated trading. By detecting and quantifying these gaps, traders can: Assess the reliability of the price data. Adjust their strategies to account for incomplete data. Avoid potential miscalculations in indicators or trade signals that assume continuous candlestick data.
Why It Matters In cryptocurrency trading, where volatility is high and trading decisions are often made in real-time, missing candles can lead to: Inaccurate Technical Indicators : Indicators like moving averages, RSI, or MACD may produce misleading signals if candles are missing. Faulty Backtesting : Historical data with gaps can skew backtest results, leading to over-optimistic or unreliable strategy performance. Execution Errors : Automated trading systems may misinterpret gaps, resulting in unintended trades or missed opportunities.
By using the Missing Candle Analyzer, traders gain visibility into the integrity of their data, enabling them to make informed decisions and refine their strategies to handle such anomalies.
Functionality
The script performs the following tasks: Gap Detection : Identifies time gaps between candles that exceed the expected timeframe duration (with a configurable multiplier for tolerance). Statistics Calculation : Tracks total candles, missing candles, missing percentage, and the largest gap duration. Visualization : Displays a table with analysis results and optional markers on the chart to highlight gaps. User Customization : Allows users to adjust font size, table position, and whether to show gap markers.
Conclusion The Missing Candle Analyzer is a critical tool for cryptocurrency traders who need to ensure the accuracy and completeness of their price data. By highlighting missing candles and providing actionable insights, it helps traders mitigate risks and build more robust trading strategies. This tool is especially valuable in the volatile and often unpredictable cryptocurrency market, where data integrity can directly impact trading outcomes.
Time-Based Fair Value Gaps (FVG) with Inversions (iFVG)Overview
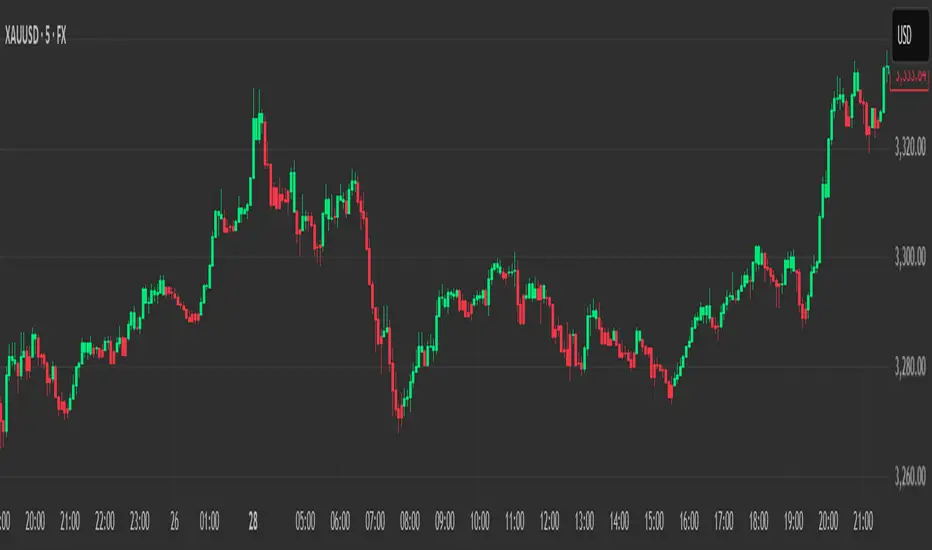
The Time-Based Fair Value Gaps (FVG) with Inversions (iFVG) (ICT/SMT) indicator is a specialized tool designed for traders using Inner Circle Trader (ICT) methodologies. Inspired by LuxAlgo's Fair Value Gap indicator, this script introduces significant enhancements by integrating ICT principles, focusing on precise time-based FVG detection, inversion tracking, and retest signals tailored for institutional trading strategies. Unlike LuxAlgo’s general FVG approach, this indicator filters FVGs within customizable 10-minute windows aligned with ICT’s macro timeframes and incorporates ICT-specific concepts like mitigation, liquidity grabs, and session-based gap prioritization.
This tool is optimized for 1–5 minute charts, though probably best for 1 minute charts, identifying bullish and bearish FVGs, tracking their mitigation into inverted FVGs (iFVGs) as key support/resistance zones, and generating retest signals with customizable “Close” or “Wick” confirmation. Features like ATR-based filtering, optional FVG labels, mitigation removal, and session-specific FVG detection (e.g., first FVG in AM/PM sessions) make it a powerful tool for ICT traders.
Originality and Improvements
While inspired by LuxAlgo’s FVG indicator (credit to LuxAlgo for their foundational work), this script significantly extends the original concept by:
1. Time-Based FVG Detection: Unlike LuxAlgo’s continuous FVG identification, this script filters FVGs within user-defined 10-minute windows each hour (:00–:10, :10–:20, etc.), aligning with ICT’s emphasis on specific periods of institutional activity, such as hourly opens/closes or kill zones (e.g., New York 7:00–11:00 AM EST). This ensures FVGs are relevant to high-probability ICT setups.
2. Session-Specific First FVG Option: A unique feature allows traders to display only the first FVG in ICT-defined AM (9:30–10:00 AM EST) or PM (1:30–2:00 PM EST) sessions, reflecting ICT’s focus on initial market imbalances during key liquidity events.
3. ICT-Driven Mitigation and Inversion Logic: The script tracks FVG mitigation (when price closes through a gap) and converts mitigated FVGs into iFVGs, which serve as ICT-style support/resistance zones. This aligns with ICT’s view that mitigated gaps become critical reversal points, unlike LuxAlgo’s simpler gap display.
4. Customizable Retest Signals: Retest signals for iFVGs are configurable for “Close” (conservative, requiring candle body confirmation) or “Wick” (faster, using highs/lows), catering to ICT traders’ need for precise entry timing during liquidity grabs or Judas swings.
5. ATR Filtering and Mitigation Removal: An optional ATR filter ensures only significant FVGs are displayed, reducing noise, while mitigation removal declutters the chart by removing filled gaps, aligning with ICT’s principle that mitigated gaps lose relevance unless inverted.
6. Timezone and Timeframe Safeguards: A timezone offset setting aligns FVG detection with EST for ICT’s New York-centric strategies, and a timeframe warning alerts users to avoid ≥1-hour charts, ensuring accuracy in time-based filtering.
These enhancements make the script a distinct tool that builds on LuxAlgo’s foundation while offering ICT traders a tailored, high-precision solution.
How It Works
FVG Detection
FVGs are identified when a candle’s low is higher than the high of two candles prior (bullish FVG) or a candle’s high is lower than the low of two candles prior (bearish FVG). Detection is restricted to:
• User-selected 10-minute windows (e.g., :00–:10, :50–:60) to capture ICT-relevant periods like hourly transitions.
• AM/PM session first FVGs (if enabled), focusing on 9:30–10:00 AM or 1:30–2:00 PM EST for key market opens.
An optional ATR filter (default: 0.25× ATR) ensures only gaps larger than the threshold are displayed, prioritizing significant imbalances.
Mitigation and Inversion
When price closes through an FVG (e.g., below a bullish FVG’s bottom), the FVG is mitigated and becomes an iFVG, plotted as a support/resistance zone. iFVGs are critical in ICT for identifying reversal points where institutional orders accumulate.
Retest Signals
The script generates signals when price retests an iFVG:
• Close: Triggers when the candle body confirms the retest (conservative, lower noise).
• Wick: Triggers when the candle’s high/low touches the iFVG (faster, higher sensitivity). Signals are visualized with triangular markers (▲ for bullish, ▼ for bearish) and can trigger alerts.
Visualization
• FVGs: Displayed as colored boxes (green for bullish, red for bearish) with optional “Bull FVG”/“Bear FVG” labels.
• iFVGs: Shown as extended boxes with dashed midlines, limited to the user-defined number of recent zones (default: 5).
• Mitigation Removal: Mitigated FVGs/iFVGs are removed (if enabled) to keep the chart clean.
How to Use
Recommended Settings
• Timeframe: Use 1–5 minute charts for precision, avoiding ≥1-hour timeframes (a warning label appears if misconfigured).
• Time Windows: Enable :00–:10 and :50–:60 for hourly open/close FVGs, or use the “Show only 1st presented FVG” option for AM/PM session focus.
• ATR Filter: Keep enabled (multiplier 0.25–0.5) for significant gaps; disable on 1-minute charts for more FVGs during volatility.
• Signal Preference: Use “Close” for conservative entries, “Wick” for aggressive setups.
• Timezone Offset: Set to -5 for EST (or -4 for EDT) to align with ICT’s New York session.
Trading Strategy
1. Macro Timeframes: Focus on New York (7:00–11:00 AM EST) or London (2:00–5:00 AM EST) kill zones for high institutional activity.
2. FVG Entries: Trade bullish FVGs as support in uptrends or bearish FVGs as resistance in downtrends, especially in :00–:10 or :50–:60 windows.
3. iFVG Retests: Enter on retest signals (▲/▼) during liquidity grabs or Judas swings, using “Close” for confirmation or “Wick” for speed.
4. Session FVGs: Use the “Show only 1st presented FVG” option to target the first gap in AM/PM sessions, often tied to ICT’s market maker algorithms.
5. Risk Management: Combine with ICT concepts like order blocks or breaker blocks for confluence, and set stops beyond FVG/iFVG boundaries.
Alerts
Set alerts for:
• “Bullish FVG Detected”/“Bearish FVG Detected”: New FVGs in selected windows.
• “Bullish Signal”/“Bearish Signal”: iFVG retest confirmations.
Settings Description
• Show Last (1–100, default: 5): Number of recent iFVGs to display. Lower values reduce clutter.
• Show only 1st presented FVG : Limits FVGs to the first in 9:30–10:00 AM or 1:30–2:00 PM EST sessions (overrides time window checkboxes).
• Time Window Checkboxes: Enable/disable FVG detection in 10-minute windows (:00–:10, :10–:20, etc.). All enabled by default.
• Signal Preference: “Close” (default) or “Wick” for iFVG retest signals.
• Use ATR Filter: Enables ATR-based size filtering (default: true).
• ATR Multiplier (0–∞, default: 0.25): Sets FVG size threshold (higher values = larger gaps).
• Remove Mitigated FVGs: Removes filled FVGs/iFVGs (default: true).
• Show FVG Labels: Displays “Bull FVG”/“Bear FVG” labels (default: true).
• Timezone Offset (-12 to 12, default: -5): Aligns time windows with EST.
• Colors: Customize bullish (green), bearish (red), and midline (gray) colors.
Why Use This Indicator?
This indicator empowers ICT traders with a tool that goes beyond generic FVG detection, offering precise, time-filtered gaps and inversion tracking aligned with institutional trading principles. By focusing on ICT’s macro timeframes, session-specific imbalances, and customizable signal logic, it provides a clear edge for scalping, swing trading, or reversal setups in high-liquidity markets.

X OHLdesigned to plot significant levels—closed higher timeframe High, Low, Open, and an Equilibrium (EQ) level and current Open—on the current chart based on user-defined higher timeframes (HTFs). It helps traders visualize HTF price levels on lower timeframes for confluence, context, or decision-making.
Key Functional Components:
Configurable Inputs:
Four Timeframes: Customizable (default: 1H, 4H, D, W).
Visibility Toggles for:
Previous High (pHigh)
Previous Low (pLow)
EQ (midpoint between high and low)
Current Open
Previous Open
How It Works:
For each selected timeframe:
retrieves OHL Data
Previous high/low (high , low )
Current and previous open
EQ is calculated as midpoint: (high + low) / 2
Draws Horizontal Lines:
Lines are drawn from the candle where the HTF bar opens and extended until timeframe switch. Lines extends a few bars beyond current to assist in visualization
Labels:
On the most recent bar, each level is labeled with a description (pHigh 1H, EQ 6H, etc.).
Labels are customizable (size, color, background).
Anchoring:
Lines and labels are redrawn on the start of each new HTF bar to ensure accuracy and relevance.

[blackcat] L3 Twin Range Filter ProOVERVIEW
The L3 Twin Range Filter Pro indicator enhances trading strategies by filtering out market noise through a sophisticated dual-range approach. Unlike previous versions, this script not only provides clear visual indications of buy/sell signals but also incorporates a dynamic trend range filter line. By averaging two smoothed exponential moving averages—one fast and one slow—the indicator generates upper and lower range boundaries that adapt to changing market conditions. Traders can easily spot buy/sell opportunities when the closing price crosses these boundaries, supported by configurable alerts for real-time notifications.
FEATURES
Dual-Range Calculation: Combines fast and slow moving averages to create adaptive range boundaries.
Customizable Parameters:
Periods: Adjustable lengths for fast (default 9 bars) and slow (default 34 bars) moving averages.
Multipliers: Coefficients to modify the distance of the trailing lines from the price.
Dynamic Trend Range Filter Line: Visually displays buy/sell signals directly on the chart.
Trailing Stop Loss Logic: Automatically follows price movements to act as a trailing stop loss indicator.
Trade Signals: Clearly indicates buy/sell points with labeled signals.
Alerts: Configurable notifications for buy/sell signals to keep traders informed.
Visual Enhancements: Colored fills and dynamic boundary lines for easy interpretation.
HOW TO USE
Add the L3 Twin Range Filter Pro indicator to your TradingView chart.
Customize the input parameters:
Price Source: Choose the desired price source (e.g., Close).
Show Trade Signals: Toggle on/off for displaying buy/sell labels.
Fast Period: Set the period for the fast moving average (default 9 bars).
Slow Period: Set the period for the slow moving average (default 34 bars).
Fast Range Multiplier: Adjust the multiplier for the fast moving average.
Slow Range Multiplier: Adjust the multiplier for the slow moving average.
Monitor the plotted trend range filter and dynamic boundaries on the chart.
Identify buy/sell signals based on the crossing of price and range boundaries.
Configure alerts for real-time notifications when signals are triggered.
TRADE LOGIC
BUY Signal: Triggered when the price is higher than or equal to the upper range level. The indicator line will trail just below the price, acting as a trailing stop loss.
SELL Signal: Triggered when the price is lower than or equal to the lower range level. The indicator line will trail just above the price, serving as a trailing stop loss.
LIMITATIONS
The performance of this indicator relies on the selected periods and multipliers.
Market volatility can impact the accuracy of the signals.
Always complement this indicator with other analytical tools for robust decision-making.
NOTES
Experiment with different parameter settings to optimize the indicator for various market conditions.
Thoroughly backtest the indicator using historical data to ensure its compatibility with your trading strategy.
THANKS
A big thank you to Colin McKee for his foundational work on the Twin Range Filter! Your contributions have paved the way for enhanced trading tools. 🙏📈🔍

Heikin Ashi Colored Regular OHLC CandlesHeikin Ashi Colored Regular OHLC Candles
In the world of trading, Heikin Ashi candles are a popular tool for smoothing out price action and identifying trends more clearly. However, Heikin Ashi candles do not reflect the actual open, high, low, and close prices of a market. They are calculated values that change the chart’s structure. This can make it harder to see precise price levels or use standard price-based tools effectively.
To get the best of both worlds, we can apply the color logic of Heikin Ashi candles to regular OHLC candles. This means we keep the true market data, but show the trend visually in the same smooth way Heikin Ashi candles do.
Why use this approach
Heikin Ashi color logic filters out noise and helps provide a clearer view of the current trend direction. Since we are still plotting real OHLC candles, we do not lose important price information such as actual highs, lows, or closing prices. This method offers a hybrid view that combines the accuracy of real price levels with the visual benefits of Heikin Ashi trend coloring. It also helps maintain visual consistency for traders who are used to Heikin Ashi signals but want to see real price action.
Advantages for scalping
Scalping requires fast decisions. Even small price noise can lead to hesitation or bad entries. Coloring regular candles based on Heikin Ashi direction helps reduce that noise and makes short-term trends easier to read. It allows for faster confirmation of momentum without switching away from real prices. Since the candles are not modified, scalpers can still place tight stop-losses and targets based on actual price structure. This approach also avoids clutter, keeping the chart clean and focused.
How it works
We calculate the Heikin Ashi values in the background. If the Heikin Ashi close is higher than the Heikin Ashi open, the trend is considered bullish and the candle is colored green. If the close is lower than the open, it is bearish and the candle is red. If they are equal, the candle is gray or neutral. We then use these colors to paint the real OHLC candles, which are unchanged in shape or position.
ConeCastConeCast is a forward-looking projection indicator that visualizes a future price range (or "cone") based on recent trend momentum and adaptive volatility. Unlike lagging bands or reactive channels, this tool plots a predictive zone 3–50 bars ahead, allowing traders to anticipate potential price behavior rather than merely react to it.
How It Works
The core of ConeCast is a dynamic trend-slope engine derived from a Linear Regression line fitted over a user-defined lookback window. The slope of this trend is projected forward, and the cone’s width adapts based on real-time market volatility. In calm markets, the cone is narrow and focused. In volatile regimes, it expands proportionally, using an ATR-based % of price to scale.
Key Features
📈 Predictive Cone Zone: Visualizes a forward range using trend slope × volatility width.
🔄 Auto-Adaptive Volatility Scaling: Expands or contracts based on market quiet/chaotic states.
📊 Regime Detection: Identifies Bull, Bear, or Neutral states using a tunable slope threshold.
🧭 Multi-Timeframe Compatible: Slope and volatility can be calculated from higher timeframes.
🔔 Smart Alerts: Detects price entering the cone, and signals trend regime changes in real time.
🖼️ Clean Visual Output: Optionally includes outer cones, trend-trail marker, and dashboard label.
How to Use It
Use on 15m–4H charts for best forward visibility.
Look for price entering the cone as a potential trend continuation setup.
Monitor regime changes and volatility expansion to filter choppy market zones.
Tune the slope sensitivity and ATR multiplier to match your symbol's behavior.
Use outer cones to anticipate aggressive swings and wick traps.
What Makes It Unique
ConeCast doesn’t follow price — it predicts a possible future price envelope using trend + volatility math, without relying on lagging indicators or repainting logic. It's a hybrid of regression-based forecasting and dynamic risk zoning, designed for swing traders, scalpers, and algo developers alike.
Limitations
ConeCast projects based on current trend and volatility — it does not "know" future price. Like all projection tools, accuracy depends on trend persistence and market conditions. Use this in combination with confirmation signals and risk management.

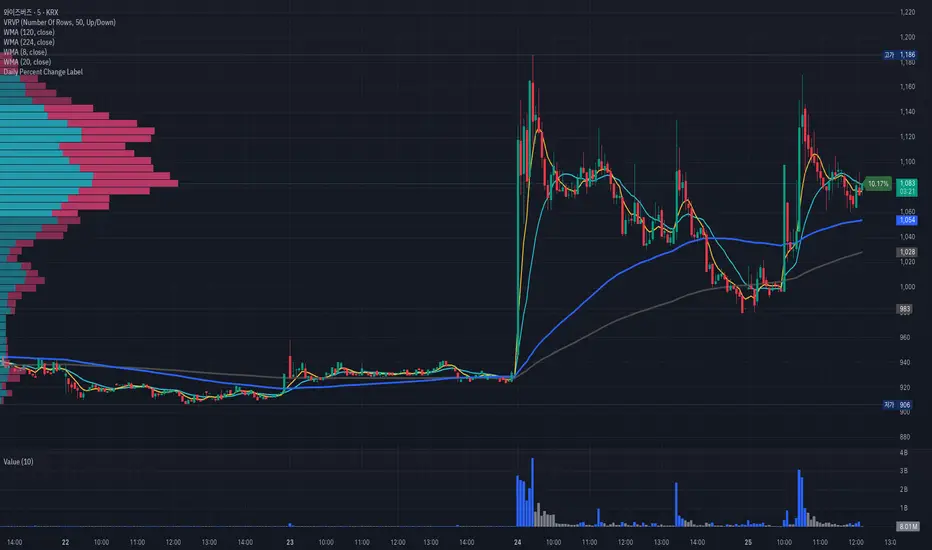
Daily Percent Change LabelDaily Percent Change Label
Overview
This Pine Script displays the percentage change from the previous day's closing price as a text label near the current price level on the chart. It works seamlessly across any timeframe (daily, hourly, minute charts) by referencing the daily chart's previous close, making it perfect for traders tracking daily performance.
The label is displayed with a semi-transparent background (green for positive changes, red for negative changes) and white text, ensuring a clean and readable appearance.
Features
Accurate Daily Percent Change: Calculates the percentage change based on the previous day's closing price, even on intraday timeframes (e.g., 1-hour, 5-minute).
Dynamic Label: Shows the percentage change as a label aligned with the current price, updating in real-time.
Color-Coded Background: Semi-transparent green background for positive changes and red for negative changes.
Customizable: Adjust label position, size, color, and style to fit your preferences.
Minimal Impact: No additional plots or graphs, keeping the chart uncluttered.
How to Use
Add the Script:
Copy and paste the script into the Pine Editor in TradingView.
Click "Add to Chart" to apply it.
Check the Output:
A text label (e.g., "+2.34%" or "-1.56%") appears near the current price with a semi-transparent background.
The label is colored green (positive) or red (negative) and updates in real-time.
Switch Timeframes:
Works on any timeframe. The percentage change is always calculated relative to the previous day's close.
Customization Options
Modify the label.new function to customize the label:
Label Position:
Change style=label.style_label_left to label.style_label_right or label.style_label_down to adjust label placement.
Adjust bar_index with an offset (e.g., bar_index + 1) to move the label horizontally.
Text Color:
Modify textcolor=color.white to another color (e.g., color.rgb(255, 255, 0) for yellow).
Background Color:
Adjust color=percent_change >= 0 ? color.new(color.green, 50) : color.new(color.red, 50) to change transparency (e.g., color.new(color.green, 0) for no transparency).
Text Size:
Change size=size.normal to size.small or size.large for smaller or larger text.
Code Details
Timeframe Handling: Uses request.security with the "D" timeframe to fetch the previous day's closing price, ensuring accuracy on intraday charts.
Performance: Updates only on the last bar (barstate.islast) for optimal performance.
Dynamic Styling: Background color changes based on the direction of the price change.
Notes
The label is positioned near the current price for easy reference. To move it closer to the Y-axis, adjust the bar_index offset.
For different reference points (e.g., weekly close), modify the request.security timeframe (e.g., "W" for weekly).
Ensure the script is copied correctly without extra spaces or characters. Use a plain text editor (e.g., Notepad) for copying.
Feedback
Please share your feedback or customizations in the comments! If you find this script helpful, give it a thumbs-up or let others know how you're using it. Happy trading!
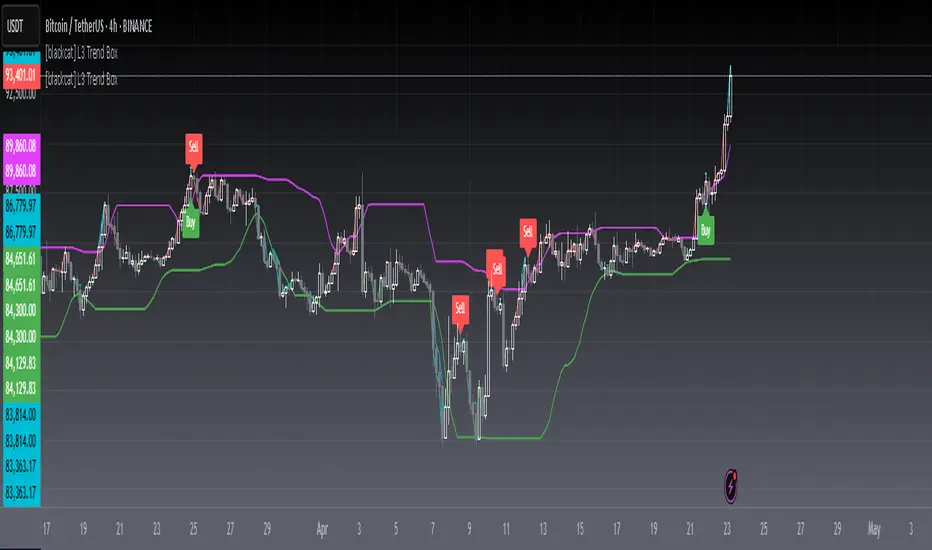
[blackcat] L3 Trend BoxOVERVIEW
The L3 Trend Box indicator is a sophisticated technical analysis tool designed to assist traders in identifying trends and pinpointing potential entry and exit points within the market. By leveraging multiple moving averages and price level analyses, this indicator provides a detailed view of market dynamics. It plots several key lines and labels directly onto the chart, offering clear visual signals for both bullish and bearish scenarios. Its adaptability through customizable parameters makes it suitable for various trading strategies and market conditions 📊✅.
FEATURES
Comprehensive Parameter Customization: Tailor the indicator to match specific trading preferences:
High Length: Defines the period over which the highest prices are considered.
Low Length: Specifies the period for evaluating the lowest prices.
Upper Box Length: Smoothes out the upper boundary of the trend box using a specified period.
Lower Box Length: Smoothes out the lower boundary of the trend box similarly.
Trend Line Length: Determines the period for calculating the overall trend line.
Fast EMA Length: Sets the period for the fast-moving exponential moving average (EMA), crucial for capturing short-term movements.
MA15 EMA Length: Configures the period for the medium-term moving average (MA15 EMA) to provide a balanced perspective.
Short Spirit Length: Influences how quickly the indicator responds to recent price changes.
Golden EMA Length: Fine-tunes the long-term EMA for stability and reliability.
Buy Price Length: Establishes the lookback period for determining optimal buy prices.
Var1 Length & Var2 Length: Adjusts periods for variance calculations, enhancing the accuracy of trend detection.
Detailed Chart Plots:
Upper Box Top: A fuchsia-colored line representing the smoothed highest prices, marking resistance levels.
Lower Box Bottom: A green-colored line showing the smoothed lowest prices, highlighting support zones.
MA15 Up/Down: Dynamic red and green lines illustrating the directionality of the 15-period EMA, helping gauge momentum shifts.
Conditional Plots: Multiple lines based on intricate price actions and computed values, such as closing below the lower box while also closing at or above/below the opening price, ensuring nuanced insights into market behavior.
Buy/Sell Labels: Clearly marked 'Buy' and 'Sell' labels positioned strategically on the chart, facilitating quick decision-making without missing critical signals 🎯.
Alert System: Automatically generates alerts based on predefined buy and sell conditions, enabling timely responses to market changes 🛎️.
HOW TO USE
Adding the Indicator: Start by adding the L3 Trend Box to your TradingView chart via the indicators menu.
Parameter Configuration: Adjust each parameter according to your trading style and market volatility. For instance, increasing the High Length can make the indicator less sensitive to minor fluctuations but more responsive to significant trends.
Monitoring Signals: Keep an eye on the plotted lines and labels. Pay special attention to the crossover events between the fast EMA and the lower box bottom, as these often signify strong buy signals.
Setting Alerts: Configure alerts based on the buy/sell conditions provided by the indicator. This ensures you never miss an opportunity due to inattention.
Combining Strategies: While powerful on its own, combining this indicator with others like RSI or Bollinger Bands can enhance its predictive power and reduce false positives.
LIMITATIONS
Market Volatility: In extremely volatile or sideways-trending markets, the indicator might produce false signals. Always verify with additional confirmations.
Asset-Specific Performance: Different assets and timeframes will yield varying results; thorough backtesting across diverse instruments is recommended.
Over-Reliance Risk: Avoid relying solely on this indicator. Integrate it into a broader analytical framework that includes fundamental analysis and other technical indicators.
NOTES
Data Sufficiency: Ensure ample historical data is available for precise computations. Lack of data can skew results and lead to inaccurate signals.
Demo Testing: Before deploying the indicator in real trades, rigorously test it on demo accounts under varied market conditions to understand its strengths and weaknesses.
Customization Flexibility: Feel free to tweak the parameters continuously until they align perfectly with your unique trading approach and risk tolerance.
[blackcat] L2 Rhythm RiderOVERVIEW
The L2 Rhythm Rider is an advanced technical analysis tool meticulously crafted to assist traders in identifying intricate market rhythms and uncovering lucrative trading opportunities. By integrating sophisticated calculations such as weighted averages, deviations from Simple Moving Averages (SMAs), and bespoke oscillators, this indicator offers profound insights into market dynamics, momentum, and trend reversals. Whether you're a seasoned trader looking to refine your strategies or a novice seeking robust analytical tools, the Rhythm Rider provides a comprehensive suite of features tailored to enhance your decision-making process 📊✅.
FEATURES
Comprehensive Calculation Suite:
Percentage Deviation from SMA: Quantifies the deviation of the current price from the Simple Moving Average, providing a nuanced understanding of price behavior relative to historical trends.
Normalized Price Range: Standardizes price movements within a defined range, offering a clearer perspective on market volatility and stability.
Explore Line and Average: Utilizes Exponential Moving Averages (EMAs) to gauge market momentum, helping traders anticipate potential shifts in direction.
Banker Fund and Average: Evaluates market sentiment across varying timeframes, enabling traders to align their strategies with broader market trends.
RSI-Like Indicator: Delivers a Relative Strength Index-inspired metric that assesses the magnitude of price changes, akin to traditional RSI but with unique enhancements.
Bear Power: Analyzes selling pressure by examining recent highs and lows, providing valuable insights into bearish market conditions.
Enhanced Color Coding:
Overbought Conditions: Values exceeding 70 are emphasized with warm hues like red and orange, signaling potential overbought scenarios where caution is advised 🔥.
Oversold Conditions: Values falling below 60 are accentuated with cool tones such as blue and cyan, indicating oversold situations ripe for potential buying opportunities ❄️.
Adjusted Line Widths:
Improved Visibility: Line widths have been fine-tuned to ensure clear differentiation between various plotted elements, making it easier to interpret complex market data at a glance 👀.
Visual Representation:
Explore Line: Displayed in blue or red, depending on its value, to signify bullish or bearish momentum.
Banker Fund: Illustrated in orange or aqua, reflecting differing levels of market sentiment.
Bear Power: Depicted through purple columns, highlighting areas of significant selling pressure.
Trade Signals:
Buy ('B') and Sell ('S') Labels: Clearly marked on the chart to indicate optimal entry and exit points, facilitating swift and informed trading decisions 🏷️.
Automated Alerts:
Customizable Notifications: Generate alerts based on predefined conditions, ensuring traders never miss out on critical market movements 🔔.
HOW TO USE
Adding the Indicator:
Navigate to your TradingView chart and select the L2 Rhythm Rider from the indicators list.
Interpreting Visual Elements:
Familiarize yourself with the various plotted lines and columns, each representing distinct facets of market momentum and sentiment.
Monitoring Trade Opportunities:
Keep an eye on the chart for buy and sell labels, which signal potential trading opportunities based on the indicator's calculations.
Setting Up Alerts:
Configure alerts to notify you when specific conditions are met, allowing for timely action without constant chart monitoring 📲.
Combining Insights:
Integrate the information derived from all plotted elements to form a holistic view of the market, enhancing the reliability of your trading decisions.
LIMITATIONS
Market Volatility: In highly volatile or ranging markets, the indicator might produce false signals, necessitating additional confirmation from other analytical tools 🌪️.
Supplementary Analysis: For enhanced accuracy, users should complement this indicator with other forms of technical and fundamental analysis.
Asset and Timeframe Sensitivity: The performance of the indicator can fluctuate based on the asset type and chosen timeframe, requiring periodic adjustments and evaluations.
NOTES
Data Sufficiency: Ensure ample historical data is available to facilitate precise calculations and reliable results.
Demo Testing: Thoroughly test the indicator on demo accounts prior to deploying it in live trading environments to understand its nuances and limitations 🔍.
Personalization: Tailor the indicator’s settings and visual preferences to better suit individual trading styles and objectives.

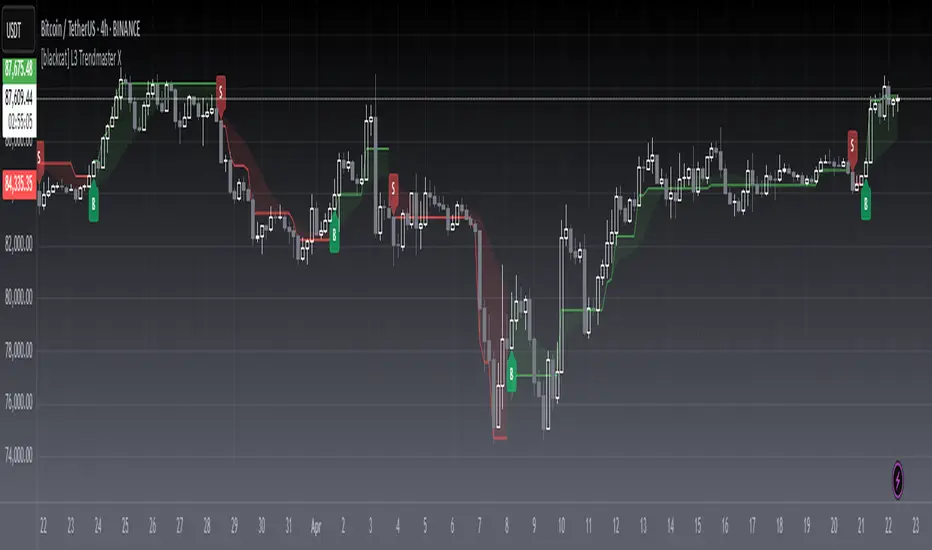
[blackcat] L3 Trendmaster XOVERVIEW
The L3 Trendmaster X is an advanced trend-following indicator meticulously crafted to assist traders in identifying and capitalizing on market trends. This sophisticated tool integrates multiple technical factors, including Average True Range (ATR), volume dynamics, and price spreads, to deliver precise buy and sell signals. By plotting dynamic trend bands directly onto the chart, it offers a comprehensive visualization of potential trend directions, enabling traders to make informed decisions swiftly and confidently 📊↗️.
FEATURES
Customizable Input Parameters: Tailor the indicator to match your specific trading needs with adjustable settings:
Trendmaster X Multiplier: Controls the sensitivity of the ATR-based levels.
Trendmaster X Period: Defines the period over which the ATR is calculated.
Window Length: Specifies the length of the moving window for standard deviation calculations.
Volume Averaging Length: Determines how many periods are considered for averaging volume.
Volatility Factor: Adjusts the impact of volatility on the trend bands.
Core Technical Metrics:
Dynamic Range: Measures the range between high and low prices within each bar.
Candle Body Size: Evaluates the difference between open and close prices.
Volume Average: Assesses the cumulative On-Balance Volume relative to the dynamic range.
Price Spread: Computes the standard deviation of the price ranges over a specified window.
Volatility Factor: Incorporates volatility into the calculation of trend bands.
Advanced Trend Bands Calculation:
Upper Level: Represents potential resistance levels derived from the ATR multiplier.
Lower Level: Indicates possible support levels using the same ATR multiplier.
High Band and Low Band: Dynamically adjust to reflect current trend directions, offering a clear view of market sentiment.
Visual Representation:
Plots distinct green and red trend lines representing bullish and bearish trends respectively.
Fills the area between these trend lines and the middle line for enhanced visibility.
Displays clear buy ('B') and sell ('S') labels on the chart for immediate recognition of trading opportunities 🏷️.
Alert System:
Generates real-time alerts when buy or sell conditions are triggered, ensuring timely action.
Allows customization of alert messages and frequencies to align with individual trading strategies 🔔.
HOW TO USE
Adding the Indicator:
Open your TradingView platform and navigate to the "Indicators" section.
Search for " L3 Trendmaster X" and add it to your chart.
Adjusting Settings:
Fine-tune the input parameters according to your preferences and trading style.
For example, increase the Trendmaster X Multiplier for higher sensitivity during volatile markets.
Decrease the Window Length for shorter-term trend analysis.
Monitoring Trends:
Observe the plotted trend bands and labels on the chart.
Look for buy ('B') labels at potential support levels and sell ('S') labels at resistance levels.
Setting Up Alerts:
Configure alerts based on the generated buy and sell signals.
Choose notification methods (e.g., email, SMS) and set alert frequencies to stay updated without constant monitoring 📲.
Combining with Other Tools:
Integrate the Trendmaster X with other technical indicators like Moving Averages or RSI for confirmation.
Utilize fundamental analysis alongside the indicator for a holistic approach to trading.
Backtesting and Optimization:
Conduct thorough backtests on historical data to evaluate performance.
Optimize parameters based on backtest results to enhance accuracy and reliability.
Real-Time Application:
Apply the optimized settings to live charts and monitor real-time signals.
Execute trades based on confirmed signals while considering risk management principles.
LIMITATIONS
Market Conditions: The indicator might produce false signals in highly volatile or sideways-trending markets due to increased noise and lack of clear direction 🌪️.
Complementary Analysis: Traders should use this indicator in conjunction with other analytical tools to validate signals and reduce the likelihood of false positives.
Asset-Specific Performance: Effectiveness can vary across different assets and timeframes; therefore, testing on diverse instruments is recommended.
NOTES
Data Requirements: Ensure adequate historical data availability for accurate calculations and reliable signal generation.
Demo Testing: Thoroughly test the indicator on demo accounts before deploying it in live trading environments to understand its behavior under various market scenarios.
Parameter Customization: Regularly review and adjust parameters based on evolving market conditions and personal trading objectives.
CandlestickUtilitiesThis library provides essential functions for candlestick chart analysis and pattern recognition in Pine Script®.
It includes:
• Candle structure analysis (bodies, shadows, lengths)
• Trend detection using EMAs
• Common candlestick pattern recognition
This library is under construction.
Designed to support strategy development and improve signal accuracy for traders.
Created by @xprophetx — under MPL-2.0 license.

DEMA Trend Oscillator Strategy📌 Overview
The DEMA Trend Oscillator Strategy is a dynamic trend-following approach based on the Normalized DEMA Oscillator SD.
It adapts in real-time to market volatility with the goal of improving entry accuracy and optimizing risk management.
⚠️ This strategy is provided for educational and research purposes only.
Past performance does not guarantee future results.
🎯 Strategy Objectives
The main goal of this strategy is to respond quickly to sudden price movements and trend reversals,
by combining momentum-based signals with volatility filters.
It is designed to be user-friendly for traders of all experience levels.
✨ Key Features
Normalized DEMA Oscillator: A momentum indicator that normalizes DEMA values on a 0–100 scale, allowing intuitive identification of trend strength
Two-Bar Confirmation Filter: Requires two consecutive bullish or bearish candles to reduce noise and enhance entry reliability
ATR x2 Trailing Stop: In addition to fixed stop-loss levels, a trailing stop based on 2× ATR is used to maximize profits during strong trends
📊 Trading Rules
Long Entry:
Normalized DEMA > 55 (strong upward momentum)
Candle low is above the upper SD band
Two consecutive bullish candles appear
Short Entry:
Normalized DEMA < 45 (downward momentum)
Candle high is below the lower SD band
Two consecutive bearish candles appear
Exit Conditions:
Take-profit at a risk-reward ratio of 1.5
Stop-loss triggered if price breaks below (long) or above (short) the SD band
Trailing stop activated based on 2× ATR to secure and extend profits
💰 Risk Management Parameters
Symbol & Timeframe: Any (AUDUSD 5M example)
Account size (virtual): $3000
Commission: 0.4PIPS(0.0004)
Slippage: 2 pips
Risk per trade: 5%
Number of trades (backtest):534
All parameters can be adjusted based on broker specifications and individual trading profiles.
⚙️ Trading Parameters & Considerations
Indicator: Normalized DEMA Oscillator SD
Parameter settings:
DEMA Period (len_dema): 40
Base Length: 20
Long Threshold: 55
Short Threshold: 45
Risk-Reward Ratio: 1.5
ATR Multiplier for Trailing Stop: 2.0
🖼 Visual Support
The chart displays the following visual elements:
Upper and lower SD bands (±2 standard deviations)
Entry signals shown as directional arrows
🔧 Strategy Improvements & Uniqueness
This strategy is inspired by “Normalized DEMA Oscillator SD” by QuantEdgeB,
but introduces enhancements such as a two-bar confirmation filter and an ATR-based trailing stop.
Compared to conventional trend-following strategies, it offers superior noise filtering and profit optimization.
✅ Summary
The DEMA Trend Oscillator Strategy is a responsive and practical trend-following method
that combines momentum detection with adaptive risk management.
Its visual clarity and logical structure make it a powerful and repeatable tool
for traders seeking consistent performance in trending markets.
⚠️ Always apply appropriate risk management. This strategy is based on historical data and does not guarantee future results.

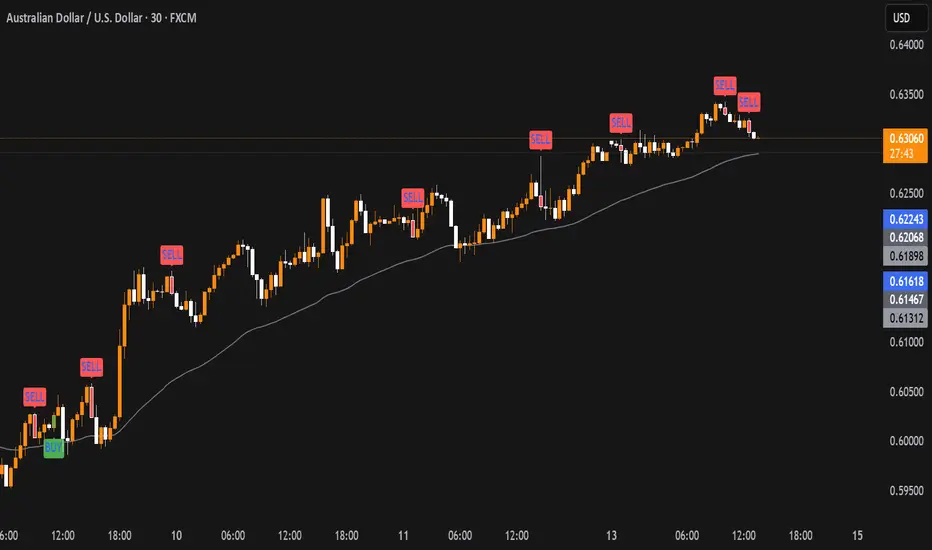
Liquidity Sweep with EMAThis Pine Script indicator helps traders identify potential market reversals based on liquidity sweeps, where the price moves through the previous candle's low or high and then closes above or below the previous candle's wick. These are often seen as significant market moves or liquidity grabs before a potential reversal or continuation.
The indicator is also equipped with an EMA (Exponential Moving Average) as an optional visual aid to give traders a sense of the prevailing trend, though it is not used as part of the signal generation logic.
Key Features:
Liquidity Sweep Detection:
Bullish Sweep: Triggered when the current candle sweeps below the low of the previous candle and then closes above the high of the previous candle. This indicates a potential market reversal to the upside after the liquidity sweep.
Bearish Sweep: Triggered when the current candle sweeps above the high of the previous candle and then closes below the low of the previous candle. This indicates a potential market reversal to the downside after the liquidity sweep.
EMA:
The EMA (50) is plotted on the chart for visual trend guidance. While it is not used to confirm the signals, it can help traders see if the market is in a general uptrend or downtrend.
Signal Presentation:
Buy Signal: The indicator will plot a green upward arrow below the candle when a bullish liquidity sweep is detected.
Sell Signal: The indicator will plot a red downward arrow above the candle when a bearish liquidity sweep is detected.
Timeframe Filter:
The indicator only generates signals on the following timeframes: 30-minute, 1-hour, 4-hour, and Daily. This helps to ensure the sweeps are significant and likely to result in meaningful price moves.
Alerts:
Alerts can be set up for both bullish and bearish sweep signals, so traders can be notified when these events occur.
Customizable:
EMA Length: The length of the Exponential Moving Average (EMA) can be adjusted. By default, it is set to 50, but you can modify this to fit your trading strategy.
Show EMA Option: You can toggle whether or not to display the EMA line on the chart.
How It Works:
The indicator looks for price action patterns where the current candle sweeps through the high or low of the previous candle and closes beyond the previous wick.
These patterns are often seen as potential traps, where the price initially moves in one direction (sweeping the liquidity) and then quickly reverses, making them important for traders who want to catch reversals or breakouts after a liquidity sweep.
The EMA (50) gives a general trend direction but doesn't directly affect the trade signals. It serves as a visual reference for trend analysis.
Potential Use Cases:
Reversal Trading: Traders can use this indicator to catch reversals after a liquidity sweep. The green upward arrows may indicate a bullish reversal, while the red downward arrows may indicate a bearish reversal.
Trend Trading: The EMA can help traders gauge the overall market trend. If the price is above the EMA, the market may be in an uptrend, and traders may focus on bullish sweeps. Conversely, if the price is below the EMA, the market may be in a downtrend, and traders may focus on bearish sweeps.
Confirmation with Other Indicators: Although the EMA is not used to confirm signals in this script, it can be combined with other indicators (like RSI, Volume, or MACD) to enhance the accuracy of your trades.
Final Thoughts:
This script is designed to identify liquidity sweeps and price reversals based on price action alone, without relying on complex indicators. The optional EMA serves as a helpful tool for understanding the overall market trend. It’s ideal for traders looking to spot potential reversal points after significant price sweeps and is suitable for multiple timeframes (30m, 1h, 4h, Daily).
You can use this description to help potential users understand the functionality of your indicator when publishing it on TradingView or selling it as an invite-only script. Let me know if you need any adjustments or further details!
Session extensions [dani]Session Extension
Indicator Description
The Session Extensions indicator is a customizable tool designed to visually represent key price levels during a specified trading session. It calculates and displays the high, low, and midpoints of the session, along with extension levels based on user-defined multipliers. These extensions help traders identify potential support and resistance zones beyond the initial session range.
This indicator is particularly useful for intraday traders who rely on session-based analysis to make informed decisions. It overlays directly on the chart, ensuring seamless integration with price action.
Key Features
Session-Based Analysis : Tracks and highlights key price levels (high, low, midpoint) during a specific trading session.
Customizable Extension Levels : Allows users to define up to six extension levels (both above and below the session range) with unique multipliers, colors, styles, and widths.
Real-Time Updates : Automatically updates during the active session and resets at the start of a new session.
Usage Guidelines
Add the Indicator to Your Chart : Apply the Session Extensions indicator to your chart to visualize key session-based levels.
Intraday Focus : This indicator is optimized for intraday trading. Ensure that the chart's timeframe is set to an intraday interval (e.g., 1-minute, 5-minute).
Session Alignment : Verify that the session time aligns with your trading schedule and timezone. Misalignment may result in incorrect session detection. (This indicator use America - New York timezone)
Avoid Overcrowding : While the indicator supports multiple extension levels, enabling too many levels simultaneously may clutter the chart. Use discretion when configuring extension levels.
Customize Line Styles and Colors : Tailor the appearance of lines and labels to align with your trading style. Use solid, dashed, or dotted lines, and choose colors that enhance visibility without cluttering the chart.
Combine with Other Tools : Pair this indicator with other technical analysis tools (e.g., moving averages, volume profiles) to enhance decision-making.
Disclaimer & Chat
The Session Extensions indicator is intended for educational and analytical purposes only. It does not provide financial advice or guarantee trading success. Users are responsible for verifying the accuracy of session times and ensuring proper configuration before using the indicator in live trading. This indicator is not a trading signal generator.
Thank you for choosing this indicator! I hope it becomes a valuable part of your trading toolkit. Remember, trading is a journey, and having the right tools can make all the difference. Whether you're a seasoned trader or just starting out, this indicator is designed to help you stay organized and focused on what matters most—price action. Happy trading, and may your charts be ever in your favor! 😊
From, Dani.

EMA-Based Squeeze Dynamics (Gap Momentum & EWMA Projection)EMA-Based Squeeze Dynamics (Gap Momentum & EWMA Projection)
🚨 Main Utility: Early Squeeze Warning
The primary function of this indicator is to warn traders early when the market is approaching a "squeeze"—a tightening condition that often precedes significant moves or regime shifts. By visually highlighting areas of increasing tension, it helps traders anticipate potential volatility and prepare accordingly. This is intended to be a statistically and psychologically grounded replacement of so-called "fib-time-zones," which are overly-deterministic and subjective.
📌 Overview
The EMA-Based Squeeze Dynamics indicator projects future regime shifts (such as golden and death crosses) using exponential moving averages (EMAs). It employs historical interval data and current market conditions to dynamically forecast when the critical EMAs (50-period and 200-period) will reconverge, marking likely trend-change points.
This indicator leverages two core ideas:
Behavioral finance theory: Traders often collectively anticipate popular EMA crossovers, creating a self-fulfilling prophecy (normative social influence), similar to findings from Solomon Asch’s conformity experiments.
Bayesian-like updates: It utilizes historical crossover intervals as a prior, dynamically updating expectations based on evolving market data, ensuring its signals remain objectively grounded in actual market behavior.
⚙️ Technical & Mathematical Explanation
1. EMA Calculations and Regime Definitions
The indicator uses three EMAs:
Fast (9-period): Represents short-term price movement.
Medial (50-period): Indicates medium-term trend direction.
Slow (200-period): Defines long-term market sentiment.
Regime States:
Bullish: 50 EMA is above the 200 EMA.
Bearish: 50 EMA is below the 200 EMA.
A shift between these states triggers visual markers (arrows and labels) directly on the chart.
2. Gap Dynamics and Historical Intervals
At each crossover:
The indicator records the gap (distance) between the 50 and 200 EMAs.
It tracks the historical intervals between past crossovers.
An Exponentially Weighted Moving Average (EWMA) of these intervals is calculated, weighting recent intervals more heavily, dynamically updating expectations.
Important note:
After every regime shift, the projected crossover line resets its calculation. This reset is visually evident as the projection line appears to move further away after each regime change, temporarily "repelled" until the EMAs begin converging again. This ensures projections remain realistic, grounded in actual EMA convergence, and prevents overly optimistic forecasts immediately after a regime shift.
3. Gap Momentum & Adaptive Scaling
The indicator measures how quickly or slowly the gap between EMAs is changing ("gap momentum") and adjusts its forecast accordingly:
If the gap narrows rapidly, a crossover becomes more imminent.
If the gap widens, the next crossover is pushed further into the future.
The "gap factor" dynamically scales the projection based on recent gap momentum, bounded between reasonable limits (0.7–1.3).
4. Squeeze Ratio & Background Color (Visual Cues)
A "squeeze ratio" is computed when market conditions indicate tightening:
In a bullish regime, if the fast EMA is below the medial EMA (price pulling back towards long-term support), the squeeze ratio increases.
In a bearish regime, if the fast EMA rises above the medial EMA (price rallying into long-term resistance), the squeeze ratio increases.
What the Background Colors Mean:
Red Background: Indicates a bullish squeeze—price is compressing downward, hinting a bullish reversal or continuation breakout may occur soon.
Green Background: Indicates a bearish squeeze—price is compressing upward, suggesting a bearish reversal or continuation breakout could soon follow.
Opacity Explanation:
The transparency (opacity) of the background indicates the intensity of the squeeze:
High Opacity (solid color): Strong squeeze, high likelihood of imminent volatility or regime shift.
Low Opacity (faint color): Mild squeeze, signaling early stages of tightening.
Thus, more vivid colors serve as urgent visual warnings that a squeeze is rapidly intensifying.
5. Projected Next Crossover and Pseudo Crossover Mechanism
The indicator calculates an estimated future bar when a crossover (and thus, regime shift) is expected to occur. This calculation incorporates:
Historical EWMA interval.
Current squeeze intensity.
Gap momentum.
A dynamic penalty based on divergence from baseline conditions.
The "Pseudo Crossover" Explained:
A key adaptive feature is the pseudo crossover mechanism. If price action significantly deviates from the projected crossover (for example, if price stays beyond the projected line longer than expected), the indicator acknowledges the projection was incorrect and triggers a "pseudo crossover" event. Essentially, this acts as a reset, updating historical intervals with a weighted adjustment to recalibrate future predictions. In other words, if the indicator’s initial forecast proves inaccurate, it recognizes this quickly, resets itself, and tries again—ensuring it remains responsive and adaptive to actual market conditions.
🧠 Behavioral Theory: Normative Social Influence
This indicator is rooted in behavioral finance theory, specifically leveraging normative social influence (conformity). Traders commonly watch EMA signals (especially the 50 and 200 EMA crossovers). When traders collectively anticipate these signals, they begin trading ahead of actual crossovers, effectively creating self-fulfilling prophecies—similar to Solomon Asch’s famous conformity experiments, where individuals adopted group behaviors even against direct evidence.
This behavior means genuine regime shifts (actual EMA crossovers) rarely occur until EMAs visibly reconverge due to widespread anticipatory trading activity. The indicator quantifies these dynamics by objectively measuring EMA convergence and updating projections accordingly.
📊 How to Use This Indicator
Monitor the background color and opacity as primary visual cues.
A strongly colored background (solid red/green) is an early alert that a squeeze is intensifying—prepare for potential volatility or a regime shift.
Projected crossover lines give a dynamic target bar to watch for trend reversals or confirmations.
After each regime shift, expect a reset of the projection line. The line may seem initially repelled from price action, but it will recalibrate as EMAs converge again.
Trust the pseudo crossover mechanism to automatically recalibrate the indicator if its original projection misses.
🎯 Why Choose This Indicator?
Early Warning: Visual squeeze intensity helps anticipate market breakouts.
Behaviorally Grounded: Leverages real trader psychology (conformity and anticipation).
Objective & Adaptive: Uses real-time, data-driven updates rather than static levels or subjective analysis.
Easy to Interpret: Clear visual signals (arrows, labels, colors) simplify trading decisions.
Self-correcting (Pseudo Crossovers): Quickly adjusts when initial predictions miss, maintaining accuracy over time.
Summary:
The EMA-Based Squeeze Dynamics Indicator combines behavioral insights, dynamic Bayesian-like updates, intuitive visual cues, and a self-correcting pseudo crossover feature to offer traders a reliable early warning system for market squeezes and impending regime shifts. It transparently recalibrates after each regime shift and automatically resets whenever projections prove inaccurate—ensuring you always have an adaptive, realistic forecast.
Whether you're a discretionary trader or algorithmic strategist, this indicator provides a powerful tool to navigate market volatility effectively.
Happy Trading! 📈✨

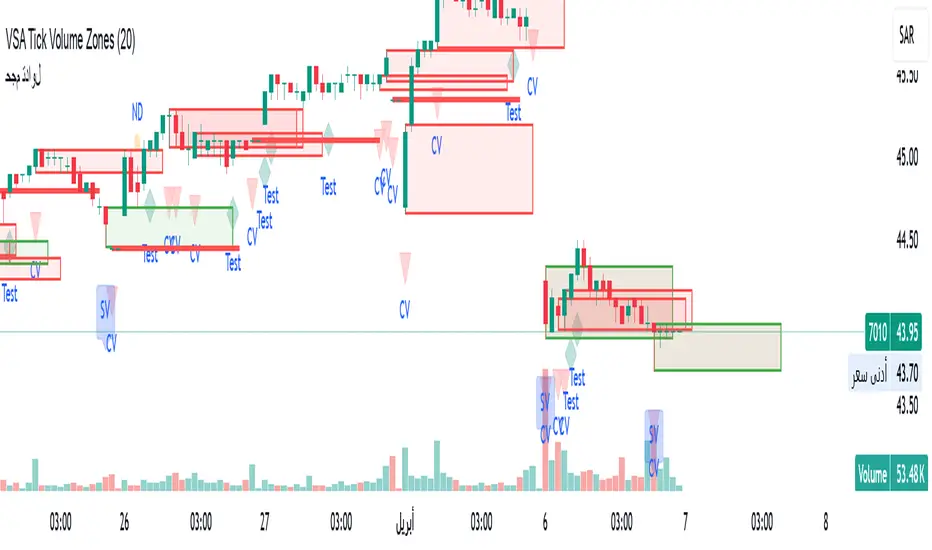
VSA Tick Volume Zones0
مؤشر VSA Tick Volume مع مناطق العرض والطلب (إصدار تجريبي)
مؤشر مخصص لمنصة TradingView يعتمد على تحليل الحجم والسعر (VSA - Volume Spread Analysis)، ويقوم تلقائيًا بتحديد مناطق الطلب والعرض استنادًا إلى إشارات VSA القوية. يهدف المؤشر إلى كشف تحركات المتداولين المحترفين وتحديد نقاط الانعكاس الذكية.
---
✅ الميزات الأساسية:
1. إشارات VSA:
المؤشر يتعرف تلقائيًا على أبرز إشارات تحليل VSA:
- *Climactic Volume (CV):* حجم تداول مرتفع بشكل استثنائي يشير لنهاية الاتجاه الحالي.
- *No Demand (ND):* شموع صعودية ضعيفة الحجم، تشير إلى غياب اهتمام المشترين.
- *No Supply (NS):* شموع هبوطية ضعيفة الحجم، تشير إلى غياب اهتمام البائعين.
- *Stopping Volume (SV):* ارتفاع مفاجئ في الحجم بعد اتجاه هابط، يشير لتدخل المشترين.
- *UpThrust (UT):* اختراق كاذب للسعر نحو الأعلى مع حجم كبير وإغلاق منخفض.
- *Test (T):* شموع اختبارية بحجم منخفض للتحقق من غياب البائعين استعدادًا للصعود.
2. تلوين الشموع:
- كل إشارة تُلوَّن تلقائيًا على الشارت لتسهيل المتابعة البصرية:
- CV باللون الأحمر
- ND باللون البرتقالي
- NS باللون الأخضر
- SV باللون الأزرق
- UT باللون الأرجواني
- Test باللون السماوي
3. رسم مناطق العرض والطلب تلقائيًا:
- يتم تحديد المناطق بناءً على إشارات *UT* و*SV* و*Test*، حيث تعتبر مناطق تمركز ذكي للمؤسسات (Smart Money Zones).
🎯 الهدف من المؤشر:
يساعد هذا المؤشر:
- المتداول اليومي على اتخاذ قرارات مدروسة.
- المحلل الفني على فهم السياق المؤسساتي للسوق.
- دعم استراتيجيات الدخول والخروج بدقة أعلى من خلال الدمج بين إشارات VSA والمناطق الفعلية للعرض والطلب.
---
🧪 ملاحظات:
- المؤشر لا يعتبر توصية شراء أو بيع.
- الإشارات تحتاج إلى تأكيد من خلال حركة السعر أو مؤشرات مساعدة.
- يمكن استخدامه مع أدوات إضافية مثل RSI أو Moving Averages.
---
⚙ الاقتراحات المستقبلية:
- دمج أدوات تدفق السيولة (مثل OBV أو VWAP).
- تنبيه صوتي وإشعار عند ظهور إشارات محددة.
- تخصيص أكبر للمستخدم من حيث الألوان ونوع الإشارات.
---
للتواصل أو المساهمة في تطوير المؤشر، يرجى مراسلتي.
VSA Tick Volume Indicator with Supply and Demand Zones (Beta Version)
A custom indicator for the TradingView platform based on Volume and Price Analysis (VSA - Volume Spread Analysis), it automatically identifies supply and demand zones based on strong VSA signals. The indicator aims to uncover the movements of professional traders and identify smart reversal points.
✅ Key Features:
VSA Signals: The indicator automatically detects key VSA analysis signals:
Climactic Volume (CV): Exceptionally high trading volume indicating the end of the current trend.
No Demand (ND): Bullish candles with weak volume, indicating a lack of buyer interest.
No Supply (NS): Bearish candles with weak volume, indicating a lack of seller interest.
Stopping Volume (SV): A sudden volume spike after a downtrend, indicating buyer intervention.
UpThrust (UT): A false price breakout upwards with high volume and a low close.
Test (T): Low-volume test candles to check for the absence of sellers, signaling readiness for an upward move.
Candle Coloring:
Each signal is automatically color-coded on the chart for easy visual tracking:
CV in red
ND in orange
NS in green
SV in blue
UT in purple
Test in cyan
Automatic Supply and Demand Zone Drawing:
Zones are determined based on the UT, SV, and Test signals, which are considered smart money zones.
🎯 Purpose of the Indicator:
This indicator helps:
The day trader make informed decisions.
The technical analyst understand the market's institutional context.
Enhance entry and exit strategies with more accuracy by combining VSA signals and actual supply and demand zones.
🧪 Notes:
The indicator is not a buy or sell recommendation.
Signals need confirmation through price action or additional indicators.
Can be used alongside other tools such as RSI or Moving Averages.
⚙ Future Suggestions:
Integration of liquidity flow tools (such as OBV or VWAP).
Sound alerts and notifications when specific signals appear.
Greater customization options for users regarding colors and signal types.
For inquiries or contributions to the indicator's development, please contact me.
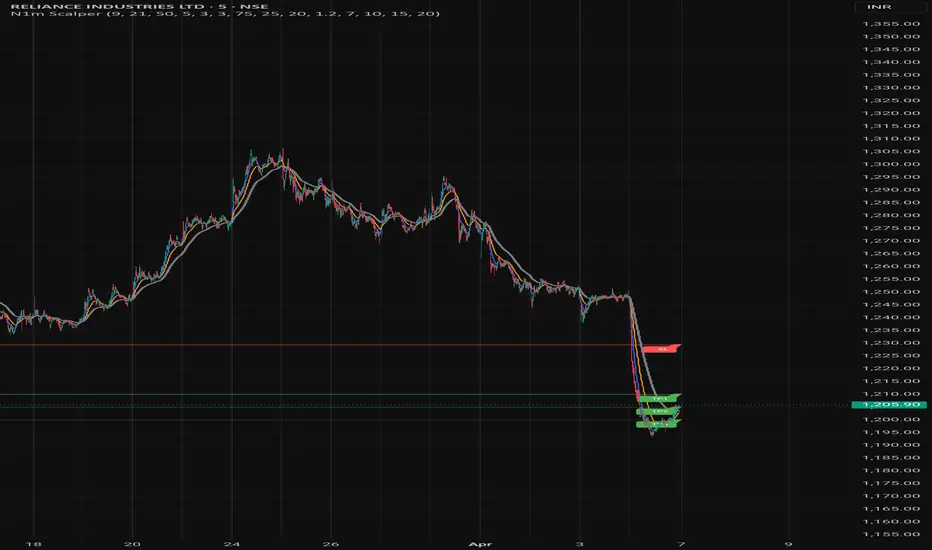
Nifty 1m EMA Pullback Scalper Signals
### **Master the Market with the Sniper Scalping Strategy for Nifty (1-Minute Timeframe)**
Unlock the power of precision trading with this expertly crafted **Sniper Scalping Strategy**, designed specifically for the Nifty index on a lightning-fast 1-minute timeframe. Perfect for traders who thrive on quick decisions and small, consistent profits, this strategy combines multiple indicators to deliver razor-sharp entries and exits—ideal for India’s dynamic market.
#### **Why This Strategy Stands Out**
- **Pinpoint Accuracy**: Harness the synergy of the **5 EMA and 10 EMA crossover** to lock onto the short-term trend, while the **Stochastic Oscillator (14,3,3)** times your entries and exits with surgical precision.
- **Fast and Effective**: Tailored for the 1-minute chart, this strategy capitalizes on Nifty’s volatility, targeting **10-point profits** with a tight **5-point stop-loss**—keeping your risk low and rewards high.
- **Trend + Momentum**: Blend trend-following (EMAs) with momentum signals (Stochastic) for a robust, multi-dimensional approach that cuts through market noise.
#### **How It Works**
- **Buy Signal**: Enter long when the 5 EMA crosses above the 10 EMA and the Stochastic rises above 20—catching the uptrend at its sweet spot.
- **Sell Signal**: Go short when the 5 EMA dips below the 10 EMA and the Stochastic falls below 80—riding the downtrend with confidence.
- **Exit Like a Pro**: Take profits at 10 points or when the Stochastic hits overbought/oversold extremes, ensuring you’re in and out before the market shifts.
#### **Perfect for Nifty Scalpers**
Built for the fast-paced world of Nifty trading, this strategy shines during high-volatility sessions like the market open or global overlaps. Whether you’re a beginner honing your skills or a seasoned trader seeking consistency, the Sniper Scalping Strategy offers a clear, actionable framework to scalp profits with discipline and precision.
#### **Get Started**
Test it in a demo account, refine it to your style, and watch your scalping game soar. Trade smart, stay focused, and let the Sniper Scalping Strategy turn Nifty’s 1-minute moves into your edge!
Buffett Indicator with Historical Bubbles (Clean)The Buffett Indicator is a trusted macroeconomic gauge that compares the total US stock market capitalization to the nation’s GDP. Popularized by Warren Buffett, this metric highlights periods of overvaluation and undervaluation in the market.
This tool offers a clean and accurate visualization of the Buffett Indicator, enhanced with historical bubble annotations for key market events:
Dot-com Bubble (2000)
Global Financial Crisis Peak (2007)
COVID-19 Pre-crash Peak (2020)
Post-COVID Bull Market Peak (2021)
Features:
Dynamic Buffett Ratio (%) calculation using Wilshire 5000 Index as the market cap proxy.
Customizable GDP input for accuracy (update quarterly).
Visual thresholds for fair value, undervaluation, and overvaluation zones.
Historical event markers for educational and analytical context.
Optimized to display clearly across all timeframes: Daily, Weekly, Monthly.
How to Use:
Manually update the GDP input as new data is released.
Use this indicator for macro-level market sentiment analysis and valuation tracking.
Combine with other tools and risk management strategies for comprehensive market insights.
Disclaimer:
This indicator is for educational purposes only. It does not constitute financial advice. Always perform your own research and analysis.
Version: 1.0
we ask Allah reconcile and repay
#BuffettIndicator #MarketValuation #MacroAnalysis #BubbleDetector #LongTermInvestor #USMarket #Wilshire5000 #TradingViewScript

Smart Grid Scalping (Pullback) Strategy[BullByte]The Smart Grid Scalping (Pullback) Strategy is a high-frequency trading strategy designed for short-term traders who seek to capitalize on market pullbacks. This strategy utilizes a dynamic ATR-based grid system to define optimal entry points, ensuring precise trade execution. It integrates volatility filtering and an RSI-based confirmation mechanism to enhance signal accuracy and reduce false entries.
This strategy is specifically optimized for scalping by dynamically adjusting trade levels based on current market conditions. The grid-based system helps capture retracement opportunities while maintaining strict trade management through predefined profit targets and trailing stop-loss mechanisms.
Key Features :
1. ATR-Based Grid System :
- Uses a 10-period ATR to dynamically calculate grid levels for entry points.
- Prevents chasing trades by ensuring price has reached key levels before executing entries.
2. No Trade Zone Protection :
- Avoids low-volatility zones where price action is indecisive.
- Ensures only high-momentum trades are executed to improve success rate.
3. RSI-Based Entry Confirmation :
- Long trades are triggered when RSI is below 30 (oversold) and price is in the lower grid zone.
- Short trades are triggered when RSI is above 70 (overbought) and price is in the upper grid zone.
4. Automated Trade Execution :
- Long Entry: Triggered when price drops below the first grid level with sufficient volatility.
- Short Entry: Triggered when price exceeds the highest grid level with sufficient volatility.
5. Take Profit & Trailing Stop :
- Profit target set at a customizable percentage (default 0.2%).
- Adaptive trailing stop mechanism using ATR to lock in profits while minimizing premature exits.
6. Visual Trade Annotations :
- Clearly labeled "LONG" and "SHORT" markers appear at trade entries for better visualization.
- Grid levels are plotted dynamically to aid decision-making.
Strategy Logic :
- The script first calculates the ATR-based grid levels and ensures price action has sufficient volatility before allowing trades.
- An additional RSI filter is used to ensure trades are taken at ideal market conditions.
- Once a trade is executed, the script implements a trailing stop and predefined take profit to maximize gains while reducing risks.
---
Disclaimer :
Risk Warning :
This strategy is provided for educational and informational purposes only. Trading involves significant risk, and past performance is not indicative of future results. Users are advised to conduct their own due diligence and risk management before using this strategy in live trading.
The developer and publisher of this script are not responsible for any financial losses incurred by the use of this strategy. Market conditions, slippage, and execution quality can affect real-world trading outcomes.
Use this script at your own discretion and always trade responsibly.

Multiple MAsHere's a well-written description in English for your "Multiple MAs" indicator that you can use when publishing on TradingView. It’s concise, professional, and highlights the key features of the indicator while explaining its purpose for traders.
---
### Multiple MAs Indicator
#### Overview
The **Multiple MAs** indicator is a versatile and straightforward tool designed to help traders visualize price trends using multiple Simple Moving Averages (SMAs) on a single chart. By plotting six SMAs with customizable lengths (MA5, MA10, MA20, MA50, MA100, and MA200), this indicator provides a clear view of short-term, medium-term, and long-term trends, making it ideal for trend-following strategies, crossover analysis, and identifying potential support/resistance levels.
#### Features
- **Customizable MA Lengths**: Adjust the periods of all six moving averages (MA5, MA10, MA20, MA50, MA100, MA200) to suit your trading style and timeframe.
- **Distinct Visuals**: Each MA is plotted with a unique color and line width for easy identification:
- MA5 (Dodger Blue, 1px)
- MA10 (Green, 1px)
- MA20 (Red, 2px)
- MA50 (Purple, 3px)
- MA100 (Gray, 3px)
- MA200 (White, 3px)
- **Overlay on Price Chart**: The indicator overlays directly on the price chart, allowing for seamless integration with other technical analysis tools.
- **High Precision**: Displays values with 8-decimal precision, ensuring accuracy for assets with small price movements (e.g., forex pairs or cryptocurrencies).
#### How to Use
1. **Trend Identification**: Use the longer MAs (e.g., MA100, MA200) to determine the overall trend direction. If the price is above these MAs, the trend is likely bullish; if below, it’s likely bearish.
2. **Crossover Signals**: Look for crossovers between shorter MAs (e.g., MA5 crossing MA20) for potential entry or exit signals. For example:
- A bullish signal occurs when a shorter MA crosses above a longer MA.
- A bearish signal occurs when a shorter MA crosses below a longer MA.
3. **Support and Resistance**: MAs often act as dynamic support or resistance levels. Watch for price reactions around these lines, especially the MA50, MA100, and MA200.
4. **Divergence Analysis**: Compare the slope of different MAs to identify potential trend reversals or weakening momentum.
#### Settings
- **MA5 Length**: Default is 5 bars.
- **MA10 Length**: Default is 10 bars.
- **MA20 Length**: Default is 20 bars.
- **MA50 Length**: Default is 50 bars.
- **MA100 Length**: Default is 100 bars.
- **MA200 Length**: Default is 200 bars.
#### Best Practices
- **Timeframe**: This indicator works on any timeframe but is particularly effective on daily, 4-hour, and 1-hour charts for swing trading or trend-following strategies.
- **Combine with Other Tools**: Pair the Multiple MAs with other indicators like RSI, MACD, or volume analysis to confirm signals and avoid false breakouts.
- **Adjust for Volatility**: For highly volatile assets, consider increasing the MA lengths to reduce noise and focus on broader trends.
#### Notes
- The indicator is lightweight and optimized for performance, ensuring it runs smoothly even on lower timeframes.
- Colors and line widths are pre-set for clarity but can be customized in the indicator settings if needed.
#### Credits
Created by kosar_v. Feedback and suggestions are welcome to improve this tool for the TradingView community!

Math by Thomas FVG📌 Math by Thomas FVG – Fair Value Gap Detector
Overview:
The Math by Thomas FVG indicator automatically detects Fair Value Gaps (FVGs) using a three-candle logic. FVGs represent price inefficiencies where the first candle’s high/low does not overlap with the third candle’s low/high, creating a gap. This tool helps traders identify potential reversal or continuation zones, providing valuable insights into market structure and price action.
🔹 How It Works:
Bullish FVG:
Occurs when the current candle’s low is above the high of the candle two bars ago.
A green-shaded box marks the bullish FVG, highlighting a potential support zone.
Bearish FVG:
Occurs when the current candle’s high is below the low of the candle two bars ago.
A red-shaded box marks the bearish FVG, indicating a potential resistance zone.
Gap Filling Logic:
The indicator automatically removes FVGs once they are filled by price action, keeping the chart clean and relevant.
Bullish FVGs are removed when close ≤ the box's top.
Bearish FVGs are removed when close ≥ the box's bottom.
⚙️ Customization Options:
Bullish FVG Color: Choose the color for bullish FVGs.
Bearish FVG Color: Choose the color for bearish FVGs.
Max Box Count: The indicator dynamically manages up to 50 FVG boxes, ensuring optimal chart performance.
✅ Use Cases:
Identify price inefficiencies for potential entries and exits.
Combine with Order Blocks, support/resistance, or volume analysis for confirmation.
Useful for Smart Money Concept (SMC) and price action traders.
🔥 Enhance your trading accuracy with the Math by Thomas FVG indicator and gain insights into price inefficiencies! 🚀

Range Filter Buy and Sell 5min## **Enhanced Range Filter Strategy: A Comprehensive Overview**
### **1. Introduction**
The **Enhanced Range Filter Strategy** is a powerful technical trading system designed to identify high-probability trading opportunities while filtering out market noise. It utilizes **range-based trend filtering**, **momentum confirmation**, and **volatility-based risk management** to generate precise entry and exit signals. This strategy is particularly useful for traders who aim to capitalize on trend-following setups while avoiding choppy, ranging market conditions.
---
### **2. Key Components of the Strategy**
#### **A. Range Filter (Trend Determination)**
- The **Range Filter** smooths price fluctuations and helps identify clear trends.
- It calculates an **adjusted price range** based on a **sampling period** and a **multiplier**, ensuring a dynamic trend-following approach.
- **Uptrends:** When the current price is above the range filter and the trend is strengthening.
- **Downtrends:** When the price falls below the range filter and momentum confirms the move.
#### **B. RSI (Relative Strength Index) as Momentum Confirmation**
- RSI is used to **filter out weak trades** and prevent entries during overbought/oversold conditions.
- **Buy Signals:** RSI is above a certain threshold (e.g., 50) in an uptrend.
- **Sell Signals:** RSI is below a certain threshold (e.g., 50) in a downtrend.
#### **C. ADX (Average Directional Index) for Trend Strength Confirmation**
- ADX ensures that trades are only taken when the trend has **sufficient strength**.
- Avoids trading in low-volatility, ranging markets.
- **Threshold (e.g., 25):** Only trade when ADX is above this value, indicating a strong trend.
#### **D. ATR (Average True Range) for Risk Management**
- **Stop Loss (SL):** Placed **one ATR below** (for long trades) or **one ATR above** (for short trades).
- **Take Profit (TP):** Set at a **3:1 reward-to-risk ratio**, using ATR to determine realistic price targets.
- Ensures volatility-adjusted risk management.
---
### **3. Entry and Exit Conditions**
#### **📈 Buy (Long) Entry Conditions:**
1. **Price is above the Range Filter** → Indicates an uptrend.
2. **Upward trend strength is positive** (confirmed via trend counter).
3. **RSI is above the buy threshold** (e.g., 50, to confirm momentum).
4. **ADX confirms trend strength** (e.g., above 25).
5. **Volatility is supportive** (using ATR analysis).
#### **📉 Sell (Short) Entry Conditions:**
1. **Price is below the Range Filter** → Indicates a downtrend.
2. **Downward trend strength is positive** (confirmed via trend counter).
3. **RSI is below the sell threshold** (e.g., 50, to confirm momentum).
4. **ADX confirms trend strength** (e.g., above 25).
5. **Volatility is supportive** (using ATR analysis).
#### **🚪 Exit Conditions:**
- **Stop Loss (SL):**
- **Long Trades:** 1 ATR below entry price.
- **Short Trades:** 1 ATR above entry price.
- **Take Profit (TP):**
- Set at **3x the risk distance** to achieve a favorable risk-reward ratio.
- **Ranging Market Exit:**
- If ADX falls below the threshold, indicating a weakening trend.
---
### **4. Visualization & Alerts**
- **Colored range filter line** changes based on trend direction.
- **Buy and Sell signals** appear as labels on the chart.
- **Stop Loss and Take Profit levels** are plotted as dashed lines.
- **Gray background highlights ranging markets** where trading is avoided.
- **Alerts trigger on Buy, Sell, and Ranging Market conditions** for automation.
---
### **5. Advantages of the Enhanced Range Filter Strategy**
✅ **Trend-Following with Noise Reduction** → Helps avoid false signals by filtering out weak trends.
✅ **Momentum Confirmation with RSI & ADX** → Ensures that only strong, valid trades are executed.
✅ **Volatility-Based Risk Management** → ATR ensures adaptive stop loss and take profit placements.
✅ **Works on Multiple Timeframes** → Effective for day trading, swing trading, and scalping.
✅ **Visually Intuitive** → Clearly displays trade signals, SL/TP levels, and trend conditions.
---
### **6. Who Should Use This Strategy?**
✔ **Trend Traders** who want to enter trades with momentum confirmation.
✔ **Swing Traders** looking for medium-term opportunities with a solid risk-reward ratio.
✔ **Scalpers** who need precise entries and exits to minimize false signals.
✔ **Algorithmic Traders** using alerts for automated execution.
---
### **7. Conclusion**
The **Enhanced Range Filter Strategy** is a powerful trading tool that combines **trend-following techniques, momentum indicators, and risk management** into a structured, rule-based system. By leveraging **Range Filters, RSI, ADX, and ATR**, traders can improve trade accuracy, manage risk effectively, and filter out unfavorable market conditions.
This strategy is **ideal for traders looking for a systematic, disciplined approach** to capturing trends while **avoiding market noise and false breakouts**. 🚀
