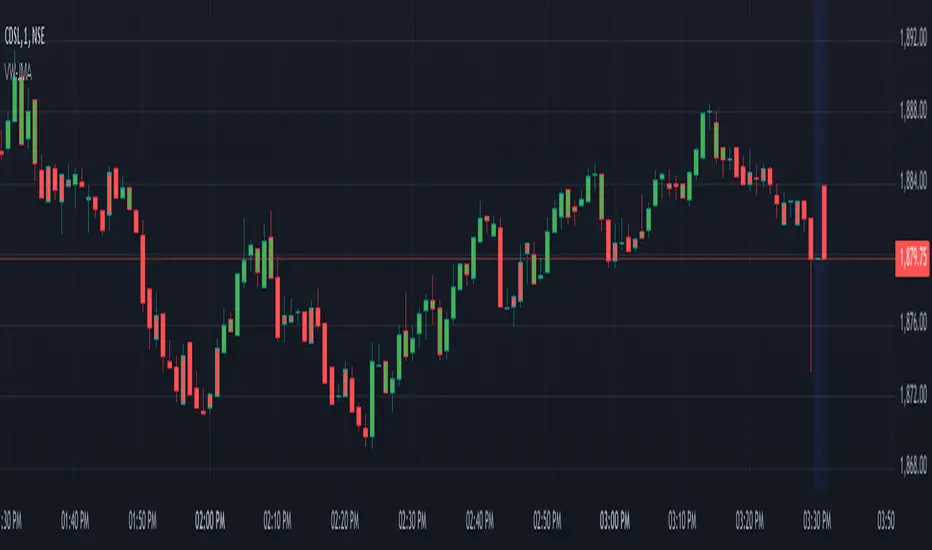
Volume Weighted Jurik Moving AverageThe Jurik Moving Average (JMA) is a smoothing indicator that is designed to improve upon traditional moving averages by reducing lag while enhancing responsiveness to price movements. It was created by Jurik Research and is often used to track trends with greater accuracy and minimal delay. The JMA is based on a combination of **exponential smoothing** and **phase adjustments**, making it more adaptable to varying market conditions compared to standard moving averages like SMA (Simple Moving Average) or EMA (Exponential Moving Average).
The core advantage of the JMA lies in its ability to adjust to price changes without excessively lagging, which is a common issue with traditional moving averages. It incorporates a **phase parameter** that can be adjusted to smooth out the signal further or make it more responsive to recent price action. This phase adjustment allows traders to fine-tune the JMA's sensitivity to the market, optimizing it for different timeframes and trading strategies.
How JMA Works and Benefits of Adding Volume Weight
The JMA works by applying a **smoothing process** to price data while allowing for adjustments through its phase and power parameters. These parameters help control the degree of smoothness and responsiveness. The result is a curve that follows price trends closely but with less lag than traditional moving averages.
Adding **volume weighting** to the JMA enhances its ability to reflect market activity more accurately. Just like the **Volume-Weighted Moving Average (VWMA)**, volume-weighting adjusts the moving average based on the strength of trading volume, meaning that price movements with higher volume will have a greater influence on the JMA. This can help traders identify trends that are supported by significant market participation, making the moving average more reliable.
The benefit of a volume-weighted JMA is that it responds more effectively to price movements that occur during periods of high trading volume, which are often considered more significant. This can help traders avoid false signals that may occur during low-volume periods when price changes may not reflect true market sentiment. By incorporating volume into the calculation, the JMA becomes more aligned with real market conditions, enhancing its effectiveness for trend identification and decision-making.
Cerca negli script per "accuracy"
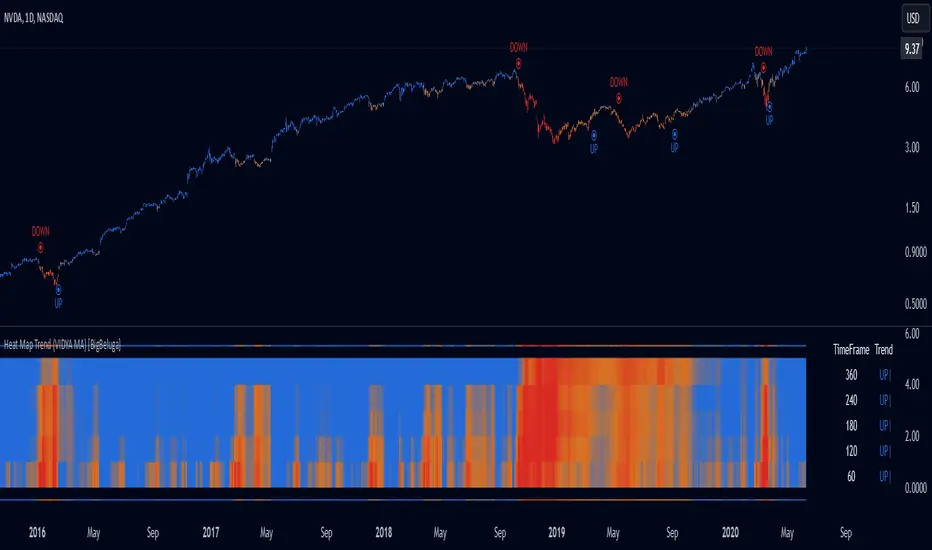
Heat Map Trend (VIDYA MA) [BigBeluga]The Heat Map Trend (VIDYA MA) - BigBeluga indicator is a multi-timeframe trend detection tool based on the Volumetric Variable Index Dynamic Average (VIDYA). This indicator calculates trends using volume momentum, or volatility if volume data is unavailable, and displays the trends across five customizable timeframes. It features a heat map to visualize trends, color-coded candles based on an average of the five timeframes, and a dashboard that shows the current trend direction for each timeframe. This tool helps traders identify trends while minimizing market noise and is particularly useful in detecting faster market changes in shorter timeframes.
🔵 KEY FEATURES & USAGE
◉ Volumetric Variable Index Dynamic Average (VIDYA):
The core of the indicator is the VIDYA moving average, which adjusts dynamically based on volume momentum. If volume data isn't available, the indicator uses volatility instead to smooth the moving average. This allows traders to assess the trend direction with more accuracy, using either volume or volatility, if volume data is not provided, as the basis for the trend calculation.
// VIDYA CALCULATION -----------------------------------------------------------------------------------------
// ATR (Average True Range) and volume calculation
bool volume_check = ta.cum(volume) <= 0
float atrVal = ta.atr(1)
float volVal = volume_check ? atrVal : volume // Use ATR if volume is not available
// @function: Calculate the VIDYA (Volumetric Variable Index Dynamic Average)
vidya(src, len, cmoLen) =>
float cmoVal = ta.sma(ta.cmo(volVal, cmoLen), 10) // Calculate the CMO and smooth it with an SMA
float absCmo = math.abs(cmoVal) // Absolute value of CMO
float alpha = 2 / (len + 1) // Alpha factor for smoothing
var float vidyaVal = 0.0 // Initialize VIDYA
vidyaVal := alpha * absCmo / 100 * src + (1 - alpha * absCmo / 100) * nz(vidyaVal ) // VIDYA formula
◉ Multi-Timeframe Trend Analysis with Heat Map Visualization:
The indicator calculates VIDYA across five customizable timeframes, allowing traders to analyze trends from multiple perspectives. The resulting trends are displayed as a heat map below the chart, where each timeframe is represented by a gradient color. The color intensity reflects the distance of the moving average (VIDYA) from the price, helping traders to identify trends on different timeframes visually. Shorter timeframes in the heat map are particularly useful for detecting faster market changes, while longer timeframes help to smooth out market noise and highlight the general trend.
Trend Direction:
Heat Map Reading:
◉ Dashboard for Multi-Timeframe Trend Directions:
The built-in dashboard displays the trend direction for each of the five timeframes, showing whether the trend is up or down. This quick overview provides traders with valuable insights into the current market conditions across multiple timeframes, helping them to assess whether the market is aligned or if there are conflicting trends. This allows for more informed decisions, especially during volatile periods.
◉ Color-Coded Candles Based on Multi-Timeframe Averages:
Candles are dynamically colored based on the average of the VIDYA across all five timeframes. When the price is in an uptrend, the candles are colored blue, while in a downtrend, they are colored red. If the VIDYA averages suggest a possible trend shift, the candles are displayed in orange to highlight a potential change in momentum. This color coding simplifies the process of identifying the dominant trend and spotting potential reversals.
BTC:
SP500:
◉ UP and DOWN Signals for Trend Direction Changes:
The indicator provides clear UP and DOWN signals to mark trend direction changes. When the average VIDYA crosses above a certain threshold, an UP signal is plotted, indicating a shift to an uptrend. Conversely, when it crosses below, a DOWN signal is shown, highlighting a transition to a downtrend. These signals help traders to quickly identify shifts in market direction and respond accordingly.
🔵 CUSTOMIZATION
VIDYA Length and Momentum Settings:
Adjust the length of the VIDYA moving average and the period for calculating volume momentum. These settings allow you to fine-tune how sensitive the indicator is to market changes, helping to match it with your preferred trading style.
Timeframe Selection:
Select five different timeframes to analyze trends simultaneously. This gives you the flexibility to focus on short-term trends, long-term trends, or a combination of both depending on your trading strategy.
Candle and Heat Map Color Customization:
Change the colors of the candles and heat map to fit your personal preferences. This customization allows you to align the visuals of the indicator with your overall chart setup, making it easier to analyze market conditions.
🔵 CONCLUSION
The Heat Trend (VIDYA MA) - BigBeluga indicator provides a comprehensive, multi-timeframe view of market trends, using VIDYA moving averages that adapt to volume momentum or volatility. Its heat map visualization, combined with a dashboard of trend directions and color-coded candles, makes it an invaluable tool for traders looking to understand both short-term market fluctuations and longer-term trends. By showing the overall market direction across multiple timeframes, it helps traders avoid market noise and focus on the bigger picture while being alert to faster shifts in shorter timeframes.
MultiLayer Awesome Oscillator Saucer Strategy [Skyrexio]Overview
MultiLayer Awesome Oscillator Saucer Strategy leverages the combination of Awesome Oscillator (AO), Williams Alligator, Williams Fractals and Exponential Moving Average (EMA) to obtain the high probability long setups. Moreover, strategy uses multi trades system, adding funds to long position if it considered that current trend has likely became stronger. Awesome Oscillator is used for creating signals, while Alligator and Fractal are used in conjunction as an approximation of short-term trend to filter them. At the same time EMA (default EMA's period = 100) is used as high probability long-term trend filter to open long trades only if it considers current price action as an uptrend. More information in "Methodology" and "Justification of Methodology" paragraphs. The strategy opens only long trades.
Unique Features
No fixed stop-loss and take profit: Instead of fixed stop-loss level strategy utilizes technical condition obtained by Fractals and Alligator to identify when current uptrend is likely to be over (more information in "Methodology" and "Justification of Methodology" paragraphs)
Configurable Trading Periods: Users can tailor the strategy to specific market windows, adapting to different market conditions.
Multilayer trades opening system: strategy uses only 10% of capital in every trade and open up to 5 trades at the same time if script consider current trend as strong one.
Short and long term trend trade filters: strategy uses EMA as high probability long-term trend filter and Alligator and Fractal combination as a short-term one.
Methodology
The strategy opens long trade when the following price met the conditions:
1. Price closed above EMA (by default, period = 100). Crossover is not obligatory.
2. Combination of Alligator and Williams Fractals shall consider current trend as an upward (all details in "Justification of Methodology" paragraph)
3. Awesome Oscillator shall create the "Saucer" long signal (all details in "Justification of Methodology" paragraph). Buy stop order is placed one tick above the candle's high of last created "Saucer signal".
4. If price reaches the order price, long position is opened with 10% of capital.
5. If currently we have opened position and price creates and hit the order price of another one "Saucer" signal another one long position will be added to the previous with another one 10% of capital. Strategy allows to open up to 5 long trades simultaneously.
6. If combination of Alligator and Williams Fractals shall consider current trend has been changed from up to downtrend, all long trades will be closed, no matter how many trades has been opened.
Script also has additional visuals. If second long trade has been opened simultaneously the Alligator's teeth line is plotted with the green color. Also for every trade in a row from 2 to 5 the label "Buy More" is also plotted just below the teeth line. With every next simultaneously opened trade the green color of the space between teeth and price became less transparent.
Strategy settings
In the inputs window user can setup strategy setting: EMA Length (by default = 100, period of EMA, used for long-term trend filtering EMA calculation). User can choose the optimal parameters during backtesting on certain price chart.
Justification of Methodology
Let's go through all concepts used in this strategy to understand how they works together. Let's start from the easies one, the EMA. Let's briefly explain what is EMA. The Exponential Moving Average (EMA) is a type of moving average that gives more weight to recent prices, making it more responsive to current price changes compared to the Simple Moving Average (SMA). It is commonly used in technical analysis to identify trends and generate buy or sell signals. It can be calculated with the following steps:
1.Calculate the Smoothing Multiplier:
Multiplier = 2 / (n + 1), Where n is the number of periods.
2. EMA Calculation
EMA = (Current Price) × Multiplier + (Previous EMA) × (1 − Multiplier)
In this strategy uses EMA an initial long term trend filter. It allows to open long trades only if price close above EMA (by default 50 period). It increases the probability of taking long trades only in the direction of the trend.
Let's go to the next, short-term trend filter which consists of Alligator and Fractals. Let's briefly explain what do these indicators means. The Williams Alligator, developed by Bill Williams, is a technical indicator designed to spot trends and potential market reversals. It uses three smoothed moving averages, referred to as the jaw, teeth, and lips:
Jaw (Blue Line): The slowest of the three, based on a 13-period smoothed moving average shifted 8 bars ahead.
Teeth (Red Line): The medium-speed line, derived from an 8-period smoothed moving average shifted 5 bars forward.
Lips (Green Line): The fastest line, calculated using a 5-period smoothed moving average shifted 3 bars forward.
When these lines diverge and are properly aligned, the "alligator" is considered "awake," signaling a strong trend. Conversely, when the lines overlap or intertwine, the "alligator" is "asleep," indicating a range-bound or sideways market. This indicator assists traders in identifying when to act on or avoid trades.
The Williams Fractals, another tool introduced by Bill Williams, are used to pinpoint potential reversal points on a price chart. A fractal forms when there are at least five consecutive bars, with the middle bar displaying the highest high (for an up fractal) or the lowest low (for a down fractal), relative to the two bars on either side.
Key Points:
Up Fractal: Occurs when the middle bar has a higher high than the two preceding and two following bars, suggesting a potential downward reversal.
Down Fractal: Happens when the middle bar shows a lower low than the surrounding two bars, hinting at a possible upward reversal.
Traders often combine fractals with other indicators to confirm trends or reversals, improving the accuracy of trading decisions.
How we use their combination in this strategy? Let’s consider an uptrend example. A breakout above an up fractal can be interpreted as a bullish signal, indicating a high likelihood that an uptrend is beginning. Here's the reasoning: an up fractal represents a potential shift in market behavior. When the fractal forms, it reflects a pullback caused by traders selling, creating a temporary high. However, if the price manages to return to that fractal’s high and break through it, it suggests the market has "changed its mind" and a bullish trend is likely emerging.
The moment of the breakout marks the potential transition to an uptrend. It’s crucial to note that this breakout must occur above the Alligator's teeth line. If it happens below, the breakout isn’t valid, and the downtrend may still persist. The same logic applies inversely for down fractals in a downtrend scenario.
So, if last up fractal breakout was higher, than Alligator's teeth and it happened after last down fractal breakdown below teeth, algorithm considered current trend as an uptrend. During this uptrend long trades can be opened if signal was flashed. If during the uptrend price breaks down the down fractal below teeth line, strategy considered that uptrend is finished with the high probability and strategy closes all current long trades. This combination is used as a short term trend filter increasing the probability of opening profitable long trades in addition to EMA filter, described above.
Now let's talk about Awesome Oscillator's "Sauser" signals. Briefly explain what is the Awesome Oscillator. The Awesome Oscillator (AO), created by Bill Williams, is a momentum-based indicator that evaluates market momentum by comparing recent price activity to a broader historical context. It assists traders in identifying potential trend reversals and gauging trend strength.
AO = SMA5(Median Price) − SMA34(Median Price)
where:
Median Price = (High + Low) / 2
SMA5 = 5-period Simple Moving Average of the Median Price
SMA 34 = 34-period Simple Moving Average of the Median Price
Now we know what is AO, but what is the "Saucer" signal? This concept was introduced by Bill Williams, let's briefly explain it and how it's used by this strategy. Initially, this type of signal is a combination of the following AO bars: we need 3 bars in a row, the first one shall be higher than the second, the third bar also shall be higher, than second. All three bars shall be above the zero line of AO. The price bar, which corresponds to third "saucer's" bar is our signal bar. Strategy places buy stop order one tick above the price bar which corresponds to signal bar.
After that we can have the following scenarios.
Price hit the order on the next candle in this case strategy opened long with this price.
Price doesn't hit the order price, the next candle set lower low. If current AO bar is increasing buy stop order changes by the script to the high of this new bar plus one tick. This procedure repeats until price finally hit buy order or current AO bar become decreasing. In the second case buy order cancelled and strategy wait for the next "Saucer" signal.
If long trades has been opened strategy use all the next signals until number of trades doesn't exceed 5. All trades are closed when the trend changes to downtrend according to combination of Alligator and Fractals described above.
Why we use "Saucer" signals? If AO above the zero line there is a high probability that price now is in uptrend if we take into account our two trend filters. When we see the decreasing bars on AO and it's above zero it's likely can be considered as a pullback on the uptrend. When we see the stop of AO decreasing and the first increasing bar has been printed there is a high probability that this local pull back is finished and strategy open long trade in the likely direction of a main trend.
Why strategy use only 10% per signal? Sometimes we can see the false signals which appears on sideways. Not risking that much script use only 10% per signal. If the first long trade has been open and price continue going up and our trend approximation by Alligator and Fractals is uptrend, strategy add another one 10% of capital to every next saucer signal while number of active trades no more than 5. This capital allocation allows to take part in long trades when current uptrend is likely to be strong and use only 10% of capital when there is a high probability of sideways.
Backtest Results
Operating window: Date range of backtests is 2023.01.01 - 2024.11.25. It is chosen to let the strategy to close all opened positions.
Commission and Slippage: Includes a standard Binance commission of 0.1% and accounts for possible slippage over 5 ticks.
Initial capital: 10000 USDT
Percent of capital used in every trade: 10%
Maximum Single Position Loss: -5.10%
Maximum Single Profit: +22.80%
Net Profit: +2838.58 USDT (+28.39%)
Total Trades: 107 (42.99% win rate)
Profit Factor: 3.364
Maximum Accumulated Loss: 373.43 USDT (-2.98%)
Average Profit per Trade: 26.53 USDT (+2.40%)
Average Trade Duration: 78 hours
These results are obtained with realistic parameters representing trading conditions observed at major exchanges such as Binance and with realistic trading portfolio usage parameters.
How to Use
Add the script to favorites for easy access.
Apply to the desired timeframe and chart (optimal performance observed on 3h BTC/USDT).
Configure settings using the dropdown choice list in the built-in menu.
Set up alerts to automate strategy positions through web hook with the text: {{strategy.order.alert_message}}
Disclaimer:
Educational and informational tool reflecting Skyrex commitment to informed trading. Past performance does not guarantee future results. Test strategies in a simulated environment before live implementation

Fractal Trail [UAlgo]The Fractal Trail is designed to identify and utilize Williams fractals as dynamic trailing stops. This tool serves traders by marking key fractal points on the chart and leveraging them to create adaptive stop-loss trails, enhancing risk management and trade decision-making.
Williams fractals are pivotal in identifying potential reversals and critical support/resistance levels. By plotting fractals dynamically and providing configurable options, this indicator allows for personalized adjustments based on the trader's strategy.
This script integrates both visual fractal markers and adjustable trailing stops, offering insights into market trends while catering to a wide variety of trading styles and timeframes.
🔶 Key Features
Williams Fractals Identification: The indicator marks Williams Fractals on the chart, which are significant highs and lows within a specified range. These fractals are crucial for identifying potential reversal points in the market.
Dynamic Trailing Stops: The indicator generates dynamic trailing stops based on the identified fractals. These stops adjust automatically as new fractals are formed, providing a responsive and adaptive approach to risk management.
Fractal Range: Users can specify the number of bars to the left and right for analyzing fractals, allowing for flexibility in identifying significant price points.
Trail Buffer Percentage: A percentage-based safety margin can be added between the fractal price and the trailing stop, providing additional control over risk management.
Trail Invalidation Source: Users can choose whether the trailing stop flips based on candle closing prices or the extreme points (high/low) of the candles.
Alerts and Notifications: The indicator provides alerts for when the price crosses the trailing stops, as well as when new Williams Fractals are confirmed. These alerts can be customized to fit the trader's notification preferences.
🔶 Interpreting the Indicator
Fractal Markers: The triangles above and below the bars indicate Williams Fractals. These markers help traders identify potential reversal points in the market.
Trailing Stops: The dynamic trailing stops are plotted as lines on the chart. These lines adjust based on the latest identified fractals, providing a visual representation of potential support and resistance levels.
Fill Colors: The optional fill colors between the trailing stops and the price action help traders quickly identify the current trend and potential pullback zones.
🔶 Disclaimer
Use with Caution: This indicator is provided for educational and informational purposes only and should not be considered as financial advice. Users should exercise caution and perform their own analysis before making trading decisions based on the indicator's signals.
Not Financial Advice: The information provided by this indicator does not constitute financial advice, and the creator (UAlgo) shall not be held responsible for any trading losses incurred as a result of using this indicator.
Backtesting Recommended: Traders are encouraged to backtest the indicator thoroughly on historical data before using it in live trading to assess its performance and suitability for their trading strategies.
Risk Management: Trading involves inherent risks, and users should implement proper risk management strategies, including but not limited to stop-loss orders and position sizing, to mitigate potential losses.
No Guarantees: The accuracy and reliability of the indicator's signals cannot be guaranteed, as they are based on historical price data and past performance may not be indicative of future results.

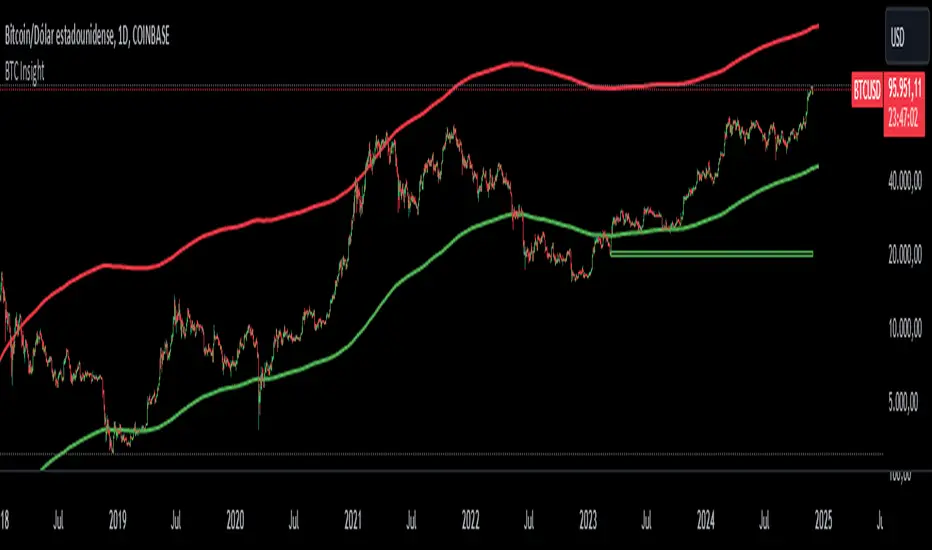
BTC InsightThis script is a comprehensive tool for analyzing Bitcoin's daily price range, trend predictions, and significant volume-based order block levels. It combines multiple technical analysis concepts, including exponential moving averages (EMAs), logarithmic calculations, and custom indicators for advanced forecasting and visualization.
Key Features and Technical Details
1. Exponential Moving Averages (EMAs)
The script calculates two smoothed EMAs:
EMA1 and EMA2 are derived from the logarithmic price of Bitcoin (log(close)).
The smoothing periods and multipliers are user-configurable through inputs:
Smoothed EMA1 Period (default: 728)
Smoothed EMA2 Period (default: 728)
Initial EMA Multipliers (default: 1.0 for EMA1, 5.0 for EMA2)
A time decay factor is applied to the multipliers to adjust sensitivity over time, making the EMAs adaptive to market dynamics.
2. Logarithmic Domain Calculations
The script uses logarithmic transformations to enhance accuracy when dealing with large price changes.
Adjustments to EMAs are made in the logarithmic domain and converted back to the price domain for plotting.
3. EMA Forecasting
The script performs a linear regression analysis over a specified period (728 bars by default) to estimate future price trends for both EMAs.
Slope Adjustments:
RSI (Relative Strength Index) is incorporated to modify the forecast slope dynamically:
RSI > 70: Bearish adjustment (-0.5)
RSI < 30: Bullish adjustment (+0.5)
Forecasts are plotted as dashed lines, projecting future values of EMA1 (green) and EMA2 (red).
4. Order Block Detection
Detects order block levels based on high volume spikes relative to the average volume over a lookback period (default: 100 bars).
A volume multiplier (default: 1.5x) is applied to identify significant volume activity.
Two types of order blocks are identified:
Below EMA1: A price zone where significant buying occurred below EMA1.
Above EMA2: A price zone where significant selling occurred above EMA2.
Order blocks are visualized as shaded rectangles:
Green boxes represent order blocks below EMA1.
Red boxes represent order blocks above EMA2.
5. Customization Inputs
The script allows fine-tuning via the following parameters:
EMA Settings: Periods, multipliers, and time factors for both EMAs.
Volume Analysis Settings: Lookback period and volume multiplier for order block detection.
Order Block Box Settings: Height of the range as a percentage of the detected price.
6. Visualization
EMAs: Two smoothed exponential moving averages are plotted with configurable offsets.
Forecast Lines: Dashed lines project future EMA trends based on regression analysis.
Order Block Boxes: Highlight areas of high volume below EMA1 and above EMA2, indicating potential support or resistance zones.
How It Works in Practice
EMAs and Trend Analysis:
The EMAs represent long-term market trends, adjusted dynamically using custom multipliers and time decay.
The script forecasts the EMAs' future trajectories to anticipate potential price movements.
Order Blocks:
High-volume zones indicate areas where significant market activity occurred, providing insights into potential price reversal points or continuation zones.
RSI Integration:
RSI-based slope adjustment fine-tunes the EMA forecast, adding an extra layer of dynamic market context.
Comprehensive View:
By combining trend forecasts with volume-based zones, the script delivers a robust analysis tool for identifying potential entry/exit points, support/resistance levels, and long-term trend predictions.
Support/Resistance Strength [UAlgo]The Support/Resistance Strength indicator is a tool designed for traders seeking a precise understanding of key support and resistance levels in the market. This tool dynamically identifies and visualizes support and resistance zones based on pivot points and strength criteria, providing traders with actionable insights for better decision-making.
By incorporating features such as ATR-based or percentage-based channel calculations, customizable strength thresholds, and intuitive visualization of key levels, the indicator caters to traders of various skill levels and strategies. It also adapts dynamically to market conditions, allowing users to identify frequently tested zones with minimal manual input.
🔶 Key Features
Dynamic Support and Resistance Zones
Automatically detects significant support and resistance levels using pivot high and low calculations.
Offers ATR-based or percentage-based channel customization to cater to diverse trading styles.
Customizable Parameters
Lookback period for pivot calculations, strength threshold, and maximum stored pivots are fully adjustable.
Display options for showing specific numbers of recent support/resistance lines.
Intuitive Visualization
Highlights key support and resistance levels with color-coded lines and labels.
Includes percentage deviation from the current price for quick assessment.
Interactive Updates
Continuously updates support and resistance levels to reflect changing market dynamics.
Displays pivot points visually for enhanced clarity.
Can be used effectively on various timeframes, from intraday to daily and weekly charts.
🔶 Interpreting the Indicator
Identifying Key Levels
Support levels are indicated by green (lime) lines and resistance levels by red lines. The transparency of colors is adjustable for visual preference.
Labels display the exact price level and the percentage difference from the current price.
Strength Threshold
The "Minimum S/R Strength" parameter defines how frequently a level must be tested to be considered significant.
Higher strength values indicate zones that have been tested more frequently, suggesting stronger support or resistance.
Pivot Points
The indicator marks pivot high and low points on the chart to provide a visual representation of the calculated levels.
Dynamic Updates
The indicator adapts to the most recent price action. If the price moves above a resistance level or below a support level, the color of the lines and labels will dynamically change to reflect the current price positioning.
🔶 Disclaimer
Use with Caution: This indicator is provided for educational and informational purposes only and should not be considered as financial advice. Users should exercise caution and perform their own analysis before making trading decisions based on the indicator's signals.
Not Financial Advice: The information provided by this indicator does not constitute financial advice, and the creator (UAlgo) shall not be held responsible for any trading losses incurred as a result of using this indicator.
Backtesting Recommended: Traders are encouraged to backtest the indicator thoroughly on historical data before using it in live trading to assess its performance and suitability for their trading strategies.
Risk Management: Trading involves inherent risks, and users should implement proper risk management strategies, including but not limited to stop-loss orders and position sizing, to mitigate potential losses.
No Guarantees: The accuracy and reliability of the indicator's signals cannot be guaranteed, as they are based on historical price data and past performance may not be indicative of future results.

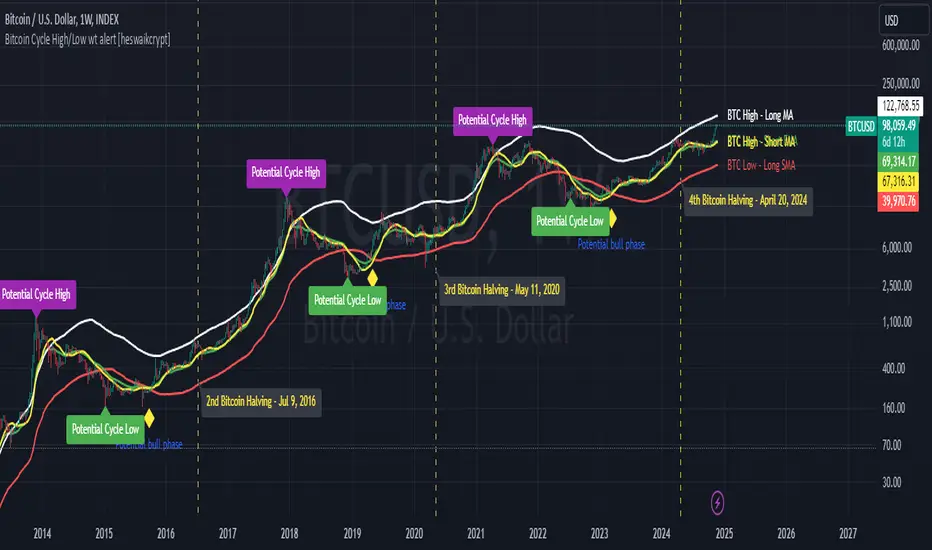
Bitcoin Cycle High/Low with functional Alert [heswaikcrypt]Introduction
Just as machines are fine-tuned for maximum efficiency, trading indicators must evolve to meet the demands of ever-changing markets.
Credit goes to the initial author, @NoCreditsLeft I only improved the existing Pi-cycle indicator with a functional alert and included a bull mode indicator in the script. The alert can help you get a live alert at candle close when the cycle tops, bottoms, and the potential bull phase switch occurs.
Philip Swift’s Pi Cycle Top Indicator is a brilliant example of leveraging mathematical relationships to signal critical turning points in Bitcoin’s price cycles. Historically, it has identified market and local tops with some relative accuracy, often within three days, as demonstrated in all the previous bull run cycles.
At its core, the Pi Cycle Indicator derives its name from the mathematical constant π (pi), achieved by using simple moving averages (MAs) in a specific ratio: 𝜋 = Long MA/short MA
The Bull mode switch is calculated using a crossover of the short exponentia moving average and the long moving average.
.
.
.
Knowing when Bitcoin reaches its top—and receiving timely alerts about it—is crucial for successful trading. The indicator is designed to signal;
Potential Bitcoin tops: Purple label
Potential Bitcoin bottoms : green Label, and
Parabolic swing : Yellow diamond shape (relating to the market switching to a potential bull mode)
"Please note: This indicator is tailored for Bitcoin using historical data analysis and should not be considered definitive. However accurate it might be."
Setting alerts
To set the alert conditions, select any alert function call to get alert whenever the conditions are met. The script is configured on dialy TF; you can set it on 1D or weekly TF.
Enjoy and Trade smartly
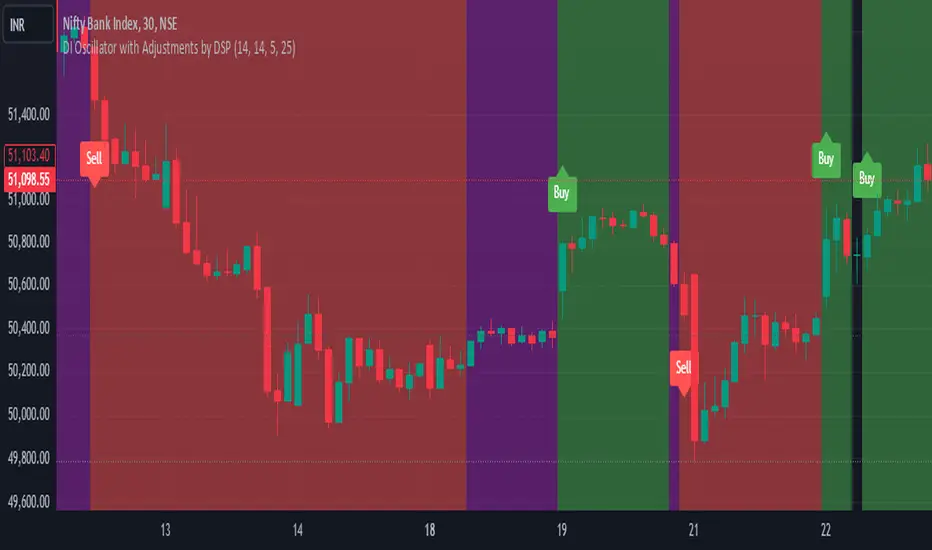
DI Oscillator with Adjustments by DSPDI Oscillator with Adjustments by DSP – High-Volatility Commodity Trading Tool 📈💥
Maximize Your Trading Efficiency in volatile commodity markets with the DI Oscillator with Adjustments by DSP. This unique indicator combines the classic +DI and -DI (Directional Indicators) with advanced adjustments that help you identify key trends and reversals in highly volatile conditions.
Whether you're trading commodities, forex, or stocks, this tool is engineered to help you navigate price fluctuations and make timely, informed decisions. Let this powerful tool guide you through turbulent market conditions with ease!
Key Features:
Dynamic Background Color Shifts 🌈:
Green Background: Signals a strong uptrend where +DI is clearly above -DI, and the trend is supported by clear separation between the two indicators.
Red Background: Signals a strong downtrend where -DI is above +DI, indicating bearish pressure.
Violet Background: Shows a neutral or consolidating market where the +DI and -DI lines are closely interwoven, giving you a clear picture of sideways movement.
Buy and Sell Labels 📊:
Buy Signal: Automatically triggers when the background changes to green, indicating a potential entry point during a bullish trend.
Sell Signal: Automatically triggers when the background shifts from purple to red, indicating a bearish trend reversal.
Labels are positioned away from the bars, ensuring your chart remains uncluttered and easy to read.
Enhanced Adjustments for Volatile Markets ⚡:
Custom adjustments based on consecutive green or red bars (excluding “sandwiched” bars) provide you with more nuanced signals, improving the accuracy of trend detection in volatile conditions.
Horizontal Line Reference 📏:
Set a custom horizontal level to mark significant price levels that may act as resistance or support, helping you identify key price points in volatile market swings.
Separation Threshold 🧮:
A custom separation threshold defines when the +DI and -DI lines are far enough apart to confirm a strong trend. This is crucial for commodity markets that experience rapid price changes and fluctuations.
Visual Clarity ✨:
Both +DI and -DI lines are plotted clearly in green and red, respectively, with a dedicated background color system that makes trend shifts visually intuitive.
Why This Indicator Works for Volatile Commodities 🌍📊:
Commodity markets are notorious for their volatility, with prices often experiencing rapid and unpredictable movements. This indicator gives you clear visual cues about trend strength and reversals, enabling you to act quickly and confidently.
By adjusting the +DI based on consecutive green and red bars, this tool adapts to the specific price action in high-volatility conditions, helping you stay ahead of the curve.
The background color system ensures that you can visually track market trends at a glance, making it easier to make split-second decisions without missing opportunities.
How to Use:
Add the Indicator: Simply add the DI Oscillator with Adjustments by DSP to your TradingView chart.
Watch for Background Color Shifts: Stay alert for the background color to shift from violet to green (for buy) or purple to red (for sell), signaling potential trade opportunities.
Set Alerts: Receive notifications when background color changes, providing you with real-time alerts to keep track of market movements.
Interpret the DI Lines: Use the +DI and -DI lines to gauge trend strength and adjust your strategy accordingly.
Who Can Benefit:
Day Traders: Take advantage of quick trend reversals and high volatility in commodities markets, such as gold, oil, or agricultural products.
Swing Traders: Identify key trend shifts over longer periods, making it easier to enter or exit trades during major price movements.
Risk Managers: Use this tool’s visual cues to better understand price fluctuations and adjust your position sizes according to market conditions.
💡 Unlock Your Potential with the DI Oscillator 💡
For traders in high-volatility commodity markets, this indicator is a game-changer. It simplifies the complexity of trend analysis and gives you the actionable insights you need to make fast, profitable decisions. Whether you're trading gold, oil, or other volatile commodities, the DI Oscillator with Adjustments by DSP can help you navigate market chaos and make better-informed trades.
Don’t miss out — enhance your trading strategy today with this powerful tool and stay ahead in any market environment!
Yakloft Support and Resistance LevelsYakloft Support and Resistance Levels Indicator
The Yakloft Support and Resistance Levels indicator is a powerful tool designed to help traders identify key support and resistance levels on a price chart. By leveraging advanced pivot point calculations and customizable settings, this indicator provides clear visual cues for potential price reversals and market trends.
Key Features
Automatic Support and Resistance Levels:
Dynamic Calculation: The indicator automatically identifies and plots significant support and resistance levels based on pivot highs and lows.
Customizable Strength: Adjust the S/R Strength parameter to filter levels according to their significance. Higher values display fewer but more robust levels.
Zones Around Levels:
Support and Resistance Zones: Create zones around each support and resistance level to highlight areas of interest rather than exact price points.
High/Low Zones: Plot zones around the highest and lowest price levels within a specified period, providing additional context for potential breakouts or reversals.
Zone Width Adjustment: Customize the width of the zones using the Zone Width % parameter, calculated as a percentage of the price range over the last 300 bars.
Line Styles and Fills:
Customizable Appearance: Modify line colors, styles (Solid, Dotted, Dashed), and widths to match your chart preferences.
Line Fills: Enhance visual clarity by filling zones with semi-transparent colors, making it easier to distinguish between support and resistance areas.
Dynamic Line Management:
Automatic Line Removal: To keep your chart uncluttered, the indicator removes a support or resistance line after the price crosses it twice. This feature helps you focus on the most relevant and current levels.
Expandable Lines:
Line Extension: Choose to extend lines both forward and backward in time with the Expand S/R Lines option, providing a comprehensive view of historical support and resistance.
How It Works
The indicator analyzes price data to identify pivot highs and lows over a specified lookback period. These pivot points are potential areas where the price may reverse or experience significant support or resistance. By filtering these points based on the S/R Strength parameter, the indicator ensures that only the most significant levels are displayed.
Once the levels are identified:
Support Levels: Plotted when the price shows potential to stop falling and possibly start rising.
Resistance Levels: Plotted when the price may stop rising and potentially start falling.
The indicator enhances these levels by:
Adding Zones: By creating a buffer around each level, traders can see areas where the price might interact with support or resistance, rather than focusing on a single price point.
Line Fills: The zones are filled with a semi-transparent color corresponding to support or resistance, improving visual distinction.
Input Parameters
Enable Support & Resistance: Toggle the entire indicator on or off.
Support Color: Choose the color for support lines and fills.
Resistance Color: Choose the color for resistance lines and fills.
S/R Strength: Set the sensitivity of level detection. Higher values result in fewer, more significant levels.
Line Style: Select the style of the support and resistance lines (Solid, Dotted, Dashed).
S/R Line Width: Adjust the thickness of the support and resistance lines.
Enable Zones: Toggle the display of zones around each level.
Enable High/Low Zones: Toggle the display of zones around the highest and lowest price levels.
Zone Width %: Define the width of the zones as a percentage of the price range over the last 300 bars.
Expand S/R Lines: Choose whether to extend the lines across the entire chart or limit them to recent data.
Using the Indicator
Identifying Key Levels:
Use the plotted support and resistance levels to identify potential entry and exit points.
Pay attention to the zones, as they represent areas where the price is more likely to react.
Monitoring Price Interaction:
Observe how the price behaves around the support and resistance levels.
The automatic removal of lines after two crossings helps focus on active levels.
Customizing for Clarity:
Adjust the visual settings to match your trading style and improve chart readability.
Experiment with the S/R Strength and Zone Width % to fine-tune the indicator to different market conditions.
Best Practices
Combine with Other Analysis Tools:
Use the indicator alongside other technical analysis tools like trend lines, moving averages, and oscillators for a more comprehensive market view.
Adjust for Different Timeframes:
The indicator works on various timeframes. Adjust the parameters when switching between short-term and long-term charts to maintain effectiveness.
Stay Updated with Market Conditions:
Market volatility can affect the significance of support and resistance levels. Regularly adjust the S/R Strength parameter to align with current market dynamics.
Limitations
Not a Standalone Solution:
While the indicator provides valuable insights, it should not be used in isolation. Always consider broader market analysis and risk management practices.
Historical Data Dependency:
The accuracy of the levels depends on the availability of sufficient historical data. Ensure your chart includes enough data for the indicator to perform effectively.

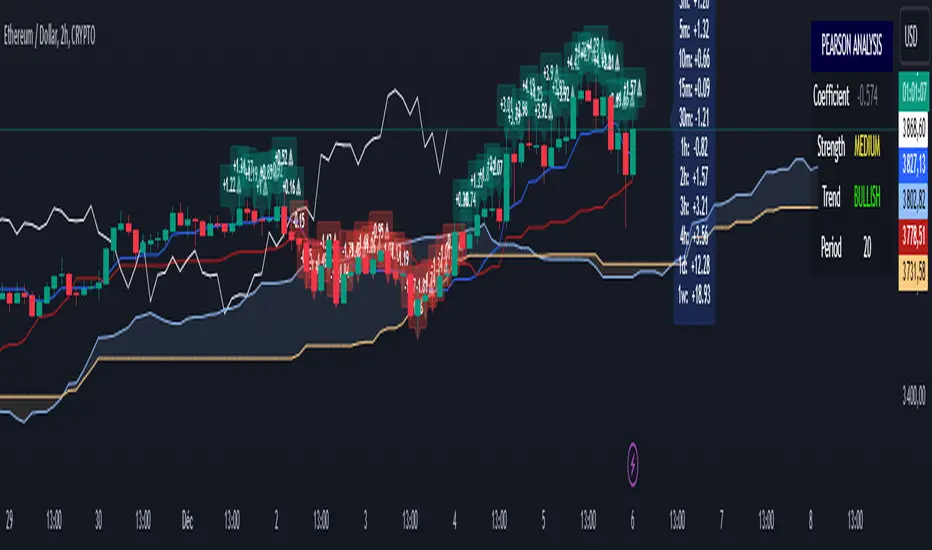
Ichimoku Cloud +Ichimoku Cloud Plus - Advanced Technical Analysis Indicator
Ichimoku Cloud Plus is an advanced technical analysis tool that combines the traditional Ichimoku Cloud system with Pearson correlation analysis and multi-timeframe momentum tracking. This innovative approach provides traders with a comprehensive view of market trends, momentum, and potential reversal points across multiple time frames.
Core Components
Enhanced Ichimoku Cloud Analysis
The traditional Ichimoku Cloud components have been preserved and enhanced with customizable visual parameters:
The indicator includes:
- Conversion Line (Tenkan-sen) - Short-term trend identifier
- Base Line (Kijun-sen) - Medium-term trend identifier
- Leading Span A and B (Senkou Span A and B) - Future cloud projections
- Lagging Span (Chikou Span) - Historical price momentum confirmation
The cloud (Kumo) formations provide dynamic support and resistance levels, with color-coding to instantly identify bullish and bearish market conditions.
Pearson Correlation Analysis
A sophisticated Pearson correlation coefficient calculation has been integrated to provide statistical validation of trend strength and direction. This component:
- Calculates correlation between price movement and time
- Provides real-time correlation coefficients
- Identifies trend strength through correlation thresholds
- Generates signals for trend changes and potential reversals
Multi-Timeframe Momentum Tracking
The indicator incorporates a unique multi-timeframe analysis system that:
- Displays momentum calculations across five timeframes (15m, 30m, 1h, 4h, 1d)
- Provides percentage-based momentum values
- Includes volatility adjustment capabilities
- Offers volume-weighted calculations for enhanced accuracy
Advanced Features
Statistical Analysis Panel
A comprehensive statistical panel provides real-time analysis including:
- Current Pearson coefficient value
- Correlation strength classification
- Trend direction identification
- Analysis period information
Dynamic Alert System
The indicator includes sophisticated alert conditions for:
- Bearish trend initiation (positive correlation threshold breach)
- Bullish trend initiation (negative correlation threshold breach)
- Trend direction changes (zero-line crossovers)
Visual Optimization
Advanced visualization features include:
- Customizable color schemes for all components
- Adjustable label sizes and positions
- Transparency controls for better chart visibility
- Warning indicators for potential trend weakening
Technical Implementation
The indicator combines multiple calculation methods:
- Donchian Channel calculations for Ichimoku components
- Pearson correlation coefficient computation with customizable periods
- EMA smoothing for momentum calculations
- Volume-weighted averaging capabilities
- Volatility adjustment mechanisms
Trading Applications
This indicator is particularly effective for:
1. Trend Direction Confirmation
- Multiple timeframe analysis provides comprehensive trend validation
- Pearson correlation adds statistical confidence to trend identification
- Ichimoku cloud formations confirm support and resistance levels
2. Entry and Exit Point Identification
- Cloud breakouts combined with correlation strength indicate potential entry points
- Multi-timeframe momentum alignment helps identify high-probability trades
- Warning indicators assist in timing market exits
3. Risk Management
- Dynamic support and resistance levels from the cloud
- Statistical trend strength measurement
- Multi-timeframe confirmation reduces false signals
Performance Considerations
The indicator uses efficient calculations to maintain good performance while providing comprehensive analysis. The smoothing parameters and analysis periods can be adjusted to balance between responsiveness and reliability.
Future Applications and Research
This combination of indicators opens possibilities for:
- Machine learning integration for pattern recognition
- Additional statistical measures for trend validation
- Enhanced alert systems based on multiple condition combinations
- Further optimization of calculation methods
The innovative combination of traditional Ichimoku analysis with modern statistical methods and multi-timeframe momentum tracking provides traders with a powerful tool for market analysis and decision-making.
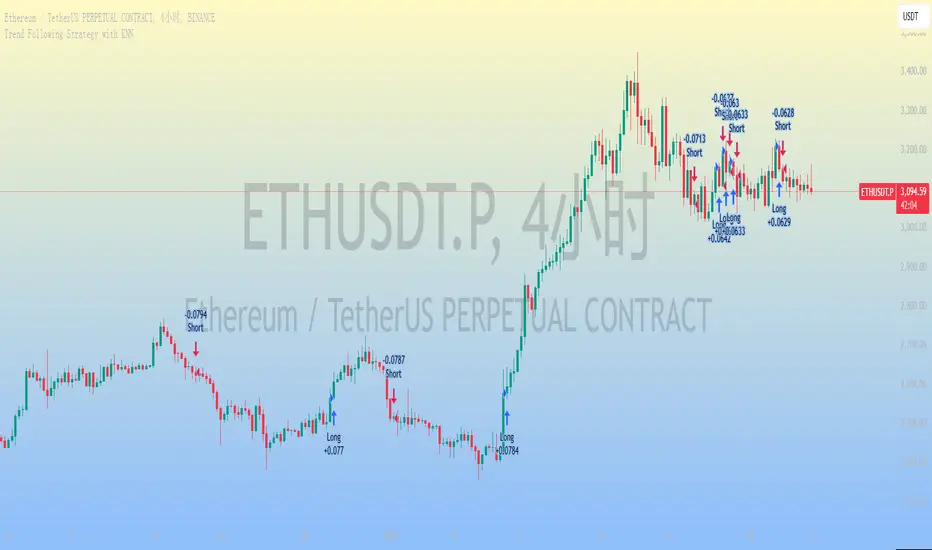
Trend Following Strategy with KNN
### 1. Strategy Features
This strategy combines the K-Nearest Neighbors (KNN) algorithm with a trend-following strategy to predict future price movements by analyzing historical price data. Here are the main features of the strategy:
1. **Dynamic Parameter Adjustment**: Uses the KNN algorithm to dynamically adjust parameters of the trend-following strategy, such as moving average length and channel length, to adapt to market changes.
2. **Trend Following**: Captures market trends using moving averages and price channels to generate buy and sell signals.
3. **Multi-Factor Analysis**: Combines the KNN algorithm with moving averages to comprehensively analyze the impact of multiple factors, improving the accuracy of trading signals.
4. **High Adaptability**: Automatically adjusts parameters using the KNN algorithm, allowing the strategy to adapt to different market environments and asset types.
### 2. Simple Introduction to the KNN Algorithm
The K-Nearest Neighbors (KNN) algorithm is a simple and intuitive machine learning algorithm primarily used for classification and regression problems. Here are the basic concepts of the KNN algorithm:
1. **Non-Parametric Model**: KNN is a non-parametric algorithm, meaning it does not make any assumptions about the data distribution. Instead, it directly uses training data for predictions.
2. **Instance-Based Learning**: KNN is an instance-based learning method that uses training data directly for predictions, rather than generating a model through a training process.
3. **Distance Metrics**: The core of the KNN algorithm is calculating the distance between data points. Common distance metrics include Euclidean distance, Manhattan distance, and Minkowski distance.
4. **Neighbor Selection**: For each test data point, the KNN algorithm finds the K nearest neighbors in the training dataset.
5. **Classification and Regression**: In classification problems, KNN determines the class of a test data point through a voting mechanism. In regression problems, KNN predicts the value of a test data point by calculating the average of the K nearest neighbors.
### 3. Applications of the KNN Algorithm in Quantitative Trading Strategies
The KNN algorithm can be applied to various quantitative trading strategies. Here are some common use cases:
1. **Trend-Following Strategies**: KNN can be used to identify market trends, helping traders capture the beginning and end of trends.
2. **Mean Reversion Strategies**: In mean reversion strategies, KNN can be used to identify price deviations from the mean.
3. **Arbitrage Strategies**: In arbitrage strategies, KNN can be used to identify price discrepancies between different markets or assets.
4. **High-Frequency Trading Strategies**: In high-frequency trading strategies, KNN can be used to quickly identify market anomalies, such as price spikes or volume anomalies.
5. **Event-Driven Strategies**: In event-driven strategies, KNN can be used to identify the impact of market events.
6. **Multi-Factor Strategies**: In multi-factor strategies, KNN can be used to comprehensively analyze the impact of multiple factors.
### 4. Final Considerations
1. **Computational Efficiency**: The KNN algorithm may face computational efficiency issues with large datasets, especially in real-time trading. Optimize the code to reduce access to historical data and improve computational efficiency.
2. **Parameter Selection**: The choice of K value significantly affects the performance of the KNN algorithm. Use cross-validation or other methods to select the optimal K value.
3. **Data Standardization**: KNN is sensitive to data standardization and feature selection. Standardize the data to ensure equal weighting of different features.
4. **Noisy Data**: KNN is sensitive to noisy data, which can lead to overfitting. Preprocess the data to remove noise.
5. **Market Environment**: The effectiveness of the KNN algorithm may be influenced by market conditions. Combine it with other technical indicators and fundamental analysis to enhance the robustness of the strategy.
B-Xtrender Simplified-BUY/SELL print Thanks to @puppytherapy for creating the original B-Xtrender indicator, available at this link: B-Xtrender by Puppytherapy.
This is a modified version of the original script, which now includes Buy and Sell arrows directly plotted on the chart for clear entry signals. The core logic of the indicator remains intact, with enhancements for simplicity and usability.
Overview:
The B-Xtrender Simplified indicator is a trend-following tool designed to identify potential buy and sell opportunities based on momentum and trend confluence. It combines short-term and long-term RSI-based oscillators with exponential moving averages to detect trend shifts and provide clear, actionable signals on the chart.
This simplified version focuses on clean visuals and provides buy and sell signals using arrows, ensuring an uncluttered chart. The indicator is suitable for traders who want a straightforward tool to assist with entry signals in trending markets.
Key Components:
Short-Term Oscillator:
Measures short-term momentum using the RSI of the difference between two EMAs (Short - L1 and Short - L2).
Provides early signals for trend reversals and momentum shifts.
Long-Term Oscillator:
Evaluates broader trend strength using the RSI of a single EMA (Long - L1).
Acts as a filter to ensure signals align with the overall market trend.
Smoothed Oscillator (T3):
Applies a smoothing algorithm to the short-term oscillator to reduce noise.
Ensures the signals are more reliable and less prone to false alarms.
How It Works:
Buy Signal (Green Arrow Below Candles):
Triggered when:
The short-term oscillator is above 0 (indicating upward momentum).
The smoothed short-term oscillator (maShortTermXtrender) is rising (momentum confirmation).
The long-term oscillator is above 0 (trend confirmation).
Sell Signal (Red Arrow Above Candles):
Triggered when:
The short-term oscillator is below 0 (indicating downward momentum).
The smoothed short-term oscillator (maShortTermXtrender) is falling (momentum confirmation).
The long-term oscillator is below 0 (trend confirmation).
Alerts:
Buy and sell signals generate alerts for traders to take immediate action when conditions are met.
Customization Options:
Short-Term Parameters:
Short - L1, Short - L2, Short - L3 control the responsiveness of the short-term oscillator.
Long-Term Parameters:
Long - L1, Long - L2 adjust the sensitivity of the long-term trend filter.
Default values ensure the indicator works effectively in most market conditions, but they can be fine-tuned for specific instruments or timeframes.
Strengths:
Clarity: Uses clean buy/sell arrows for visual simplicity.
Confluence-Based: Ensures alignment between short-term momentum and long-term trend before signaling.
Real-Time Alerts: Alerts for both buy and sell signals allow for timely decision-making.
Usage Tips:
Confirm Trend:
Use the indicator on a higher timeframe (e.g., 1-hour or daily) to confirm the overall trend direction.
Combine with Other Tools:
Enhance accuracy by combining the indicator with support/resistance levels, volume analysis, or other technical indicators.
Risk Management:
Always use stop-loss orders to protect against adverse market movements.
Maintain a risk-to-reward ratio of at least 1:2.
Ideal For:
Traders seeking clear and straightforward entry signals.
Trend-following strategies in liquid markets.
Beginners who want an easy-to-interpret tool for identifying momentum-based trades.
This simplified version of the B-Xtrender retains the original power of the indicator while focusing on clean visuals and actionable signals for trend-following traders.

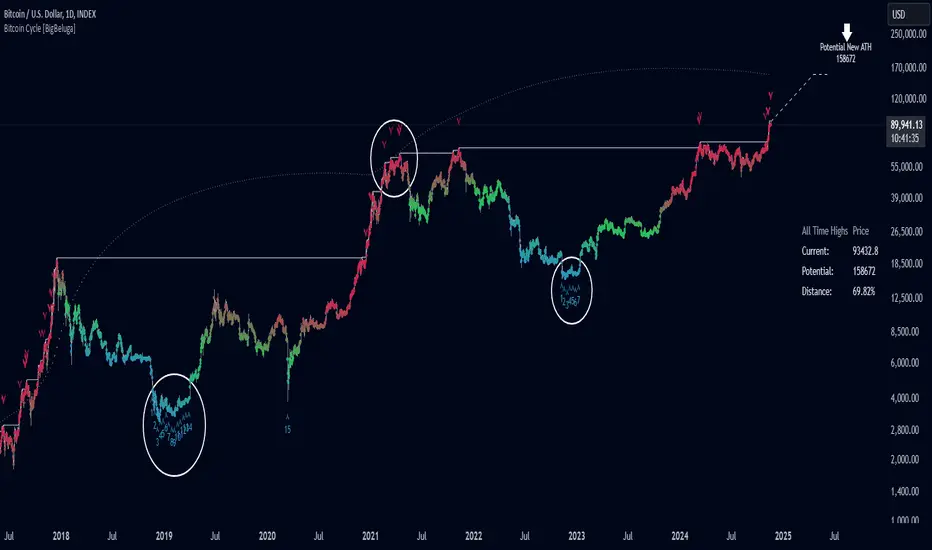
Bitcoin Cycle [BigBeluga]Bitcoin Cycle Indicator is designed exclusively for analyzing Bitcoin’s long-term market cycles, working only on the 1D BTC chart . This indicator provides an in-depth view of potential cycle tops and bottoms, assisting traders in identifying key phases in Bitcoin’s market evolution.
🔵 Key Features:
Heatmap Cycle Phases: The indicator colors each cycle from blue to red , reflecting Bitcoin’s market cycle progression. Cooler colors (blue/green) signal potential accumulation or early growth phases, while warmer colors (yellow/red) indicate maturation and potential top regions.
All-Time High (ATH) and Future ATH Projection: Tracks the current ATH in real-time, while applying a linear regression model to project a possible new ATH in the future. This projection aims to provide insights into the next major cycle peak for long-term strategy.
Dashboard Overview: Displays the current ATH, potential new ATH, and the percentage distance between them. This helps users assess how far the current price is from the projected target.
Top & Bottom Cycle Signals: Red down arrows mark significant price peaks, potentially indicating cycle tops. Up arrows, numbered sequentially (inside each cycle), denote possible bottom signals for strategic DCA (Dollar Cost Averaging) entries.
1D BTC Chart Only: Built solely for the 1D BTC timeframe. Switching to any other timeframe or asset will trigger a warning message: " BTC 1D Only ." This ensures accuracy in analyzing Bitcoin’s unique cyclical behavior.
🔵 When to Use:
Ideal for long-term Bitcoin investors and cycle analysts, the Bitcoin Cycle Indicator empowers users to:
Identify key accumulation and distribution phases.
Track Bitcoin’s cyclical highs and lows with visual heatmap cues.
Estimate future potential highs based on historical patterns.
Strategize long-term positions by monitoring cycle tops and possible accumulation zones.
By visualizing Bitcoin’s cycles with color-coded clarity and top/bottom markers, this indicator is an essential tool for any BTC analyst aiming to navigate market cycles effectively.
Silver Bullet ICT Strategy [TradingFinder] 10-11 AM NY Time +FVG🔵 Introduction
The ICT Silver Bullet trading strategy is a precise, time-based algorithmic approach that relies on Fair Value Gaps and Liquidity to identify high-probability trade setups. The strategy primarily focuses on the New York AM Session from 10:00 AM to 11:00 AM, leveraging heightened market activity within this critical window to capture short-term trading opportunities.
As an intraday strategy, it is most effective on lower timeframes, with ICT recommending a 15-minute chart or lower. While experienced traders often utilize 1-minute to 5-minute charts, beginners may find the 1-minute timeframe more manageable for applying this strategy.
This approach specifically targets quick trades, designed to take advantage of market movements within tight one-hour windows. By narrowing its focus, the Silver Bullet offers a streamlined and efficient method for traders to capitalize on liquidity shifts and price imbalances with precision.
In the fast-paced world of forex trading, the ability to identify market manipulation and false price movements is crucial for traders aiming to stay ahead of the curve. The Silver Bullet Indicator simplifies this process by integrating ICT principles such as liquidity traps, Order Blocks, and Fair Value Gaps (FVG).
These concepts form the foundation of a tool designed to mimic the strategies of institutional players, empowering traders to align their trades with the "smart money." By transforming complex market dynamics into actionable insights, the Silver Bullet Indicator provides a powerful framework for short-term trading success
Silver Bullet Bullish Setup :
Silver Bullet Bearish Setup :
🔵 How to Use
The Silver Bullet Indicator is a specialized tool that operates within the critical time windows of 9:00-10:00 and 10:00-11:00 in the forex market. Its design incorporates key principles from ICT (Inner Circle Trader) methodology, focusing on concepts such as liquidity traps, CISD Levels, Order Blocks, and Fair Value Gaps (FVG) to provide precise and actionable trade setups.
🟣 Bullish Setup
In a bullish setup, the indicator starts by marking the high and low of the session, serving as critical reference points for liquidity. A typical sequence involves a liquidity grab below the low, where the price manipulates retail traders into selling positions by breaching a key support level.
This movement is often orchestrated by smart money to accumulate buy orders. Following this liquidity grab, a market structure shift (MSS) occurs, signaled by the price breaking the CISD Level—a confirmation of bullish intent. The indicator then highlights an Order Block near the CISD Level, representing the zone where institutional buying is concentrated.
Additionally, it identifies a Fair Value Gap, which acts as a high-probability area for price retracement and trade entry. Traders can confidently take long positions when the price revisits these zones, targeting the next significant liquidity pool or resistance level.
Bullish Setup in CAPITALCOM:US100 :
🟣 Bearish Setup
Conversely, in a bearish setup, the price manipulates liquidity by creating a false breakout above the high of the session. This move entices retail traders into long positions, allowing institutional players to enter sell orders.
Once the price reverses direction and breaches the CISD Level to the downside, a change of character (CHOCH) becomes evident, confirming a bearish market structure. The indicator highlights an Order Block near this level, indicating the origin of the institutional sell orders, along with an associated FVG, which represents an imbalance zone likely to be revisited before the price continues downward.
By entering short positions when the price retraces to these levels, traders align their strategies with the anticipated continuation of bearish momentum, targeting nearby liquidity voids or support zones.
Bearish Setup in OANDA:XAUUSD :
🔵 Settings
Refine Order Block : Enables finer adjustments to Order Block levels for more accurate price responses.
Mitigation Level OB : Allows users to set specific reaction points within an Order Block, including: Proximal: Closest level to the current price. 50% OB: Midpoint of the Order Block. Distal: Farthest level from the current price.
FVG Filter : The Judas Swing indicator includes a filter for Fair Value Gap (FVG), allowing different filtering based on FVG width: FVG Filter Type: Can be set to "Very Aggressive," "Aggressive," "Defensive," or "Very Defensive." Higher defensiveness narrows the FVG width, focusing on narrower gaps.
Mitigation Level FVG : Like the Order Block, you can set price reaction levels for FVG with options such as Proximal, 50% OB, and Distal.
CISD : The Bar Back Check option enables traders to specify the number of past candles checked for identifying the CISD Level, enhancing CISD Level accuracy on the chart.
🔵 Conclusion
The Silver Bullet Indicator is a cutting-edge tool designed specifically for forex traders who aim to leverage market dynamics during critical liquidity windows. By focusing on the highly active 9:00-10:00 and 10:00-11:00 timeframes, the indicator simplifies complex market concepts such as liquidity traps, Order Blocks, Fair Value Gaps (FVG), and CISD Levels, transforming them into actionable insights.
What sets the Silver Bullet Indicator apart is its precision in detecting false breakouts and market structure shifts (MSS), enabling traders to align their strategies with institutional activity. The visual clarity of its signals, including color-coded zones and directional arrows, ensures that both novice and experienced traders can easily interpret and apply its findings in real-time.
By integrating ICT principles, the indicator empowers traders to identify high-probability entry and exit points, minimize risk, and optimize trade execution. Whether you are capturing short-term price movements or navigating complex market conditions, the Silver Bullet Indicator offers a robust framework to enhance your trading performance.
Ultimately, this tool is more than just an indicator; it is a strategic ally for traders who seek to decode the movements of smart money and capitalize on institutional strategies. With the Silver Bullet Indicator, traders can approach the market with greater confidence, precision, and profitability.

Zero-Lag MA Trend FollowingScript Name: Zero-Lag MA Trend Following Auto-Trading
Purpose and Unique Features:
This script is designed to implement a trend-following auto-trading strategy by combining the Zero-Lag Moving Average (ZLMA), Exponential Moving Average (EMA), and ATR Bands. To differentiate it from similar scripts, the following key aspects are emphasized:
Zero-Lag MA (ZLMA):
Responds quickly to price changes, minimizing lag compared to EMA.
Detects crossovers with EMA and generates Diamond Signals to indicate trend reversals.
ATR Bands:
Measures market volatility to set stop-loss levels.
Helps optimize entry points and manage risk effectively.
Diamond Signals:
A vital visual cue indicating the early stages of trend reversals.
Green diamonds signal an uptrend, while red diamonds signal a downtrend.
Each component plays a distinct role, working synergistically to enhance trend detection and risk management. This system doesn’t merely combine indicators but optimizes them for comprehensive trend-following and risk control.
Usage Instructions:
Entry Conditions:
Long Entry:
Enter when a green Diamond Signal appears (ZLMA crosses above EMA).
Short Entry:
Enter when a red Diamond Signal appears (ZLMA crosses below EMA).
Exit Conditions:
Stop Loss:
Set at the lower boundary of the ATR band for BUY or the upper boundary for SELL at entry.
Take Profit:
Automatically executed based on a 1:2 risk-reward ratio.
Account Size: ¥100,0000
Commissions and Slippage: Assumed commission of 90 pips per trade and slippage of 1 pip.
Risk per Trade: 10% of account equity (adjustable based on risk tolerance).
Improvements and Original Features:
While based on open-source code, this script incorporates the following critical enhancements:
Diamond Signals from ZLMA and EMA Integration:
Improves entry accuracy with a proprietary trend detection strategy.
ATR Bands Utilization:
Adds a volatility-based risk management function.
Optimized Visual Entry Signals:
Includes plotted triangles (▲, ▼) to clearly indicate trend-following entry points.
Credits:
This script builds upon indicators developed by ChartPrime, whose innovative approach and insights have enabled a more advanced trend-following strategy. We extend our gratitude for their foundational work.
Additionally, it integrates technical methods based on Zero-Lag Moving Average (ZLMA), EMA, and ATR Bands, leveraging insights from the trading community.
Chart Display Options:
The script offers options to toggle the visual signals (Diamond Signals, trend lines, and entry points) on or off, keeping the chart clean while maximizing analytical efficiency.
Disclaimer:
This script is provided for educational purposes and past performance does not guarantee future results.
Use it responsibly with proper risk management.

Holt-Winters Forecast BandsDescription:
The Holt-Winters Adaptive Bands indicator combines seasonal trend forecasting with adaptive volatility bands. It uses the Holt-Winters triple exponential smoothing model to project future price trends, while Nadaraya-Watson smoothed bands highlight dynamic support and resistance zones.
This indicator is ideal for traders seeking to predict future price movements and visualize potential market turning points. By focusing on broader seasonal and trend data, it provides insight into both short- and long-term market directions. It’s particularly effective for swing trading and medium-to-long-term trend analysis on timeframes like daily and 4-hour charts, although it can be adjusted for other timeframes.
Key Features:
Holt-Winters Forecast Line: The core of this indicator is the Holt-Winters model, which uses three components — level, trend, and seasonality — to project future prices. This model is widely used for time-series forecasting, and in this script, it provides a dynamic forecast line that predicts where price might move based on historical patterns.
Adaptive Volatility Bands: The shaded areas around the forecast line are based on Nadaraya-Watson smoothing of historical price data. These bands provide a visual representation of potential support and resistance levels, adapting to recent volatility in the market. The bands' fill colors (red for upper and green for lower) allow traders to identify potential reversal zones without cluttering the chart.
Dynamic Confidence Levels: The indicator adapts its forecast based on market volatility, using inputs such as average true range (ATR) and price deviations. This means that in high-volatility conditions, the bands may widen to account for increased price movements, helping traders gauge the current market environment.
How to Use:
Forecasting: Use the forecast line to gain insight into potential future price direction. This line provides a directional bias, helping traders anticipate whether the price may continue along a trend or reverse.
Support and Resistance Zones: The shaded bands act as dynamic support and resistance zones. When price enters the upper (red) band, it may be in an overbought area, while the lower (green) band may indicate oversold conditions. These bands adjust with volatility, so they reflect the current market conditions rather than fixed levels.
Timeframe Recommendations:
This indicator performs best on daily and 4-hour charts due to its reliance on trend and seasonality. It can be used on lower timeframes, but accuracy may vary due to increased price noise.
For traders looking to capture swing trades, the daily and 4-hour timeframes provide a balance of trend stability and signal reliability.
Adjustable Settings:
Alpha, Beta, and Gamma: These settings control the level, trend, and seasonality components of the forecast. Alpha is generally the most sensitive setting for adjusting responsiveness to recent price movements, while Beta and Gamma help fine-tune the trend and seasonal adjustments.
Band Smoothing and Deviation: These settings control the lookback period and width of the volatility bands, allowing users to customize how closely the bands follow price action.
Parameters:
Prediction Length: Sets the length of the forecast, determining how far into the future the prediction line extends.
Season Length: Defines the seasonality cycle. A setting of 14 is typical for bi-weekly cycles, but this can be adjusted based on observed market cycles.
Alpha, Beta, Gamma: These parameters adjust the Holt-Winters model's sensitivity to recent prices, trends, and seasonal patterns.
Band Smoothing: Determines the smoothing applied to the bands, making them either more reactive or smoother.
Ideal Use Cases:
Swing Trading and Trend Following: The Holt-Winters model is particularly suited for capturing larger market trends. Use the forecast line to determine trend direction and the bands to gauge support/resistance levels for potential entries or exits.
Identifying Reversal Zones: The adaptive bands act as dynamic overbought and oversold zones, giving traders potential reversal areas when price reaches these levels.
Important Notes:
No Buy/Sell Signals: This indicator does not produce direct buy or sell signals. It’s intended for visual trend analysis and support/resistance identification, leaving trade decisions to the user.
Not for High-Frequency Trading: Due to the nature of the Holt-Winters model, this indicator is optimized for higher timeframes like the daily and 4-hour charts. It may not be suitable for high-frequency or scalping strategies on very short timeframes.
Adjust for Volatility: If using the indicator on lower timeframes or more volatile assets, consider adjusting the band smoothing and prediction length settings for better responsiveness.

Adaptive Trend Channel IndicatorThe Adaptive Trend Channel Indicator is a trend-following tool designed to help traders identify buy and sell opportunities by analyzing price action in relation to a dynamic basis line with a customizable buffer zone. This indicator leverages an adaptive moving average to create a responsive trend line, providing insight into market direction and trend strength.
How It Works:
Dynamic Basis Calculation: Using a modified Kaufman’s Adaptive Moving Average (KAMA), the indicator calculates a basis line that adapts to price volatility. The basis line turns green during bullish trends and red during bearish trends, helping to visualize market sentiment.
Buffer Zone for Entry Signals: A buffer zone is calculated around the basis line to filter out false signals in low-volatility or sideways markets. Buy and sell signals are generated only when the price moves beyond this buffer zone, enhancing signal accuracy and reducing noise.
Non-Consecutive Signal Logic: To avoid over-trading, the indicator is programmed to prevent consecutive buy or sell signals in the same direction. This ensures that a new buy signal is only issued after a sell signal, and vice versa, for improved control in trending conditions.
Real-Time Alerts: The indicator issues real-time "Buy" and "Sell" alerts as soon as conditions are met, without waiting for the candle to close. This feature is particularly beneficial for intraday and scalping strategies, where timely entries are crucial.
How to Use:
Buy Signal: A buy signal appears when the basis line is green, and the price moves above the upper buffer zone, indicating a potential uptrend.
Sell Signal: A sell signal appears when the basis line is red, and the price falls below the lower buffer zone, signaling a potential downtrend.
The buffer zone’s sensitivity can be adjusted to adapt the indicator to different trading environments and personal risk tolerance.
Disclaimer: This indicator is designed to support your trading decisions and is best used in combination with other technical analysis tools. It is not intended as standalone financial advice.
Adaptive Kalman Trend Filter (Zeiierman)█ Overview
The Adaptive Kalman Trend Filter indicator is an advanced trend-following tool designed to help traders accurately identify market trends. Utilizing the Kalman Filter—a statistical algorithm rooted in control theory and signal processing—this indicator adapts to changing market conditions, smoothing price data to filter out noise. By focusing on state vector-based calculations, it dynamically adjusts trend and range measurements, making it an excellent tool for both trend-following and range-based trading strategies. The indicator's adaptive nature is enhanced by options for volatility adjustment and three unique Kalman filter models, each tailored for different market conditions.
█ How It Works
The Kalman Filter works by maintaining a model of the market state through matrices that represent state variables, error covariances, and measurement uncertainties. Here’s how each component plays a role in calculating the indicator’s trend:
⚪ State Vector (X): The state vector is a two-dimensional array where each element represents a market property. The first element is an estimate of the true price, while the second element represents the rate of change or trend in that price. This vector is updated iteratively with each new price, maintaining an ongoing estimate of both price and trend direction.
⚪ Covariance Matrix (P): The covariance matrix represents the uncertainty in the state vector’s estimates. It continuously adapts to changing conditions, representing how much error we expect in our trend and price estimates. Lower covariance values suggest higher confidence in the estimates, while higher values indicate less certainty, often due to market volatility.
⚪ Process Noise (Q): The process noise matrix (Q) is used to account for uncertainties in price movements that aren’t explained by historical trends. By allowing some degree of randomness, it enables the Kalman Filter to remain responsive to new data without overreacting to minor fluctuations. This noise is particularly useful in smoothing out price movements in highly volatile markets.
⚪ Measurement Noise (R): Measurement noise is an external input representing the reliability of each new price observation. In this indicator, it is represented by the setting Measurement Noise and determines how much weight is given to each new price point. Higher measurement noise makes the indicator less reactive to recent prices, smoothing the trend further.
⚪ Update Equations:
Prediction: The state vector and covariance matrix are first projected forward using a state transition matrix (F), which includes market estimates based on past data. This gives a “predicted” state before the next actual price is known.
Kalman Gain Calculation: The Kalman gain is calculated by comparing the predicted state with the actual price, balancing between the covariance matrix and measurement noise. This gain determines how much of the observed price should influence the state vector.
Correction: The observed price is then compared to the predicted price, and the state vector is updated using this Kalman gain. The updated covariance matrix reflects any adjustment in uncertainty based on the latest data.
█ Three Kalman Filter Models
Standard Model: Assumes that market fluctuations follow a linear progression without external adjustments. It is best suited for stable markets.
Volume Adjusted Model: Adjusts the filter sensitivity based on trading volume. High-volume periods result in stronger trends, making this model suitable for volume-driven assets.
Parkinson Adjusted Model: Uses the Parkinson estimator, accounting for volatility through high-low price ranges, making it effective in markets with high intraday fluctuations.
These models enable traders to choose a filter that aligns with current market conditions, enhancing trend accuracy and responsiveness.
█ Trend Strength
The Trend Strength provides a visual representation of the current trend's strength as a percentage based on oscillator calculations from the Kalman filter. This table divides trend strength into color-coded segments, helping traders quickly assess whether the market is strongly trending or nearing a reversal point. A high trend strength percentage indicates a robust trend, while a low percentage suggests weakening momentum or consolidation.
█ Trend Range
The Trend Range section evaluates the market's directional movement over a specified lookback period, highlighting areas where price oscillations indicate a trend. This calculation assesses how prices vary within the range, offering an indication of trend stability or the likelihood of reversals. By adjusting the trend range setting, traders can fine-tune the indicator’s sensitivity to longer or shorter trends.
█ Sigma Bands
The Sigma Bands in the indicator are based on statistical standard deviations (sigma levels), which act as dynamic support and resistance zones. These bands are calculated using the Kalman Filter's trend estimates and adjusted for volatility (if enabled). The bands expand and contract according to market volatility, providing a unique visualization of price boundaries. In high-volatility periods, the bands widen, offering better protection against false breakouts. During low volatility, the bands narrow, closely tracking price movements. Traders can use these sigma bands to spot potential entry and exit points, aiming for reversion trades or trend continuation setups.
Trend Based
Volatility Based
█ How to Use
Trend Following:
When the Kalman Filter is green, it signals a bullish trend, and when it’s red, it indicates a bearish trend. The Sigma Cloud provides additional insights into trend strength. In a strong bullish trend, the cloud remains below the Kalman Filter line, while in a strong bearish trend, the cloud stays above it. Expansion and contraction of the Sigma Cloud indicate market momentum changes. Rapid expansion suggests an impulsive move, which could either signal the continuation of the trend or be an early sign of a possible trend reversal.
Mean Reversion: Watch for prices touching the upper or lower sigma bands, which often act as dynamic support and resistance.
Volatility Breakouts: Enable volatility-adjusted sigma bands. During high volatility, watch for price movements that extend beyond the bands as potential breakout signals.
Trend Continuation: When the Kalman Filter line aligns with a high trend strength, it signals a continuation in that direction.
█ Settings
Measurement Noise: Adjusts how sensitive the indicator is to price changes. Higher values smooth out fluctuations but delay reaction, while lower values increase sensitivity to short-term changes.
Kalman Filter Model: Choose between the standard, volume-adjusted, and Parkinson-adjusted models based on market conditions.
Band Sigma: Sets the standard deviation used for calculating the sigma bands, directly affecting the width of the dynamic support and resistance.
Volatility Adjusted Bands: Enables bands to dynamically adapt to volatility, increasing their effectiveness in fluctuating markets.
Trend Strength: Defines the lookback period for trend strength calculation. Shorter periods result in more responsive trend strength readings, while longer periods smooth out the calculation.
Trend Range: Specifies the lookback period for the trend range, affecting the assessment of trend stability over time.
-----------------
Disclaimer
The information contained in my Scripts/Indicators/Ideas/Algos/Systems does not constitute financial advice or a solicitation to buy or sell any securities of any type. I will not accept liability for any loss or damage, including without limitation any loss of profit, which may arise directly or indirectly from the use of or reliance on such information.
All investments involve risk, and the past performance of a security, industry, sector, market, financial product, trading strategy, backtest, or individual's trading does not guarantee future results or returns. Investors are fully responsible for any investment decisions they make. Such decisions should be based solely on an evaluation of their financial circumstances, investment objectives, risk tolerance, and liquidity needs.
My Scripts/Indicators/Ideas/Algos/Systems are only for educational purposes!
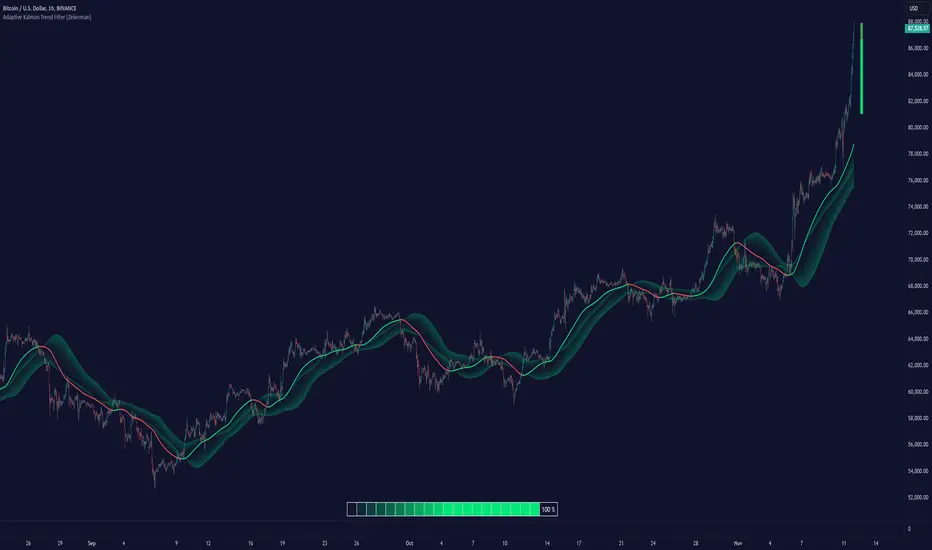
Direction Coefficient Indicator# Direction Coefficient Indicator with Advanced Volume & Volatility Adjustments
The Direction Coefficient Indicator represents an advanced technical analysis tool that combines price momentum analysis with sophisticated volume and volatility adjustments. This versatile indicator measures market direction while adapting to various trading conditions, making it valuable for both trend following and momentum trading strategies.
At its core, the indicator employs a unique approach to price analysis by establishing a dynamic reference period for calculations. It processes price data through an EMA smoothing mechanism to reduce market noise and presents results as percentage-based measurements, ensuring universal applicability across different markets and timeframes.
One of the indicator's standout features is its volume integration system. When enabled, this system implements volume-weighted calculations that provide enhanced accuracy during significant market moves while effectively reducing false signals during low-volume periods. This volume weighting mechanism proves particularly valuable in highly liquid markets where volume plays a crucial role in price movement validation.
The volatility adjustment feature sets this indicator apart from traditional momentum tools. By incorporating smart volatility normalization, the indicator adapts seamlessly to changing market conditions. This adjustment helps maintain consistent signals across different volatility regimes, preventing excessive noise during highly volatile periods while remaining sensitive enough during calmer market phases.
Direction change detection forms another crucial component of the indicator. The system continuously monitors momentum shifts and provides early warning signals for potential trend reversals. This feature helps traders avoid late exits from positions and offers valuable insights for potential market turning points. When the indicator detects significant changes in momentum, it displays a warning symbol (⚠) alongside its regular signals.
The visual presentation of the indicator utilizes an intuitive color-coded system. Green labels indicate positive momentum, while red labels signify negative momentum. The display system includes customizable label sizes and positions, allowing traders to adapt the visual elements to their specific chart setup and preferences. Label distance from candles, color schemes, and reference lines can all be adjusted to create an optimal visual experience.
For practical application, the indicator offers several parameter settings that traders can adjust. The time period parameters include adjustable lookback periods and EMA length, while advanced calculation options allow for enabling or disabling volume weighting and volatility adjustment features. These parameters can be fine-tuned based on specific trading timeframes and market conditions.
In trend following scenarios, traders can use the coefficient direction for trend confirmation while monitoring warning signals for potential exits. The volume weighting feature adds another layer of confirmation for trend strength. For momentum trading, strong coefficient readings can signal entry points, while warning signals help identify potential exit timing.
Risk management becomes more systematic with this indicator. Warning signals can guide stop loss placement, while the volatility adjustment feature assists in position sizing decisions. The volume weighting component helps traders evaluate the significance of price moves, contributing to more informed entry timing decisions.
The indicator performs optimally when traders start with default settings and gradually adjust parameters based on their specific needs. For longer-term trades, increasing the lookback period often provides more stable signals. In highly liquid markets, enabling volume weighting can enhance signal quality. The volatility adjustment feature proves particularly valuable during unstable market conditions.
The Direction Coefficient Indicator stands as a comprehensive solution for traders seeking a sophisticated yet practical approach to market analysis. By combining multiple analytical components into a single, customizable tool, it provides valuable insights while remaining accessible to traders of various experience levels.
For optimal results, traders should consider using this indicator in conjunction with other technical analysis tools while paying attention to its warning signals and volume-weighted insights. Regular parameter adjustment based on changing market conditions and specific trading styles will help maximize the indicator's effectiveness in various trading scenarios.
Indicateur de Coefficient Directeur
L'Indicateur de Coefficient Directeur représente un outil d'analyse technique avancé qui combine l'analyse de momentum des prix avec des ajustements sophistiqués de volume et de volatilité. Cet indicateur polyvalent mesure la direction du marché tout en s'adaptant à diverses conditions de trading, le rendant précieux tant pour le suivi de tendance que pour les stratégies de trading momentum.
À sa base, l'indicateur emploie une approche unique de l'analyse des prix en établissant une période de référence dynamique pour les calculs. Il traite les données de prix à travers un mécanisme de lissage EMA pour réduire le bruit du marché et présente les résultats sous forme de mesures en pourcentage, assurant une applicabilité universelle à travers différents marchés et temporalités.
L'une des caractéristiques distinctives de l'indicateur est son système d'intégration du volume. Lorsqu'il est activé, ce système met en œuvre des calculs pondérés par le volume qui fournissent une précision accrue pendant les mouvements significatifs du marché tout en réduisant efficacement les faux signaux pendant les périodes de faible volume. Ce mécanisme de pondération du volume s'avère particulièrement valuable dans les marchés très liquides où le volume joue un rôle crucial dans la validation des mouvements de prix.
La fonction d'ajustement de la volatilité distingue cet indicateur des outils de momentum traditionnels. En incorporant une normalisation intelligente de la volatilité, l'indicateur s'adapte parfaitement aux conditions changeantes du marché. Cet ajustement aide à maintenir des signaux cohérents à travers différents régimes de volatilité, empêchant le bruit excessif pendant les périodes très volatiles tout en restant suffisamment sensible pendant les phases de marché plus calmes.
La détection des changements de direction forme une autre composante cruciale de l'indicateur. Le système surveille continuellement les changements de momentum et fournit des signaux d'avertissement précoces pour les potentiels renversements de tendance. Cette fonctionnalité aide les traders à éviter les sorties tardives des positions et offre des aperçus précieux des potentiels points de retournement du marché. Lorsque l'indicateur détecte des changements significatifs de momentum, il affiche un symbole d'avertissement (⚠) à côté de ses signaux réguliers.
La présentation visuelle de l'indicateur utilise un système intuitif codé par couleurs. Les étiquettes vertes indiquent un momentum positif, tandis que les étiquettes rouges signifient un momentum négatif. Le système d'affichage inclut des tailles et positions d'étiquettes personnalisables, permettant aux traders d'adapter les éléments visuels à leur configuration spécifique de graphique et leurs préférences. La distance des étiquettes par rapport aux bougies, les schémas de couleurs et les lignes de référence peuvent tous être ajustés pour créer une expérience visuelle optimale.
Pour l'application pratique, l'indicateur offre plusieurs paramètres de réglage que les traders peuvent ajuster. Les paramètres de période temporelle incluent des périodes de référence ajustables et la longueur de l'EMA, tandis que les options de calcul avancées permettent d'activer ou de désactiver les fonctionnalités de pondération du volume et d'ajustement de la volatilité. Ces paramètres peuvent être affinés en fonction des temporalités de trading spécifiques et des conditions de marché.
Dans les scénarios de suivi de tendance, les traders peuvent utiliser la direction du coefficient pour la confirmation de tendance tout en surveillant les signaux d'avertissement pour les sorties potentielles. La fonction de pondération du volume ajoute une couche supplémentaire de confirmation pour la force de la tendance. Pour le trading momentum, des lectures fortes du coefficient peuvent signaler des points d'entrée, tandis que les signaux d'avertissement aident à identifier le timing potentiel de sortie.
La gestion du risque devient plus systématique avec cet indicateur. Les signaux d'avertissement peuvent guider le placement des stops loss, tandis que la fonction d'ajustement de la volatilité aide aux décisions de dimensionnement des positions. La composante de pondération du volume aide les traders à évaluer l'importance des mouvements de prix, contribuant à des décisions de timing d'entrée plus éclairées.
L'indicateur fonctionne de manière optimale lorsque les traders commencent avec les paramètres par défaut et ajustent progressivement les paramètres en fonction de leurs besoins spécifiques. Pour les trades à plus long terme, l'augmentation de la période de référence fournit souvent des signaux plus stables. Dans les marchés très liquides, l'activation de la pondération du volume peut améliorer la qualité des signaux. La fonction d'ajustement de la volatilité s'avère particulièrement précieuse pendant les conditions de marché instables.
L'Indicateur de Coefficient Directeur s'impose comme une solution complète pour les traders recherchant une approche sophistiquée mais pratique de l'analyse de marché. En combinant plusieurs composantes analytiques en un seul outil personnalisable, il fournit des aperçus précieux tout en restant accessible aux traders de différents niveaux d'expérience.
Pour des résultats optimaux, les traders devraient envisager d'utiliser cet indicateur en conjonction avec d'autres outils d'analyse technique tout en prêtant attention à ses signaux d'avertissement et ses aperçus pondérés par le volume. L'ajustement régulier des paramètres basé sur les conditions changeantes du marché et les styles de trading spécifiques aidera à maximiser l'efficacité de l'indicateur dans divers scénarios de trading.

Exposure Oscillator (Cumulative 0 to ±100%)
Exposure Oscillator (Cumulative 0 to ±100%)
This Pine Script indicator plots an "Exposure Oscillator" on the chart, which tracks the cumulative market exposure from a range of technical buy and sell signals. The exposure is measured on a scale from -100% (maximum short exposure) to +100% (maximum long exposure), helping traders assess the strength of their position in the market. It provides an intuitive visual cue to aid decision-making for trend-following strategies.
Buy Signals (Increase Exposure Score by +10%)
Buy Signal 1 (Cross Above 21 EMA):
This signal is triggered when the price crosses above the 21-period Exponential Moving Average (EMA), where the current bar closes above the EMA21, and the previous bar closed below the EMA21. This indicates a potential upward price movement as the market shifts into a bullish trend.
buySignal1 = ta.crossover(close, ema21)
Buy Signal 2 (Trending Above 21 EMA):
This signal is triggered when the price closes above the 21-period EMA for each of the last 5 bars, indicating a sustained bullish trend. It confirms that the price is consistently above the EMA21 for a significant period.
buySignal2 = ta.barssince(close <= ema21) > 5
Buy Signal 3 (Living Above 21 EMA):
This signal is triggered when the price has closed above the 21-period EMA for each of the last 15 bars, demonstrating a strong, prolonged uptrend.
buySignal3 = ta.barssince(close <= ema21) > 15
Buy Signal 4 (Cross Above 50 SMA):
This signal is triggered when the price crosses above the 50-period Simple Moving Average (SMA), where the current bar closes above the 50 SMA, and the previous bar closed below it. It indicates a shift toward bullish momentum.
buySignal4 = ta.crossover(close, sma50)
Buy Signal 5 (Cross Above 200 SMA):
This signal is triggered when the price crosses above the 200-period Simple Moving Average (SMA), where the current bar closes above the 200 SMA, and the previous bar closed below it. This suggests a long-term bullish trend.
buySignal5 = ta.crossover(close, sma200)
Buy Signal 6 (Low Above 50 SMA):
This signal is true when the lowest price of the current bar is above the 50-period SMA, indicating strong bullish pressure as the price maintains itself above the moving average.
buySignal6 = low > sma50
Buy Signal 7 (Accumulation Day):
An accumulation day occurs when the closing price is in the upper half of the daily range (greater than 50%) and the volume is larger than the previous bar's volume, suggesting buying pressure and accumulation.
buySignal7 = (close - low) / (high - low) > 0.5 and volume > volume
Buy Signal 8 (Higher High):
This signal occurs when the current bar’s high exceeds the highest high of the previous 14 bars, indicating a breakout or strong upward momentum.
buySignal8 = high > ta.highest(high, 14)
Buy Signal 9 (Key Reversal Bar):
This signal is generated when the stock opens below the low of the previous bar but rallies to close above the previous bar’s high, signaling a potential reversal from bearish to bullish.
buySignal9 = open < low and close > high
Buy Signal 10 (Distribution Day Fall Off):
This signal is triggered when a distribution day (a day with high volume and a close near the low of the range) "falls off" the rolling 25-bar period, indicating the end of a bearish trend or selling pressure.
buySignal10 = ta.barssince(close < sma50 and close < sma50) > 25
Sell Signals (Decrease Exposure Score by -10%)
Sell Signal 1 (Cross Below 21 EMA):
This signal is triggered when the price crosses below the 21-period Exponential Moving Average (EMA), where the current bar closes below the EMA21, and the previous bar closed above it. It suggests that the market may be shifting from a bullish trend to a bearish trend.
sellSignal1 = ta.crossunder(close, ema21)
Sell Signal 2 (Trending Below 21 EMA):
This signal is triggered when the price closes below the 21-period EMA for each of the last 5 bars, indicating a sustained bearish trend.
sellSignal2 = ta.barssince(close >= ema21) > 5
Sell Signal 3 (Living Below 21 EMA):
This signal is triggered when the price has closed below the 21-period EMA for each of the last 15 bars, suggesting a strong downtrend.
sellSignal3 = ta.barssince(close >= ema21) > 15
Sell Signal 4 (Cross Below 50 SMA):
This signal is triggered when the price crosses below the 50-period Simple Moving Average (SMA), where the current bar closes below the 50 SMA, and the previous bar closed above it. It indicates the start of a bearish trend.
sellSignal4 = ta.crossunder(close, sma50)
Sell Signal 5 (Cross Below 200 SMA):
This signal is triggered when the price crosses below the 200-period Simple Moving Average (SMA), where the current bar closes below the 200 SMA, and the previous bar closed above it. It indicates a long-term bearish trend.
sellSignal5 = ta.crossunder(close, sma200)
Sell Signal 6 (High Below 50 SMA):
This signal is true when the highest price of the current bar is below the 50-period SMA, indicating weak bullishness or a potential bearish reversal.
sellSignal6 = high < sma50
Sell Signal 7 (Distribution Day):
A distribution day is identified when the closing range of a bar is less than 50% and the volume is larger than the previous bar's volume, suggesting that selling pressure is increasing.
sellSignal7 = (close - low) / (high - low) < 0.5 and volume > volume
Sell Signal 8 (Lower Low):
This signal occurs when the current bar's low is less than the lowest low of the previous 14 bars, indicating a breakdown or strong downward momentum.
sellSignal8 = low < ta.lowest(low, 14)
Sell Signal 9 (Downside Reversal Bar):
A downside reversal bar occurs when the stock opens above the previous bar's high but falls to close below the previous bar’s low, signaling a reversal from bullish to bearish.
sellSignal9 = open > high and close < low
Sell Signal 10 (Distribution Cluster):
This signal is triggered when a distribution day occurs three times in the rolling 7-bar period, indicating significant selling pressure.
sellSignal10 = ta.valuewhen((close < low) and volume > volume , 1, 7) >= 3
Theme Mode:
Users can select the theme mode (Auto, Dark, or Light) to match the chart's background or to manually choose a light or dark theme for the oscillator's appearance.
Exposure Score Calculation: The script calculates a cumulative exposure score based on a series of buy and sell signals.
Buy signals increase the exposure score, while sell signals decrease it. Each signal impacts the score by ±10%.
Signal Conditions: The buy and sell signals are derived from multiple conditions, including crossovers with moving averages (EMA21, SMA50, SMA200), trend behavior, and price/volume analysis.
Oscillator Visualization: The exposure score is visualized as a line on the chart, changing color based on whether the exposure is positive (long position) or negative (short position). It is limited to the range of -100% to +100%.
Position Type: The indicator also indicates the position type based on the exposure score, labeling it as "Long," "Short," or "Neutral."
Horizontal Lines: Reference lines at 0%, 100%, and -100% visually mark neutral, increasing long, and increasing short exposure levels.
Exposure Table: A table displays the current exposure level (in percentage) and position type ("Long," "Short," or "Neutral"), updated dynamically based on the oscillator’s value.
Inputs:
Theme Mode: Choose "Auto" to use the default chart theme, or manually select "Dark" or "Light."
Usage:
This oscillator is designed to help traders track market sentiment, gauge exposure levels, and manage risk. It can be used for long-term trend-following strategies or short-term trades based on moving average crossovers and volume analysis.
The oscillator operates in conjunction with the chart’s price action and provides a visual representation of the market’s current trend strength and exposure.
Important Considerations:
Risk Management: While the exposure score provides valuable insight, it should be combined with other risk management tools and analysis for optimal trading decisions.
Signal Sensitivity: The accuracy and effectiveness of the signals depend on market conditions and may require adjustments based on the user’s trading strategy or timeframe.
Disclaimer:
This script is for educational purposes only. Trading involves significant risk, and users should carefully evaluate all market conditions and apply appropriate risk management strategies before using this tool in live trading environments.

Trend Trader-RemasteredThe script was originally coded in 2018 with Pine Script version 3, and it was in invite only status. It has been updated and optimised for Pine Script v5 and made completely open source.
Overview
The Trend Trader-Remastered is a refined and highly sophisticated implementation of the Parabolic SAR designed to create strategic buy and sell entry signals, alongside precision take profit and re-entry signals based on marked Bill Williams (BW) fractals. Built with a deep emphasis on clarity and accuracy, this indicator ensures that only relevant and meaningful signals are generated, eliminating any unnecessary entries or exits.
Key Features
1) Parabolic SAR-Based Entry Signals:
This indicator leverages an advanced implementation of the Parabolic SAR to create clear buy and sell position entry signals.
The Parabolic SAR detects potential trend shifts, helping traders make timely entries in trending markets.
These entries are strategically aligned to maximise trend-following opportunities and minimise whipsaw trades, providing an effective approach for trend traders.
2) Take Profit and Re-Entry Signals with BW Fractals:
The indicator goes beyond simple entry and exit signals by integrating BW Fractal-based take profit and re-entry signals.
Relevant Signal Generation: The indicator maintains strict criteria for signal relevance, ensuring that a re-entry signal is only generated if there has been a preceding take profit signal in the respective position. This prevents any misleading or premature re-entry signals.
Progressive Take Profit Signals: The script generates multiple take profit signals sequentially in alignment with prior take profit levels. For instance, in a buy position initiated at a price of 100, the first take profit might occur at 110. Any subsequent take profit signals will then occur at prices greater than 110, ensuring they are "in favour" of the original position's trajectory and previous take profits.
3) Consistent Trend-Following Structure:
This design allows the Trend Trader-Remastered to continue signaling take profit opportunities as the trend advances. The indicator only generates take profit signals in alignment with previous ones, supporting a systematic and profit-maximising strategy.
This structure helps traders maintain positions effectively, securing incremental profits as the trend progresses.
4) Customisability and Usability:
Adjustable Parameters: Users can configure key settings, including sensitivity to the Parabolic SAR and fractal identification. This allows flexibility to fine-tune the indicator according to different market conditions or trading styles.
User-Friendly Alerts: The indicator provides clear visual signals on the chart, along with optional alerts to notify traders of new buy, sell, take profit, or re-entry opportunities in real-time.

Sharpe Ratio Z-ScoreThis indicator calculates the Sharpe Ratio and its Z-Score , which are used to evaluate the risk-adjusted return of an asset over a given period. The Sharpe Ratio is computed using the average return and the standard deviation of returns, while the Z-Score standardizes this ratio to assess how far the current Sharpe Ratio deviates from its historical average.
The Sharpe Ratio is a measure of how much return an investment has generated relative to the risk it has taken. In the context of this script, the risk-free rate is assumed to be 0, but in real applications, it would typically be the return on a safe investment, like a Treasury bond. A higher Sharpe Ratio indicates that the investment's returns are higher compared to its risk, making it a more favorable investment. Conversely, a lower Sharpe Ratio suggests that the investment may not be worth the risk.
Calculation:
Daily Returns Calculation: The script calculates the daily return of the asset. This measures the percentage change in the asset’s closing price from one period to the next.
Sharpe Ratio Calculation: The Sharpe Ratio is calculated by taking the average daily return and dividing it by the standard deviation of the returns, then multiplying by the square root of the period length.
Usage:
Traders and Investors can use the Sharpe Ratio to evaluate how well the asset is compensating for risk. A high Sharpe Ratio indicates a high return per unit of risk, whereas a low or negative Sharpe Ratio suggests poor risk-adjusted returns. In overbought times, an asset would have high/positive returns per unit of risk. In oversold times, an asset would have low/negative returns per unit of risk.
The Z-Score provides a way to compare the current Sharpe Ratio to its historical distribution, offering a more standardized view of how extreme or typical the current ratio is.
Positive Z-score: Indicates that the asset's return is significantly lower than its risk, suggesting potential oversold conditions.
Negative Z-score: Indicates that the asset's return is significantly higher than its risk, suggesting potential overbought conditions.
Red Zone (-3 to -2): Strong overbought conditions.
Green Zone (2 to 3): Strong oversold conditions.
Sharpe Ratio Limitations:
While the Sharpe Ratio is widely used to evaluate risk-adjusted returns, it has its limitations.
Fat Tails: It assumes that returns are normally distributed and does not account for extreme events or "fat tails" in the return distribution. This can be problematic for assets like cryptocurrencies, which may experience large, sudden price swings that skew the return distribution.
Single Risk Factor: The Sharpe Ratio only considers standard deviation (total volatility) as a measure of risk, ignoring other types of risks like skewness or kurtosis, which may also impact an asset’s performance.
Time Frame Sensitivity: The accuracy of the Sharpe Ratio and its Z-Score is heavily influenced by the time frame chosen for the calculation. A longer period may smooth out short-term fluctuations, while a shorter period might be more sensitive to recent volatility.
Overbought and Oversold Zones: The script marks overbought and oversold conditions based on the Z-Score, but this is not a guarantee of market reversal. It’s important to combine this tool with other technical indicators and fundamental analysis for a more comprehensive market evaluation.
Volatility: The Sharpe Ratio and Z-Score depend on the volatility (standard deviation) of the asset’s returns. For highly volatile assets, such as cryptocurrencies, the Sharpe Ratio may not fully capture the true risk or may be misleading if the volatility is transient.
Doesn't Account for Downside Risk: The Sharpe Ratio treats upside and downside volatility equally, which may not reflect how investors perceive risk. Some investors may be more concerned with downside risk, which the Sharpe Ratio does not distinguish from upside fluctuations.
Important Considerations:
The Sharpe Ratio should not be used in isolation. While it provides valuable insights into risk-adjusted returns, it is important to combine it with other performance and risk indicators to form a more comprehensive market evaluation. Relying solely on the Sharpe Ratio may lead to misleading conclusions, particularly in volatile or non-normally distributed markets.
When integrated into a broader investment strategy, the Sharpe Ratio can help traders and investors better assess the risk-return profile of an asset, identifying periods of potential overperformance or underperformance. However, it should be used alongside other tools to ensure more informed decision-making, especially in highly fluctuating markets.
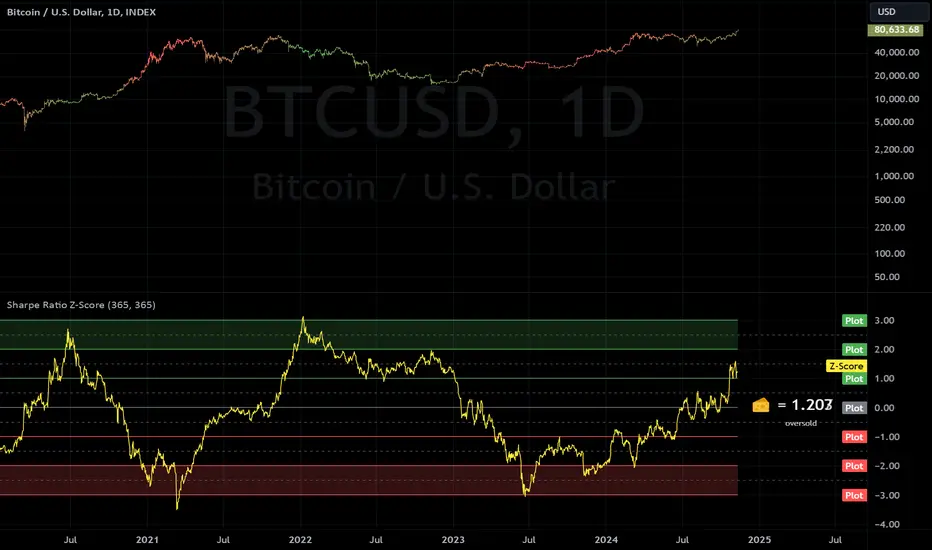
Volumetric Rejection Blocks [UAlgo]The Volumetric Rejection Blocks is designed to help traders identify and visualize key price levels where volumetric rejections occur, which may indicate a shift in market sentiment. These rejections can signal potential trend reversals or areas where price action is likely to face support or resistance. By drawing rejection blocks based on volumetric strength, the indicator allows users to observe where significant buying or selling pressure has been exerted, which can be used as a reference point for future price action.
Also indicator dynamically calculates swing highs and lows, analyzes bullish and bearish strengths based on volume-weighted price movements, and displays rejection blocks on the chart. Each rejection block represents an area where the price attempted to move beyond a certain level but faced rejection, either on a close or wick basis. This can be particularly useful for traders who rely on market structure and order flow to make informed decisions about entering or exiting trades.
🔶 Key Features
Swing Length Customization: Allows users to define the swing length, helping tailor the sensitivity of the swing high and low detection to the specific market conditions.
Rejection Block Visualization: Displays up to the last 10 rejection blocks based on user settings, clearly marking areas of significant bullish or bearish rejections.
Volumetric Strength Analysis: The indicator calculates bullish and bearish strength for each rejection block, based on volume-weighted price movements over the last few bars, giving insight into the intensity of the rejection.
Violation Check Type: Offers two options for violation detection—"Close" and "Wick". This allows traders to specify whether a price level is considered broken only if it closes beyond the level or if any wick breaches it.
Bullish and Bearish Block Coloring: Rejection blocks are colored to represent bullish (green) and bearish (red) rejection areas. The color transparency can be adjusted for clear visibility overlaid on the price chart.
Market Structure Labels: Labels and lines marking "Market Structure Shift" (MSS) and "Break of Structure" (BOS) are displayed, giving traders context about significant market structure changes.
🔶 Interpreting the Indicator
Rejection Blocks: These colored blocks on the chart indicate areas where the price faced significant buying or selling pressure. A green block suggests a bullish rejection (support zone), where buyers absorbed the sell-off, potentially pushing the price upward. Conversely, a red block indicates a bearish rejection (resistance zone), where sellers overpowered buyers, potentially driving the price lower.
Strength Analysis: The width of the green and red sections within a rejection block represents the relative bullish and bearish strengths. A wider green section indicates stronger bullish support, while a wider red section suggests more robust bearish resistance. This helps traders gauge the likelihood of price holding or breaching these levels.
Market Structure Shift (MSS) and Break of Structure (BOS): The indicator automatically detects and labels significant changes in market structure. An "MSS" label indicates the first break, suggesting a potential shift in trend direction. A "BOS" label indicates a subsequent confirmation in trend direction, allowing traders to recognize potential trend continuations.
Violation Check: Traders can choose how to interpret breaks of these rejection blocks. Using the "Close" option provides a more conservative approach, requiring a close beyond the level for confirmation. The "Wick" option is more aggressive, treating any wick beyond the level as a break.
🔶 Disclaimer
Use with Caution: This indicator is provided for educational and informational purposes only and should not be considered as financial advice. Users should exercise caution and perform their own analysis before making trading decisions based on the indicator's signals.
Not Financial Advice: The information provided by this indicator does not constitute financial advice, and the creator (UAlgo) shall not be held responsible for any trading losses incurred as a result of using this indicator.
Backtesting Recommended: Traders are encouraged to backtest the indicator thoroughly on historical data before using it in live trading to assess its performance and suitability for their trading strategies.
Risk Management: Trading involves inherent risks, and users should implement proper risk management strategies, including but not limited to stop-loss orders and position sizing, to mitigate potential losses.
No Guarantees: The accuracy and reliability of the indicator's signals cannot be guaranteed, as they are based on historical price data and past performance may not be indicative of future results.
