Vlad Waves█ CONCEPT
Acceleration Line (Blue)
The Acceleration Line is calculated as the difference between the 8-period SMA and the 20-period SMA.
This line helps to identify the momentum and potential turning points in the market.
Signal Line (Red)
The Signal Line is an 8-period SMA of the Acceleration Line.
This line smooths out the Acceleration Line to generate clearer signals.
Long-Term Average (Green)
The Long-Term Average is a 200-period SMA of the Acceleration Line.
This line provides a broader context of the market trend, helping to distinguish between long-term and short-term movements.
█ SIGNALS
Buy Mode
A buy signal occurs when the Acceleration Line crosses above the Signal Line while below the Long-Term Average. This indicates a potential bullish reversal in the market.
When the Signal Line crosses the Acceleration Line above the Long-Term Average, consider placing a stop rather than reversing the position to protect gains from potential pullbacks.
Sell Mode
A sell signal occurs when the Acceleration Line crosses below the Signal Line while above the Long-Term Average. This indicates a potential bearish reversal in the market.
When the Signal Line crosses the Acceleration Line below the Long-Term Average, consider placing a stop rather than reversing the position to protect gains from potential pullbacks.
█ UTILITY
This indicator is not recommended for standalone buy or sell signals. Instead, it is designed to identify market cycles and turning points, aiding in the decision-making process.
Entry signals are most effective when they occur away from the Long-Term Average, as this helps to avoid sideways movements.
Use larger timeframes, such as daily or weekly charts, for better accuracy and reliability of the signals.
█ CREDITS
The idea for this indicator came from Fabio Figueiredo (Vlad).
Cerca negli script per "accuracy"

Support and resistance levels (Day, Week, Month) + EMAs + SMAs(ENG): This Pine 5 script provides various tools for configuring and displaying different support and resistance levels, as well as moving averages (EMA and SMA) on charts. Using these tools is an essential strategy for determining entry and exit points in trades.
Support and Resistance Levels
Daily, weekly, and monthly support and resistance levels play a key role in analyzing price movements:
Daily levels: Represent prices where a cryptocurrency has tended to bounce within the current trading day.
Weekly levels: Reflect strong prices that hold throughout the week.
Monthly levels: Indicate the most significant levels that can influence price movement over the month.
When trading cryptocurrencies, traders use these levels to make decisions about entering or exiting positions. For example, if a cryptocurrency approaches a weekly resistance level and fails to break through it, this may signal a sell opportunity. If the price reaches a daily support level and starts to bounce up, it may indicate a potential long position.
Market context and trading volumes are also important when analyzing support and resistance levels. High volume near a level can confirm its significance and the likelihood of subsequent price movement. Traders often combine analysis across different time frames to get a more complete picture and improve the accuracy of their trading decisions.
Moving Averages
Moving averages (EMA and SMA) are another important tool in the technical analysis of cryptocurrencies:
EMA (Exponential Moving Average): Gives more weight to recent prices, allowing it to respond more quickly to price changes.
SMA (Simple Moving Average): Equally considers all prices over a given period.
Key types of moving averages used by traders:
EMA 50 and 200: Often used to identify trends. The crossing of the 50-day EMA with the 200-day EMA is called a "golden cross" (buy signal) or a "death cross" (sell signal).
SMA 50, 100, 150, and 200: These periods are often used to determine long-term trends and support/resistance levels. Similar to the EMA, the crossings of these averages can signal potential trend changes.
Settings Groups:
EMA Golden Cross & Death Cross: A setting to display the "golden cross" and "death cross" for the EMA.
EMA 50 & 200: A setting to display the 50-day and 200-day EMA.
Support and Resistance Levels: Includes settings for daily, weekly, and monthly levels.
SMA 50, 100, 150, 200: A setting to display the 50, 100, 150, and 200-day SMA.
SMA Golden Cross & Death Cross: A setting to display the "golden cross" and "death cross" for the SMA.
Components:
Enable/disable the display of support and resistance levels.
Show level labels.
Parameters for adjusting offset, display of EMA and SMA, and their time intervals.
Parameters for configuring EMA and SMA Golden Cross & Death Cross.
EMA Parameters:
Enable/disable the display of 50 and 200-day EMA.
Color and style settings for EMA.
Options to use bar gaps and the "LookAhead" function.
SMA Parameters:
Enable/disable the display of 50, 100, 150, and 200-day SMA.
Color and style settings for SMA.
Options to use bar gaps and the "LookAhead" function.
Effective use of support and resistance levels, as well as moving averages, requires an understanding of technical analysis, discipline, and the ability to adapt the strategy according to changing market conditions.
(RUS) Данный Pine 5 скрипт предоставляет разнообразные инструменты для настройки и отображения различных уровней поддержки и сопротивления, а также скользящих средних (EMA и SMA) на графиках. Использование этих инструментов является важной стратегией для определения точек входа и выхода из сделок.
Уровни поддержки и сопротивления
Дневные, недельные и месячные уровни поддержки и сопротивления играют ключевую роль в анализе движения цен:
Дневные уровни: Представляют собой цены, на которых криптовалюта имела тенденцию отскакивать в течение текущего торгового дня.
Недельные уровни: Отражают сильные цены, которые сохраняются в течение недели.
Месячные уровни: Указывают на наиболее значимые уровни, которые могут влиять на движение цены в течение месяца.
При торговле криптовалютами трейдеры используют эти уровни для принятия решений о входе в позицию или закрытии сделки. Например, если криптовалюта приближается к недельному уровню сопротивления и не удается его преодолеть, это может стать сигналом для продажи. Если цена достигает дневного уровня поддержки и начинает отскакивать вверх, это может указывать на возможность открытия длинной позиции.
Контекст рынка и объемы торговли также важны при анализе уровней поддержки и сопротивления. Высокий объем при приближении к уровню может подтвердить его значимость и вероятность последующего движения цены. Трейдеры часто комбинируют анализ различных временных рамок для получения более полной картины и улучшения точности своих торговых решений.
Скользящие средние
Скользящие средние (EMA и SMA) являются еще одним важным инструментом в техническом анализе криптовалют:
EMA (Exponential Moving Average): Экспоненциальная скользящая средняя, которая придает большее значение последним ценам. Это позволяет более быстро реагировать на изменения в ценах.
SMA (Simple Moving Average): Простая скользящая средняя, которая равномерно учитывает все цены в заданном периоде.
Основные виды скользящих средних, которые используются трейдерами:
EMA 50 и 200: Часто используются для выявления трендов. Пересечение 50-дневной EMA с 200-дневной EMA называется "золотым крестом" (сигнал на покупку) или "крестом смерти" (сигнал на продажу).
SMA 50, 100, 150 и 200: Эти периоды часто используются для определения долгосрочных трендов и уровней поддержки/сопротивления. Аналогично EMA, пересечения этих средних могут сигнализировать о возможных изменениях тренда.
Группы настроек:
EMA Golden Cross & Death Cross: Настройка для отображения "золотого креста" и "креста смерти" для EMA.
EMA 50 & 200: Настройка для отображения 50-дневной и 200-дневной EMA.
Уровни поддержки и сопротивления: Включает настройки для дневных, недельных и месячных уровней.
SMA 50, 100, 150, 200: Настройка для отображения 50, 100, 150 и 200-дневных SMA.
SMA Golden Cross & Death Cross: Настройка для отображения "золотого креста" и "креста смерти" для SMA.
Компоненты:
Включение/отключение отображения уровней поддержки и сопротивления.
Показ ярлыков уровней.
Параметры для настройки смещения, отображения EMA и SMA, а также их временных интервалов.
Параметры для настройки EMA и SMA Golden Cross & Death Cross.
Параметры EMA:
Включение/отключение отображения 50 и 200-дневных EMA.
Настройки цвета и стиля для EMA.
Опции для использования разрыва баров и функции "LookAhead".
Параметры SMA:
Включение/отключение отображения 50, 100, 150 и 200-дневных SMA.
Настройки цвета и стиля для SMA.
Опции для использования разрыва баров и функции "LookAhead".
Эффективное использование уровней поддержки и сопротивления, а также скользящих средних, требует понимания технического анализа, дисциплины и умения адаптировать стратегию в зависимости от изменяющихся условий рынка.

Uptrick: Bullish/Bearish Signal DetectorDetailed Explanation of the "Uptrick: Bullish/Bearish Signal Detector" Script
The "Uptrick: Bullish/Bearish Signal Detector" script is a sophisticated tool designed for the TradingView platform, leveraging Pine Script version 5. This script is crafted to enhance traders' ability to identify bullish (buy) and bearish (sell) signals directly on their trading charts. By combining the power of the MACD (Moving Average Convergence Divergence) and RSI (Relative Strength Index) indicators, this script provides a unique and efficient method for detecting potential trading opportunities. Below is an in-depth exploration of its purpose, features, and functionality.
Purpose
The primary purpose of this script is to assist traders in identifying potential entry and exit points in the market by signaling bullish and bearish conditions. This automated detection helps traders make more informed decisions without the need to manually analyze complex indicators. By overlaying signals directly on the price chart, the script allows for quick visual identification of market trends and reversals.
Uniqueness
What sets this script apart is its dual use of MACD and RSI indicators. While many trading strategies might rely on a single indicator, combining MACD and RSI enhances the reliability of the signals by filtering out false positives. The script not only identifies trends but also adds a layer of confirmation through the RSI, which measures the speed and change of price movements.
Inputs and Features
Customizable Label Appearance:
The script allows users to customize the appearance of the labels that indicate bullish and bearish signals. Users can set their preferred colors for the labels and the text, ensuring that the signals are easily distinguishable and aesthetically pleasing on their charts.
MACD Calculation:
The script calculates the MACD line and signal line using user-defined input values for the fast length, slow length, and signal length. The MACD histogram, which is the difference between the MACD line and the signal line, is used to determine the momentum of the market.
RSI Calculation:
The RSI is calculated using a user-defined input length. The RSI helps in identifying overbought or oversold conditions, which are crucial for confirming the strength of the trend detected by the MACD.
Bullish and Bearish Conditions:
The script defines bullish conditions as those where the MACD histogram is positive and the RSI is above 50. Bearish conditions are defined where the MACD histogram is negative and the RSI is below 50. This combination of conditions ensures that signals are generated based on both momentum and relative strength, reducing the likelihood of false signals.
Label Plotting:
The script plots labels on the chart to indicate bullish and bearish signals. When a bullish condition is met, and the previous signal was not bullish, a "LONG" label is plotted. Similarly, when a bearish condition is met, and the previous signal was not bearish, a "SHORT" label is plotted. This feature helps in clearly marking the points of interest for traders, making it easier to spot potential trades.
Tracking Previous Signals:
To avoid repetitive signals, the script keeps track of the last signal. If the last signal was bullish, it avoids plotting another bullish signal immediately. The same logic applies to bearish signals. This tracking ensures that signals are spaced out and only significant changes in market conditions are highlighted.
How It Works
The script operates in a loop, processing each bar (or candlestick) on the chart as new data comes in. It calculates the MACD and RSI values for each bar and checks if the current conditions meet the criteria for a bullish or bearish signal. If a signal is detected and it is different from the last signal, a label is plotted on the chart at the current bar's price level. This real-time processing allows traders to see the signals as they form, providing timely insights into market movements.
Practical Application
For practical use, a trader would add this script to their TradingView chart. They can customize the input parameters for the MACD and RSI calculations to fit their trading strategy or preferred settings. Once added, the script will automatically analyze the price data and start plotting "LONG" and "SHORT" labels based on the detected signals. Traders can then use these labels to make decisions on entering or exiting trades, adjusting their strategy as necessary based on the signals provided.
Conclusion
The "Uptrick: Bullish/Bearish Signal Detector" script is a powerful tool for any trader looking to leverage technical indicators for better trading decisions. By combining MACD and RSI, it offers a robust method for detecting market trends and potential reversals. The customizable features and real-time signal plotting make it a versatile and user-friendly addition to any trading toolkit. This script not only simplifies the process of technical analysis but also enhances the accuracy of trading signals, thereby potentially increasing the trader's success rate in the market.

BooBee Digital - Enhanced Buy & Sell Alerts Suite
BooBee Digital - Enhanced Buy & Sell Alerts Suite
Introduction:
The “BooBee Digital - Enhanced Buy & Sell Alerts Suite” is a comprehensive trading tool designed to provide traders with precise buy and sell signals by integrating the Average True Range (ATR) trailing stop technique and the Volume Weighted Average Price (VWAP) indicator. This script is tailored to help traders make informed decisions by considering both market volatility and trading volume.
How It Works:
1. ATR Calculation:
• Purpose: Measures market volatility to set dynamic stop levels.
• Details: The Average True Range (ATR) is calculated over a user-defined period. The ATR value reflects the average range of price movements over the specified period, which is crucial for assessing market volatility.
2. ATR Trailing Stop:
• Purpose: Identifies potential trend reversals by setting trailing stops based on market volatility.
• Details: The ATR trailing stop is dynamically adjusted using the ATR value and a user-defined sensitivity factor. This trailing stop level helps identify trend reversals by moving in accordance with price fluctuations.
3. VWAP Calculation:
• Purpose: Provides a volume-weighted average price to benchmark fair value.
• Details: The VWAP is calculated by taking the sum of the product of price and volume, divided by the total volume. This indicator gives traders a reference point for the average price at which the asset has traded throughout the day, considering trading volume.
4. EMA Crossover:
• Purpose: Adds a confirmation layer for buy and sell signals.
• Details: A 1-period Exponential Moving Average (EMA) is used to identify short-term price movements. Buy and sell signals are generated based on the crossover of the EMA and the ATR trailing stop, adding an extra layer of confirmation for trade entries and exits.
Signal Generation:
Buy Signal:
• Generated when the price is above the ATR trailing stop and there is a bullish crossover of the EMA and ATR trailing stop.
• Indicator: Green label below the bar with “Buy” text.
Sell Signal:
• Generated when the price is below the ATR trailing stop and there is a bearish crossover of the EMA and ATR trailing stop.
• Indicator: Red label above the bar with “Sell” text.
VWAP Line:
• The VWAP line is plotted on the chart to help traders identify significant price levels based on trading volume.
• Indicator: Blue line representing the VWAP.
How to Use:
• Chart Type: The script is designed for use on standard chart types such as Candlestick and OHLC. It does not support non-standard chart types like Heikin Ashi, Renko, Kagi, Point & Figure, and Range, as they may produce unrealistic results.
• Clean Chart: Ensure your chart is clean and free of other indicators to avoid confusion. The signals and colors plotted by the script should be easily identifiable.
• Trade Confirmation: Use the buy and sell signals generated by the script in conjunction with other analysis methods to confirm trades.
Key Concepts:
• ATR Trailing Stop: This technique sets dynamic stop levels based on market volatility, helping to identify trend reversals.
• VWAP: This indicator provides a benchmark for the average price considering trading volume, helping traders identify fair value.
• EMA Crossover: This adds a layer of confirmation for buy and sell signals, improving the accuracy of trade entries and exits.

TechniTrend RSI (11TF)Multi-Timeframe RSI Indicator
Overview
The Multi-Timeframe RSI Indicator is a sophisticated tool designed to provide comprehensive insights into the Relative Strength Index (RSI) across 11 different timeframes simultaneously. This indicator is essential for traders who wish to monitor RSI trends and their moving averages (MA) to make informed trading decisions.
Features
Multiple Timeframes: Displays RSI and RSI MA values for 11 different timeframes, allowing traders to have a holistic view of the market conditions.
RSI vs. MA Comparison: Indicates whether the RSI value is above or below its moving average for each timeframe, helping traders to identify bullish or bearish momentum.
Overbought/Oversold Signals:
Marks "OS" (OverSell) when RSI falls below 25, indicating a potential oversold condition.
Marks "OB" (OverBuy) when RSI exceeds 75, signaling a potential overbought condition.
Real-Time Updates: Continuously updates in real-time to provide the most current market information.
Usage
This indicator is invaluable for traders who utilize RSI as part of their technical analysis strategy. By monitoring multiple timeframes, traders can:
Identify key overbought and oversold levels to make entry and exit decisions.
Observe the momentum shifts indicated by RSI crossing above or below its moving average.
Enhance their trading strategy by integrating multi-timeframe analysis for better accuracy and confirmation.
How to Interpret the Indicator
RSI Above MA: Indicates a potential bullish trend. Traders may consider looking for long positions.
RSI Below MA: Suggests a potential bearish trend. Traders may look for short positions.
OS (OverSell): When RSI < 25, the market may be oversold, presenting potential buying opportunities.
OB (OverBuy): When RSI > 75, the market may be overbought, indicating potential selling opportunities.

All Divergences with trend / SL - Uncle SamThanks to the main inspiration behind this strategy and the hard work of:
"Divergence for many indicators v4 by LonesomeTheBlue"
The "All Divergence" strategy is a versatile approach for identifying and acting upon various divergences in the market. Divergences occur when price and an indicator move in opposite directions, often signaling potential reversals. This strategy incorporates both regular and hidden divergences across multiple indicators (MACD, Stochastics, CCI, etc.) for a comprehensive analysis.
Key Features:
Comprehensive Divergence Analysis: The strategy scans for regular and hidden divergences across a variety of indicators, increasing the probability of identifying potential trade setups.
Trend Filter: To enhance accuracy, a moving average (MA) trend filter is integrated. This ensures trades align with the overall market trend, reducing the risk of false signals.
Customizable Risk Management: Users can adjust parameters for long/short stop-loss and take-profit levels to match their individual risk tolerance.
Additional Risk Management (Optional): An experimental MA-based risk management feature can be enabled to close positions if the market shows consecutive closes against the trend.
Clear Visuals: The script plots pivot points, divergence lines, and stop-loss levels on the chart for easy reference.
Strategy Settings (Defaults):
Enable Long/Short Strategy: True
Long/Short Stop Loss %: 2%
Long/Short Take Profit %: 5%
Enable MA Trend: True
MA Type: HMA (Hull Moving Average)
MA Length: 500
Use MA Risk Management: False (Experimental)
MA Risk Exit Candles: 2 (If enabled)
Pivot Period: 9
Source for Pivot Points: Close
Backtest Details (Example):
The strategy has been backtested on XAUUSD 1H (Goold/USD 1 hour timeframe) with a starting capital of $1,000. The backtest period covers around 2 years. A commission of 0.02% per trade and a 0.1% slippage per trade were factored in to simulate real-world trading costs.
Disclaimer:
This strategy is for educational and informational purposes only. Backtested results are not indicative of future performance. Use this strategy at your own risk. Always conduct your own analysis and consider consulting a financial professional before making any trading decisions.
Important Notes:
The default settings are a good starting point, but feel free to experiment to find optimal parameters for your specific trading style and market.
The MA-based risk management is an experimental feature. Use it with caution and thoroughly test it before deploying in live trading.
Backtest results can vary depending on the market, timeframe, and specific settings used. Always consider slippage and commission fees when evaluating a strategy's potential profitability.

Filtered MACD with Backtest [UAlgo]The "Filtered MACD with Backtest " indicator is an advanced trading tool designed for the TradingView platform. It combines the Moving Average Convergence Divergence (MACD) with additional filters such as Moving Average (MA) and Average Directional Index (ADX) to enhance trading signals. This indicator aims to provide more reliable entry and exit points by filtering out noise and confirming trends. Additionally, it includes a comprehensive backtesting module to simulate trading strategies and assess their performance based on historical data. The visual backtest module allows traders to see potential trades directly on the chart, making it easier to evaluate the effectiveness of the strategy.
🔶 Customizable Parameters :
Price Source Selection: Users can choose their preferred price source for calculations, providing flexibility in analysis.
Filter Parameters:
MA Filter: Option to use a Moving Average filter with types such as EMA, SMA, WMA, RMA, and VWMA, and a customizable length.
ADX Filter: Option to use an ADX filter with adjustable length and threshold to determine trend strength.
MACD Parameters: Customizable fast length, slow length, and signal smoothing for the MACD indicator.
Backtest Module:
Entry Type: Supports "Buy and Sell", "Buy", and "Sell" strategies.
Stop Loss Types: Choose from ATR-based, fixed point, or X bar high/low stop loss methods.
Reward to Risk Ratio: Set the desired take profit level relative to the stop loss.
Backtest Visuals: Display entry, stop loss, and take profit levels directly on the chart with
colored backgrounds.
Alerts: Configurable alerts for buy and sell signals.
🔶 Filtered MACD : Understanding How Filters Work with ADX and MA
ADX Filter:
The Average Directional Index (ADX) measures the strength of a trend. The script calculates ADX using the user-defined length and applies a threshold value.
Trading Signals with ADX Filter:
Buy Signal: A regular MACD buy signal (crossover of MACD line above the signal line) is only considered valid if the ADX is above the set threshold. This suggests a stronger uptrend to potentially capitalize on.
Sell Signal: Conversely, a regular MACD sell signal (crossunder of MACD line below the signal line) is only considered valid if the ADX is above the threshold, indicating a stronger downtrend for potential shorting opportunities.
Benefits: The ADX filter helps avoid whipsaws or false signals that might occur during choppy market conditions with weak trends.
MA Filter:
You can choose from various Moving Average (MA) types (EMA, SMA, WMA, RMA, VWMA) for the filter. The script calculates the chosen MA based on the user-defined length.
Trading Signals with MA Filter:
Buy Signal: A regular MACD buy signal is only considered valid if the closing price is above the MA value. This suggests a potential uptrend confirmed by the price action staying above the moving average.
Sell Signal: Conversely, a regular MACD sell signal is only considered valid if the closing price is below the MA value. This suggests a potential downtrend confirmed by the price action staying below the moving average.
Benefits: The MA filter helps identify potential trend continuation opportunities by ensuring the price aligns with the chosen moving average direction.
Combining Filters:
You can choose to use either the ADX filter, the MA filter, or both depending on your strategy preference. Using both filters adds an extra layer of confirmation for your signals.
🔶 Backtesting Module
The backtesting module in this script allows you to visually assess how the filtered MACD strategy would have performed on historical data. Here's a deeper dive into its features:
Backtesting Type: You can choose to backtest for buy signals only, sell signals only, or both. This allows you to analyze the strategy's effectiveness in different market conditions.
Stop-Loss Types: You can define how stop-loss orders are placed:
ATR (Average True Range): This uses a volatility measure (ATR) multiplied by a user-defined factor to set the stop-loss level.
Fixed Point: This allows you to specify a fixed dollar amount or percentage value as the stop-loss.
X bar High/Low: This sets the stop-loss at a certain number of bars (defined by the user) above/below the bar's high (for long positions) or low (for short positions).
Reward-to-Risk Ratio: Define the desired ratio between your potential profit and potential loss on each trade. The backtesting module will calculate take-profit levels based on this ratio and the stop-loss placement.
🔶 Disclaimer:
Use with Caution: This indicator is provided for educational and informational purposes only and should not be considered as financial advice. Users should exercise caution and perform their own analysis before making trading decisions based on the indicator's signals.
Not Financial Advice: The information provided by this indicator does not constitute financial advice, and the creator (UAlgo) shall not be held responsible for any trading losses incurred as a result of using this indicator.
Backtesting Recommended: Traders are encouraged to backtest the indicator thoroughly on historical data before using it in live trading to assess its performance and suitability for their trading strategies.
Risk Management: Trading involves inherent risks, and users should implement proper risk management strategies, including but not limited to stop-loss orders and position sizing, to mitigate potential losses.
No Guarantees: The accuracy and reliability of the indicator's signals cannot be guaranteed, as they are based on historical price data and past performance may not be indicative of future results.

Candle Range Detector [UAlgo]The "Candle Range Detector " is a Pine Script™ indicator designed to identify trading opportunities based on the concept of price consolidation and breakout. It analyzes the price range of a specified number of previous candles and detects when subsequent candles stay within that range (consolidation). The indicator then highlights potential breakouts above or below the range and provides calculated Take Profit (TP) and Stop Loss (SL) levels based on your chosen method (percentage or Average True Range - ATR).
🔶 Key Features
Configurable Range: Define the minimum number of candles required to establish a valid price range.
Breakout Detection: Identify potential breakouts above or below the established range based on your selection (close price or wick).
Take Profit & Stop Loss Levels: The indicator calculates TP and SL levels based on your chosen method (percentage or ATR) and user-defined multipliers. The calculated TP and SL levels are visualized as horizontal lines with corresponding labels ("Take Profit" and "Stop Loss").
Optional Count Display: You can choose to display the number of candles currently within the range.
🔶 Disclaimer:
Not Financial Advice: This indicator is intended for educational and informational purposes only. It does not constitute financial advice or recommendations to buy, sell, or hold any financial instruments.
Use at Own Risk: Trading involves substantial risk of loss and is not suitable for all investors. Users of this indicator should exercise caution and conduct their own research and analysis before making any trading decisions.
Performance Not Guaranteed: Past performance is not indicative of future results. While the indicator aims to assist traders in analyzing market trends, there is no guarantee of accuracy or success in trading operations.
🔷 Related Scripts
Range Finder

ATR/ADR Support and Resistance LevelsATR/ADR Support and Resistance Levels Indicator
This script is designed to provide traders with precise ATR (Average True Range) and ADR (Average Daily Range) support and resistance levels. It can be effectively used to identify price breakouts or rejections near these critical lines and assist in confirming trend retests.
How It Works:
Support and Resistance Lines: The script plots ATR/ADR-based support and resistance lines, which can be toggled on or off.
Daily Data Integration: It incorporates daily open and close prices to enhance the accuracy of the support and resistance levels.
Clear Visuals: The indicator uses distinct colors for support (green) and resistance (red) levels, providing clear visual cues.
Default Settings: The default settings are optimized for most trading environments. Adjusting the ATR/ADR Length can fine-tune the indicator's responsiveness to market movements.
Key Features:
ATR & ADR Calculation: Choose between using ATR, ADR, or both. ATR is recommended for most scenarios.
Customizable Lengths: Adjust the ATR/ADR Length to refine the average calculation to your preference, with 14 being the standard value.
EMA for Market Bias: The EMA helps determine the ticker bias. It is colored green when the market is above the average price and red when it is below. This allows you to more easily determine whether or not the ADR/ATR levels are valid.
Versatile Usage: Suitable for various trading types, ensuring broad applicability across different market conditions.
How to Use:
ATR vs ADR: You should use ADR if you are day trading AND do not want to include gap data in the levels. It is recommended you use ATR.
Bounces off Levels: When price bounces off of a support/resistance level, it is very likely that price will respect this level. This indicates that price is unlikely to move beyond the ticker's average volatility. You should wait for an additional bounce to confirm.
Breakthroughs of Levels: When price breaks through a support/resistance level, it is very likely that price will continue beyond this level. This indicates that price has moved beyond that ticker's average volatility. You should wait for a bounce off the level to confirm.
This indicator is a valuable tool for traders seeking to enhance their technical analysis with support and resistance levels based on ATR and ADR calculations. It is perfect for identifying key price points and understanding market trends.

Flush Percent RangeFans of Woodies CCI may recognize the approach to this one. This is my attempt at using the same methods but for taking the highs and lows into account without the standard deviation of the CCI. The smoothness of other oscillators may not be ideal however the Williams Percent Range is a fast stochastic that also operates within a channel. This provides an alternative yet still complex view for the virtuoso. A unique feature is total utilization of the weighted moving average, from the standard to the more complex. A fun fact is the Hull Moving Average is actually calculated using weighted moving averages.
How to use:
The base length is for accuracy, the fast length is for catching all the moves(even the wrong ones sometimes.)
The bars back option will not flip the histogram/base trend to its bullish/bearish alternative until the base plot remains on the latter half of the oscillator for a certain number of bars. This can be set to zero if desired.
The factor controls the chop on the various levels. A higher number will increase it.
The oscillator levels are measuring slope, price relative to the average, and a summation of percent changes between the two. Both the baseline/histogram and the levels have color coding for bullishness, bearishness, and indecision(depending on the factor.) The fast line matches the indecision color by default. This is all customizable.
There are many potential ways to trade with this indicator. From hooks back toward the trend and range line crossovers to divergence and reversals. It's important to note the current performance of the oscillator levels. Time cycles may come in handy along with other forecasting tools.
Lastly, there are optional linear regression lines plotted on the chart. They're synchronized to the lengths in the oscillator. This is an additional visual aid to provide context to the direction of the channel.
Overall the Flush Percent Range is for analyzing multiple regression models within a single price channel. No smoothing, fast averages, and specified timeframes of highs/lows. Credit to Larry Williams for the original calculation and Ken Woods for design/methodology inspiration.

CE_ZLSMA_5MIN_CANDLECHART-- Overview
The "CE_ZLSMA_5MIN_CANDLECHART" strategy, developed by DailyPanda, is a comprehensive trading strategy designed for analyzing trading on 5-minute candlestick charts.
It aims to use some indicators calculated from a Hekin Ashi chart, while running it on a normal candlestick chart, making sure that no price distortion affects the strategy results .
It also brings a feature to show, on the candlestick chart, where the entries would take place on the HA chart, to also be able to study the effect that the price distortion would make on your backtest.
-- Credit
The code in this script is based on open-source indicators originally written by veryfid and everget, I've made significant changes and additions to the scripts but all credit for the idea goes to them, I just built on top of it:
-- Key Features
It incorporate already built indicators (ZLSMA) and CandelierExit (CE)
-- Zero Lag Least Squares Moving Average (ZLSMA) - by veryfid
The ZLSMA is used to detect trends with minimal lag, improving the accuracy of entry and exit signals.
It incorporates a double-smoothed linear regression to minimize lag and enhance trend-following capabilities.
Buy signals are generated when the price closes above the ZLSMA together with the CE signal.
It is calculated based on the HA candlestick pattern.
-- Chandelier Exit (CE) - by everget
The Chandelier Exit indicator is used to dynamically manage stop-loss levels based on the Average True Range (ATR).
It ensures that stop-loss levels are adaptive to market volatility, protecting profits and limiting losses.
The ATR period and multiplier can be customized to fit different trading styles and risk tolerances.
It is calculated based on the HA candlestick pattern.
-- Heikin Ashi Candles
The strategy leverages Heikin Ashi candlesticks to be able identify trends more clearly and leverage this to stay on winning trades longer.
Traders can choose to display Heikin Ashi candlesticks and order fills on the chart for better visualization.
-- Risk Management
The strategy includes multiple risk management options to protect traders' capital.
Maximum intraday loss limit based on a percentage of equity.
Maximum stop-loss in points to filter out entries with excessive risk.
Daily profit target to stop trading once the goal is achieved.
Options to use fixed contract sizes or dynamically adjust based on a percentage of equity.
These features help traders manage risk and ensure sustainable trading practices.
Moving Averages
Several moving averages (EMA 9, EMA 20, EMA 50, EMA 72, EMA 200, SMA 200, and SMA 500) are plotted to provide additional context and trend confirmation.
A "Zone of Value" is highlighted between the EMA 200 and SMA 200 to identify potential support and resistance areas.
-- Customizable Inputs
The strategy includes various customizable inputs, allowing traders to tailor it to their specific needs.
Start and stop trading times.
Risk management parameters (e.g., maximum stop-loss, daily drawdown limit, and daily profit target).
Display options for Heikin Ashi candles and moving averages.
ZLSMA length and offset.
-- Usage
-- Setting Up the Strategy
Configure the start year for the strategy and the trading hours using the input fields. The first candle of each day will be filled black for easy identification, while candles that are outside the allowed time range will be filled purple.
Customize the risk management parameters to match your risk tolerance and trading style.
Enable or disable the display of Heikin Ashi candlesticks and moving averages as desired.
-- Interpreting Signals
Buy signals are indicated by a "Buy" label when the Heikin Ashi close price is above the ZLSMA and the Chandelier Exit indicates a long position.
The strategy will automatically enter a long position with a stop-loss level determined the swing low.
Positions are closed when the close price falls below the ZLSMA.
-- Risk Management
The strategy monitors the maximum intraday loss and stops trading if the loss limit is reached.
If enabled, also stops trading once the daily profit target is achieved, helping to lock in gains.
You have the option to filter operations based on a maximum accepted stop-loss level, based on your risk tolerance.
You can also operate with a fixed amount of contracts or dynamically adjust it based on your allowed risk per trade, ensuring optimal protection of capital.
-- Visual Aids
The strategy plots various moving averages to provide additional trend context.
The "Zone of Value" between the EMA 200 and SMA 200 highlights potential support and resistance areas.
Heikin Ashi candlesticks and order fills can be displayed to enhance the difference this strategy would take if you were to backtest it on a Heikin Ashi chart.
-- Table of results
This strategy also breaks down the results on a monthly basis for better understanding of your capital development along the way.
-- Conclusion
The "CE_ZLSMA_5MIN_CANDLECHART" strategy is a tool for intraday traders looking to understand and leaverage the Heikin Ashi chart while still using the normal candle chart. Traders can customize the strategy to fit their specific needs, making it a versatile addition to any trading toolkit.

MTF Regime Filter II [CHE]Regime Filter II - Comprehensive Guide
Introduction
The "Regime Filter II " indicator is a tool designed to help traders identify market trends by smoothing price data and applying a color scheme to visualize bullish and bearish conditions. This guide provides a detailed explanation of the script's functionality, benefits, and how to use it effectively in TradingView.
Key Benefits
1. Trend Identification: Smooths price data to highlight underlying trends, making it easier for traders to spot potential buying or selling opportunities.
2. Visual Clarity: Uses distinct color schemes to differentiate between bullish and bearish market conditions, enhancing visual analysis.
3. Customization: Offers various settings to adjust smoothing and averaging lengths, choose between different color schemes, and set visibility for different timeframes.
4. Neutral Candle Option: Provides an option to display neutral candles for clearer visual representation when market conditions are neither strongly bullish nor bearish.
5. Timeframe Adaptability: Includes functions to determine appropriate step sizes based on different timeframes, ensuring the indicator remains accurate across various trading periods.
Script Breakdown
1. Indicator Declaration
The script starts by declaring itself as a TradingView indicator using the latest version of Pine Script. This sets up the framework for the indicator's functionality.
2. User Inputs for Smoothing and Averaging Lengths
The script allows users to input specific lengths for smoothing and averaging intervals. These inputs are crucial for determining how the price data is processed to identify trends. By adjusting these lengths, users can fine-tune the sensitivity of the indicator to market movements.
3. Color Scheme Selection
Users can choose between two color schemes: "Traditional" and "WT1 0 Rule". The selected color scheme will determine how the indicator colors the candles to represent bullish and bearish conditions. This customization enhances the visual appeal and usability of the indicator according to personal preferences.
4. Settings for Timeframe Visibility
The script includes settings that allow users to specify which timeframes the indicator should be visible on. This feature helps traders focus on the most relevant timeframes for their trading strategies. Additionally, users can set the number of recent candles to display, providing a clear view of the most recent market trends.
5. Color Definitions
The indicator defines specific colors for bearish and bullish candles. Bearish candles are colored red, while bullish candles are green. These color definitions are applied based on the selected color scheme and the calculated trend, providing a quick visual reference for market conditions.
6. Time Constants
To manage different timeframes effectively, the script uses constants that represent various time intervals in milliseconds, such as minutes, hours, and days. These constants are used to convert timeframes into a format that the script can work with to determine the appropriate step size for calculations.
7. Step Size Determination
The script includes a function that determines the step size based on the selected timeframe. This function ensures that the indicator adapts to different timeframes, maintaining its accuracy and relevance across various trading periods. The step size is calculated based on time intervals, and appropriate labels (like "60", "240", "1D") are assigned.
- For timeframes less than or equal to 1 minute, the step size is set to "60".
- For timeframes less than or equal to 5 minutes, the step size is set to "240".
- For timeframes less than or equal to 1 hour, the step size is set to "1D" (daily).
- For timeframes less than or equal to 4 hours, the step size is set to "3D" (three days).
- For timeframes less than or equal to 12 hours, the step size is set to "7D" (weekly).
- For timeframes less than or equal to 1 day, the step size is set to "1M" (monthly).
- For timeframes less than or equal to 1 week, the step size is set to "3M" (three months).
- For all other timeframes, the step size is set to "12M" (yearly).
8. Trend Calculation
The core of the indicator is its ability to calculate market trends. Here's a detailed breakdown of how the `calculateTrend` function works:
- Initialization: Variables for the middle price and scale, and summations of high/low prices and ranges, are initialized.
- Summation Loop: A loop runs over the smoothing length to calculate the sum of high and low prices and their range.
- Middle and Scale Calculation: The middle price is determined as the average of high/low sums, and the scale is calculated as a fraction of the average range.
- Normalization: The high, low, and close prices are normalized based on the middle price and scale.
- HT Calculation: The normalized prices are smoothed using a simple moving average (SMA).
- Frequency and Exponential Calculations: The frequency and related constants (a, c1, c2, c3) are calculated for further smoothing.
- Smoothed Moving Average (SMA): A smoothed moving average is computed using the HT values and exponential constants.
- WT1 and WT2 Calculation: The final smoothed values (WT1) and their average (WT2) are derived.
9. Color Application Based on Trend
Once the trend is calculated, the script applies the appropriate color to the candles based on the selected color scheme. This function ensures that the visual representation of the trend is consistent with the user’s preferences.
10. Label Plotting for Timeframes
If the option to display timeframe labels is enabled, the script plots labels on the chart to indicate the current timeframe. This feature helps users quickly identify which timeframe they are analyzing.
11. Shape Plotting Based on Trend and Color Scheme
The indicator plots shapes (squares) on the chart based on the calculated trend and selected color scheme. These shapes provide an additional visual cue for market conditions, enhancing the overall clarity of the indicator.
12. Neutral Candle Color Option
The script includes an option to set the color of neutral candles when market conditions are neither strongly bullish nor bearish. This option helps traders better visualize periods of market indecision.
Summary
The "Regime Filter II " is a powerful and customizable tool for traders, offering clear visual cues for market trends and adaptability to various timeframes. By smoothing price data and applying intuitive color schemes, it helps traders make more informed decisions. With features like adjustable smoothing lengths, multiple color schemes, and optional neutral candle displays, this indicator enhances market analysis and trading strategy development. By following this comprehensive guide, traders can effectively utilize the "Regime Filter II " indicator to enhance their market analysis and make more informed trading decisions.
Best regards

ICT KillZones + Pivot Points [TradingFinder] Support/Resistance 🟣 Introduction
Pivot Points are critical levels on a price chart where trading activity is notably high. These points are derived from the prior day's price data and serve as key reference markers for traders' decision-making processes.
Types of Pivot Points :
Floor
Woodie
Camarilla
Fibonacci
🔵 Floor Pivot Points
Widely utilized in technical analysis, floor pivot points are essential in identifying support and resistance levels. The central pivot point (PP) acts as the primary level, suggesting the trend's likely direction.
The additional resistance levels (R1, R2, R3) and support levels (S1, S2, S3) offer further insight into potential trend reversals or continuations.
🔵 Camarilla Pivot Points
Featuring eight distinct levels, Camarilla pivot points closely correspond with support and resistance, making them highly effective for setting stop-loss orders and profit targets.
🔵 Woodie Pivot Points
Similar to floor pivot points, Woodie pivot points differ by placing greater emphasis on the closing price, often resulting in different pivot levels compared to the floor method.
🔵 Fibonacci Pivot Points
Fibonacci pivot points combine the standard floor pivot points with Fibonacci retracement levels applied to the previous trading period's range. Common retracement levels used are 38.2%, 61.8%, and 100%.
🟣 Sessions
Financial markets are divided into specific time segments, known as sessions, each with unique characteristics and activity levels. These sessions are active at different times throughout the day.
The primary sessions in financial markets include :
Asian Session
European Session
New York Session
The timing of these major sessions in UTC is as follows :
Asian Session: 23:00 to 06:00
European Session: 07:00 to 14:25
New York Session: 14:30 to 22:55
🟣 Kill Zones
Kill zones are periods within a session marked by heightened trading activity. During these times, trading volume surges and price movements become more pronounced.
The timing of the major kill zones in UTC is :
Asian Kill Zone: 23:00 to 03:55
European Kill Zone: 07:00 to 09:55
New York Kill Zone: 14:30 to 16:55
Combining kill zones and pivot points in financial market analysis provides several advantages :
Enhanced Market Sentiment Analysis : Aligns key price levels with high-activity periods for a clearer market sentiment.
Improved Timing for Trade Entries and Exits : Helps better time trades based on when price movements are most likely.
Higher Probability of Successful Trades : Increases the accuracy of predicting market movements and placing profitable trades.
Strategic Stop-Loss and Profit Target Placement : Allows for precise risk management by strategically setting stop-loss and profit targets.
Versatility Across Different Time Frames : Effective in both short and long time frames, suitable for various trading strategies.
Enhanced Trend Identification and Confirmation : Confirms trends using both pivot levels and high-activity periods, ensuring stronger trend validation.
In essence, this integrated approach enhances decision-making, optimizes trading performance, and improves risk management.
🟣 How to Use
🔵 Two Approaches to Trading Pivot Points
There are two main strategies for trading pivot points: utilizing "pivot point breakouts" and "price reversals."
🔵 Pivot Point Breakout
When the price breaks through pivot lines, it signals a shift in market sentiment to the trader. In the case of an upward breakout, where the price crosses these pivot lines, a trader might enter a long position, placing their stop-loss just below the pivot point (P).
Conversely, if the price breaks downward, a short position can be initiated below the pivot point. When using the pivot point breakout strategy, the first and second support levels can serve as profit targets in an upward trend. In a downward trend, these roles are filled by the first and second resistance levels.
🔵 Price Reversal
An alternative method involves waiting for the price to reverse at the support and resistance levels. To implement this strategy, traders should take positions opposite to the prevailing trend as the price rebounds from the pivot point.
While this tool is commonly used in higher time frames, it tends to produce better results in shorter time frames, such as 1-hour, 30-minute, and 15-minute intervals.
Three Strategies for Trading the Kill Zone
There are three principal strategies for trading within the kill zone :
Kill Zone Hunt
Breakout and Pullback to Kill Zone
Trading in the Trend of the Kill Zone
🔵 Kill Zone Hunt
This strategy involves waiting until the kill zone concludes and its high and low lines are established. If the price reaches one of these lines within the same session and is strongly rejected, a trade can be executed.
🔵 Breakout and Pullback to Kill Zone
In this approach, once the kill zone ends and its high and low lines stabilize, a trade can be made if the price breaks one of these lines decisively within the same session and then pulls back to that level.
🔵 Trading in the Trend of the Kill Zone
Kill zones are characterized by high trading volumes and strong trends. Therefore, trades can be placed in the direction of the prevailing trend. For instance, if an upward trend dominates this area, a buy trade can be entered when the price reaches a demand order block.

Gold Option Signals with EMA and RSIIndicators:
Exponential Moving Averages (EMAs): Faster to respond to recent price changes compared to simple moving averages.
RSI: Measures the magnitude of recent price changes to evaluate overbought or oversold conditions.
Signal Generation:
Buy Call Signal: Generated when the short EMA crosses above the long EMA and the RSI is not overbought (below 70).
Buy Put Signal: Generated when the short EMA crosses below the long EMA and the RSI is not oversold (above 30).
Plotting:
EMAs: Plotted on the chart to visualize trend directions.
Signals: Plotted as shapes on the chart where conditions are met.
RSI Background Color: Changes to red for overbought and green for oversold conditions.
Steps to Use:
Add the Script to TradingView:
Open TradingView, go to the Pine Script editor, paste the script, save it, and add it to your chart.
Interpret the Signals:
Buy Call Signal: Look for green labels below the price bars.
Buy Put Signal: Look for red labels above the price bars.
Customize Parameters:
Adjust the input parameters (e.g., lengths of EMAs, RSI levels) to better fit your trading strategy and market conditions.
Testing and Validation
To ensure that the script works as expected, you can test it on historical data and validate the signals against known price movements. Adjust the parameters if necessary to improve the accuracy of the signals.

KNN OscillatorOverview
The KNN Oscillator is an advanced technical analysis tool designed to help traders identify potential trend reversals and market momentum. Using the K-Nearest Neighbors (KNN) algorithm, this oscillator normalizes KNN values to create a dynamic and responsive indicator. The oscillator line changes color to reflect the market sentiment, providing clear visual cues for trading decisions.
Key Features
Dynamic Color Oscillator: The line changes color based on the oscillator value – green for positive, red for negative, and grey for neutral.
Advanced KNN Algorithm: Utilizes the K-Nearest Neighbors algorithm for precise trend detection.
Normalized Values: Ensures the oscillator values are normalized to align with the stock price range, making it applicable to various assets.
Easy Integration: Can be easily added to any TradingView chart for enhanced analysis.
How It Works
The KNN Oscillator leverages the K-Nearest Neighbors algorithm to calculate the average distance of the nearest neighbors over a specified period. These values are then normalized to match the stock price range, ensuring they are comparable across different assets. The oscillator value is derived by taking the difference between the normalized KNN values and the source price. The line's color changes dynamically to provide an immediate visual indication of the market's state:
Green: Positive values indicate upward momentum.
Red: Negative values indicate downward momentum.
Grey: Neutral values indicate a stable or consolidating market.
Usage Instructions
Trend Reversal Detection: Use the color changes to identify potential trend reversals. A shift from red to green suggests a bullish reversal, while a shift from green to red indicates a bearish reversal.
Momentum Analysis: The oscillator's value and color help gauge market momentum. Strong positive values (green) indicate strong upward momentum, while strong negative values (red) indicate strong downward momentum.
Market Sentiment: The dynamic color changes provide an easy-to-understand visual representation of market sentiment, helping traders make informed decisions quickly.
Confirmation Tool: Use the KNN Oscillator in conjunction with other technical indicators to confirm signals and improve the accuracy of your trades.
Scalability: Applicable to various timeframes and asset classes, making it a versatile tool for all types of traders.

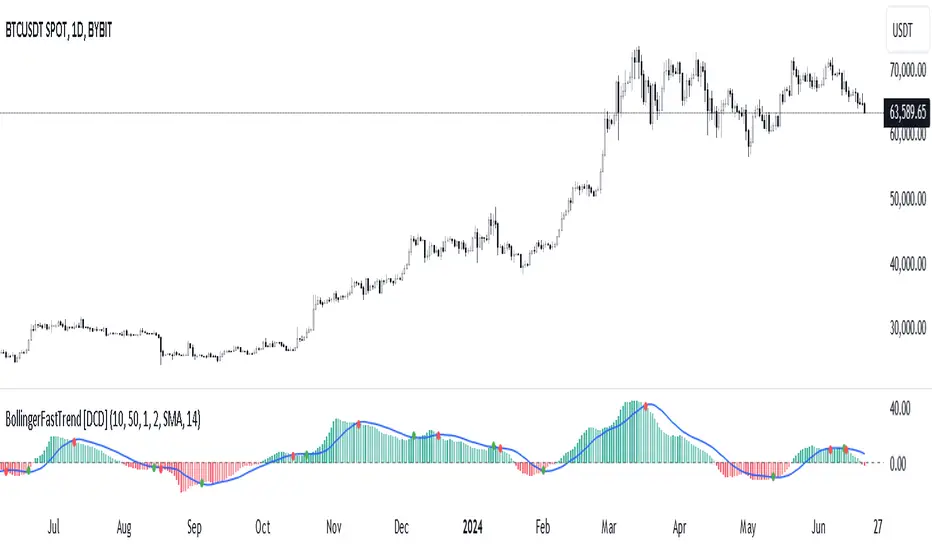
Bollinger Bands Fast Trend Indicator [DCD]Description:
The Bollinger Bands Fast Trend Detector indicator is an advanced tool designed to provide traders with more precise trend detection and clearer entry and exit signals. This script builds upon the traditional Bollinger Bands indicator by adding customizable standard deviations and incorporating multiple moving averages to enhance the accuracy of the signals.
Main Features:
1. **Customizable Bollinger Bands**:
- Each Bollinger Band has its own standard deviation setting, allowing for more granular control and better trend detection.
- The short Bollinger Band is set to a 10-period SMA for faster trend recognition.
2. **Multiple Moving Averages**:
- The indicator includes several types of moving averages (SMA, EMA, LSMA, HMA, WMA) applied to the Bollinger Trend value, giving traders flexibility to choose the best fit for their strategy.
3. **Crossover and Crossdown Detection**:
- The script identifies crossover and crossdown points between the Bollinger Trend value and the selected moving average, marking potential buy and sell signals with green and red circles, respectively.
4. **Color-Coded Histogram**:
- The histogram bars are color-coded to indicate the strength and direction of the trend, making it easy to visualize market conditions at a glance.
Instructions:
1. **Adding the Script to Your Chart**:
- Open your TradingView chart and add the Bollinger Bands Fast Trend Detector indicator.
2. **Adjusting Parameters**:
- Customize the Bollinger Bands and moving average settings according to your trading preferences:
- `Short BB Length` (default: 10): Adjusts the length of the short Bollinger Band.
- `Long BB Length` (default: 50): Adjusts the length of the long Bollinger Band.
- `StdDev` (for both bands): Sets the standard deviation multiplier.
- `Moving Average Type`: Choose between SMA, EMA, LSMA, HMA, and WMA.
- `Moving Average Length` (default: 14): Sets the length of the moving average.
3. **Interpreting the Output**:
- Observe the BBTrend and moving average plots on your chart.
- Look for green circles indicating crossover points (potential buy signals) and red circles indicating crossdown points (potential sell signals).
- Use the color-coded histogram bars to assess the strength and direction of the trend.
Configurable Parameters:
- `shortLengthInput` (default: 10): Length of the short Bollinger Band.
- `longLengthInput` (default: 50): Length of the long Bollinger Band.
- `shortDevMultInput` (default: 1.0): Standard deviation multiplier for the short Bollinger Band.
- `longDevMultInput` (default: 2.0): Standard deviation multiplier for the long Bollinger Band.
- `maTypeInput` (default: SMA): Type of moving average (options: SMA, EMA, LSMA, HMA, WMA).
- `maLengthInput` (default: 14): Length of the moving average.
Code Explanation:
The script calculates two sets of Bollinger Bands with distinct lengths and standard deviations. The difference between the lower bands and upper bands is normalized by the short middle band to compute the BBTrend value. A selected moving average is then applied to this BBTrend value. The script plots the BBTrend, the moving average, and uses color-coded histogram bars to represent trend strength and direction. It also identifies and marks crossover and crossdown points to provide potential trading signals.
Disclaimer:
This script is for educational purposes only and should not be considered financial advice. Always perform your own analysis before making any trading decisions.
JDT Support & Resistance LevelsJDT Support & Resistance Levels
This Pine Script indicator identifies and dynamically plots pivot-based support and resistance levels on your chart. Unlike traditional pivot point calculations, this script uses a user-defined lookback period to identify swing highs and lows, providing a more adaptable approach to identifying potential price reversal zones.
Originality
This script stands out due to its flexible approach to pivot identification. Instead of relying on fixed periods like daily, weekly, or monthly pivots, it allows users to customize the lookback period. This is particularly useful for traders who analyze different timeframes or markets, as the optimal lookback period may vary.
How it works
* Pivot Calculation: The script utilizes the ta.pivothigh and ta.pivotlow functions to identify swing highs and lows within the specified lookback period.
* Line Plotting: Horizontal lines are plotted at these pivot levels, extending to the right edge of the chart.
* Dynamic Updates: As new swing highs and lows form, the lines automatically update, ensuring the levels remain relevant to the current price action.
How to use it
* Add the script to your chart.
* Adjust the "Lookback Period" input parameter. A higher value will result in fewer but more significant levels, while a lower value will produce more frequent but potentially less reliable levels.
* Use the levels to identify potential support and resistance zones. Observe how price interacts with these levels. A break above a resistance level could signal a bullish move, while a break below a support level could indicate a bearish move.
Additional Considerations
* This script is most effective when used in conjunction with other technical analysis tools and indicators.
* The accuracy of the levels depends on the chosen lookback period and the specific market conditions.
* Always backtest your strategies before implementing them in live trading.
Let me know if you'd like any further clarification or have additional questions.

Strategic Multi-Step Supertrend - Strategy [presentTrading]The code is mainly developed for me to stimulate the multi-step taking profit function for strategies. The result shows the drawdown can be reduced but at the same time reduced the profit as well. It can be a heuristic for futures leverage traders.
█ Introduction and How it is Different
The "Strategic Multi-Step Supertrend" is a trading strategy designed to leverage the power of multiple steps to optimize trade entries and exits across the Supertrend indicator. Unlike traditional strategies that rely on single entry and exit points, this strategy employs a multi-step approach to take profit, allowing traders to lock in gains incrementally. Additionally, the strategy is adaptable to both long and short trades, providing a comprehensive solution for dynamic market conditions.
This template strategy lies in its dual Supertrend calculation, which enhances the accuracy of trend detection and provides more reliable signals for trade entries and exits. This approach minimizes false signals and increases the overall profitability of trades by ensuring that positions are entered and exited at optimal points.
BTC 6h L/S Performance
█ Strategy, How It Works: Detailed Explanation
The "Strategic Multi-Step Supertrend Trader" strategy utilizes two Supertrend indicators calculated with different parameters to determine the direction and strength of the market trend. This dual approach increases the robustness of the signals, reducing the likelihood of entering trades based on false signals. Here is a detailed breakdown of how the strategy operates:
🔶 Supertrend Indicator Calculation
The Supertrend indicator is a trend-following overlay on the price chart, typically used to identify the direction of the trend. It is calculated using the Average True Range (ATR) to ensure that the indicator adapts to market volatility. The formula for the Supertrend indicator is:
Upper Band = (High + Low) / 2 + (Factor * ATR)
Lower Band = (High + Low) / 2 - (Factor * ATR)
Where:
- High and Low are the highest and lowest prices of the period.
- Factor is a user-defined multiplier.
- ATR is the Average True Range over a specified period.
The Supertrend changes its direction based on the closing price in relation to these bands.
🔶 Entry-Exit Conditions
The strategy enters long positions when both Supertrend indicators signal an uptrend, and short positions when both indicate a downtrend. Specifically:
- Long Condition: Supertrend1 < 0 and Supertrend2 < 0
- Short Condition: Supertrend1 > 0 and Supertrend2 > 0
- Long Exit Condition: Supertrend1 > 0 and Supertrend2 > 0
- Short Exit Condition: Supertrend1 < 0 and Supertrend2 < 0
🔶 Multi-Step Take Profit Mechanism
The strategy features a multi-step take profit mechanism, which allows traders to lock in profits incrementally. This is achieved through four user-configurable take profit levels. For each level, the strategy specifies a percentage increase (for long trades) or decrease (for short trades) in the entry price at which a portion of the position is exited:
- Step 1: Exit a portion of the trade at Entry Price * (1 + Take Profit Percent1 / 100)
- Step 2: Exit a portion of the trade at Entry Price * (1 + Take Profit Percent2 / 100)
- Step 3: Exit a portion of the trade at Entry Price * (1 + Take Profit Percent3 / 100)
- Step 4: Exit a portion of the trade at Entry Price * (1 + Take Profit Percent4 / 100)
This staggered exit strategy helps in locking profits at multiple levels, thereby reducing risk and increasing the likelihood of capturing the maximum possible profit from a trend.
BTC Local
█ Trade Direction
The strategy is highly flexible, allowing users to specify the trade direction. There are three options available:
- Long Only: The strategy will only enter long trades.
- Short Only: The strategy will only enter short trades.
- Both: The strategy will enter both long and short trades based on the Supertrend signals.
This flexibility allows traders to adapt the strategy to various market conditions and their own trading preferences.
█ Usage
1. Add the strategy to your trading platform and apply it to the desired chart.
2. Configure the take profit settings under the "Take Profit Settings" group.
3. Set the trade direction under the "Trade Direction" group.
4. Adjust the Supertrend settings in the "Supertrend Settings" group to fine-tune the indicator calculations.
5. Monitor the chart for entry and exit signals as indicated by the strategy.
█ Default Settings
- Use Take Profit: True
- Take Profit Percentages: Step 1 - 6%, Step 2 - 12%, Step 3 - 18%, Step 4 - 50%
- Take Profit Amounts: Step 1 - 12%, Step 2 - 8%, Step 3 - 4%, Step 4 - 0%
- Number of Take Profit Steps: 3
- Trade Direction: Both
- Supertrend Settings: ATR Length 1 - 10, Factor 1 - 3.0, ATR Length 2 - 11, Factor 2 - 4.0
These settings provide a balanced starting point, which can be customized further based on individual trading preferences and market conditions.

Support and Resistance [CryptoSea]The Support and Resistance Indicator is a powerful tool developed by CryptoSea for traders seeking to identify key market levels with precision. This script leverages advanced pivot and volume analysis to highlight support and resistance zones on the price chart.
Key Features
Multi-Source Pivot Analysis: Choose between wicks or body prices for calculating pivot points, providing flexibility in market analysis.
Volume Spike Detection: Automatically identifies volume spikes using a customizable threshold multiplier, enhancing the accuracy of support and resistance levels.
Dynamic Box Display: Configurable options for extending and graying out boxes based on price interaction, ensuring a clear visual representation of active and invalidated zones.
In the example below, we see a resistance box formed based on wick highs and a volume spike. The box extends to where we see price rejecting from it. In the settings you can change this so the box will stop if price touches it if you prefer.
How it Works
Pivot Point Calculation: The script determines pivot highs and lows using either wicks or body prices over a specified term (Short, Medium, Long), corresponding to 5, 15, or 30 bars.
Volume Analysis: Calculates average volume over twice the pivot length and identifies volume spikes exceeding the user-defined threshold, crucial for confirming support and resistance levels.
Box Management: Maintains arrays of support and resistance boxes, limiting the number based on user settings (All, Recent Few, Recent Several).
Settings Explained
Source: Choose between 'Wicks' or 'Bodies' to determine whether pivot points are calculated using candle wicks or body prices.
Pivot Term: Select 'Short' (5 bars), 'Medium' (15 bars), or 'Long' (30 bars) to adjust the distance for pivot calculation. Longer terms take more bars to confirm support/resistance.
Volume Threshold (multiplier): Set a multiplier of average volume to detect volume spikes, essential for validating support/resistance levels.
Extend Until Price Hits: Enable this to extend support/resistance boxes until the price touches them, providing dynamic levels.
Gray Out Boxes Once Hit: Enable this to gray out the boxes once the price interacts with them, indicating that they are no longer active.
Max Boxes Displayed: Choose 'All', 'Recent Few' (up to 3 boxes each for bull and bear), or 'Recent Several' (up to 10 boxes each for bull and bear) to control the number of visible boxes.
Invalidate Condition: Select 'Touch' to invalidate a box when the price touches it or 'Through' to invalidate when the price passes entirely through the box.
Candle Colors: Option to color candles based on neutral, bullish, or bearish conditions for easier visual analysis.
Application
Strategic Planning: Assists traders in pinpointing potential entry and exit points by marking significant support and resistance zones.
Trend Confirmation: Validates trend strength and potential reversals with volume-based analysis of support and resistance levels.
Customizable Settings: Tailors analysis to various trading strategies with extensive input settings for pivot source, term, volume threshold, and display preferences.
The Support and Resistance Indicator by is an essential addition to any trader’s toolkit, offering robust and customizable market level analysis for improved trading decisions.

Supertrend Alert with Arrows and Time FilterOverview
This script is designed to generate trading signals based on the Supertrend indicator, a popular technical analysis tool. The Supertrend indicator is used to identify the direction of the market trend and potential reversal points.
Supertrend Settings
The script uses two sets of Supertrend settings:
Small Supertrend
Factor: 3.0
ATR Period: 10
Big Supertrend
Factor: 10.0
ATR Period: 30
These settings are fixed and should not be altered to maintain the integrity of the signal generation process.
Configurable Parameters
startHour: The hour at which signal generation begins.
endHour: The hour at which signal generation ends.
These parameters allow users to focus on specific trading hours, optimizing the signal relevance to their trading strategy.
Signal Types
The script generates two types of signals:
Type 1: Reversal Signal
Long Signal: Triggered when the big Supertrend is in an uptrend, and the small Supertrend transitions from a downtrend to an uptrend.
Short Signal: Triggered when the big Supertrend is in a downtrend, and the small Supertrend transitions from an uptrend to a downtrend.
Type 2: Trend Change Signal
Long Signal: Triggered when the big Supertrend changes from a downtrend to an uptrend.
Short Signal: Triggered when the big Supertrend changes from an uptrend to a downtrend.
How the Script Works
Initialization: The script initializes with predefined Supertrend settings.
Data Input: Market data (e.g., price data) is fed into the script.
Supertrend Calculation: The script calculates the Supertrend values using the predefined factors and ATR periods.
Signal Detection: The script monitors the Supertrend values and detects the defined signals based on the conditions mentioned above.
Time Filtering: Signals are filtered based on the specified startHour and endHour, ensuring only relevant signals are displayed within the desired timeframe.
Usage
Set Parameters: Define startHour and endHour according to your trading schedule.
Run Script: Execute the script with market data input.
Interpret Signals: Monitor the generated signals and use them to inform your trading decisions.
Originality
Dual Supertrend Usage: The use of both a small and a big Supertrend to generate signals adds a layer of complexity and reliability to the signals.
Time-Based Filtering: Allows traders to focus on specific trading hours, enhancing the relevance and accuracy of signals.
Two Signal Types: The combination of reversal signals and trend change signals provides comprehensive market insights.
Conclusion
This Supertrend Signal Generator is a robust tool for traders seeking to leverage the Supertrend indicator for more informed trading decisions. By combining dual Supertrend settings and configurable trading hours, the script offers unique and flexible signal generation capabilities.

Moving Average Bands with Signals [UAlgo]The "Moving Average Bands with Signals combines various moving average types with ATR-based bands to help traders identify potential support and resistance levels.
It plots moving average bands with upper and lower support/resistance levels based on the Average True Range (ATR) and user-defined settings.Additionally, the script generates buy/sell signals based on price crossing above or below the bands.
🔶 Key Features
Multiple Moving Average Types:
Supports various moving average calculations including Arnaud Legoux Moving Average (ALMA), Exponential Moving Average (EMA), Double Exponential Moving Average (DEMA), Triple Exponential Moving Average (TEMA), Kaufman Adaptive Moving Average (KAMA), Hull Moving Average (HMA), Least Squares Moving Average (LSMA), Simple Moving Average (SMA), Triangular Moving Average (TMA), Volume-Weighted Moving Average (VWMA), Weighted Moving Average (WMA), and Zero-Lag Moving Average (ZLMA).
Customizable ATR Bands:
Integrates the Average True Range (ATR) to calculate dynamic support and resistance bands around the moving average. The multiplier for the bands is user-adjustable, allowing for finer control over the sensitivity and width of the bands.
Signal Generation:
Provides visual signals on the chart when the price interacts with the support or resistance bands. Users can choose between using the wick or the close price to generate these signals, adding an extra layer of customization based on their trading style.
Flexible Input Parameters:
Allows users to input parameters for moving average length, ATR length, band multiplier, and signal type. Additional settings are available for specific moving average types, such as ALMA's offset and sigma, KAMA's fast and slow periods, and LSMA's offset.
🔶 Disclaimer
This script is provided for educational purposes only and should not be considered financial advice.
Trading financial instruments involves substantial risk and can result in significant financial losses.
The script’s performance in the past is not indicative of future results, and no guarantees are made regarding its accuracy, reliability, or performance.

Intellect_city - World Cycle - Ath - Timeframe 1D and 1WIndicator Overview
The Pi Cycle Top Indicator has historically been effective in picking out the timing of market cycle highs within 3 days.
It uses the 111 day moving average (111DMA) and a newly created multiple of the 350 day moving average, the 350DMA x 2.
Note: The multiple is of the price values of the 350DMA, not the number of days.
For the past three market cycles, when the 111DMA moves up and crosses the 350DMA x 2 we see that it coincides with the price of Bitcoin peaking.
It is also interesting to note that 350 / 111 is 3.153, which is very close to Pi = 3.142. In fact, it is the closest we can get to Pi when dividing 350 by another whole number.
It once again demonstrates the cyclical nature of Bitcoin price action over long time frames. However, in this instance, it does so with a high degree of accuracy over Bitcoin's adoption phase of growth.
Bitcoin Price Prediction Using This Tool
The Pi Cycle Top Indicator forecasts the cycle top of Bitcoin’s market cycles. It attempts to predict the point where Bitcoin price will peak before pulling back. It does this on major high time frames and has picked the absolute tops of Bitcoin’s major price moves throughout most of its history.
How It Can Be Used
Pi Cycle Top is useful to indicate when the market is very overheated. So overheated that the shorter-term moving average, which is the 111-day moving average, has reached an x2 multiple of the 350-day moving average. Historically, it has proved advantageous to sell Bitcoin around this time in Bitcoin's price cycles.
It is also worth noting that this indicator has worked during Bitcoin's adoption growth phase, the first 15 years or so of Bitcoin's life. With the launch of Bitcoin ETF's and Bitcoin's increased integration into the global financial system, this indicator may cease to be relevant at some point in this new market structure.

Enhanced Reversal DetectionScript Description:
The "Enhanced Reversal Detection" indicator is a powerful tool designed to identify potential market reversals across various financial instruments. It incorporates a sophisticated algorithm that analyzes price action along with key technical indicators such as the Relative Strength Index (RSI), Bollinger Bands, and Moving Average (MA).
How to Use:
Adjustable Parameters: The indicator offers a range of adjustable parameters to cater to different trading preferences and market conditions.
RSI Length: Adjusts the length of the RSI calculation to fine-tune sensitivity.
Overbought Level: Sets the threshold for identifying overbought conditions on the RSI scale.
Oversold Level: Sets the threshold for identifying oversold conditions on the RSI scale.
Bollinger Bands Length: Determines the length of the Bollinger Bands calculation.
Bollinger Bands Multiplier: Adjusts the standard deviation multiplier for the Bollinger Bands, influencing band width.
Moving Average Length: Defines the length of the Moving Average calculation to capture trend direction.
Min Bars Between Signals: Sets the minimum number of bars required between consecutive reversal signals.
ADX Length: Adjusts the length of the Average Directional Index (ADX) calculation.
ADX Threshold: Defines the threshold value for ADX, serving as a filter for reversal signals.
Signal Generation: The indicator generates signals for both bullish and bearish reversals based on predefined criteria. A bullish reversal signal is triggered when the closing price exceeds the lower Bollinger Band and RSI falls below the oversold threshold. Conversely, a bearish reversal signal occurs when the closing price falls below the upper Bollinger Band and RSI surpasses the overbought threshold.
Alerts: Traders can opt to receive alerts for bullish and bearish reversal signals, enabling them to stay informed of potential trading opportunities even when away from the platform.
Publication Readiness:
To ensure readiness for publication in the TradingView public library, the script has been meticulously crafted and documented:
The code is extensively commented to provide clear explanations of parameters, calculations, and signal generation logic.
Best coding practices have been followed to enhance readability and maintainability.
Rigorous testing has been conducted to validate the accuracy and reliability of signal generation across various market conditions.
The script adheres to TradingView's guidelines and policies for script publication, ensuring compliance with platform standards and user expectations.
With its comprehensive features and user-friendly design, the "Enhanced Reversal Detection" indicator is poised to become a valuable asset for traders seeking to identify high-probability reversal opportunities in the financial markets.
