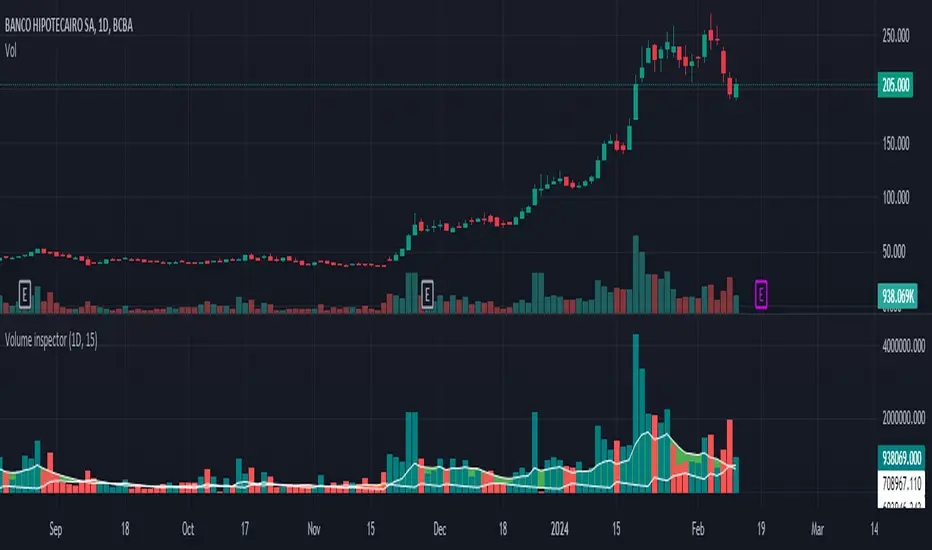
Volume inspectorThe "Volume inspector" is designed to provide a deep dive into the volume dynamics within a given larger timeframe by dissecting the positive and negative volume of candles from a lower timeframe. This analysis helps in understanding how the volume within a single candle is composed, whether it leans towards buying or selling pressure. The indicator sums up the positive and negative volumes to present the net volume in columns, offering a clear visual representation of the market's buying or selling intensity at a glance.
Additionally, it features an area between two Exponential Moving Averages (EMAs) to gauge the prevailing trend direction. A green spread between the EMAs signals strong buying pressure, with the width of the area indicating the strength of this pressure. Conversely, a red area points to selling pressure, warning users to exercise caution — it advises against buying the asset when the spread is narrow or red, suggesting weak buying momentum or strong selling momentum.
The tool recommends using daily candles as the primary timeframe for a broad market overview, with the following configurations for the lower timeframe analysis:
5 minutes for highly liquid and voluminous assets,
15 or 30 minutes for assets with lower volume to ensure accuracy without excessive market noise.
It's important to note that this indicator does not predict future market movements but rather analyzes the current behavior of the asset, making it a valuable tool for traders looking to understand immediate market sentiment and trend strength.
Cerca negli script per "accuracy"
Asset capital flows - multi-timeframeIndicator for use on the any timeframe to show net capital flows into an asset of your choosing, to allow the user to track potential buy and selling pressure.
Net volume is derived from lower timeframe data (5 minute chart by default for daily timeframe) and multiplied by the average price for the same LTF period (defined by the mean of the high, low + close values). This gives the net capital inflow or outflow for the asset per bar. The cumulative sum of all previous bars is also calculated each period/day and available to be plotted as a line chart.
This might be preferred to other similar indicators as it uses low time frame bars to calculate the up/down volumes and price, thus accuracy is improved.
It should be borne in mind that the values of capital flows displayed are specific to the asset and the volume/price feed origin (ie the listed exchange used), and thus correlated with the total underlying flows, but there are other external factors influencing the volume/price data feed beyond the buy/sell volume of the specified exchange (such as spot and futures trading on other locations/exchanges)

Daily Spot BTC ETF flowsIndicator for use on the daily timeframe to show combined capital flows into 8 of the largest spot bitcoin ETFs to allow the user to track potential buy and selling pressure on spot BTC.
The included ETFs are:
GBTC
ARKB
FBTC
HODL
IBIT
EZBC
BTCO
BITB
Net daily volume is derived from lower timeframe data (5 minute chart by default) for each ETF and multiplied by the average price for the period (defined by the mean of the high, low + close values). This gives the net capital inflow or outflow for each ETF, every period. The individual daily values are added together to give a total capital flow per day and plotted as columns. The cumulative sum of all previous periods is also calculated each period/day and plotted as a line chart.
This is the only indicator currently collating this capital flow data together and presents it as an easy to understand chart to help the user gauge market conditions. By using low time frame bars to calculate the up and down volumes, accuracy is improved.

Swing Failure Pattern [UAlgo]🔶 Description:
The Swing Failure Pattern (SFP)o aims to identify potential reversal points in price action by detecting instances where price attempts to break past a previous high or low but fails to sustain that momentum, often indicating a shift in market sentiment.
🔶 Key Features:
Swing Failure Pattern Identification: The indicator identifies Swing Failure Patterns where price attempts to breach a recent high or low but fails to maintain that momentum, potentially signaling a reversal.
Customizable Lookback Period: Traders can adjust the lookback period to define the range within which Swing Failure Patterns are identified.
Minimum Bars Between SFP: This feature allows users to set a minimum number of bars required between Swing Failure Patterns to filter out noise and improve the accuracy of signals.
RSI Confluence: Traders have the option to incorporate RSI (Relative Strength Index) confluence into the signals, filtering SFP signals based on overbought and oversold levels of RSI. This adds an additional layer of confirmation to potential reversal points.
Example :
without Confluence :
with Confluence:
Customizable RSI Parameters: Users can customize the length of the RSI period as well as define overbought and oversold levels according to their trading strategy.
Visual Alerts: The indicator provides visual alerts on the price chart using labels to highlight potential Swing Failure Patterns, aiding traders in identifying these patterns quickly and efficiently.
Disclaimer:
Please note that the Swing Failure Pattern indicator is provided for informational purposes only and should not be considered as financial advice. Trading involves substantial risk, and users should conduct their own research and analysis or consult with a financial advisor before making any investment decisions based on this indicator. Additionally, past performance is not indicative of future results.

Gap Removal IndicatorThis gap indicator shows the price of your chosen instrument as if no gaps had occurred overnight. It can be especially useful on highly-volatile exchange-listed instruments that track other 24/7 assets, because the normal candlestick chart of these instruments will create a large amount of noise that may decrease the accuracy of your indicators or make the trend harder to see.
Gaps are determined with the following code:
daychange = ta.change(dayofmonth)
gapup = daychange and open > math.max(open,close)
gapdown = daychange and open < math.min(open,close)
Whereas the gap value is determined by taking the overnight difference in prices:
downgap_change = math.min(open,close) - open
upgap_change = open - math.max(open,close)
The gap changes are cumulatively added and subtracted from the initial closing price to create the gap-adjusted price. The price will depend on how many bars your subscription allows, so pay more attention to the relative differences and/or trend than the cumulative gap-adjusted price itself.
The gap indicator comes pre-built with normal candlestick and Heikin-Ashi candle types, and four indicators (two EMAs, Bollinger bands, and a supertrend). All elements are configurable.

Volume Spectrum - WhvntrThe "Volume Spectrum" by Whvntr has been developed to analyze and visualize trading volume patterns in financial markets, offering traders insights into volume dynamics relative to historical performance. This tool can be particularly useful for identifying periods of unusually high or low trading activity, which are often associated with significant price movements.
Intended Markets and Conditions
The Volume Spectrum indicator is versatile and can be applied across a variety of markets, including stocks, forex, commodities, and cryptocurrencies. It is designed to be relevant in both bullish and bearish markets, as well as in varying volatility conditions. The primary focus is on identifying shifts in trading volume that could indicate potential trading opportunities or risks.
Features and Relevance for Trading
Volume Analysis: The indicator calculates and plots the average volume over a user-defined period (length) and compares it to a shorter-term average volume (avg_length). This comparison helps in identifying trends in trading volume.
Smoothing Options: Users can select from four types of smoothing methods (RMA, SMA, EMA, WMA) to calculate the moving averages, allowing for customization based on trading strategy and personal preference.
High and Low Volume Identification: It highlights periods of high and low volume relative to the average, using customizable color schemes for easy visual identification.
Volume Alerts: The script generates alerts for significant increases or decreases in volume, enabling traders to react promptly to potential trading signals.
Customizability: Traders can adjust various parameters, including volume length, average length, smoothing method, and visual elements like plot colors and background highlights.
Volume Histogram: An optional volume histogram can be displayed, with colors indicating whether the volume is increasing and if the closing price was higher or lower than the opening price.
This indicator can be particularly relevant for traders looking to capitalize on volume-based trading strategies. High volume periods may indicate strong interest in a security at its current price, whereas low volume may suggest a lack of interest. By identifying these conditions, traders can make more informed decisions about entry and exit points.
Disclaimer
The Volume Spectrum indicator, like any analytical tool, should be used as part of a comprehensive trading strategy. It is important to note that past performance is not indicative of future results. Trading involves risk, and the effectiveness of this or any indicator may vary based on market conditions, settings used, and other factors. Traders should exercise caution, do their own research, and consider seeking advice from a financial professional before making trading decisions. This indicator is provided without warranty regarding its accuracy, timeliness, or completeness, and users assume all risks associated with its use.

Liquidity Sweeps [UAlgo]
🔶 Description:
This script, "Liquidity Sweeps by UAlgo" aims to identify and visualize potential liquidity sweeps in the market, assisting traders in spotting significant price levels where liquidity may be targeted by large orders. The script highlights pivot points and draws support and resistance lines based on user-defined parameters. When a liquidity sweep occurs, the script dynamically adjusts the displayed lines and provides annotations, signaling potential buying or selling opportunities.
🔶 Key Features:
Pivot Analysis: Utilizes pivot points to identify potential support and resistance levels.
Liquidity Sweep Detection: Dynamically adjusts support and resistance lines based on price action, highlighting liquidity sweep events.
Buy Side Liquidity Sweep Example :
Sell Side Liquidity Sweep Example :
Liquidity areas waiting to be swept are shown as "pivot high" in red and "pivot low" in green.
Customizable Parameters: Allows users to adjust parameters such as pivot length, maximum lines to draw, colors, and line width to suit their trading preferences.
Real-time Annotations: Provides real-time annotations on the chart when liquidity sweep events are detected, aiding traders in decision-making.
Disclaimer:
This script is provided for educational and informational purposes only. Trading involves risks, and it is essential to conduct thorough research and exercise caution when making financial decisions. The author does not guarantee the accuracy or completeness of the information provided by this script, and any actions taken based on this information are at the user's own risk.

Equal Highs & Lows [UAlgo]
🔶 Description:
The "Equal Highs/Lows " indicator is designed to identify equal highs and lows within price action. These levels are significant as they often indicate potential reversal points or areas of consolidation in the market. The indicator is based on specific settings and utilizes the concept of Average True Range (ATR) to determine thresholds for identifying these key price levels.
The indicator plots lines and labels to mark equal highs and lows on the price chart.
It dynamically adjusts to changes in market volatility by utilizing ATR-based thresholds.
🔶 Settings:
Pivot Length: Determines the number of bars used to identify pivot highs and lows.
ATR Length to calculate threshold: Specifies the length of the ATR used to calculate the threshold for determining equal highs and lows.
Threshold: Sets the percentage threshold used in conjunction with ATR to identify equal highs and lows.
Wait For Confirmation: When enabled, the indicator waits for confirmation by considering pivots beyond (considers right length bars while calcuation pivot points) the specified length.
While "Wait For Confirmation" is enabled, EQH / EQL Lines will appear after "Pivot Length" after for confirmation
While "Wait For Confirmation" is disabled, EQH / EQL Lines will appear immediately if it meets the requirements to create EQH or EQL as soon as the candle closes.
🔶 Disclaimer:
"Equal Highs/Lows " is provided for informational and educational purposes only. Trading involves risks, and users should exercise caution and perform their own analysis before making any trading decisions based on this indicator. The creator of the indicator, UAlgo, does not guarantee the accuracy or reliability of the indicator, and usage of this indicator is at the user's own risk.

RSI/MFI Selling Sentiment IndexPsychological Sales Index (Psychological Sales Index)
Fundamental Indicators of Market Sentiment: The Importance of MFI and RSI
The two fundamental indicators that best reflect market sentiment are Money Flow Index (MFI) and Relative Strength Index (RSI). MFI is an indicator of the flow of funds in a market by combining price and volume, which is used to determine whether a stock is over-bought or over-selling. RSI is an indicator of the overheating of the market by measuring the rise and fall of prices, which is applied to the analysis of the relative strength of stock prices. These two indicators allow a quantitative assessment of the market's buying and selling pressure, which provides important information to understand the psychological state of market participants.
Using timing and fundamental metrics
In order to grasp the effective timing of the sale, in-depth consideration was needed on how to use basic indicators. MFI and RSI represent the buying and selling pressures of the market, respectively, but there is a limit to reflecting the overall trend of the market alone. As a result, a study on how to capture more accurate selling points was conducted by comprehensively considering technical analysis along with psychological factors of the market.
The importance of ADX integration and weighting
The "Average Regional Index (ADX)" was missing in the early version. ADX is an indicator of the strength of a trend, and has experienced a problem of less accuracy in selling sentiment indicators, especially in the upward trend. To address this, we incorporated ADX and adopted a method of adjusting the weights of MFI and RSI according to the values of ADX. A high ADX value implies the existence of a strong trend, in which case it is appropriate to reduce the influence of MFI and RSI to give more importance to the strength of the trend. Conversely, a low ADX value increases the influence of MFI and RSI, putting more weight on the psychological elements of the market.
How to use and interpret
The user can adjust several parameters. Key inputs include 'Length', 'Overbought Threshold', 'DI Length', and 'ADX Smoothing'. These parameters are used to set the calculation period, overselling threshold, DI length, and ADX smoothing period of the indicator, respectively. The script calculates the psychological selling index based on MFI, RSI, and ADX. The calculated index is normalized to values between 0 and 100 and is displayed in the graph. Values above 'Overbought Threshold' indicate an overselling state, which can be interpreted as a potential selling signal. This index allows investors to comprehensively evaluate the psychological state of the market and the strength of trends, which can be used to make more accurate selling decisions.

[MAD] Acceleration based dampened SMA projectionsThis indicator utilizes concepts of arrays inside arrays to calculate and display projections of multiple Smoothed Moving Average (SMA) lines via polylines.
This is partly an experiment as an educational post, on how to work with multidimensional arrays by using User-Defined Types
------------------
Input Controls for User Interaction:
The indicator provides several input controls, allowing users to adjust parameters like the SMA window, acceleration window, and dampening factors.
This flexibility lets users customize the behavior and appearance of the indicator to fit their analysis needs.
sma length:
Defines the length of the simple moving average (SMA).
acceleration window:
Sets the window size for calculating the acceleration of the SMA.
Input Series:
Selects the input source for calculating the SMA (typically the closing price).
Offset:
Determines the offset for the input source, affecting the positioning of the SMA. Here it´s possible to add external indicators like bollinger bands,.. in that case as double sma this sma should be very short.
(Thanks Fikira for that idea)
Startfactor dampening:
Initial dampening factor for the polynomial curve projections, influencing their starting curvature.
Growfactor dampening:
Growth rate of the dampening factor, affecting how the curvature of the projections changes over time.
Prediction length:
Sets the length of the projected polylines, extending beyond the current bar.
cleanup history:
Boolean input to control whether to clear the previous polyline projections before drawing new ones.
Key technologies used in this indicator include:
User-Defined Types (UDT) :
This indicator uses UDT to create a custom type named type_polypaths.
This type is designed to store information for each polyline, including an array of points (array), a color for the polyline, and a dampening factor.
UDTs in Pine Script enable the creation of complex data structures, which are essential for organizing and manipulating data efficiently.
type type_polypaths
array polyline_points = na
color polyline_color = na
float dampening_factor= na
Arrays and Nested Arrays:
The script heavily utilizes arrays.
For example, it uses a color array (colorpreset) to store different colors for the polyline.
Moreover, an array of type_polypaths (polypaths) is used, which is an array consisting of user-defined types. Each element of this array contains another array (polyline_points), demonstrating nested array usage.
This structure is essential for handling multiple polylines, each with its set of points and attributes.
var type_polypaths polypaths = array.new()
Polyline Creation and Manipulation:
The core visual aspect of the indicator is the creation of polylines.
Polyline points are calculated based on a dampened polynomial curve, which is influenced by the SMA's slope and acceleration.
Filling initial dampening data
array_size = 9
middle_index = math.floor(array_size / 2)
for i = 0 to array_size - 1
damp_factor = f_calculate_damp_factor(i, middle_index, Startfactor, Growfactor)
polyline_color = colorpreset.get(i)
polypaths.push(type_polypaths.new(array.new(0, na), polyline_color, damp_factor))
The script dynamically generates these polyline points and stores them in the polyline_points array of each type_polypaths instance based on those prefilled dampening factors
if barstate.islast or cleanup == false
for damp_factor_index = 0 to polypaths.size() - 1
GET_RW = polypaths.get(damp_factor_index)
GET_RW.polyline_points.clear()
for i = 0 to predictionlength
y = f_dampened_poly_curve(bar_index + i , src_input , sma_slope , sma_acceleration , GET_RW.dampening_factor)
p = chart.point.from_index(bar_index + i - src_off, y)
GET_RW.polyline_points.push(p)
polypaths.set(damp_factor_index, GET_RW)
Polyline Drawout
The polyline is then drawn on the chart using the polyline.new() function, which uses these points and additional attributes like color and width.
for pl_s = 0 to polypaths.size() - 1
GET_RO = polypaths.get(pl_s)
polyline.new(points = GET_RO.polyline_points, line_width = 1, line_color = GET_RO.polyline_color, xloc = xloc.bar_index)
If the cleanup input is enabled, existing polylines are deleted before new ones are drawn, maintaining clarity and accuracy in the visualization.
if cleanup
for pl_delete in polyline.all
pl_delete.delete()
------------------
The mathematics
in the (ABDP) indicator primarily focuses on projecting the behavior of a Smoothed Moving Average (SMA) based on its current trend and acceleration.
SMA Calculation:
The indicator computes a simple moving average (SMA) over a specified window (sma_window). This SMA serves as the baseline for further calculations.
Slope and Acceleration Analysis:
It calculates the slope of the SMA by subtracting the current SMA value from its previous value. Additionally, it computes the SMA's acceleration by evaluating the sum of differences between consecutive SMA values over an acceleration window (acceleration_window). This acceleration represents the rate of change of the SMA's slope.
sma_slope = src_input - src_input
sma_acceleration = sma_acceleration_sum_calc(src_input, acceleration_window) / acceleration_window
sma_acceleration_sum_calc(src, window) =>
sum = 0.0
for i = 0 to window - 1
if not na(src )
sum := sum + src - 2 * src + src
sum
Dampening Factors:
Custom dampening factors for each polyline, which are based on the user-defined starting and growth factors (Startfactor, Growfactor).
These factors adjust the curvature of the projected polylines, simulating various future scenarios of SMA movement.
f_calculate_damp_factor(index, middle, start_factor, growth_factor) =>
start_factor + (index - middle) * growth_factor
Polynomial Curve Projection:
Using the SMA value, its slope, acceleration, and dampening factors, the script calculates points for polynomial curves. These curves represent potential future paths of the SMA, factoring in its current direction and rate of change.
f_dampened_poly_curve(index, initial_value, initial_slope, acceleration, damp_factor) =>
delta = index - bar_index
initial_value + initial_slope * delta + 0.5 * damp_factor * acceleration * delta * delta
damp_factor = f_calculate_damp_factor(i, middle_index, Startfactor, Growfactor)
Have fun trading :-)

Live Economic Calendar by toodegrees⚠️ PLEASE READ ⚠️
Although this indicator is accurate in showcasing live and upcoming News Events, checking the original sources is always suggested. This indicator aims to save Time, but due to limitations it may not be 100% correct 100% of the Time.
Description:
The Live Economic Calendar indicator seamlessly integrates with external news sources to provide real-Time, upcoming, and past financial news directly on your Tradingview chart.
By having a clear understanding of when news are planned to be released, as well as their respective impact, analysts can prepare their weeks and days in advance. These injections of volatility can be harnessed by analysts to support their thesis, or may want to be avoided to ensure higher probability market conditions. Fundamentals and news releases transcend the boundaries of technical analysis, as their effects are difficult to predict or estimate.
Designed for both novice and experienced traders, the Live Economic Calendar indicator enhances your analysis by keeping you informed of the latest and upcoming market-moving news.
This is achieved with three different visual components:
News Table: A dedicated News Table shows the Day of the Week, Date, Time of the Day, Currency, Expected Impact, and News Name for each event (in chronological order). Once a news event has occurred, or the day is over, it will be greyed out – helping to focus on the next upcoming news events.
News Lines: Vertical lines plotted in the future help analysts monitor upcoming news events; vertical lines in the past help analysts spot and backtest previous news events that already occurred.
News Labels: Color-coded news labels will plot once the news events have occurred. This not only gives analysts a minimalistic visual cue, but also retains the information of which news were released at that Time in their tooltips.
Forex Factory Calendar News Feed:
The Forex Factory Data Feed includes news events from January 2007 to the present. The data is updated daily. Please see the Technical Description below for more information.
Forex Factory provides news for all major currencies and markets:
Australia (AUD)
Canada (CAD)
Switzerland (CHF)
China (CNY)
European Union (EUR)
United Kingdom (GBP)
Japan (JPY)
New Zealand (NZD)
United States of America (USD)
Further, there are four types of news impact, defined by respective color-coding which is retained to avoid confusion:
⚪ Holiday
🟡 Low Impact
🟠 Medium Impact
🔴 High Impact
News' Time of the day data is in 24H format, and 'All Day' news are marked at Daily candle open.
⚠️ Original Release Notes ⚠️
The original release of this indicator supports the Forex Factory News Calendar in EST (New York Time). Future updates will include multiple news sources, as well as supporting different Timezones.
Given Data limitations, the Daily chart can omit some data due to the market being close on some days. This will be fixed in the future once an efficient solution is implemented.
Key Features:
Impact-Based News Filtering: Filter news items based on their expected impact (holiday, low, medium, high) to focus on the most market-critical information.
Symbol-Specific News: Automatically filter news to display only what's relevant to the currency pair or trading symbol you are analyzing.
Custom Currency News: Want to see more than the news relevant to the current symbol? Toggle which markets' news you are most interested in.
Chart History: Keep your charts clean by displaying only the drawings of Today's news, or This Week's news.
Custom Lookback: Look further back in Time by choosing a custom number of Lookback Days, allowing you to backtest and keep in mind salient news events from the past.
Line and Label Customization: Both the News Lines and Labels are highly customizable (except the colors), allowing you to make the indicator yours.
Table History: Choose whether to focus on Today's news only, or the news for This Week.
Table Customization: The table colors and position are highly customizable, allowing you to make it fit your visual preference and your layouts' aesthetic.
"Wondering how it's done? 👇"
Technical Description:
This script utilizes Pine Seeds , a service integrated with TradingView for importing custom data. This stunning feature enables users to upload and access custom End Of Day (EOD) data, which can be updated as frequently as five times daily.
This data can be imported in one of two formats:
Single Value: integer or float
Candle Data: open, high, low, close, volume
Upon encountering Pine Seeds, I recognized its potential for importing financial news events. Given that Forex Factory is a primary source of financial news in my personal analysis, integrating it into my layouts seemed like an exciting opportunity. This integration is expected to provide significant value to users looking to integrate additional news feeds all in one place.
Development Challenges:
Format Limitations: News events must be converted into numerical values for import, due to the required Pine Seeds format.
Amount of Data: With all currencies considered, the system may encounter over 40 news events in a single day.
Data Availability: The reliance on End Of Day (EOD) data means that information for the current day is displayed with a delay, and accessing future data is not possible.
Solutions:
Encoding: Each news event is encoded as an integer in the "DCHHMMITYP" format.
D = day of the week
C = currency
HHMM = Time of day
I = news impact
TYP = event ID (see Event Library A and Event Library B )
To ensure data assignment for each candle across the open, high, low, close, and volume series, the value "999" is used as a placeholder:
Importing: Utilizing the encoding system, up to five news events per day can be imported for a singular Pine Seeds custom symbol.
By creating multiple custom Pine Seeds Symbols, efficient imports of a larger number of events is then easily achievable. Nine unique symbols have been established, accommodating up to 45 news events per day.
These symbols are searchable, and accessible as " TOODEGREES_FOREX_FACTORY_SLOT_N " where N ranges from 1 to 9.
The Pine Seeds data feed appears as follows:
Uploading Schedule: To ensure analysts are informed about current and upcoming week's news, events are uploaded one week in advance.
This approach is vital for preparing for potential market impacts across various asset classes and currencies, allowing visibility of an entire week's news ahead of Time.
Data Scraping:
Unfortunately Forex Factory doesn't offer an API to fetch their news feed.
Hence an ad hoc python scraper was developed to read and save news events from January 2007 till the present leveraging Selenium. The scraper algorithm is part of a larger script responsible for scraping data, formatting data, and creating all necessary datasets.
The pseudo-code for the python script is as follows:
Read and save news event data on Forex Factory
Format day of the week, currency, Time of the day, and impact data for the Encoding
Encode and save News Event IDs – Event ID dataset is created
Format news data for Pine Seeds (roll-back date by one week, assign news to open, high, low, close, and volume values)
Create Pine Seeds Datasets
This script is ran everyday at Futures market close (16:00 EST) to update the last part of the each dataset, ensuring accuracy, and taking into account last-minute news additions or revisions.
Once the data (next week's news) is imported by the Live Economic Calendar indicator, it's immediately decoded by leveraging the Forex Factory Decoding Library , and saved into an array.
Upon a new week open, the decoded data is used to plot news events on the chart and in the news table.
See the inner workings of these processes in the Forex Factory Utility Library .
Although these libraries are specifically built for this indicator, feel free to use them to create your own scripts. Looking forward to see what the Pine Script community comes up with!
Thank you for making it this far. Enjoy!
Ciao,
toodegrees
This tool is available ONLY on the TradingView platform.
Terms and Conditions
Our charting tools are provided for informational and educational purposes only and do not constitute financial, investment, or trading advice. Our charting tools are not designed to predict market movements or provide specific recommendations. Users should be aware that past performance is not indicative of future results and should not be relied upon for making financial decisions. By using our charting tools, the user agrees that Toodegrees and the Toodegrees Team are not responsible for any decisions made based on the information provided by these charting tools. The user assumes full responsibility and liability for any actions taken and the consequences thereof, including any loss of money or investments that may occur as a result of using these products. Hence, by using these charting tools, the user accepts and acknowledges that Toodegrees and the Toodegrees Team are not liable nor responsible for any unwanted outcome that arises from the development, or the use of these charting tools. Finally, the user indemnifies Toodegrees and the Toodegrees Team from any and all liability.
By continuing to use these charting tools, the user acknowledges and agrees to the Terms and Conditions outlined in this legal disclaimer.

Sunday Vertical Lines (00:00 NY)Short Description:
Experience enhanced chart clarity with our "Sunday Midnight Vertical Lines" indicator. This tool elegantly marks every Sunday at 00:00 New York time, providing traders with a clear reference point for weekly market resets and potential strategy adjustments.
Detailed Description:
Purpose:
The "Sunday Midnight Vertical Lines" indicator is designed to help traders and market analysts visually segment their charts based on weeks. By clearly demarcating the start of each trading week, this tool aids in performing weekly analyses, understanding market rhythms, and preparing for the week ahead.
Key Features:
Automatic Time Zone Adjustment: The indicator adjusts for New York time, ensuring accuracy regardless of the user's local time zone.
Visual Clarity: Draws a distinct red vertical line at 00:00 each Sunday, offering a stark contrast against typical chart elements.
Performance Optimized: Efficiently coded to maintain chart performance, even on data-rich interfaces.
User-Friendly: No complex settings required. The tool works immediately upon addition to the chart, facilitating ease of use for traders of all skill levels.
Use Cases:
Weekly Market Analysis: Ideal for traders who conduct weekly market reviews, as it visually segments the chart at the beginning of each trading week.
Strategic Planning: Useful for planning and adjusting weekly trading strategies.
Historical Reference: Assists in historical market analysis by providing clear reference points for the start of each week.
Conclusion:
Whether you're a day trader, swing trader, or long-term investor, the "Sunday Midnight Vertical Lines" indicator is a simple yet powerful tool to enhance your chart analysis. It offers a clear, visual reference point for the start of each trading week, aiding in strategy development and market understanding.

Instant RSI (IRSI)
Instant RSI is tailored for users seeking an effective RSI indicator for charts with limited historical data, such as new symbols or very high time frame charts. Its distinctiveness lies in employing a Chebyshev filter, an innovative approach that allows the RSI to initiate calculations with just two data points. The Chebyshev filter, traditionally used in signal processing, helps in smoothing data while minimizing lag, a critical aspect in fast-moving financial markets.
Key Features:
Chebyshev Filter Integration: The Chebyshev filter is fine-tuned to mimic a 14-period RMA's behavior, enhancing the RSI's responsiveness and accuracy with minimal data.
Customizable RSI and MA Settings: Users can modify the RSI's source, length, ripple effect, and style. An optional moving average overlay, also based on Chebyshev filtering, tuned to mimic an EMA set to 14.
Divergence Detection: I have also included the ability to adjust the divergence settings to allow for more flexibility over the built in RSI.
The script operates by applying the Chebyshev filter to the price movement's up and down components, forming the basis of the RSI calculation. When the moving average feature is activated, it further processes the RSI value through the Chebyshev filter for additional smoothing. This dual application of the Chebyshev filter is central to the script's design, offering a unique solution for situations where traditional RSI calculations might be less reliable due to data scarcity.
The divergence detection feature enhances the script's utility by signaling potential trend reversals, critical for strategic decision-making in trading. These features are visually represented on the chart, ensuring that users can easily interpret and react to the indicators.
In general this indicator should produce the exact same output as the built in RSI. This indicator is specifically designed to be used in conditions where the built in RSI will not work due to limited data.
In summary, the "Instant RSI" script is a practical option for those dealing with limited data scenarios, offering a unique blend of Chebyshev filter application for more responsive market analysis.

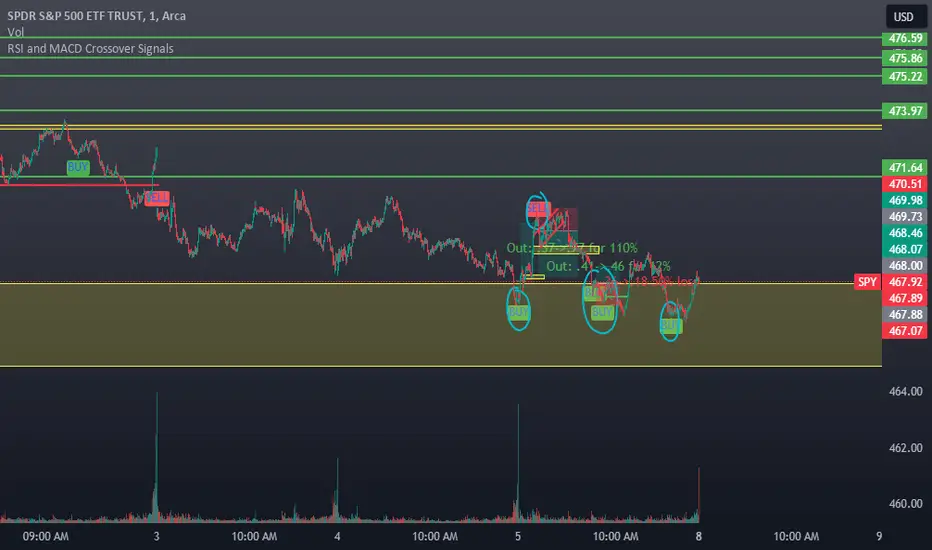
RSI and MACD Crossover SignalsBest for Short-Term/Intraday Trading on SPY, TSLA, NVDA
Strategy Concept:
This strategy is designed for short-term trading across various assets and timeframes (Recommend: 1min, 5min, 15min, 1hr, 4hr, 1day). It leverages the Relative Strength Index (RSI) and Moving Average Convergence Divergence (MACD) to identify potential buy and sell signals. The strategy aims to capture moments where the asset's price is likely to experience a reversal or a significant momentum shift.
By combining the RSI and MACD indicators, the strategy seeks to increase the accuracy of identifying potential trend reversals or continuations, taking into account both the momentum and the trend direction of the asset.
RSI (Relative Strength Index) Parameters:
The RSI period is set to 14
Overbought and oversold levels are set at 70 and 30, respectively
The RSI is used to identify potential reversal points when the asset is overbought or oversold
MACD (Moving Average Convergence Divergence) Parameters:
The MACD settings are configured with a fast length of 8, a slow length of 34, and a signal smoothing of 8
The MACD line crossing over or under the signal line is used to confirm the potential buy or sell signals indicated by the RSI
Signal Generation Logic:
Buy Signal:
Triggered when the RSI crosses above the oversold level (30).
Confirmed if the MACD line crosses above the signal line within a delay period of up to 4 candles after the RSI signal.
Sell Signal:
Triggered when the RSI crosses below the overbought level (70).
Confirmed if the MACD line crosses below the signal line within a delay period of up to 4 candles after the RSI signal.
Additional Features:
The script includes a notification system that alerts the trader when either a buy or sell signal is detected. The alert signal is combined with both the buy and sell signal in 1 so people without premium can be alerted when any signal appears.
Buy signals are visually represented on the chart below the price bars with a green "BUY" label.
Sell signals are indicated above the price bars with a red "SELL" label.
Usage and Application:
This strategy is versatile and recommended to be played with scalps and day trades. I prefer SPY 0DTE on the 1 and 5 minute timeframe and looking for bigger trend reversals on the 1hr, 4hr, and 1 day timeframe.
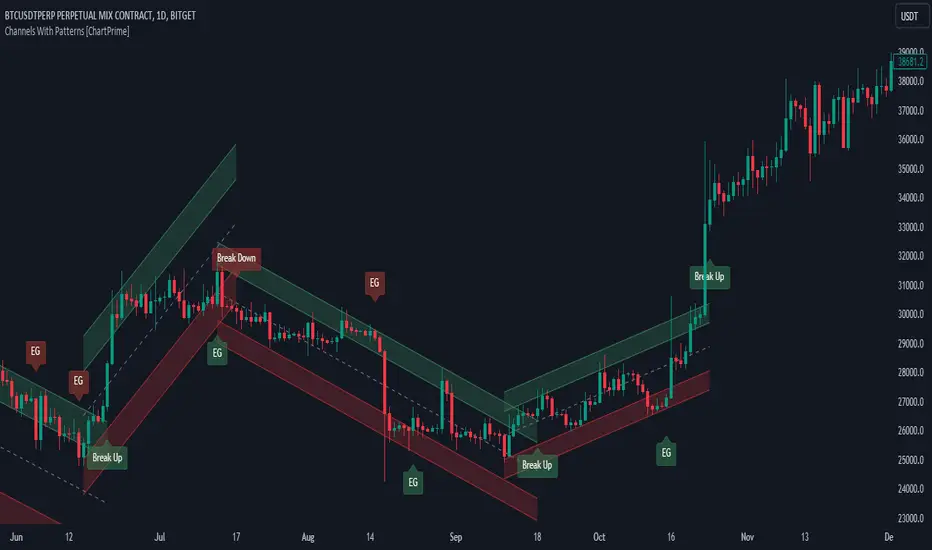
Channels With Patterns [ChartPrime]The Channels With Patterns indicator is an attempt at minimizing the delay in forming a trend channel. This indicator uses a single pivot in conjunction with a smooth version of the price to estimate the direction of an emerging trend. Using ATR, this indicator estimates the volatility of the new trend by adjusting the channel size by a multiple of the current ATR.
One of the biggest complains for any trend indicator is that it takes too long to create a channel or trend line. This indicator estimates the trend channel by checking if the price is moving in the correct direction and then it projects the channel from a single pivot. To allow for some margin of error, this script uses an offset to help center the channel.
This offset is generated from the ATR at the time of formation. In conjunction with forming estimated trend channels, this indicator features select candle stick patterns. These candle stick patterns are filtered by location in the formed trend channel. If the price is within an extremity of the trend channel it will appear. Filtering classical vanilla candle stick patterns using this methodology can result in some interesting results and possible confluence points for traders. For example; a bearish hammer appearing when filtered in an upper zone might add an extra level of realtime unique confluence traders.
Traders can use this script as a general trend line indicator that is a bit more forward looking than others, or it can be used it as its full blown trend channel estimator. Due to the fact that this is an estimate using the minimum possible information to make the channel, its accuracy will not always be perfect and can suffer compared to alternative methods.
When configuring the indicator it is important to understand the role of each input. Here is a description of all of the settings provided:
Presets (`preset`): This input allows users to quickly configure the indicator based on the market they are trading in. Selecting "Stocks," "Forex," or "Crypto" automatically adjusts various parameters to settings deemed optimal for these markets. The "User" option lets traders manually configure settings for a more personalized approach.
Style (`style`): This setting determines how pivot points are calculated. "Wick" uses the high and low of candlesticks (including wicks), which can be more sensitive to market extremes. "Body" uses only the open and close prices (the body of the candlesticks), potentially offering a more stable pivot point calculation.
Break Style (`break_style`): This option defines what price is used to determine if a channel has been broken. "Close" uses the closing price of a candlestick, while "High/Low" uses the highest and lowest prices. This affects how channel breaks are identified and can influence trading signals.
Instant Mode (`instant`): When enabled, this feature allows the indicator to form channels more quickly by initiating them as soon as potential formations are detected. This can provide earlier signals but may increase the risk of false positives.
ATR Length (`atr_length`): This input sets the period for the Average True Range (ATR), a common volatility indicator. A longer ATR period may smooth out the channel but could delay responsiveness to market changes. A shorter period might make the channel more responsive but potentially more erratic.
Offset Center (`offset`): Adjusts the vertical positioning of the channel. This can help in aligning the channel more accurately with the price action, depending on market conditions and personal trading strategies.
Size (`atr_multiplier`): Alters the channel's size relative to the ATR. A higher multiplier makes a wider channel, which might be useful in more volatile markets. A lower multiplier tightens the channel, which could be better for less volatile conditions.
Padding % (`padding`): This setting adjusts the padding within the top and bottom quarters of the channel. It essentially fine-tunes the channel's sensitivity to price movements near its boundaries.
Pivot Length (`pivot_length`): Determines the number of bars used to calculate pivot points. A longer length may provide more significant pivot points but can reduce the number of channels formed.
Pivot Look Forward (`look_forward`): Sets the number of bars to look forward in the pivot calculation, affecting how quickly the channel adapts to new pivots.
Average H/L Length (`avg_length`): Controls the smoothing of the high and low prices used in the channel calculation. A longer average length can lead to smoother, more gradual channel slopes.
Enable Hammer (`enable_hammer`): When enabled, the indicator will highlight Hammer candlestick patterns, which are often considered bullish reversal indicators.
Enable Inverted Hammer (`enable_ihammer`): This toggles the display of Inverted Hammer patterns, typically viewed as potential bullish reversal signals.
Enable Bullish Engulfing (`enable_bullish_engulfing`): Enables the identification of Bullish Engulfing patterns, another type of bullish reversal indicator.
Enable Bearish Engulfing (`enable_bearish_engulfing`): When activated, this highlights Bearish Engulfing patterns, which are often interpreted as bearish reversal signals.
Extend Channel (`extend`): This option, when enabled, extends the drawn channels forward until they are either broken or a new channel is formed.
Show Break Label (`show_break_label`): Toggles the display of labels indicating where the channel has been broken, providing visual cues for potential trade entries or exits.
Channel History Length (`history_length`): Determines how many historical channels are displayed on the chart. This can be useful for analyzing past performance and patterns.
Channel Colors (`top_color`, `bottom_color`, `center_color`): These settings allow customization of the channel's appearance by setting the colors of the top, bottom, and center lines.
Line Transparency (`line_trans`): Adjusts the transparency of the channel lines, helping to balance visibility with chart readability.
Center Line Transparency (`center_trans`): Specifically sets the transparency level of the center line of the channel.
Channel Fill Transparency (`fill_trans`): Modifies the transparency of the filled areas between the channel lines, which can enhance chart clarity and focus on the price action.
Break Colors (`break_up_color`, `break_down_color`): Sets the colors for labels that appear when the channel is broken, either upwards or downwards.
Break Label Text Color (`text_color`): Determines the color of the text in the break labels, enhancing readability based on the chart's background and color scheme.
Candle Pattern Colors (`h_color`, `ih_color`, `bullish_engulfing_color`, `bearish_engulfing_color`): These inputs allow for the customization of the colors used to highlight various candle patterns on the chart.
Candle Pattern Text Color (`candle_text_color`): Sets the color of the text for labels associated with candle pattern indicators.
Alerts (`new_channel_alert`, `break_alert`, `hammer_alert`, `ihammer_alert`, `bullish_engulfing_alert`, `bearish_engulfing_alert`): These toggles enable or disable alerts for different events, such as the formation of new channels, channel breaks, or the appearance of specific candle patterns. This feature is crucial for traders who rely on timely notifications for potential trading opportunities.
We have provided a few presets to allow you to get a feeling for how the indicator works with different settings easily. Here is a description of the settings used in each preset:
Stocks Preset:
Style: "Wick"
Break Style: False (High/Low)
Instant Mode: True
ATR Length: 10
Size (ATR Multiplier): 4
Pivot Length: 10
Pivot Look Forward: 15
Average H/L Length: 18
Forex Preset:
Style: "Wick"
Break Style: False (High/Low)
Instant Mode: True
ATR Length: 100
Size (ATR Multiplier): 5
Pivot Length: 10
Pivot Look Forward: 15
Average H/L Length: 18
Crypto Preset:
Style: "Wick"
Break Style: False (High/Low)
Instant Mode: True
ATR Length: 10
Size (ATR Multiplier): 4
Pivot Length: 10
Pivot Look Forward: 15
Average H/L Length: 18
This script first starts by defining and collecting the relevant data for the main body of the code with data(). This generates the pivot data, the levels, the ranges, the averages, the deltas, and finally the candle sticks. Once there is a higher low, or lower high detected via the pivots and the current price it triggers the formation of the new channel. It takes the delta between the last pivot and the current average price and projects the trend channel using this delta. If the price exceeds the extremities of the channel it will classify this as a break from the estimated structure and begin looking for a new channel. The idea is that when trending, the price will oscillate between extremities as defined by a range and direction. If the price is inside of one of these extremities the script will look for candle stick patterns. This is how the script operates.
On a more technical level, this script is meant to showcase Pine Script's custom types and methods. We have made use of a properties pattern allows functions to use a minimal number of arguments. This allows you to add new inputs without modifying a string of functions. The use of methods and data structures allows the main body of the code to be easy to understand and for the script as a whole to be easily modified. We have made sure that the script is modular so that users can incorporate this into their own custom scripts. It should be easy to expand on this script as the main logic is fairly compact and open for easy modification. All features are packed into their own function for easy use elsewhere. This is particularly evident in the candle stick section. I have simplified the process of creating candle stick patterns by creating a type. All users have to do is make methods for this type.
candle()=>
polarity = open < close
body_top = math.max(open, close)
body_bottom = math.min(open, close)
body_range = body_top - body_bottom
top_wick = high - body_top
bottom_wick = body_bottom - low
average_body = ta.ema(body_range, 14)
average_top_wick = ta.ema(top_wick, 14)
average_bottom_wick = ta.ema(bottom_wick, 14)
has_body = body_range != 0
has_top_wick = top_wick != 0
has_bottom_wick = bottom_wick != 0
above_average_body = body_range > average_body
above_average_top_wick = top_wick > average_top_wick
above_average_bottom_wick = bottom_wick > average_bottom_wick
candle_data.new(
polarity
, body_top
, body_bottom
, body_range
, top_wick
, bottom_wick
, average_body
, average_top_wick
, average_bottom_wick
, has_body
, has_top_wick
, has_bottom_wick
, above_average_body
, above_average_top_wick
, above_average_bottom_wick
)
In conclusion, this script offers a blend of rapid trend channel formation and candlestick pattern recognition, making it a unique tool for traders looking for a more proactive approach to trend analysis.
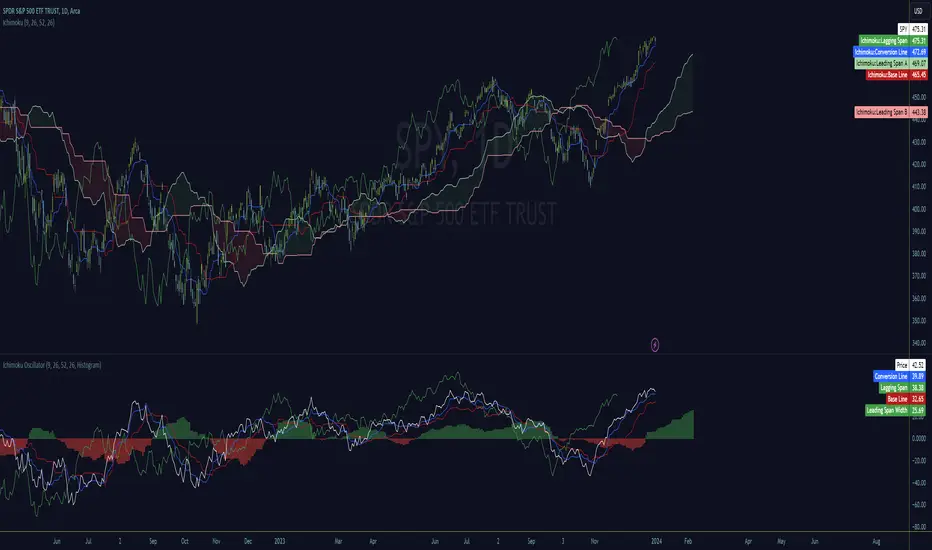
Ichimoku OscillatorFans of the Ichimoku cloud indicator may enjoy this lower study version.
It's all the exact same representation but the cloud is converted to an oscillation in histogram or classic cloud fill formats.
All of the original lines, except Kumo cloud lines, are provided but adjusted to be positionally accurate to the oscillation values.
The oscillation value is calculated simply by absolute subtraction of span a and b lines and as such become an additional width detection mechanism in what I consider to be a slightly cleaner display.
Since the entire cloud can be removed from the main chart, it's necessary to understand price location relative to the values which is calculated and displayed as the 'Price' plot. It is positionally accurate to the oscillation and cross signals can be observed.
My hope is that this serves as a foundation for others to create interesting Ichimoku lower study indicators, and to provide relief to traders looking for cleaner main charts.
I've done my best to ensure accuracy but if any issues are found please let me know.
Feedback and suggestions are welcome, enjoy.