VWAP Suite {Phanchai}VWAP Suite {Phanchai}
Compact, readable, TradingView-friendly.
What is VWAP?
The Volume Weighted Average Price (VWAP) is the average price of a period weighted by traded volume. It’s used as a fair-value reference (mean) and resets at the start of each new period.
Included VWAP Modes
Session — resets each trading day (current session).
Week / Month / Quarter / Year — current calendar periods.
Anchored Week / Month / Quarter / Year — starts at the beginning of the previous completed period.
Rolling 7D / 30D / 90D — rolling windows: today + last 6/29/89 daily sessions.
Important
This suite does not generate buy/sell signals. It provides structure and confluence; decisions remain yours.
Use Cases
Identify fair-value zones / mean-reversion areas.
Plan TP / SL around periodic VWAPs.
Define DCA levels (e.g., anchored to prior week/month).
Gauge trend bias via VWAP slope and reactions.
How to Use
Inputs → VWAP 1..5: Choose the period per slot (Session, Anchored, Rolling, etc.) and toggle Show .
Sources: Select the price source for all VWAPs (default: HLC3).
Global: Line offset (bars) shifts plots visually (does not affect calculations).
Style tab: Adjust per-line colors, thickness, and line style.
Alerts
Price crosses a VWAP (per slot).
VWAP slope turns UP or DOWN (per slot).
Tips & Notes
Volume required: Poor/absent volume (e.g., some FX tickers) can degrade accuracy.
Anchored modes: Start at the prior period’s open; values appear only after that timestamp.
Rolling modes: Use completed daily sessions (including today).
Clutter control: If labels crowd, increase Line offset or hide unneeded slots.
Confluence: Combine with market structure, liquidity zones, or momentum filters for stronger context.
Built for clear VWAP workflows. Trade safe!
Cerca negli script per "accuracy"

Extended CANSLIM Indicator❖ Extended CANSLIM Indicator.
The Extended CANSLIM indicator is an indicator that concentrates all the tools usually used by CANSLIM traders.
It shows a table where all the stock fundamental information is shown at once first for the last quarter and then up to 5 years back.
The fundamental data is checked against well known CANSLIM validation criteria and is shown over 4 state levels.
1. Good = Value is CANSLIM Compliant.
2. Acceptable = Value is not CANSLIM compliant but still good. value is shown with a lighter background color.
3. Warning = Value deserves special attention. Value is shown over orange background color.
3. Stop = Value is non CANSLIM compliant or indicates a stop trading condition. Value is shown over red background color.
The indicator has also a set of technical tools calculated on price or index and shown directly on the chart.
❖ Fundamental data shown in the table.
The table is arranged in 4 sets of data:
1. Table Header, showing Indicator and Company data.
2. CANSLIM.
3. 3Rs: RS Rating, Revenue and ROE.
4. Extra Data: Piotroski score, ATR, Trend Days, D to E, Avg Vol and Vol today.
Sets 3 and 4 can be hidden from the table.
❖ Indicator and Compay Data.
The table header shows, Indicator name and version.
It then displays Company Name, sector and industry, human size and its capitalization.
❖ CANSLIM Data.
Displays either genuine CANSLIM data from TradinView or custom data as best effort when that data cannot be obtained in TV.
C = EPS diluted growth, Quarterly YoY.
>= 25% = Good, >= 0% = Acceptable, < 0% = Stop
A = EPS diluted growth, Annual YoY.
>= 25% = Good, >= 0% = Acceptable, < 0% = Stop
N = New High as best effort (Cust).
Always Good
S = Float shares as best effort.
Always Good
L = One year performance relative to S&P 500 (Cust),
Positive : 0% .. 50% = Neutral, 50%+ = Leader, 80%+ = Leader+, 100%+ = Leader++
Negative : 0% .. -10% = Laggard, -10% .. -30% = Laggard+, -30%+ = Laggard++
>= 50% = Good, >= 0% = Acceptable, >= -10% Warning, < -10% = Stop
I = Accumulation/Distribution days over last 25 days as a clue for institutional support (Cust).
A delta is calculated by subtracting Distribution to Accumulation days.
> 0 = Good, = 0 = Acceptable, < 0 = Warning, < -5 = Stop
M = Market direction and exposure measured on S&500 closing between averages (Cust).
Varies from 0% Full Bear to 100% Full Bull
>= 80% = Good, >= 60% = Acceptable, >= 40% = Warning, < 40% = Stop
❖ Extra non CANSLIM Data.
RS = RS Rating.
>= 90 = Good, >= 80 = Accept, >= 50 = Warning, < 50 = Stop
Rev. = Revenue Growth Quarterly YoY.
>= 0% = Good, <0% = Stop
ROE = Return on Equity, Quarterly YoY.
>= 17% = Good, >= 0% = Acceptable, < 0% = Stop
Piotr. = Piotroski Score, www.investopedia.com (TV)
>= 7 = Good, >= 4 = Acceptable, < 4 = Stop
ATR = Average True Range over the last 20 days (Cust).
0% - 2% = Acceptable, 2% - 4% = Ideal, 4% - 6% = Warning, 5%+ = Stop.
Trend Days = Days since EMA150 is over EMA200 (Cust).
Always Good
D. to E. = Days left before Earnings. Maybe not a good idea buying just before earnings (Cust).
>= 28 = Good, >= 21 = Acceptable, >= 14 = Warning, < 14 = Stop
Avg Vol. = 50d Average Volume (Cust).
>= 100K = Good, < 100K = Acceptable
Vol. Today = Today's percentage volume compared to 50d average (Cust).
Always Good.
❖ Historical Data.
Optionally selectable historical data can be displayed for C, A, Revenue and ROE up to 20 quarters if available.
Quarterly numbers can also be displayed for A, C and Revenue.
Information can be shown in Chronological or Reverse Chronological order (default).
Increasing growth quarters are shown in white, while diminuing ones are shown in Yellow.
Transition from Losing to Profitable quarters are shown with an exclamation mark ‘!’
Finally, losing quarters are shown between parenthesis.
❖ MAs on chart.
Displays 200, 100, 50 and 20 days MAs on chart.
The MAs are also automatically scaled in the 1W time frame.
❖ New 52 Week High on chart.
A sun is shown on the chart the first time that a new 52 week high is reached.
The N cell shows a filled sun when a 52 week high is no older than a month, an lighter sun when it’s no older than a quarter or a moon otherwise.
❖ Pocket Pivots on chart.
Small triangles below the price are signaling pocket pivots.
❖ Bases on chart, formerly Darvas Boxes.
Draw bases as defined by Darvas boxes, both top or bottom of bases can be selected to be shown in order to only show resistance or support.
❖ Market exposure/direction indicator.
When charting S&P500 (SPX), Nasdaq 100 Index (NDX), Nasdaq composite (IXIC) or Dow Jownes Index (DJIA), the indicator switches to Market Exposure indicator, showing also Accumulation/Distribution days when volume information is available. This indication which varies from 0% to 100% is what is shown under the M letter in the CANSLIM table which is calculated on the S&P500.
❖ Follow Through Days indicator.
If you are an adept of the Low-cheat entry, then you will be highly interested by the Follow Through days indicator as measured in the S&P 500 and shown as diamonds on the chart.
The follow-through days are calculated on S&P500 but shown in current stock chart so you don’t need to chart the S&P 500 to know that a follow through day occurred.
Follow Through days show correctly on Daily time frame and most are also shown on the Weekly time frame as well.
They are also classified according to the market zone in which they occur:
0%-5% from peak = Pullback : FT day is not shown.
5%-10% from peak = Minor Correction : Minor FT days is shown.
10%-20% from peak = Correction : Intermediate FT days us shown
20+% from peak = Bear Market : Makor FT days is shown
❖ RS Line and Rating indicator.
A RS Line and Rating indicator can be added to the chart.
Relative Strength Rating Accuracy.
Please note that the RS Rating is not 100% accurate when compared to IBD values.
❖ Earning Line indicator.
An Earning Line indicator can be added to the chart.
❖ ATR Bands and ATR Trade calculator.
The motivation for this calculator came from my own need to enter trades on volatile stocks where the simple 7% Stop Loss rule doest not work.
It simply calculates the number of shares you can buy at any moment based on current stock price and using the lower ATR band as a stop loss.
A few words about the ATR Bands.
On this indicator the ATR bands are not drawn as a classical channel that follows the price.
The lower band is drawn as a support until it’s broken on a closing basis. It can’t be in a down trend.
The upper band is drawn as a resistance until it’s broken on a closing basis. It can’t be in an up trend.
The idea is that when price starts to fall down from a peak, it should not violate its lower band ATR and that means that we can use that level as a Stop Loss.
You must look back for the stock volatility and find out which ATR multiplier works well meaning that the ATR bands are not violated on normal pullbacks. By default, the indicator uses 5x multiplier.
❖ Extra things, visual features and default settings.
The first square cell of current quarter displays a check mark ‘V’ if the CANSLIM criteria is OK or acceptable or a cross ‘X’ otherwise.
The first square cell of historical C and Rev show respectively the count of last consecutive positive quarters.
There are different color themes from “Forest” to “Space” you can chose from to best fit your eyes.
You also have different table sizes going from “Micro” to “Huge” for better adjustment to the size of your display.
The default settings view show: Pocket Pivots, FT Days, MA50, RS Line and ATR Bands.
That's all, Enjoy!

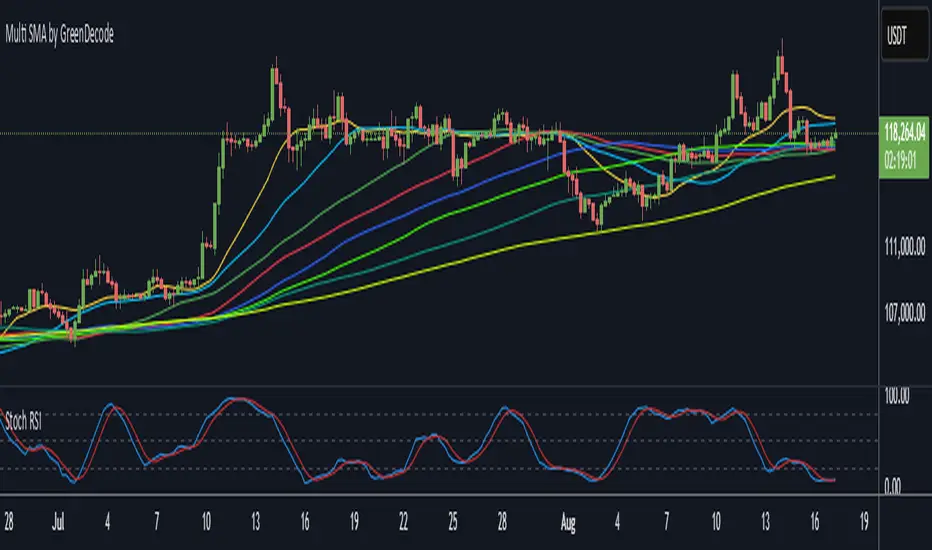
Multi SMA by GreenDecodeThis indicator, created by GreenDecode, plots eight Simple Moving Averages (SMAs) with customizable lengths and resolutions. Each SMA can be toggled on or off, and the colors are distinctly set for easy identification: SMA1 (yellow), SMA2 (cyan), SMA3 (green), SMA4 (red), SMA5 (blue), SMA6 (lightblue), SMA7 (teal), and SMA8 (gold). The SMAs are calculated to avoid repainting by using the 'lookahead=barmerge.lookahead_off' parameter, ensuring historical accuracy. Ideal for technical analysis to identify trends and potential reversal points on various timeframes.
Dual Vwap on IntradayIndicator Name: Dual VWAP on Intraday
Version: Pine Script v5
Description
This indicator plots two separate VWAP (Volume Weighted Average Price) lines on intraday charts, helping traders identify intraday trend bias and potential support/resistance zones.
The script is designed exclusively for intraday timeframes and will stop execution if used on daily or higher intervals.
🔍 How It Works
VWAP Calculation
Uses a custom function that calculates VWAP fresh for each trading session.
VWAP #1: Based on hl2 (average of high and low).
VWAP #2: Based on high price.
Dynamic Color Coding
The VWAP lines change color if the percentage change from the previous bar exceeds ±0.5%, signaling notable short-term volatility.
Otherwise, they retain their default colors:
Blue: VWAP (hl2 source)
Orange: VWAP (High source)
Intraday-Only Restriction
Prevents accidental use on higher timeframes to maintain accuracy.
📈 How to Use
Trend Confirmation: Both VWAPs above price → Bearish bias; both below → Bullish bias.
Support/Resistance: VWAP lines often act as strong intraday support or resistance.
Momentum Shift: Watch for price crossing either VWAP with strong candle bodies for potential reversals or breakouts.
Volatility Alerts: Darkened VWAP line indicates an intraday percentage change greater than 0.5%, signaling increased momentum.
⚠️ Notes
Works only on intraday timeframes (1m, 5m, 15m, etc.).
Best paired with volume and price action analysis.

RSI Z-score | Lemniscuss🧠 Introducing RSI Z-Score (RSI-Z) by Lemniscuss
🛠️ Overview
RSI Z-Score (RSI-Z) is a momentum-based market condition detector that transforms the classic Relative Strength Index (RSI) into a standardized volatility framework.
By applying Z-Score normalization to the RSI, this tool allows traders to identify statistically significant deviations in momentum — cutting through noise and highlighting high-probability turning points.
RSI-Z is optimized for trend inflection detection and overextension spotting, providing both visual clarity and actionable trade signals with dynamic labeling and optional bar coloring.
🔍 How It Works
1️⃣ RSI Foundation
The system starts with a standard RSI calculation on a user-defined source and length (default: 45).
2️⃣ Z-Score Normalization
The RSI values are standardized by subtracting their mean and dividing by the standard deviation over the same lookback.
This converts RSI into a statistical measure — revealing how many standard deviations current momentum is from its mean.
3️⃣ Threshold Logic
Two customizable thresholds define actionable zones:
• Long Threshold → Signals bullish momentum shifts when crossed upward
• Short Threshold → Signals bearish momentum shifts when crossed downward
4️⃣ Signal State Tracking
A state variable locks in a bias (Long / Short / Neutral) until an opposing trigger appears, ensuring clear and consistent market bias mapping.
✨ Key Features
🔹 Statistically Driven Momentum Detection — Moves beyond fixed RSI overbought/oversold levels by using standard deviations for adaptive accuracy.
🔹 Customizable Thresholds — Fine-tune long/short triggers for different volatility environments.
🔹 Clear Visual Feedback — Candle coloring and signal labels make trade setups instantly recognizable.
🔹 Overlay-Friendly — Works directly on your main chart or in a separate pane.
⚙️ Custom Settings
• Source: Price stream for RSI calculation (default: close)
• RSI Length: Lookback period for RSI & Z-Score (default: 45)
• Long Threshold: Z-score value for bullish signal (default: 1)
• Short Threshold: Z-score value for bearish signal (default: -1.9)
• Long/Cash Signal Labels: Toggle for "Long"/"Short" markers
• Bar Coloring: Toggle for trend-based candle coloring
📌 Trading Applications
✅ Trend Reversals → Spot statistically significant shifts in momentum before traditional RSI signals trigger
✅ Overextension Monitoring → Identify when momentum has deviated too far from the mean
✅ Mean Reversion Setups → Use extreme Z-score values as potential reversion points
✅ Bias Confirmation → Combine with trend tools for higher conviction entries/exits
📌 Conclusion
RSI-Z by Lemniscuss offers a clean, statistics-backed upgrade to the classic RSI.
By framing momentum in standard deviation terms, it empowers traders to separate normal fluctuations from truly significant market moves — making it a valuable tool for both trend traders and mean reversion specialists.
🔹 Summary Highlights
1️⃣ Statistical upgrade to RSI for higher-quality signals
2️⃣ Threshold-based, customizable long/short triggers
3️⃣ Visual candle coloring & signal labels for clarity
4️⃣ Adaptable to trend, swing, or intraday strategies
📌 Disclaimer: Past performance is not indicative of future results. No indicator guarantees profitability — always test and manage risk appropriately.

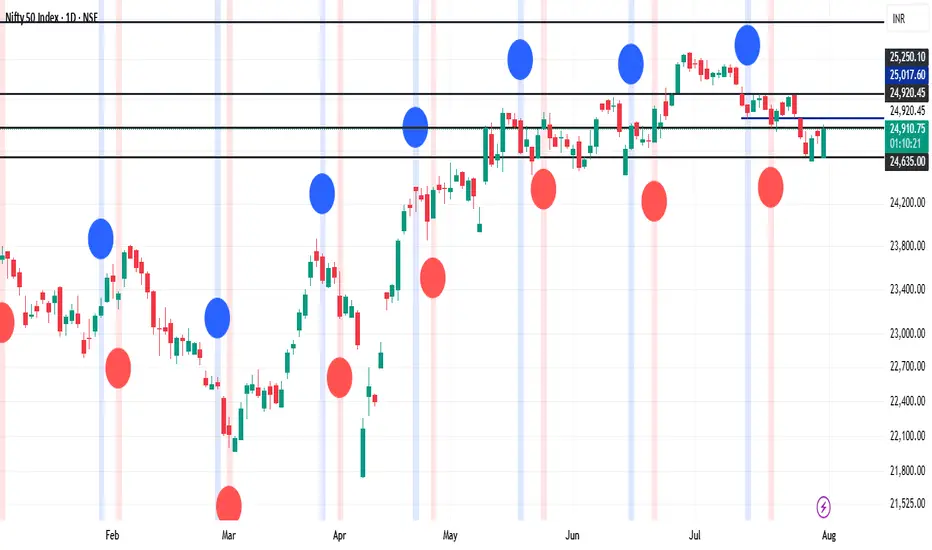
JJ Thursday Expiry Highlighter - NiftyThursday Expiry Highlighter
This indicator shades the background of all Thursday trading sessions on your chart — ideal for Nifty, Bank Nifty, and other Indian markets where the weekly options expiry typically occurs on Thursdays.
Features:
Highlights entire Thursday columns on any timeframe (intraday or daily).
Adjustable highlight color and transparency for maximum visibility without obscuring candles.
Makes expiry days stand out for quick recognition in both live trading and historical analysis.
Use Cases:
Quickly identify weekly option expiry days for planning.
Visually backtest expiry-day patterns or volatility setups.
Combine with other indicators for expiry-specific strategies.
Disclaimer:
This tool is for educational and informational purposes only. It does not provide financial advice and should not be relied upon as a sole basis for making investment decisions. Market conditions can change, and there is no guarantee of accuracy. Always do your own research and consult a licensed financial professional before trading or investing.

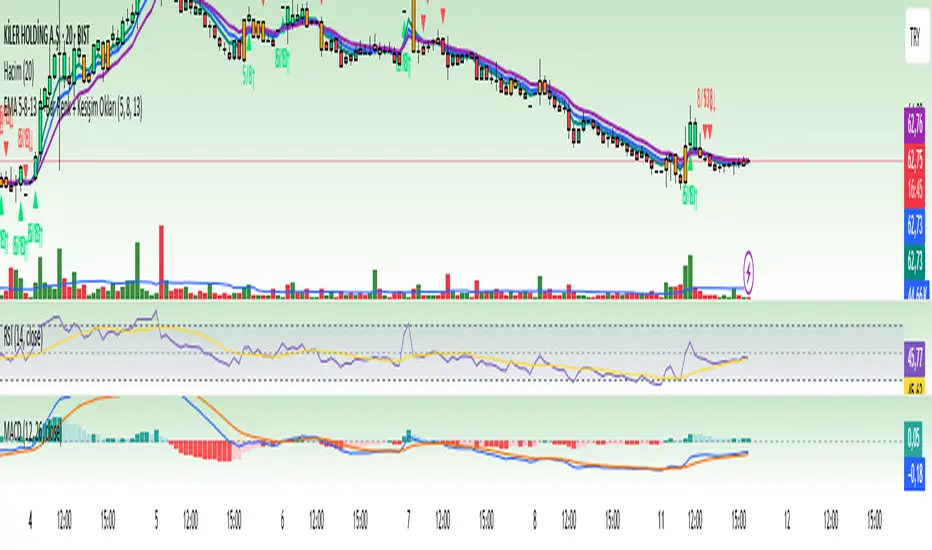
parademi 5-8-13EMA 5-8-13 Trend & Crossover Indicator
This indicator helps you identify market trends and potential reversal points in a single tool. It uses three Exponential Moving Averages (EMA 5, EMA 8, and EMA 13) to determine trend direction and highlight important crossover signals.
Features:
Trend Detection:
When the price is above all three EMAs (5, 8, and 13), candles are colored green, indicating a strong uptrend.
When the price crosses EMA 8, candles turn orange, signaling a possible short-term change in momentum.
Crossover Signals:
When EMA 5 crosses above EMA 8, a green arrow appears below the candle, suggesting a potential buy signal.
When EMA 5 crosses below EMA 8, a red arrow appears above the candle, suggesting a potential sell signal.
Optional EMA 8 and EMA 13 crossover signals can also be displayed using the same logic.
Purpose:
This indicator visually clarifies trend direction and marks potential entry/exit points. It can be used on its own or combined with other technical tools such as volume, support/resistance levels, or momentum indicators for higher accuracy.
Cumulative Volume DeltaCumulative Volume Delta (CVD) is a technical analysis indicator used in trading to measure the net buying or selling pressure in a market by tracking the difference between buying and selling volume over time. It’s particularly popular in futures, forex, and cryptocurrency trading, where volume data is critical for understanding market dynamics.
### How It Works:
- **Volume Delta**: For each price bar or time period, the volume delta is calculated as the difference between buying volume (trades executed at the ask price, indicating buyer aggression) and selling volume (trades executed at the bid price, indicating seller aggression).
- Formula: Volume Delta = Buying Volume - Selling Volume
- **Cumulative Volume Delta**: CVD sums up the volume delta over a specified period, creating a running total that reflects the overall trend of buying or selling pressure.
- If CVD is rising, it suggests stronger buying pressure (bullish sentiment).
- If CVD is falling, it indicates stronger selling pressure (bearish sentiment).
### Key Features:
1. **Divergence Analysis**: Traders use CVD to spot divergences between price movements and volume trends. For example, if the price is rising but CVD is declining, it may signal weakening bullish momentum (potential reversal).
2. **Support/Resistance Confirmation**: CVD can confirm breakouts or reversals at key price levels by showing whether volume supports the price movement.
3. **Trend Strength**: A steeply rising or falling CVD line indicates strong directional pressure, while a flat CVD suggests indecision or consolidation.
### Example:
- If a cryptocurrency like Bitcoin has 10,000 units bought at the ask and 7,000 units sold at the bid in a given period, the volume delta is +3,000. Over multiple periods, these deltas are added to form the CVD.
- A rising CVD alongside a price uptrend confirms bullish strength, while a falling CVD during a price uptrend may warn of a potential pullback.
### Limitations:
- **Data Dependency**: CVD relies on accurate bid/ask volume data, which may not be available or reliable on all platforms (e.g., some exchanges don’t provide detailed order book data).
- **Lagging Nature**: As a cumulative indicator, it may lag behind rapid price changes.
- **Context Matters**: CVD should be used with other indicators (e.g., price action, support/resistance) for better accuracy.
### Practical Use:
Traders often plot CVD as a line chart below the price chart on platforms like TradingView or Sierra Chart. It’s useful for:
- Identifying trend reversals or continuations.
- Confirming breakouts or breakdowns.
- Assessing market sentiment in low-liquidity or high-volatility markets.

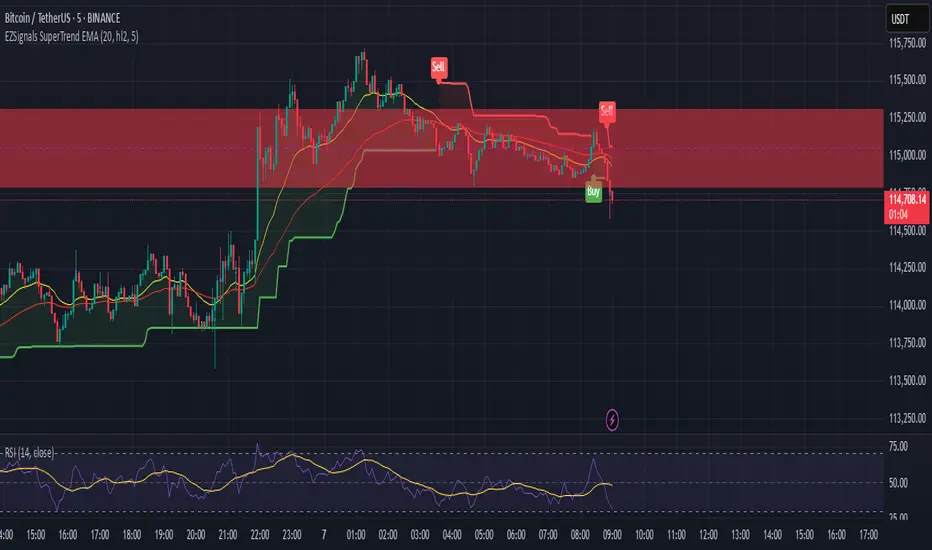
EZSignals SuperTrend EMAA technical indicator, even with high accuracy, must be rigorously backtested to assess its stability across various market conditions. Its effectiveness depends not only on the algorithm itself but also on how it is integrated into the overall trading system. Proper usage, combined with risk management and a solid understanding of market context, is essential to convert theoretical accuracy into practical trading advantage.

EZSignals SuperTrend EMAA technical indicator, even with high accuracy, must be rigorously backtested to assess its stability across various market conditions. Its effectiveness depends not only on the algorithm itself but also on how it is integrated into the overall trading system. Proper usage, combined with risk management and a solid understanding of market context, is essential to convert theoretical accuracy into practical trading advantage.
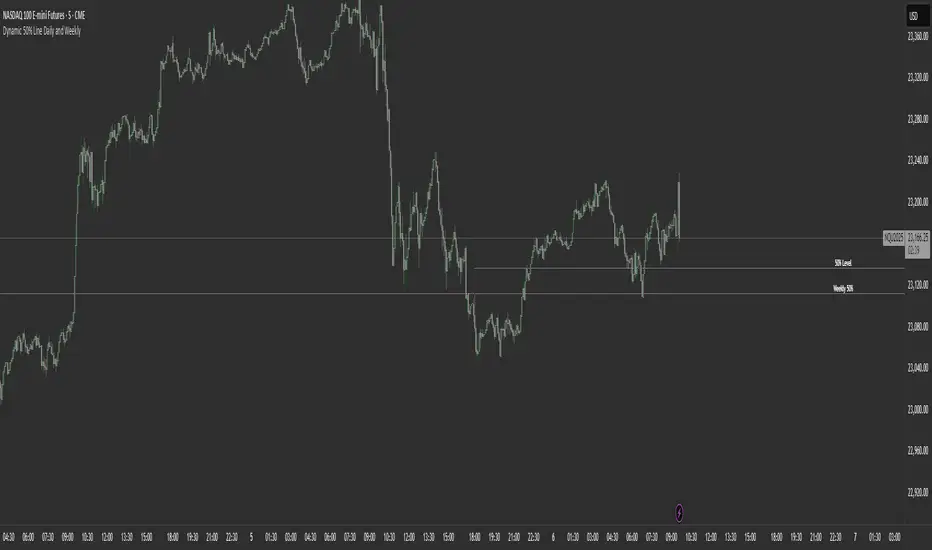
Dynamic 50% Line [Daily and Weekly Range]This indicator automatically plots the 50% retracement level (midpoint) of the daily and weekly trading ranges. It helps traders identify key support/resistance zones where price may react, offering insights into potential reversal or continuation areas.
Auction Market Theory & the 50% Level
At its core, this indicator is built on Auction Market Theory (AMT), which views price movement as an ongoing auction process where buyers and sellers compete to establish value. The 50% midpoint represents fair value—the equilibrium where price is most likely to balance before continuing its trend or reversing.
When price deviates too far from this level, it often returns to balance (mean reversion) or accepts new value (breakout). By tracking the daily and weekly 50% lines, traders can:
Identify high-probability reversal zones (where price may reject fair value).
Spot trend continuation areas (where price accepts higher/lower value).
Align with institutional order flow, as large players often use these levels for execution.
This makes the indicator particularly powerful for traders who follow volume profile, order flow, or ICT concepts, as it visually maps the market’s ongoing auction process.
Features:
✅ Automated Daily & Weekly Midpoints – Calculates the 50% level from the high/low of each session.
✅ Customizable Line Styles – Choose between solid, dotted, or dashed lines for better visibility.
✅ Clear Labeling – Optional text labels show "50% Level" or custom text at your preferred position (left, middle, or right).
✅ Flexible Styling – Adjust line colors, thickness, and text size to match your chart theme.
How It Works:
Daily 50% Line: Resets at 6 PM NY time (new trading day).
Weekly 50% Line: Resets on Sunday at 6 PM NY time (new trading week).
The midpoint is calculated as:
(High + Low) / 2
Lines extend 500 bars forward for easy visibility.
Why Use This Indicator?
Unlike static Fibonacci tools, this dynamic indicator auto-updates the 50% level as new highs/lows form, saving time and improving accuracy. Whether you trade forex, stocks, or crypto, these levels often act as strong magnets for price action.
Day Trading Strategy (With Risk Management)This is a day trading strategy based on fast and slow EMA crossovers combined with RSI filtering to enhance trade accuracy. Designed for intraday use, it generates buy signals when the fast EMA crosses above the slow EMA and sell signals when it crosses below, but only if the RSI confirms momentum is favorable to avoid false entries in choppy markets.
The strategy includes built-in risk management with configurable stop-loss and take-profit levels set at 1% by default, helping to limit losses and secure profits quickly within the trading day. Clear buy and sell signals are plotted on the chart, and alerts notify traders in real time when trading opportunities arise.
Ideal for short-term traders, this system provides a disciplined, mechanical approach to capturing intraday trends with momentum confirmation and essential risk controls. It is fully customizable to fit different day trading instruments, timeframes, and risk appetites.

Hunting Bollinger Bands for scalping📌 Bollinger Band Reversal BUY/SELL Indicator
Name: Hunting Bollinger Bands for scalping
Purpose: Displays reversal signals for short-term scalping in range-bound markets.
Target Users: Scalpers and day traders, especially for trading Gold (XAU/USD).
Recommended Target: Works well for scalping approximately $3 price movements on Gold.
Core Logic:
Detects excessive price deviation using Bollinger Bands (±2σ).
Filters out excessive signals with a bar interval limiter.
Displays clear and simple BUY/SELL labels for entry timing.
📌 Signal Conditions
BUY
Price closes below the Lower Bollinger Band.
At least the specified number of bars has passed since the previous signal.
Displays a “BUY” label below the bar.
SELL
Price closes above the Upper Bollinger Band.
At least the specified number of bars has passed since the previous signal.
Displays a “SELL” label above the bar.
📌 Parameters
Parameter Description Default
Bollinger Band Length (bbLength) Period for Bollinger Band calculation 20
Standard Deviation (bbStdDev) Standard deviation multiplier for band width 2.0
Signal Interval (barLimit) Minimum bar interval to avoid repeated signals 10
📌 How to Use
Add the indicator to your chart; Bollinger Bands and BUY/SELL labels will appear.
When a signal appears, confirm price reaction and enter a scalp trade (around $3 for Gold is recommended).
Adjust the “Signal Interval (barLimit)” to control signal frequency.
Avoid using it during high-impact news events or strong trending markets.
📌 Best Market Conditions
Range-bound markets
Scalping small price movements (~$3)
Low-volatility sessions (e.g. Asian session for Gold)
📌 Notes
May generate frequent signals during strong trends, leading to potential losses.
Can be combined with other indicators (e.g. 200 MA, RSI, VWAP) for higher accuracy.
Signals are for reference only and should not be used as the sole trading decision factor.
📌 ボリンジャーバンド逆張りBUY/SELL インジケーター解説
名前:Hunting Bollinger Bands for scalping
目的:レンジ相場での短期的な反発を狙った逆張りシグナルを表示
対象ユーザー:スキャルピングやデイトレードで、特にゴールド(XAU/USD)での小幅な値動きを狙うトレーダー
推奨利幅:ゴールドでおよそ 3ドル前後 を目安にスキャルピングを行うと有効
メインロジック:
ボリンジャーバンド(±2σ)で過剰な価格乖離を検出
バー間隔フィルターで過剰シグナルを制御
BUY/SELLラベルで視覚的にシンプルなエントリーポイントを表示
📌 シグナル条件
BUY(買いシグナル)
現在価格が ボリンジャーバンド下限(Lower Band)を下回った時
前回シグナルから指定したバー数以上経過
この条件を満たした場合、ローソク足下に「BUY」ラベルを表示します。
SELL(売りシグナル)
現在価格が ボリンジャーバンド上限(Upper Band)を上回った時
前回シグナルから指定したバー数以上経過
この条件を満たした場合、ローソク足上に「SELL」ラベルを表示します。
📌 パラメータ
項目 説明 初期値
ボリンジャーバンド期間 (bbLength) ボリンジャーバンド計算の期間 20
標準偏差 (bbStdDev) バンド幅を決める標準偏差 2.0
シグナル間隔 (barLimit) シグナルの連続表示を防止する最小バー間隔 10
📌 使い方
インジケーターをチャートに追加すると、ボリンジャーバンドとBUY/SELLラベルが表示されます
シグナルが出たら、反発確認後にスキャルピングエントリー(ゴールドなら約3ドルを目安に)
「シグナル間隔(barLimit)」を調整して、シグナルの過剰表示を防ぐ
経済指標発表や強いトレンド発生時は使用を控える
📌 このインジケーターが向いている相場
レンジ相場
小さな値幅(約3ドル前後)を狙うスキャルピング
トレンドが弱い横ばいの時間帯(例:アジア時間のゴールドなど)
📌 注意点
強いトレンド相場では、逆張りシグナルが連続的に発生し、損切りが増える可能性あり
200MAやRSI、VWAPなど他の指標と組み合わせることで精度を高められる
シグナルは参考用であり、単独での売買判断は推奨されない

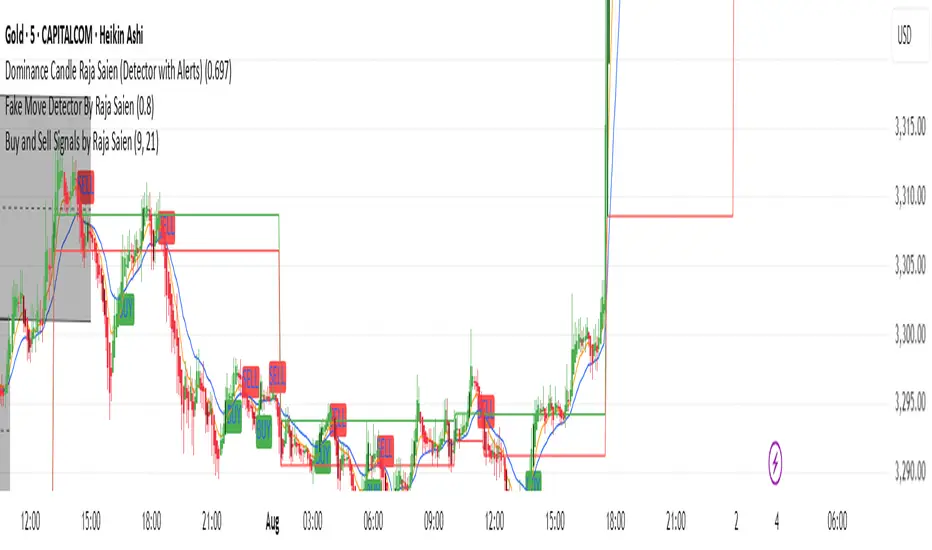
Buy and Sell Signals by Raja Saien📈 Buy and Sell Signals by Raja Saien 💹
"Simple. Clean. Powerful."
🔥 This indicator is built for those who believe in price action and clarity. No confusion, no clutter — just pure EMA crossover logic to catch early trends and filter false moves.
✅ Buy Signal when the 9 EMA crosses above the 21 EMA — indicating momentum shift to the upside.
❌ Sell Signal when the 9 EMA crosses below the 21 EMA — signaling potential downside momentum.
🧠 Designed for traders who trust the trend, respect momentum, and want to stay ahead of the crowd.
🔍 Perfect for scalping, intraday, and swing trading. Combine it with support/resistance or price action zones for even more 🔥 accuracy.
✨ Created by Raja Saien — for serious traders only.
💪 "Indicators don’t make you money, but discipline with clarity does."
Recession Warning Model [BackQuant]Recession Warning Model
Overview
The Recession Warning Model (RWM) is a Pine Script® indicator designed to estimate the probability of an economic recession by integrating multiple macroeconomic, market sentiment, and labor market indicators. It combines over a dozen data series into a transparent, adaptive, and actionable tool for traders, portfolio managers, and researchers. The model provides customizable complexity levels, display modes, and data processing options to accommodate various analytical requirements while ensuring robustness through dynamic weighting and regime-aware adjustments.
Purpose
The RWM fulfills the need for a concise yet comprehensive tool to monitor recession risk. Unlike approaches relying on a single metric, such as yield-curve inversion, or extensive economic reports, it consolidates multiple data sources into a single probability output. The model identifies active indicators, their confidence levels, and the current economic regime, enabling users to anticipate downturns and adjust strategies accordingly.
Core Features
- Indicator Families : Incorporates 13 indicators across five categories: Yield, Labor, Sentiment, Production, and Financial Stress.
- Dynamic Weighting : Adjusts indicator weights based on recent predictive accuracy, constrained within user-defined boundaries.
- Leading and Coincident Split : Separates early-warning (leading) and confirmatory (coincident) signals, with adjustable weighting (default 60/40 mix).
- Economic Regime Sensitivity : Modulates output sensitivity based on market conditions (Expansion, Late-Cycle, Stress, Crisis), using a composite of VIX, yield-curve, financial conditions, and credit spreads.
- Display Options : Supports four modes—Probability (0-100%), Binary (four risk bins), Lead/Coincident, and Ensemble (blended probability).
- Confidence Intervals : Reflects model stability, widening during high volatility or conflicting signals.
- Alerts : Configurable thresholds (Watch, Caution, Warning, Alert) with persistence filters to minimize false signals.
- Data Export : Enables CSV output for probabilities, signals, and regimes, facilitating external analysis in Python or R.
Model Complexity Levels
Users can select from four tiers to balance simplicity and depth:
1. Essential : Focuses on three core indicators—yield-curve spread, jobless claims, and unemployment change—for minimalistic monitoring.
2. Standard : Expands to nine indicators, adding consumer confidence, PMI, VIX, S&P 500 trend, money supply vs. GDP, and the Sahm Rule.
3. Professional : Includes all 13 indicators, incorporating financial conditions, credit spreads, JOLTS vacancies, and wage growth.
4. Research : Unlocks all indicators plus experimental settings for advanced users.
Key Indicators
Below is a summary of the 13 indicators, their data sources, and economic significance:
- Yield-Curve Spread : Difference between 10-year and 3-month Treasury yields. Negative spreads signal banking sector stress.
- Jobless Claims : Four-week moving average of unemployment claims. Sustained increases indicate rising layoffs.
- Unemployment Change : Three-month change in unemployment rate. Sharp rises often precede recessions.
- Sahm Rule : Triggers when unemployment rises 0.5% above its 12-month low, a reliable recession indicator.
- Consumer Confidence : University of Michigan survey. Declines reflect household pessimism, impacting spending.
- PMI : Purchasing Managers’ Index. Values below 50 indicate manufacturing contraction.
- VIX : CBOE Volatility Index. Elevated levels suggest market anticipation of economic distress.
- S&P 500 Growth : Weekly moving average trend. Declines reduce wealth effects, curbing consumption.
- M2 + GDP Trend : Monitors money supply and real GDP. Simultaneous declines signal credit contraction.
- NFCI : Chicago Fed’s National Financial Conditions Index. Positive values indicate tighter conditions.
- Credit Spreads : Proxy for corporate bond spreads using 10-year vs. 2-year Treasury yields. Widening spreads reflect stress.
- JOLTS Vacancies : Job openings data. Significant drops precede hiring slowdowns.
- Wage Growth : Year-over-year change in average hourly earnings. Late-cycle spikes often signal economic overheating.
Data Processing
- Rate of Change (ROC) : Optionally applied to capture momentum in data series (default: 21-bar period).
- Z-Score Normalization : Standardizes indicators to a common scale (default: 252-bar lookback).
- Smoothing : Applies a short moving average to final signals (default: 5-bar period) to reduce noise.
- Binary Signals : Generated for each indicator (e.g., yield-curve inverted or PMI below 50) based on thresholds or Z-score deviations.
Probability Calculation
1. Each indicator’s binary signal is weighted according to user settings or dynamic performance.
2. Weights are normalized to sum to 100% across active indicators.
3. Leading and coincident signals are aggregated separately (if split mode is enabled) and combined using the specified mix.
4. The probability is adjusted by a regime multiplier, amplifying risk during Stress or Crisis regimes.
5. Optional smoothing ensures stable outputs.
Display and Visualization
- Probability Mode : Plots a continuous 0-100% recession probability with color gradients and confidence bands.
- Binary Mode : Categorizes risk into four levels (Minimal, Watch, Caution, Alert) for simplified dashboards.
- Lead/Coincident Mode : Displays leading and coincident probabilities separately to track signal divergence.
- Ensemble Mode : Averages traditional and split probabilities for a balanced view.
- Regime Background : Color-coded overlays (green for Expansion, orange for Late-Cycle, amber for Stress, red for Crisis).
- Analytics Table : Optional dashboard showing probability, confidence, regime, and top indicator statuses.
Practical Applications
- Asset Allocation : Adjust equity or bond exposures based on sustained probability increases.
- Risk Management : Hedge portfolios with VIX futures or options during regime shifts to Stress or Crisis.
- Sector Rotation : Shift toward defensive sectors when coincident signals rise above 50%.
- Trading Filters : Disable short-term strategies during high-risk regimes.
- Event Timing : Scale positions ahead of high-impact data releases when probability and VIX are elevated.
Configuration Guidelines
- Enable ROC and Z-score for consistent indicator comparison unless raw data is preferred.
- Use dynamic weighting with at least one economic cycle of data for optimal performance.
- Monitor stress composite scores above 80 alongside probabilities above 70 for critical risk signals.
- Adjust adaptation speed (default: 0.1) to 0.2 during Crisis regimes for faster indicator prioritization.
- Combine RWM with complementary tools (e.g., liquidity metrics) for intraday or short-term trading.
Limitations
- Macro indicators lag intraday market moves, making RWM better suited for strategic rather than tactical trading.
- Historical data availability may constrain dynamic weighting on shorter timeframes.
- Model accuracy depends on the quality and timeliness of economic data feeds.
Final Note
The Recession Warning Model provides a disciplined framework for monitoring economic downturn risks. By integrating diverse indicators with transparent weighting and regime-aware adjustments, it empowers users to make informed decisions in portfolio management, risk hedging, or macroeconomic research. Regular review of model outputs alongside market-specific tools ensures its effective application across varying market conditions.

Range Filter Strategy [Real Backtest]Range Filter Strategy - Real Backtesting
# Overview
Advanced Range Filter strategy designed for realistic backtesting with precise execution timing and comprehensive risk management. Built specifically for cryptocurrency markets with customizable parameters for different assets and timeframes.
Core Algorithm
Range Filter Technology:
- Smooth Average Range calculation using dual EMA filtering
- Dynamic range-based price filtering to identify trend direction
- Anti-noise filtering system to reduce false signals
- Directional momentum tracking with upward/downward counters
Key Features
Real-Time Execution (No Delay)
- Process orders on tick: Immediate execution without waiting for bar close
- Bar magnifier integration for intrabar precision
- Calculate on every tick for maximum responsiveness
- Standard OHLC bypass for enhanced accuracy
Realistic Price Simulation
- HL2 entry pricing (High+Low)/2 for realistic fills
- Configurable spread buffer simulation
- Random slippage generation (0 to max slippage)
- Market liquidity validation before entry
Advanced Signal Filtering
- Volume-based filtering with customizable ratio
- Optional signal confirmation system (1-3 bars)
- Anti-repetition logic to prevent duplicate signals
- Daily trade limit controls
Risk Management
- Fixed Risk:Reward ratios with precise point calculation
- Automatic stop loss and take profit execution
- Position size management
- Maximum daily trades limitation
Alert System
- Real-time alerts synchronized with strategy execution
- Multiple alert types: Setup, Entry, Exit, Status
- Customizable message formatting with price/time inclusion
- TradingView alert panel integration
Default Parameters
Optimized for BTC 5-minute charts:
- Sampling Period: 100
- Range Multiplier: 3.0
- Risk: 50 points
- Reward: 100 points (1:2 R:R)
- Spread Buffer: 2.0 points
- Max Slippage: 1.0 points
Signal Logic
Long Entry Conditions:
- Price above Range Filter line
- Upward momentum confirmed
- Volume requirements met (if enabled)
- Confirmation period completed (if enabled)
- Daily trade limit not exceeded
Short Entry Conditions:
- Price below Range Filter line
- Downward momentum confirmed
- Volume requirements met (if enabled)
- Confirmation period completed (if enabled)
- Daily trade limit not exceeded
Visual Elements
- Range Filter line with directional coloring
- Upper and lower target bands
- Entry signal markers
- Risk/Reward ratio boxes
- Real-time settings dashboard
Customization Options
Market Adaptation:
- Adjust Sampling Period for different timeframes
- Modify Range Multiplier for various volatility levels
- Configure spread/slippage for different brokers
- Set appropriate R:R ratios for trading style
Filtering Controls:
- Enable/disable volume filtering
- Adjust confirmation requirements
- Set daily trade limits
- Customize alert preferences
Performance Features
- Realistic backtesting results aligned with live trading
- Elimination of look-ahead bias
- Proper order execution simulation
- Comprehensive trade statistics
Alert Configuration
Alert Types Available:
- Entry signals with complete trade information
- Setup alerts for early preparation
- Exit notifications for position management
- Filter direction changes for market context
Message Format:
Symbol - Action | Price: XX.XX | Stop: XX.XX | Target: XX.XX | Time: HH:MM
Usage Recommendations
Optimal Settings:
- Bitcoin/Major Crypto: Default parameters
- Forex: Reduce sampling period to 50-70, multiplier to 2.0-2.5
- Stocks: Reduce sampling period to 30-50, multiplier to 1.0-1.8
- Gold: Sampling period 60-80, multiplier 1.5-2.0
TradingView Configuration:
- Recalculate: "On every tick"
- Orders: "Use bar magnifier"
- Data: Real-time feed recommended
Risk Disclaimer
This strategy is designed for educational and analytical purposes. Past performance does not guarantee future results. Always test thoroughly on paper trading before live implementation. Consider market conditions, broker execution, and personal risk tolerance when using any automated trading system.
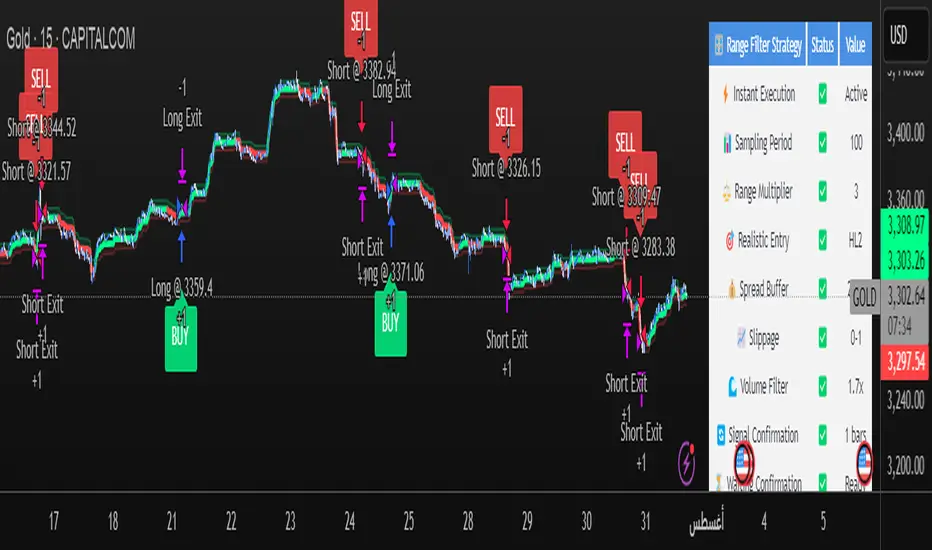
Best Settings Found for Gold 15-Minute Timeframe
After extensive testing and optimization, these are the most effective settings I've discovered for trading Gold (XAUUSD) on the 15-minute timeframe:
Core Filter Settings:
Sampling Period: 100
Range Multiplier: 3.0
Professional Execution Engine:
Realistic Entry: Enabled (HL2)
Spread Buffer: 2 points
Dynamic Slippage: Enabled with max 1 point
Volume Filter: Enabled at 1.7x ratio
Signal Confirmation: Enabled with 1 bar confirmation
Risk Management:
Stop Loss: 50 points
Take Profit: 100 points (2:1 Risk-Reward)
Max Trades Per Day: 5
These settings provide an excellent balance between signal accuracy and realistic market execution. The volume filter at 1.7x ensures we only trade during periods of sufficient market activity, while the 1-bar confirmation helps filter out false signals. The spread buffer and slippage settings account for real trading costs, making backtest results more realistic and achievable in live trading.
Momentum Oscillator ModifiedThis indicator is a custom momentum oscillator enhanced with True Range-adjusted price logic and dynamic Bollinger Bands, offering a refined way to track price strength, momentum shifts, and overbought/oversold extremes with reduced noise.
Key Features:
Dynamic Price Oscillator:
Measures momentum using both price change and a volatility-adjusted price for greater accuracy.
Smoothing factor lets you fine-tune the balance between responsiveness and noise filtering.
True Range-Based Volatility Adjustment:
Integrates true range calculations to adapt to current volatility, making signals more robust during different market conditions.
Adaptive Bollinger Bands:
Two sets of custom Bollinger Bands (standard and expanded) are drawn around the oscillator, adapting over time.
These bands help identify when momentum is exceptionally strong or weak relative to recent history.
Special fills dynamically highlight when the oscillator breaks above/below the bands, signaling potential trend extremes.
Customization:
Easily adjust lookback length and smoothing factor to fit your personal trading style (e.g., scalping or swing trading).
How to Use:
Watch for the oscillator crossing above the green Bollinger Bands or below the red bands for potential overbought/oversold or breakout scenarios.
Expanded bands provide a "super extreme" zone which may hint at exhaustion or trend climax.
The dynamic mean (black line) gives a visual reference for the normalized momentum level.

ALPHA 999This indicator is designed to provide traders with clear and reliable signals by combining essential technical tools into one simplified framework. Whether you’re trading crypto, stocks, or forex, this tool helps identify potential entry and exit points using . It is well-suited for both intraday and swing traders, offering customizable inputs, multi-timeframe compatibility, and real-time alerts. The indicator displays intuitive visual cues directly on the chart, making it easy to interpret market conditions and respond quickly. Ideal for traders who prefer clean charts with actionable signals, this tool enhances decision-making without overwhelming complexity. While powerful on its own, it can be paired with other indicators for greater confirmation and accuracy. Please note: this indicator is for educational purposes only and should be used with proper risk management and backtesting before applying to live trades.
BarUtils: Get Bar Index from DateLibrary "BarUtils"
getBarIndexFromDate(targetTimestamp)
Parameters:
targetTimestamp (int)
**Description**:
This utility provides a reliable way to calculate the `bar_index` of a specific calendar date, regardless of chart resolution. It's especially useful for anchoring scripts to historical events, labeling macroeconomic moments, or marking custom time-based signals that must remain consistent across timeframes.
Unlike hardcoded `bar_index - N` approaches, this function dynamically estimates the number of bars between a given `timestamp()` and the current bar using the actual time-per-bar (`time - time `). It works correctly on intraday, daily, weekly, and monthly charts.
### 💡 **Function Provided**:
import TradeTitan120/BarUtils/1
* `getBarIndexFromDate(int targetTimestamp)`
→ Returns the estimated `bar_index` that aligns with a given timestamp
### ✅ **Use Cases**:
* Marking past events like FOMC meetings, market crashes, or personal signals
* Backtesting entry/exit conditions from specific calendar dates
* Anchoring visual elements (shapes, lines, labels) across resolutions
This tool is simple, fast, and built for accuracy. Use it to enhance multi-timeframe compatibility in any script.
4H Bollinger Breakout StrategyThis strategy leverages Bollinger Bands on the 4-hour timeframe for long and short trades in trending or ranging markets. Entries trigger on BB breakouts with optional filters for volume, trend, and RSI. Exits occur on opposite BB crosses. Customizable for long-only, short-only, or indicator mode via code comments. Supports forex, stocks, or crypto with full equity allocation and 0.1% commission.
Length (Default: 20): Period for BB basis and std dev; shorter for sensitivity, longer for smoothing.
Basis MA Type (Default: SMA): Selects MA for middle band (SMA, EMA, etc.); EMA for faster response.
Source (Default: Close): Price input for calculations; use close for standard accuracy.
StdDev Multiplier (Default: 1.8): Band width control; higher for fewer signals, lower for more.
Offset (Default: 0): Shifts BB plots; typically unchanged.
Use Filters (Default: True): Applies volume, trend, RSI checks to filter signals.
Volume MA Length (Default: 20): For volume filter (long: >105% avg, short: >120%).
Trend MA Length (Default: 80): SMA for trend filter (long: above MA, short: below).
RSI Length (Default: 14): For short filter (entry if RSI <85).
Use Long/Short Signals (Defaults: True): Toggles directions; long entry on lower BB crossover, short on upper crossunder.
Visuals: BB plots (blue basis, red upper, green lower), orange trend MA, filled background.
Labels/Alerts: Green/red for long entry/exit, yellow/purple for short; alert conditions included.

EUR/USD Multi-Layer Statistical Regression StrategyStrategy Overview
This advanced EUR/USD trading system employs a triple-layer linear regression framework with statistical validation and ensemble weighting. It combines short, medium, and long-term regression analyses to generate high-confidence directional signals while enforcing strict risk controls.
Core Components
Multi-Layer Regression Engine:
Parallel regression analysis across 3 customizable timeframes (short/medium/long)
Projects future price values using prediction horizons
Statistical significance filters (R-squared, correlation, slope thresholds)
Signal Validation System:
Lookback validation tests historical prediction accuracy
Ensemble weighting of layer signals (adjustable influence per timeframe)
Confidence scoring combining statistical strength, layer agreement, and validation accuracy
Risk Management:
Position sizing scaled by signal confidence (1%-100% of equity)
Daily loss circuit breaker (halts trading at user-defined threshold)
Forex-tailored execution (pip slippage, percentage-based commissions)
Visual Intelligence:
Real-time regression line plots (3 layered colors)
Projection markers for short-term forecasts
Background coloring for market bias indication
Comprehensive statistics dashboard (R-squared metrics, validation scores, P&L)
Key Parameters
Category Settings
Regression Short/Med/Long lengths (20/50/100 bars)
Statistics Min R² (0.65), Correlation (0.7), Slope (0.0001)
Validation 30-bar lookback, 10-bar projection
Risk Controls 50% position size, 12% daily loss limit, 75% confidence threshold
Trading Logic
Entries require:
Ensemble score > |0.5|
Confidence > threshold
Short & medium-term significance
Active daily loss limit not breached
Exits triggered by:
Opposite high-confidence signals
Daily loss limit violation (emergency exit)
The strategy blends quantitative finance techniques with practical trading safeguards, featuring a self-optimizing design where signal quality directly impacts position sizing. The visual dashboard provides real-time feedback on model performance and market conditions.

Breakout + Retest StrategyThe Breakout + Retest Strategy is a proven price action approach used by professional traders to catch high-probability market moves after key levels are broken. This strategy aims to enter the market after confirmation — reducing false breakouts and improving entry accuracy.
🔍 Strategy Logic:
Identify a Key Support or Resistance Level
These could be recent swing highs/lows, consolidation zones, or session highs.
Wait for a Clean Breakout
Price must decisively break above resistance or below support with strong momentum.
Watch for the Retest
After the breakout, wait for the price to pull back to the broken level (now flipped support/resistance).
Enter on Retest Confirmation
Look for signs like rejection wicks, bullish/bearish engulfing candles, or strong volume on the retest.
Set Risk-Managed Stops and Targets
Stop loss goes below (for long) or above (for short) the retested level.
Target is usually set at a 1:2 or higher risk-to-reward ratio, or based on structure.
✅ Why It Works:
Filters out fake breakouts
Uses market structure and liquidity traps to your advantage
Combines both momentum and confirmation
⚙️ Best Timeframes:
15-minute to 1-hour for intraday setups
4-hour and daily for swing trades
📊 Ideal for:
Futures (NQ, ES, Gold)
Forex pairs
Crypto
Stocks near key earnings or breakout zones
