Smart Impulse Exhaustion Finder (ATR + ADX Filter)📌 Purpose
This indicator detects potential exhaustion of strong bullish or bearish impulses at fresh swing highs/lows by combining multiple price action and volatility-based filters.
🧠 How It Works
A signal is triggered only when all core conditions are satisfied:
1. Swing High/Low Detection
Current high (or low) must be the highest (or lowest) over the last Extremum Lookback bars (default: 50).
This ensures the move is significant relative to recent price action.
2. Impulse Confirmation
Price must extend by at least 1 × ATR from the previous swing point.
This filters out minor fluctuations.
3. Exhaustion Conditions (at least 2 out of 3 must be met)
RSI Extreme: RSI > Overbought Level (default: 80) for bearish signals, RSI < Oversold Level (default: 20) for bullish signals.
Volume Spike: Volume > SMA(Volume, Volume SMA Length) × Volume Spike Multiplier.
Candle Wick Rejection: Upper wick ≥ Wick Threshold % for bearish setups, Lower wick ≥ Wick Threshold % for bullish setups.
4. Trend Filter
ADX > ADX Threshold ensures the market is trending and filters out sideways conditions.
5. Candle Body Filter
Candle body must be ≥ Body Size ATR Factor × ATR.
This avoids weak signals from small candles or doji formations.
📈 How to Use
Bearish Signal:
Appears at fresh swing highs with exhaustion conditions met. Useful for tightening stops, taking partial profits, or counter-trend shorts.
Bullish Signal:
Appears at fresh swing lows with exhaustion conditions met. Useful for trailing stops, profit-taking, or counter-trend longs.
Recommended Timeframes: Works best on 1h, 4h, and Daily charts.
Markets: Crypto, Forex, Stocks — wherever volatility and trends are present.
⚙️ Inputs
RSI Length / Overbought / Oversold
Volume SMA Length & Volume Spike Multiplier
Wick Threshold %
Extremum Lookback (bars for highs/lows)
ADX Length & Threshold
Body Size ATR Factor
⚠️ Disclaimer
This script is for educational purposes only and does not constitute financial advice.
Always test thoroughly and apply proper risk management before live trading.
💡 Tip: Combine this tool with your own market context and confluence factors for higher probability setups.
Cerca negli script per "adx"

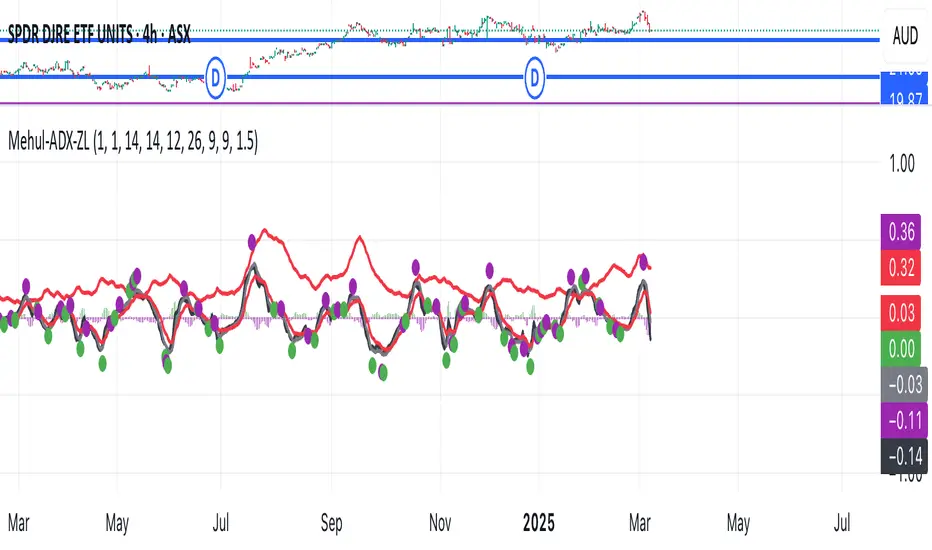
Mehul - ADX Zero LagThis script combines two popular technical indicators into a single visualization:
1. **Average Directional Index (ADX)**:
- Measures trend strength on a scale from 0-100 (now normalized to 0-1 by dividing by 100)
- Displayed as a red line
- Adjustable smoothing and length parameters
2. **Zero Lag MACD (Modified Moving Average Convergence Divergence)**:
- An enhanced version of the traditional MACD with reduced lag
- Shows the relationship between fast and slow moving averages
- Main components include:
- MACD line (black)
- Signal line (gray)
- Histogram (green for positive, purple for negative)
- EMA of the MACD line (red)
- Optional crossing dots
Key features of the combined indicator:
- **Scale Adjustment**: Both indicators can be scaled independently (adxScale and macdScale parameters)
- **Visibility Toggles**: Each indicator can be shown or hidden
- **Advanced Customization**: Parameters for both indicators can be fine-tuned
- **Algorithm Selection**: Option to choose between the "Glaz" algorithm or the "real" zero lag algorithm
- **Display Options**: Toggles for visualization elements like crossing dots
The most significant technical aspect is that both indicators are displayed in the same pane with compatible scaling, achieved by normalizing the ADX values and applying user-defined scale factors to both indicators.
This combined indicator is designed to give traders a comprehensive view of both trend strength (from ADX) and momentum/direction (from Zero Lag MACD) in a single, easy-to-read visualization.
Buy Only Strategy with Dynamic Re-Entry and ExitThe strategy aims to create a simple buy-only trading system based on moving average crossovers and the Weekly Commodity Channel Index (CCI) or Weekly Average Directional Index (ADX). It generates buy signals when the fast-moving average crosses above the slow-moving average and when the Weekly CCI and or Weekly ADX meet the specified conditions.
The strategy also allows for dynamic re-entry, which means it can open new long positions if the price goes above the three moving averages after an exit. However, the strategy will exit the long position if the price closes below the third moving average.
ENTRY CONDITIONS
The script defines the conditions for generating buy signals. It checks for two conditions for a valid buy signal:
• If the fast-moving average crosses above the slow-moving average -THERE IS Dynamic Re-Entry also
• If the user chooses HE OR SHE CAN FILTER TRADES BY USING CCI OR ADX
Dynamic Re-Entry:
the script allows for dynamic re-entry. If there is no active long position and the price is above all three moving averages a new long position is opened.
Exit Conditions
The script defines the exit condition for closing a long position. If the price closes below the third moving average, the script closes the long position.
IMPORTANT NOTICE
ONLY DAILY TIME FRAME
THERE WOULD BE WHIPSAW USE YOUR OWN ACCUMEN TO MINIMISE THEM
ITS ONLY BUY STRATEGY
EXIT CAN BE STRATEGY BASED OR SET PROFIT AND TARGETS AS PER RISK APETITE /RISK MANAGEMENT
DONT TRADE OPTIONS ON THIS
SUITABLE FOR STOCKS OF USA AND INDIAN MARKETS
ALWAYS REMEMBER TO DO YOUR OWN RESEARCH BEFORE TRADING AND INVESTING

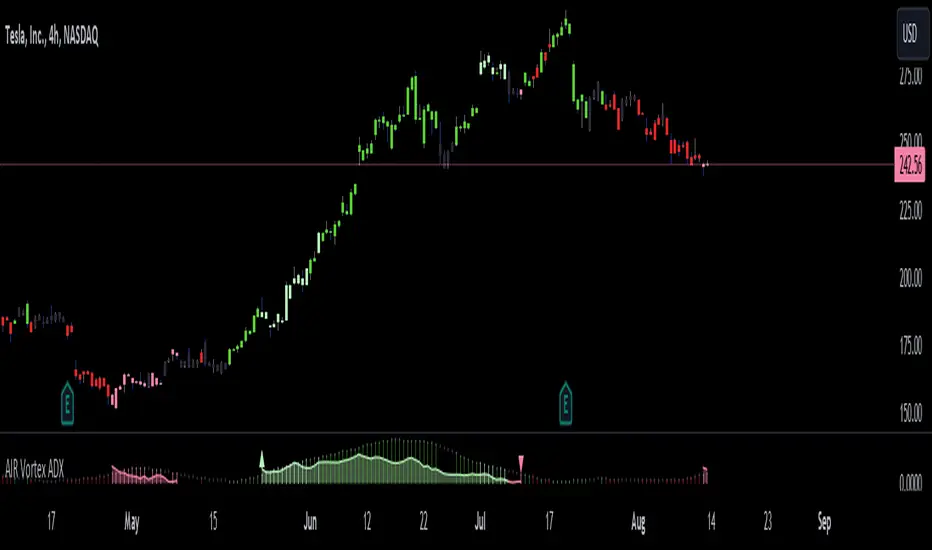
AIR Vortex ADXThis project started as an effort to improve the user interface of the hybrid indicator ADX of Vortex, which is, as per the name, a blend of ADX and Vortex Indicator. Plotting both indicators on the same polarity and normalising the vortex, a better interpretation of the interaction between the two is possible, and trend becomes apparent.
Basically, the Vortex provides the bright punch and ADX the continuation of the trend and momentum.
A range mixer has been added to the vortex, comprising both true and interpercentile ranges (see my previous script for a desrciption of interpercentile range). Users can activate and add amounts of each as they see fit.
Finally, there is an RSI filter, the idea of which is to filter out ranging (flat) markets, where no distinct direction is yet emerging.
Trend Momentum SynthesizerBy analyzing the MACD (Moving Average Convergence Divergence) and Squeeze Momentum indicators, this indicator helps identify potential bullish, bearish, or undecided market conditions.
The algorithm within considers the positions of the MACD and Squeeze Momentum indicators to determine the overall market sentiment. When the indicators align and indicate a bullish market condition, the indicator's plot color will be either dark green, green, yellow, or lime, indicating a potential bullish trend. Conversely, if the indicators align and indicate a bearish market condition, the plot color will be maroon or red, denoting a potential bearish trend. When the indicators are inconclusive, the plot color will be orange, suggesting an undecided market.
The ADX is an addon component of this indicator, helping to assess the strength of a trend. By analyzing the ADX, the indicator determines whether a trend is strong enough, providing additional confirmation for potential trade signals. The ADX smoothing and DI (Directional Index) length parameters can be customized to suit individual trading preferences.
By combining these indicators, the algorithm provides traders with a comprehensive view of the market, helping them make informed trading decisions. It aims to assist traders in identifying potential market opportunities and aligns with the objective of maximizing trading performance.
How to use the indicator:
Note: I used back-testing for fine tuning do not base your trades on signals from the testing framework.
Fetch ATR + MA StrategyA trend following indicator that allows traders/investors to enter trades for the long term, as it is mainly tested on the daily chart. The indicator fires off buy and sell signals. The sell signals can be turned off as trader can decide to use this indicator for long term buy signals. The buy signals are indicated by the green diamonds, and the red diamonds show the points on then chart where the asset can be sold.
The indicator uses a couple indicators in order to generate the buy signals:
- ADX
- ATR
- Moving Average of ATR
- 50 SMA
- 200 SMA
The buy signal is generated at the cross overs of the 50 and 200 SMA's while the ATR is lower than then Moving Average of the ATR. The buy signal is fired when these conditions are met and if the ADX is lower than 30.
The thought process is as follows:
When the ATR is lower than its moving average, the price should be in a low volatilty environment. An ADX between 25 and 50 signals a Strong trend. Every value below 25 is an absent or weak trend. So entering a trade when the volatilty is still low but increasing, you'll be entering a trade at the start of a new uptrend. This mechanism also filters out lots of false signals of the simple cross overs.
The sell signals are fired every time the 50 SMA drops below the 200 SMA.

Strategy Myth-Busting #5 - POKI+GTREND+ADX - [MYN]This is part of a new series we are calling "Strategy Myth-Busting" where we take open public manual trading strategies and automate them. The goal is to not only validate the authenticity of the claims but to provide an automated version for traders who wish to trade autonomously.
Our fifth one we are automating is one of the strategies from "The Best 3 Buy And Sell Indicators on Tradingview + Confirmation Indicators ( The Golden Ones ))" from "Online Trading Signals (Scalping Channel)". No formal backtesting was done by them and resuructo messaged me asking if we could validate their claims.
Originally, we mimic verbatim the settings Online Trading Signals was using however weren't getting promising results. So before we stopped there we thought we might want to see if this could be improved on. So we adjusted the Renko Assignment modifier from ATR to Traditional and adjusted the value to be higher from 30 to 47. We also decided to try adding another signal confirmation to eliminate some of the ranged market conditions so we choose our favorite, ADX . Also, given we are using this on a higher time-frame we adjusted the G-Channel Trend detection source from close to OHLC4 to get better average price action indication and more accurate trend direction.
This strategy uses a combination of 2 open-source public indicators:
poki buy and sell Take profit and stop loss by RafaelZioni
G-Channel Trend Detection by jaggedsoft
Trading Rules
15m - 4h timeframe. We saw best results at the recommended 1 hour timeframe.
Long Entry:
When POKI triggers a buy signal
When G-Channel Trend Detection is in an upward trend (Green)
ADX Is above 25
Short Entry:
When POKI triggers a sell signal
When G-Channel Trend Detection is in an downward trend (red)
ADX Is above 25
If you know of or have a strategy you want to see myth-busted or just have an idea for one, please feel free to message me.

Coral Trend Pullback Strategy (TradeIQ)Description:
Strategy is taken from the TradeIQ YouTube video called "I Finally Found 80% Win Rate Trading Strategy For Crypto".
Check out the full video for further details/clarification on strategy entry/exit conditions.
The default settings are exactly as TradeIQ described in his video.
However I found some better results by some tweaking settings, increasing R:R ratio and by turning off confirmation indicators.
This would suggest that perhaps the current confirmation indicators are not the best options. I'm happy to try add some other optional confirmation indicators if they look to be more effective.
Recommended timeframe: 1H
Strategy incorporates the following features:
Risk management:
Configurable X% loss per stop loss
Configurable R:R ratio
Trade entry:
Based on strategy conditions below
Trade exit:
Based on strategy conditions below
Backtesting:
Configurable backtesting range by date
Trade drawings:
Each entry condition indicator can be turned on and off
TP/SL boxes drawn for all trades. Can be turned on and off
Trade exit information labels. Can be turned on and off
NOTE: Trade drawings will only be applicable when using overlay strategies
Alerting:
Alerts on LONG and SHORT trade entries
Debugging:
Includes section with useful debugging techniques
Strategy conditions
Trade entry:
LONG
C1: Coral Trend is bullish
C2: At least 1 candle where low is above Coral Trend since last cross above Coral Trend
C3: Pullback happens and price closes below Coral Trend
C4: Coral Trend colour remains bullish for duration of pullback
C5: After valid pullback, price then closes above Coral Trend
C6: Optional confirmation indicators (choose either C6.1 or C6.2 or NONE):
C6.1: ADX and DI (Single indicator)
C6.1.1: Green line is above red line
C6.1.2: Blue line > 20
C6.1.3: Blue trending up over last 1 candle
C6.2: Absolute Strengeh Histogram + HawkEye Volume Indicator (Two indicators combined)
C6.2.1: Absolute Strengeh Histogram colour is blue
C6.2.2: HawkEye Volume Indicator colour is green
SHORT
C1: Coral Trend is bearish
C2: At least 1 candle where high is below Coral Trend since last cross below Coral Trend
C3: Pullback happens and price closes above Coral Trend
C4: Coral Trend colour remains bearish for duration of pullback
C5: After valid pullback, price then closes below Coral Trend
C6: Optional confirmation indicators (choose either C6.1 or C6.2 or NONE):
C6.1: ADX and DI (Single indicator)
C6.1.1: Red line is above green line
C6.1.2: Blue line > 20
C6.1.3: Blue trending up over last 1 candle
C6.2: Absolute Strengeh Histogram + HawkEye Volume Indicator (Two indicators combined)
C6.2.1: Absolute Strengeh Histogram colour is red
C6.2.2: HawkEye Volume Indicator colour is red
NOTE: All the optional confirmation indicators cannot be overlayed with Coral Trend so feel free to add each separately to the chart for visual purposes
Trade exit:
Stop Loss: Calculated by recent swing low over previous X candles (configurable with "Local High/Low Lookback")
Take Profit: Calculated from R:R multiplier * Stop Loss size
Credits
Strategy origin: TradeIQ's YouTube video called "I Finally Found 80% Win Rate Trading Strategy For Crypto"
It combines the following indicators for trade entry conditions:
Coral Trend Indicator by @LazyBear (Main indicator)
Absolute Strength Histogram | jh by @jiehonglim (Optional confirmation indicator)
Indicator: HawkEye Volume Indicator by @LazyBear (Optional confirmation indicator)
ADX and DI by @BeikabuOyaji (Optional confirmation indicator)

(JS) Checklist SignalsWhat if I told you that you could use over 10 indicators at once without having a single one of them on you chart? Enter the Checklist Signals. This is probably the most complex yet simple indicator I've ever done.
What you get is 6 rows (if you want them all) of labels that hover at the top of your screen with a ton of extremely useful information. I will go down the list of options in the indicator settings and explain how it all works.
So the label placement is based on ATR. You choose your X Axis and Y Axis starting point then adjust the lookback period. Default lookback is 600 bars. What that means is, the indicator finds the highest high in the last 600 bars, then begins to place the labels above that zone based on the ATR of the chart. Different timeframes require very different combinations so it's all customizable. Sometimes if labels overlap you need to adjust the X Axis starting point, or the spread on either axis.
The next set of options allows you to decide what you'd prefer to be set on or off. Let's start with ATR and VWAP. I have added bands for both of these. When price is below the mean (which is the 21 ema by default), then the labels show you the next 5 standard deviations of ATR going down. When under one of these levels the label turns red. The opposite is true when above the mean and in those instances the labels will be green. It is the same with the VWAP, though instead of using the mean we use the daily VWAP as the starting point. If you choose to have levels switched on then you can see the actual values of each standard deviation level. Down lower in the options you can change the resolution and source used for VWAP.
The next option is "Trending". This creates a moving average using the length of the Trending Lookback Period (default is 5) and then tells you using arrows in the label which direction the trend of the indicator is going.
The next area let's you specify the information you receive in the Squeeze labels. By default all options are one - and this tells you if there's a Squeeze, what type of Squeeze there is, and how many bars the Squeeze has been building up or since it fired. These labels are color coded to correspond with the Squeeze type as well.
Then we get to another one of my indicators, the Ballista. One of the main signals is the "Inverted Squeeze" where the short term momentum inverts against the long term momentum. Here I have the distance between the two oscillators in the first label, and then the second label tells you if there's an Inverted Squeeze signal, if there's potential entry, confirmed entry, or how many bars its been since the last entry signal.
The next feature is off by default, but it will add arrows to your chart based on a simple lower highs and higher lows signals. Turning arrows on will place them right on your chart above or below each bar.
The rest of it is customizable settings of all the other indicators that are shown. Now looking at the labels themselves, starting in the top left corner:
First Row-
ADX + DMI: These labels show the ADX, DI+, & DI- values in each label. Whenever the DI+ or DI- is above the other then their respective label will light up. Also, when the ADX is above 20 (confirming the trend) it lights up in the same color as well.
Squeeze: I described how this worked above, the labels tell you if there's a Squeeze, how long there's been one, and how long since it fired, all while also changing to color of the associated Squeeze type.
Second Row -
Stacked EMAs: The top label looks at the EMA values using the numbers of the Fibonacci sequence. It looks at the EMA 8, 21, 34, 55, 89, & 233 and tells you if they're all stacked in the same direction (Stacked Bear meaning they're all crossed down in order, Stacked Bull meaning they're all crossed up in order). If the EMAs are all stacked but 1 or 2 it will say Stacked -1 or Stacked -2. When they're all over the place it will say they aren't stacked at all.
BB%: This tells you the value of the Bollinger Band %. If this is negative then you know that price is currently below the lower Bollinger Band, and if it is above 100% it is above the upper Bollinger Band.
RSI: This tells you the value of the RSI and the label changes colors based on the value.
Stoch: This tells you the Stochastic value and changes colors based on the value, same as the RSI.
Third Row -
The Mean: This tells you the numerical value of whatever you have the mean set as (21 ema by default). The label changes colors based on price being above or below the mean.
One ATR: This was something I added for those looking to plan their trades out. This tells you the value of one ATR so you can have a better idea of how to plan your trades based on this distance.
VIX: This tells you the current value of the VIX, and color changes based on being green or red on the day.
Ballista: I explained this above, it tells you the distance between the two oscillators and changes colors based on the trend being above or below 0. When there's an Inverted Squeeze this label is gray.
Inverted Squeeze: This label tells you if there's an inverted squeeze as well as if it is showing an entry or how many bars since the last entry signal. This label turns fuchsia on a bear signal and lime on a bull signal.
Fourth Row -
ATR Bands: As I explained above, this plots each standard deviation using ATR and changes colors based on price's relationship to each one.
Fifth Row -
VWAP: The three labels here show the daily, weekly, and monthly VWAP values, and color changes based on price's relationship to each one.
Sixth Row -
VWAP Bands: These are the standard deviation levels of the VWAP resolution of your choosing (as explained above), and just as the others, colors change based on price's relationship to each one.
I thought this was a really cool indicator that could be used for people like me who like knowing the right information, but HATE having their charts clustered with a ton of stuff. Hope you all like it, enjoy!

Super Sniper - Screener - MTF- Multi Asset -Multi IndicatorSuper Sniper Screener with Multi Indicator EMA Crossover, Trend, ADX, MACD, SSL, CCI, STOCHASTIC, RSI, HMA, QQE, WAE. Trade Entry/Exit with multiple Indicator for Multiple Assets and Multiple Timeframe. if you are on a Higher / Lower Time frame and are looking for Entry/Exit based on a lower timeframe then this indicator is the best. The all in one screener for EMA Crossover, Trend, ADX, MACD, SSL, CCI, STOCHASTIC, RSI, HMA, QQE, WAE
What is Sniper Entry?
if you are on a Higher / Lower Time frame and are looking for Entry/Exit based on a lower timeframe then this indicator is the best.
About this indicator.
horizontal Lines are in pink (down) and blue(up) color grey (neutral)
10 horizontal lines are plotted each for a timeframe + Asset / Currency / Stock
Back ground represents UP/DOWN Trend based on EMA 200 with the current time frame.
RED-Dot and GREEN-Dot are buy sell signals of SSL Channel for current Time Frame.
You can choose only one type of indicator (EMA Crossover, Trend, ADX, MACD, SSL, CCI, STOCHASTIC, RSI, HMA, QQE, WAE) for all the 10-lines
Select Asset and Timeframe for Each Line on the Graph.
Based on the color of the line and changes on Multi Timeframe you can ENTER/EXIT a Trade on current Timeframe.
Hence a Sniper Entry with multiple Indicator Screener

BB-RSI-ADX Entry PointsThis is a combination of indicators used to find oversold and overbought entry points for possible reversion.
A Green arrow will appear when all condition are met for an ENTER LONG position.
A Red arow will appear when all condition are met for an ENTER SHORT position.
You can modify all of these condition parameters from the indicator's settings.
How does the indicator work
The signals are using Bollinger Bands , BB %B , RSI and ADX indicators to try and find points of reversal
Enter LONG Conditions
Current candle low is below BB lower band.
The BB %B is more than 0.
RSI > 30
ADX > 25
Enter SHORT Conditions
Current candle high is above BB upper band.
The BB %B is less than 1.
RSI < 70
ADX > 25
Those are the default settings that seem to work for me but you can customize all of these from the indicator settings.
I find this strategy to best work on a 3 minute timeframe
Note: The bb %B is calculated for stDev - 1. This will help you see a change happening faster.

ADeXtIt is an extended ADX and Direction Movement Index indicator with the following changes:
It shows a histogram instead of the DMI lines. If the histogram is green, the DMI+ is above DMI-, otherwise it is red.
You can specify a multiplier for the histogram values to check if values are above threshold. This way you can use the same threshold line as ADX to detect directional strength.
You can remove outliers from ATR calculations
You can use different MAs and sources for DMI and ATR calculations to make ADX more adjustable to different markets
It uses my ADExt library, so you can easily transfer your study to a strategy script.

Contrarian Scalping Counter Trend Bb Envelope Adx and StochasticContrarian Scalping is an trading strategy designed to take advanted of a counter-trend.
The advantage of these strrategies types is that they have a good profitability but with do not great gain (in relation at the time frame).
Indicators used:
Bollinger
Envelope
ADX
Stochastic
Rules for entry
For short: close of the price is above upper band from bb and envelope, adx is below 30 and stochastic is above 50
For long: close of the price is below lower band from bb and envelope, adx is below 30 and stochastic is below 50
Rules for exit
For short: either close of the candle is below lower band of bb or enveloper or stochastic is below 50
For long: either close o the candle is above upper band of bb or envelope or stochastic is above 50
If there are any questions let me know !

10X Market DirectionMy interpretation of John Carter's popular Simpler Trading 10X Bars indicator. Now you can see directional market strength for a variety of key futures , indices and industry groups for quick comparison with individual stocks.
Momentum is displayed to quickly see the quality and strength of a trend based on a calculation of the Directional Movement Index (DMI). The DMI is an indicator developed by J. Welles Wilder in 1978 that identifies in which direction the price of an asset is moving. The DMI is calculated by comparing prior highs and lows and produces 2 measurements illustrating the strength of the current trend:
-> a positive directional movement line ( +DI ); and
-> a negative directional movement line ( -DI ).
The average directional index ( ADX ) measures the strength of the current trend, either +DI or +DI ; a reading above 20 typically indicates a strong trend.
-> Green bars indicate an uptrend i.e. when +DI is above -DI and ADX is greater than 20 - there is more upward pressure than downward pressure in the price;
-> Red bars indicate a downtrend i.e. when -DI is above +DI and ADX is greater than 20 - there is more downward pressure on the price; and
-> Yellow bars indicate no strong directional trend and potential for a reversal.
This indicator should compliment other popular indicators, as confirmation whether to stay in a position or not.

10X Bars - Directional TrendsMy interpretation of John Carter's popular Simpler Trading 10X Bars indicator.
Momentum is displayed to quickly see the quality and strength of a trend based on a calculation of the Directional Movement Index (DMI). The DMI is an indicator developed by J. Welles Wilder in 1978 that identifies in which direction the price of an asset is moving. The DMI is calculated by comparing prior highs and lows and produces 2 measurements illustrating the strength of the current trend:
-> a positive directional movement line (+DI); and
-> a negative directional movement line (-DI).
The average directional index (ADX) measures the strength of the current trend, either +DI or +DI; a reading above 20 typically indicates a strong trend.
-> Green bars indicate an uptrend i.e. when +DI is above -DI and ADX is greater than 20 - there is more upward pressure than downward pressure in the price;
-> Red bars indicate a downtrend i.e. when -DI is above +DI and ADX is greater than 20 - there is more downward pressure on the price; and
-> Yellow bars indicate no strong directional trend and potential for a reversal.
Volume spikes 50% above average volume are then flagged as dots at the bottom of the chart (although you can change this location), confirming the momentum further.
This indicator should compliment other popular indicators, as confirmation whether to stay in a position or not.

RSI c/w MA, ADX and ATR data I have added 3 items to the RSI indicator which helps me to get more information at the same time.
1) ADX value - when ADX is above 25 we have a strong trend
2) ATR Value - helps me to calculate my daily targets and stop-loss levels at a glance.
3) A simple moving average - This shows me the trend of RSI. If the price breaks a trend line and at the same time RSI crosses above the MA, it shows me a breakout has happened. In longer timeframes, it can show you in advance if you should expect a reversal in the trend.
You can turn on or off the MA as well as the ADX line.
MACD With Crossings and Above Below ZeroMACD with MACD Derivative, Crossings Above and Below Zero, Shading for ADX Smoothing and Overlayed RSI
Primarily a moving average convergence divergence (MACD) momentum indicator. Also includes a MACD Derivative overlay to show when momentum has peaked. Displays triangle symbols when the MACD line crosses the signal line (larger triangle when MACD crosses above/below zero to indicator stronger momentum trend). Includes shading for average directional index (ADX) to futher determine when the price is trending strongly (red when the ADX value is greater than 25, and idicating a strong trend; otherwise blue). Lastly, has a relative strength index (RSI) momentum indicator overlayed to help evaluate periods of overbought or oversold conditions.

Forex Scalping 1min Bollinger Bands, RSI and ADX Trading SystemThis is a Forex Scalping Trading Sytem based on the Bollinger Bands.
Its suited for major pairs, with lowest possible comission (below 1 pip) and with timeframes ranging between 1-15 min.
Indicators:
Bollinger bands
ADX
RSI
Rules for entry:
Long Entry: price to move below the upper Bollinger Bands RSI raise above the 30 line and ADX<32 at the same time.
Short Entry: price to move above the upper Bollinger Bands, RSI raise below the 70 line and ADX<32 at the same time.
Rules for exit
Profit Exit: 3 options: 1, exit position when the price touches the middle band, 2) when the price touches the opposite band, X pips target profit.
Loss Exit: X pips loss

MA Crossover Strategy with MA Turning Point Exits + ADX filterThis strategy uses @rthomson's "MA Crossover Strategy with MA Turning point Exits" and combines it with ADX.
This strategy filters out any entries where ADX < 20. In fact you can set the value for ADX threshold. (Generally value under 20 for ADX is considered as non trend zone)

MAX SAHAM ADX with DI Max Saham's ADX line with D+ & D-
ADX is used to quantify trend strength.
When the D+ (+DMI) is dominant and rising, price direction is up.
When the D- (-DMI) is dominant and rising, price direction is down. But the strength of price must also be considered.
Uses Wilder's MA to get a more accurate ADX reading as compared to SMA.
Also added the green background to indicate the trend and also dots to indicate bull and bear crossing of the DMI's

SALEH MACD Donchian + EMA & MACD + ADXI gathered all the signals coming from the MACD & Donchian channels indicators and filtered them with EMA 200 or ADX > 25 indicators (which both of them show the trend),
and put them on the chart to show me the buy and sell signals;
the signals rules are as following:
BUY:
when we have an uptrend ( the price is above the EMA 200 or ADX > 25 ) & the macd line cross up the signal line while they are both under the 0 level of histogram it generates buy signals.
SELL:
when we have a downtrend ( the price is below the EMA 200 or ADX > 25) & the macd line cross below the signal line while they are both above the 0 level of histogram it generates sell signals.
Donchian channel works as a confirmation for the macd signal.
this signals work best at London session, you can also filter them by chandelier exit indicator.

unRekt - KISS AddieKISS Addie is the ADX and DI+- indicator and is part of the 'keeping it simple' series. ADX is your Average Directional Index and DI is you Directional Movement Indicator.
ADX - Will show the strength of the trend regardless of direction.
00 - 10 : No trend
10 - 20 : Transitioning trend
20 - 40 : Trending
40 - 99 : Exhausted (Can also be considered a stronger trend the higher it goes, but look to exit position once it begins to downward slope and pay attention to DI spread)
DI - Will show the direction of movement. This indicator includes two views of the DI. the DI+ and DI- crossover and a histogram of the spread between the two.
Bullish : Green crosses over red.
Bearish : Red crosses over green.

Institutional Alpha Vector | D_QUANT Institutional Alpha Vector | D_QUANT
Overview
The Institutional Alpha Vector (IAV) is an original trend-following framework that replaces single-indicator bias with a Weighted Composite Score . Instead of relying on a simple moving average, this script aggregates four distinct quantitative dimensions—Price, Momentum, Volatility, and Volume—into a normalized value called the "Alpha Vector."
The goal of this tool is to identify "Institutional Consensus"—periods where multiple mathematical models align in the same direction, reducing the likelihood of false breakouts in choppy markets.
How It Works: The Quantitative Engines
The script calculates four independent signals. For each module, a state is stored (1 for Bullish, -1 for Bearish, 0 for Neutral).
1. Price Filter (Hull Moving Average):
The script uses an HMA (a weighted moving average that reduces lag by using the square root of the period). A signal is triggered when the price crosses over/under this "Spine."
2. Volatility Regime (RMA + ATR):
This module uses a Moving Average (RMA) combined with an Average True Range (ATR) offset. It acts as a volatility filter that price must move beyond 1 ATR from the mean to register a trend, ensuring the market isn't just "drifting."
3. Momentum Physics (ADX/DMI):
Based on J. Welles Wilder’s Directional Movement Index. It checks if the is above (or vice versa) but only if the ADX (Average Directional Index) is above a user-defined threshold (default: 10), confirming the presence of a strong trend.
4. Institutional Flow (Chaikin Money Flow):
This confirms price action with volume. It calculates the accumulation/distribution of money flow over a specific period. A signal is only valid if the CMF is positive (Bullish) or negative (Bearish).
The Alpha Vector Calculation
This is the core "originality" of the script. The indicator takes the active modules and calculates a Composite Score :
This results in a value between -1.0 and +1.0 .
* High Confidence Long: When the score exceeds +0.1 (adjustable).
* High Confidence Short: When the score drops below -0.1 (adjustable).
* Neutral Zone: When the score is near 0, the script colors the bars grey, signaling a lack of institutional consensus.
Visual Intelligence: The "Electric Conduit"
The script visualizes market energy through a custom rendering engine:
* The Spine: A central line representing the HMA trend.
* The Conduit (Fill): A dynamic gradient that expands or contracts based on the ATR (Average True Range) . This allows traders to see "volatility expansion" (wide ribbon) vs "compression" (tight ribbon) at a glance.
* Bar Coloring : Automatically aligns the chart candles with the Alpha Vector state to remove cognitive load.
How to Use
1. Define your Strategy: In the settings, you can toggle specific modules. If you are trading a low-volume asset, you might disable the **CMF** module.
2. Identify the Consensus: Look for the ribbon to change from Grey (Neutral) to Cyan/Gold.
3. Monitor the HUD: A small dashboard in the bottom right displays the live Alpha Vector score. A score of 1.0 means all four engines are in 100% bullish agreement.
Disclaimer: Trading involves significant risk. This tool is for educational and analytical purposes and does not constitute financial advice.
