Kay_BBandsV3This is the 3rd version of Kay_BBands.
When +DI (Directional Index ) is above -DI , then Upper band will be visible and vice-versa.
This is when the ADX is above the threshold. 28 is the default in this version. I found its more appealing in 5M time frame.
BLUE - ADX under 10
GREEN - Uptrend, ADX over 10
RED - Downtrend, ADX over 10
Use it with another band with setting 20, 0.6 deviation. Prices keeping above or below the 2nd bands upper or lower bounds shows trending conditions.
I didn't know how to update the old script so published it again.
Changes - :
1) Updated default settings for the indicator
2) ADX setting are now DI (28), ADX (10), adx level to check is 10.
3) IMPORTANT one - When DI is up/down, lower/upper band will also have color (more visible that way.)
Play around the settings.. It really eliminates extra indicator checking visually... Please like if you think idea is good.
Cerca negli script per "adx"

Volume DI Diff + ADX Coloreado por AOInterpretationIf +DI > -DI (positive DI+ - DI- difference) → Upward trend pressure (bullish signal).
If -DI > +DI (negative DI+ - DI- difference) → Downward trend pressure (bearish signal).
Crossovers between +DI and -DI generate buy/sell signals, often filtered by ADX for reliability.
This setup is widely used in technical analysis to identify trending markets and avoid whipsaws in ranging conditions. It's part of the broader Average Directional Movement System (ADX/DMI).
Key ComponentsADX line: Measures overall trend strength (non-directional).
+DI line: Strength of upward movement.
-DI line: Strength of downward movement.
Trend direction is determined by which DI line is dominant:+DI > -DI: Bullish trend (upward pressure).
-DI > +DI: Bearish trend (downward pressure).
Crossovers between +DI and -DI can signal potential trend changes, but they are most reliable when ADX confirms sufficient strength.ADX Trend Strength Levels (Common Interpretations)ADX Value
Trend Strength
Recommendation
0–20
Weak or no trend (ranging/sideways market)
Avoid trend-following strategies; consider range-bound or oscillator-based trades.
20–25
Emerging or moderate trend (gray zone)
Monitor for confirmation; potential start of trend.
25–50
Strong trend
Ideal for trend-following strategies (e.g., moving averages, breakouts).
50–75
Very strong trend
High momentum; good for riding trends, but watch for exhaustion.
75–100
Extremely strong trend (rare)
Often overextended; risk of reversal or correction.
Rising ADX: Trend is strengthening.
Falling ADX: Trend is weakening (even if still high).
Multi-Filter & RSI Overheat Analyzer (Invite Only)🚀 Multi-Filter & RSI Overheat Analyzer (Invite Only)
The Trend-RSI Pro is an advanced, multi-layered analysis tool designed for invite-only subscribers. Its primary function is to provide an instant, high-conviction visual filter of current market conditions by combining three essential technical analyses: EMA trend direction, ADX trend strength, and RSI overbought/oversold momentum.
💡 Key Features and Analysis Logic
This indicator simplifies complex market structure analysis by using a dynamic Background Color filter. The color instantly tells the user the dominant market state, eliminating the need to manually check multiple windows.
The background turns Teal when the Exponential Moving Averages (EMA) are in a strong Bullish Alignment (Short > Medium > Long) and the ADX value exceeds the user-defined Strength Threshold (default 25.0), confirming a Strong Uptrend. Conversely, the background turns Red when the EMAs are in a strong Bearish Alignment (Short < Medium < Long) and the ADX confirms a Strong Downtrend. Any other combination of EMA alignment or a weak ADX reading results in a Gray background, which alerts the user to a Ranging, Weak, or Transitional Market where caution is advised.
To complement the trend analysis, the indicator features RSI Overheat Alert Icons to preemptively analyze potential trend exhaustion. When the Relative Strength Index (RSI) enters the Overbought zone (default >= 70.0), a Red Triangle Down appears above the price bar, warning of potential selling pressure. Conversely, when the RSI enters the Oversold zone (default <= 30.0), a Green Triangle Up appears below the price bar, suggesting potential buying interest.
For users who wish to confirm the underlying components, the indicator also plots the three EMA Lines (Short, Medium, Long) directly on the chart, and the raw ADX Value is plotted in a separate pane, allowing for detailed tracking of strength changes over time. All key parameters, including EMA periods, ADX thresholds, and RSI limits, are fully customizable in the settings.
⚠️ Disclaimer and Usage Guideline
This tool is strictly an analytical aid and not a trading signal or financial advice. Users should utilize the Background Color as their primary context filter, only seeking trades aligned with the indicated strong trend color. The RSI alerts serve as timely warnings for potential short-term reversals within a larger trend. Trading carries substantial risk, and this indicator must always be combined with the user's independent analysis and robust risk management strategies.

ADX_RDADX_RD - Average Directional Index (Ryan DeBraal)
This script plots a refined version of the **ADX (Average Directional Index)**,
used to measure trend strength regardless of trend direction. It includes
custom smoothing, modified DM (Directional Movement) logic, dynamic coloring,
and a built-in 20-level threshold.
FEATURES
- Calculates +DI, –DI, and ADX using standard Wilder smoothing (RMA).
- Signal color turns **white** when ADX < 20 (low-trend or choppy conditions).
- Signal color turns **blue** when ADX >= 20 (trend strengthening).
- Horizontal dotted reference line at **20**, a widely used threshold:
ADX < 20 → weak or ranging market
ADX > 20 → strengthening trend
- Works on all timeframes, supports custom smoothing lengths.
PURPOSE
This indicator helps identify when a market is trending vs when it is flat.
It does not indicate direction by itself — only the strength of the move —
making it ideal for confirming breakout setups, trend-following entries,
and filtering out low-probability trades during chop.

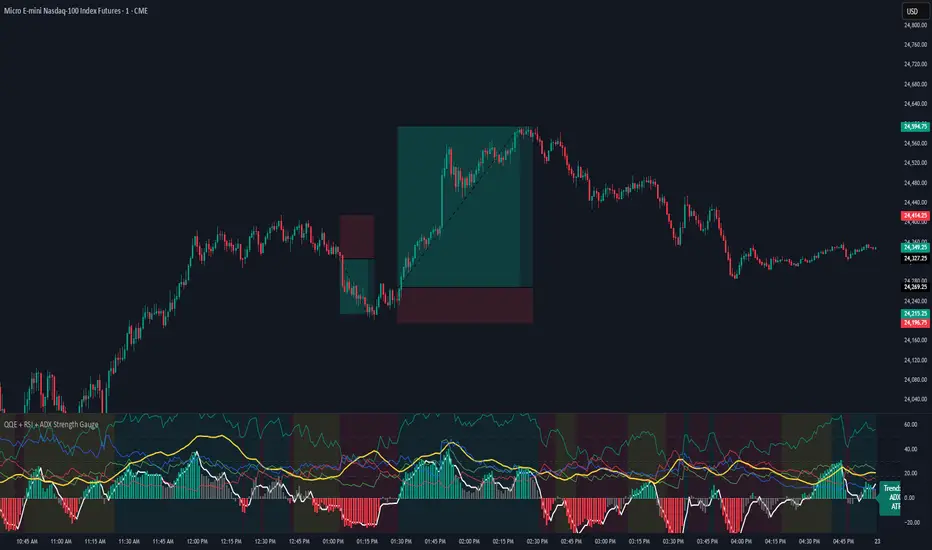
QQE + RSI + ADX Strength GaugeQQE + RSI + ADX Strength Gauge - Release Notes
A comprehensive multi-indicator oscillator combining QQE MOD momentum analysis with RSI, ADX, and ATR strength metrics for complete market analysis.
Features
+QQE MOD Oscillator
Primary & Secondary QQE calculations with Bollinger Band integration
Dynamic momentum-based column coloring (strong vs weak signals)
Clear bullish/bearish threshold zones
Strength Indicators
RSI (14) with overbought/oversold reference lines
ADX + DI lines for trend strength measurement
ATR for volatility context
Live trend gauge label (BULLISH/BEARISH/CHOP)
Visual Design
Clean, professional gradient aesthetic
Customizable colors for all indicators
Background coloring (oscillator pane + optional chart overlay)
Adjustable transparency settings
Settings
Fully adjustable QQE parameters (Primary/Secondary RSI, smoothing, factors)
Customizable Bollinger Bands (length, multiplier)
Adjustable indicator lengths (RSI, ADX, ATR)
ADX threshold control
Complete color customization
Credits
Original RSI + ADX + ATR Strength Gauge - Base structure and gauge concept - jaredskii
QQE MOD Indicator - QQE calculation logic - Mihkel00
Khusan Pullback & Mean-Reversion (Manual ADX, Clean)Description
The indicator combines two logics in one tool:
Trend Pullback: Entries in the direction of the dominant trend after a short-term pullback to the EMA.
Return to the mean (Mean-Reversal): countertrend trades from external Bollinger bands with an RSI filter.
Key Features
Manual ADX (Wilder calculation): more precisely, it controls the strength of the trend without hidden smoothing.
There is a clear separation of market modes: the background of the chart highlights the condition: trend up/down or sideways (range).
Signal tags: Long TPB / Short TPB for pullbacks in the trend, Long MR / Short MR for a return to the average.
A minimum of “noise": neat colors, clear captions, without unnecessary graphics.
How to read signals
Trend Pullback
Long TPB — ADX ≥ threshold, price returns above fast EMA, RSI > 45.
Short TPB — ADX ≥ threshold, price goes below fast EMA, RSI < 55.
Mean-Reversion
Long MR — sideways (ADX < threshold), price below lower BB, RSI < 30, confirmation of reversal.
Short MR — sideways (ADX < threshold), price above upper BB, RSI > 70, reversal confirmation.
Parameters (Inputs)
EMA fast / EMA slow — fast and slow EMA (default 20/50).
ADX length / threshold — period and trend strength threshold.
BB length / mult — period and Bollinger Bands multiplier.
RSI length — RSI period.
Show labels/background — enable mode signatures and highlighting.
Recommendations for use
Timeframes: from M15 to H4. On lower TF, add a filter by the higher trend (e.g. H1/H4 EMA).
Instruments: XAUUSD, FX majors, indices, liquid futures and crypto pairs.
Risk management: for TPB, use SL behind the local swing extremum/below the EMA zone; for MR, use SL behind the external BB.
Filters: avoid entering against strong news; prioritize MR when volatility is low, and TPB when volatility is high.
Alerts
Create standard alerts based on the appearance of Long/Short TPB and Long/Short MR labels — the indicator provides clear conditions for auto-entry/notifications.
Important
The indicator is not

T-Virus Sentiment [hapharmonic]🧬 T-Virus Sentiment: Visualize the Market's DNA
Remember the iconic T-Virus vial from the first Resident Evil? That powerful, swirling helix of potential has always fascinated me. It sparked an idea: what if we could visualize the market's underlying health in a similar way? What if we could capture the "genetic code" of market sentiment and contain it within a dynamic, 3D indicator? This project is the result of that idea, brought to life with Pine Script.
The indicator's main goal is to measure the strength and direction of market sentiment by analyzing the "genetic code" of price action through a variety of trusted indicators. The result is displayed as a liquid level within a DNA helix, a bubble density representing buying pressure, and a T-Virus mascot that reflects the overall mood.
🧐 Core Concept: How It Works
The primary output of the indicator is the "Active %" gauge you see on the right side of the vial. This percentage represents the overall sentiment score, calculated as an average from 7 different technical analysis tools. Each tool is analyzed on every bar and assigned a score from 1 (strong bearish pressure) to 5 (strong bullish potential).
In this indicator, we re-imagine market dynamics through the lens of a viral outbreak. A strong bear market is like a virus taking hold, pulling all technical signals down into a state of weakness. Conversely, a powerful bull market is like an antiviral serum ; positive signals rise and spread toward the top of the vial, indicating that the system is being injected with strength.
This is not just another line on a chart. It's a comprehensive sentiment dashboard designed to give an immediate, at-a-glance understanding of the confluence between 7 classic technical indicators. The incredible 3D model of the vial itself was inspired by a design concept found here .
⚛️ The 4 Core Elements of T-Virus Sentiment
These four elements work in harmony to give a complete, multi-faceted picture of market sentiment. Each component tells a different part of the story.
The Virus Mascot: An instant emotional cue. This character provides the quickest possible read on the overall market mood, combining sentiment with volume pressure.
The Antiviral Serum Level: The main quantitative output. This is the liquid level in the DNA helix and the percentage gauge on the right, representing the average sentiment score from all 7 indicators.
Buy Pressure & Bubble Density: This visualizes volume flow. The density of bubbles represents the intensity of accumulation (buying) versus distribution (selling). It's the "power" behind the move.
The Signal Distribution: This shows the confluence (or dispersion) of sentiment. Are all signals bullish and clustered at the top, or are they scattered, indicating a conflicted market? The position of the indicator labels is crucial, as each is assigned to one of five distinct zones:
Base Bottom: The market is at its weakest. Signals here suggest strong bearish control and distribution.
Lower Zone: The market is still bearish, but signals may be showing early signs of accumulation or bottoming.
Neutral Core (Center): A state of balance or sideways consolidation. The market is waiting for a new direction.
Upper Zone: Bullish momentum is becoming clear. Signals are strengthening and showing bullish control.
Top Cap: The market is "heating up" with strong bullish sentiment, potentially nearing overbought conditions.
🐂🐻 The Virus Mascot: The At-a-Glance Indicator
This character acts as a shortcut to confirm market health. It combines the sentiment score with volume, preventing false confidence in a low-volume rally.
Its state is determined by a dual-check: the overall "Antiviral Serum Level" and the "Buy Pressure" must both be above 50%.
Green & Smiling: The 'all clear' signal. This means that not only is the overall technical sentiment bullish, but it's also being supported by real buying pressure. This is a sign of a healthy bull market.
Red & Angry: A warning sign. This appears if either the sentiment is weak, or a bullish sentiment is not being confirmed by buying volume. The latter could indicate a potential "bull trap" or an exhaustive move.
This mascot can be disabled from the settings page under "Virus Mascot Styling" if a cleaner look is preferred.
🫧 Bubble Density: Gauging Buy vs. Sell Pressure
The bubbles visualize the battle between buyers and sellers. There are two modes to control how this is calculated:
Mode 1: Visible Range (The 'Big Picture' View)
This default mode is best for getting a broad, contextual understanding of the current session. It dynamically analyzes the volume of every single candlestick currently visible on the screen to calculate the buy/sell pressure ratio. It answers the question: "Over the entire period I'm looking at, who is in control?" As you zoom in or out, the calculation adapts.
Mode 2: Custom Lookback (The 'Precision' View)
This mode is for traders who need to analyze short-term pressure. You can define a fixed number of recent bars to analyze, which is perfect for scalping or understanding the volume dynamics leading into a key level. It answers the question: "What is happening right now ?" In the example above, a lookback of 2 focuses only on the most recent action, clearly showing intense, immediate selling pressure (few bubbles) and a corresponding drop in the sentiment score to 29%.
ℹ️ Interactive Tooltips: Dive Deeper
We believe in transparency, not 'black box' indicators. This feature transforms the indicator from a visual aid into an active learning tool.
Simply hover the mouse over any indicator label (like EMA, OBV, etc.) to get a detailed tooltip. It will explain the specific data points and thresholds that signal met to be placed in its current zone. This helps build trust in the signals and allows users to fine-tune the indicator settings to better match their own trading style.
🎯 The Scoring Logic Breakdown
The "Antiviral Serum Level" gauge is the average score from 7 technical analysis tools. Each is graded on a 5-point scale (1=Strong Bearish to 5=Strong Bullish). Here’s a detailed, transparent look at how each "gene" is evaluated:
Relative Strength Index (RSI)
Measures momentum and overbought/oversold conditions.
Group 1 (Strong Bearish): RSI > 80 (Extreme Overbought)
Group 2 (Bearish): 70 < RSI ≤ 80 (Overbought)
Group 3 (Neutral): 30 ≤ RSI ≤ 70
Group 4 (Bullish): 20 ≤ RSI < 30 (Oversold)
Group 5 (Strong Bullish): RSI < 20 (Extreme Oversold)
Exponential Moving Averages (EMA)
Evaluates the trend's strength and structure based on the alignment of multiple EMAs (9, 21, 50, 100, 200, 250).
Group 1 (Strong Bearish): A perfect bearish sequence (9 < 21 < 50 < ...)
Group 2 (Bearish Transition): Early signs of a potential reversal (e.g., 9 > 21 but still below 50)
Group 3 (Neutral / Mixed): MAs are intertwined or showing a partial bullish sequence.
Group 4 (Bullish): A strong bullish sequence is forming (e.g., 9 > 21 > 50 > 100)
Group 5 (Strong Bullish): A perfect bullish sequence (9 > 21 > 50 > 100 > 200 > 250)
Moving Average Convergence Divergence (MACD)
Analyzes the relationship between two moving averages to gauge momentum.
Group 1 (Strong Bearish): MACD & Histogram are negative and momentum is falling.
Group 2 (Weakening Bearish): MACD is negative but the histogram is rising or positive.
Group 3 (Neutral / Crossover): A crossover event is occurring near the zero line.
Group 4 (Bullish): MACD & Histogram are positive.
Group 5 (Strong Bullish): MACD & Histogram are positive, rising strongly, and accelerating.
Average Directional Index (ADX)
Measures trend strength, not direction. The score is based on both ADX value and the dominance of DI+ vs DI-.
Group 1 (Bearish / No Trend): ADX < 20 and DI- is dominant.
Group 2 (Developing Bearish Trend): 20 ≤ ADX < 25 and DI- is dominant.
Group 3 (Neutral / Indecision): Trend is weak or DI+ and DI- are nearly equal.
Group 4 (Developing Bullish Trend): 25 ≤ ADX ≤ 40 and DI+ is dominant.
Group 5 (Strong Bullish Trend): ADX > 40 and DI+ is dominant.
Ichimoku Cloud (IKH)
A comprehensive indicator that defines support/resistance, momentum, and trend direction.
Group 1 (Strong Bearish): Price is below the Kumo, Tenkan < Kijun, and Chikou is below price.
Group 2 (Bearish): Price is inside or below the Kumo, with mixed secondary signals.
Group 3 (Neutral / Ranging): Price is inside the Kumo, often with a Tenkan/Kijun cross.
Group 4 (Bullish): Price is above the Kumo with strong primary signals.
Group 5 (Strong Bullish): All signals are aligned bullishly: price above Kumo, bullish Tenkan/Kijun cross, bullish future Kumo, and Chikou above price.
Bollinger Bands (BB)
Measures volatility and relative price levels.
Group 1 (Strong Bearish): Price is below the lower band.
Group 2 (Bearish Territory): Price is between the lower band and the basis line.
Group 3 (Neutral): Price is hovering around the basis line.
Group 4 (Bullish Territory): Price is between the basis line and the upper band.
Group 5 (Strong Bullish): Price is above the upper band.
On-Balance Volume (OBV)
Uses volume flow to predict price changes. The score is based on OBV's trend and its position relative to its moving average.
Group 1 (Strong Bearish): OBV is below its MA and falling.
Group 2 (Weakening Bearish): OBV is below its MA but showing signs of rising.
Group 3 (Neutral): OBV is very close to its MA.
Group 4 (Bullish): OBV is above its MA and rising.
Group 5 (Strong Bullish): OBV is above its MA, rising strongly, and showing signs of a volume spike.
🧭 How to Use the T-Virus Sentiment Indicator
IMPORTANT: This indicator is a sentiment dashboard , not a direct buy/sell signal generator. Its strength lies in showing confluence and providing a quick, holistic view of the market's technical health.
Confirmation Tool: Use the "Active %" gauge to confirm a trade setup from your primary strategy. For example, if you see a bullish chart pattern, a high and rising sentiment score can add confidence to your trade.
Momentum & Trend Gauge: A consistently high score (e.g., > 75%) suggests strong, established bullish momentum. A consistently low score (< 25%) suggests strong bearish control. A score hovering around 50% often indicates a ranging or indecisive market.
Divergence & Warning System: Pay attention to divergences. If the price is making new highs but the sentiment score is failing to follow or is actively decreasing, it could be an early warning sign that the underlying momentum is weakening.
⚙️ Settings & Customization
The indicator is highly customizable to fit any trading style.
Position & Anchor: Control where the vial appears on the chart.
Styling (Vial, Helix, etc.): Nearly every visual element can be color-customized.
Signals: This is where the real power is. All underlying indicator parameters (RSI length, MACD settings, etc.) can be fine-tuned to match a personal strategy. The text labels can also be disabled if the chart feels cluttered.
Enjoy visualizing the market's DNA with the T-Virus Sentiment indicator

Institutional Momentum Zones (ADX+ROC+DI+MACD+Filters)Institutional Momentum Zones (ADX + ROC + DI + MACD + Filters)
This indicator is designed to help traders visually identify Bullish, Neutral, and Bearish momentum zones on Nifty, indices, or any liquid asset, using a rules-based, institutional-style approach.
It combines multiple professional-grade momentum and trend filters into a single framework:
ADX (Average Directional Index) – Measures trend strength, filters out choppy conditions.
Directional Indicators (+DI / –DI) – Confirms whether bulls or bears are in control.
ROC (Rate of Change) – Quantifies momentum speed and direction.
MACD (optional) – Adds confirmation by checking multi-timeframe momentum alignment.
EMA Filters (optional) – Ensures price is in alignment with long-term trend bias.
Supertrend (optional) – Can be enabled for additional trend confirmation.
How it works:
Bullish Zone (Green) → Strong trend (ADX > threshold) + upward momentum (ROC > 0, +DI > –DI) + optional EMA/MACD/Supertrend confirmation.
Bearish Zone (Red) → Strong trend (ADX > threshold) + downward momentum (ROC < 0, –DI > +DI) + optional EMA/MACD/Supertrend confirmation.
Neutral Zone (Yellow) → Low trend strength (ADX < threshold) or mixed momentum signals.
Features:
Automatic background coloring for zone detection.
On-chart labels marking new zone changes.
EMA50 / EMA200 and Supertrend overlay options.
Signal markers for bullish/bearish entries.
Info panel with live ADX, ROC, DI values, and MACD histogram.
Alert conditions for zone changes (Bull, Bear, Neutral).
Best used for:
Index momentum tracking (e.g., Nifty, Bank Nifty, Dow, S&P500)
Swing trading & positional trading strategies
Filtering trades to avoid entering during low-momentum chop
Tip: For Nifty positional trading, use Daily or 4H charts with EMA & MACD filters enabled for cleaner, high-confidence signals.

RSI + ADX + ATR Combo Indicator: RSI + ADX + ATR Combo Filter
This indicator is a confluence filter tool that combines RSI, ADX, and ATR into a single, easy-to-read chart overlay. It is designed to help traders identify low-volatility, non-trending zones with balanced momentum—ideal for strategies that rely on breakouts or reversals.
🔍 Core Components:
RSI (Relative Strength Index)
Standard RSI with custom upper and lower bounds (default: 60 and 40).
Filters out extreme overbought/oversold regions and focuses on price consolidation zones.
ADX (Average Directional Index)
Measures trend strength.
When ADX is below a custom threshold (default: 20), it indicates a weak or range-bound trend.
ATR (Average True Range)
Represents volatility.
Low ATR values (default threshold: 2.5) are used to filter out high-volatility environments, helping refine entries.
🟣 Signal Logic:
A signal is highlighted with a background color when all three conditions are met:
RSI is between lower and upper bounds (e.g., 40 < RSI < 60) ✅
ADX is below the trend threshold (e.g., ADX < 20) ✅
ATR is below the volatility threshold (e.g., ATR < 2.5) ✅
These combined conditions suggest a low-volatility, low-trend strength, and balanced momentum zone—perfect for anticipating breakouts or strong directional moves.

Volume +OBV + ADXVolume + OBV + ADX Table
Optimized Buyer & Seller Volume with Trend Indications
Overview:
This indicator provides a comprehensive view of market participation and trend strength by integrating Volume, On Balance Volume (OBV) trends, and ADX (Average Directional Index) signals into a visually structured table. Designed for quick decision-making, it highlights buyer and seller dominance while comparing the selected stock with another custom symbol.
Features:
✅ Buyer & Seller Volume Analysis:
Computes buyer and seller volume percentages based on market movements.
Displays daily cumulative volume statistics to assess ongoing market participation.
✅ On Balance Volume (OBV) Trends:
Identifies positive, negative, or neutral OBV trends using an advanced smoothing mechanism.
Highlights accumulation or distribution phases with colored visual cues.
✅ ADX-Based Trend Confirmation:
Evaluates Directional Indicators (DI+ and DI-) to determine the trend direction.
Uses customizable ADX settings to filter out weak trends.
Provides uptrend, downtrend, or neutral signals based on strength conditions.
✅ Custom Symbol Comparison:
Allows users to compare two different assets (e.g., a stock vs. an index or ETF).
Displays a side-by-side comparison of volume dynamics and trend strength.
✅ User-Friendly Table Display:
Presents real-time calculations in a compact and structured table format.
Uses color-coded trend signals for easier interpretation.
Recommended Usage for Best Results:
📌 Pairing this indicator with Sri_Momentum and Sri(+) Pivot will enhance accuracy and provide better trade confirmations.
📌 Adding other major indicators like RSI, CCI, etc., will further increase the probability of winning trades.
How to Use:
Select a custom symbol for comparison.
Adjust ADX settings based on market conditions.
Analyze the table to identify buyer/seller dominance, OBV trends, and ADX trend strength.
Use the combined signals to confirm trade decisions and market direction.
Best Use Cases:
🔹 Trend Confirmation – Validate breakout or reversal signals.
🔹 Volume Strength Analysis – Assess buyer/seller participation before entering trades.
🔹 Multi-Asset Comparison – Compare the behavior of two related instruments.
This indicator is ideal for traders looking to combine volume dynamics with trend-following strategies. 🚀📈
Advanced Supertrend Enhanced ADXEnhanced Supertrend ADX Indicator - Technical Documentation
Overview
The Enhanced Supertrend ADX indicator combines ADX directional strength with Supertrend trend-following capabilities, creating a comprehensive trend detection system. It's enhanced with normalization techniques and multiple filters to provide reliable trading signals.
Key Features and Components
The indicator incorporates three main components:
Core ADX and Supertrend Fusion
Uses a shorter ADX period for increased sensitivity
Integrates Supertrend signals for trend confirmation
Applies a long-term moving average for trend context
Advanced Filtering System
Volatility filter: Identifies periods of significant market movement
Momentum filter: Confirms the strength and sustainability of trends
Lateral market detection: Identifies ranging market conditions
Data Normalization
Standardizes indicator readings across different instruments
Makes signals comparable across various market conditions
Reduces extreme values and false signals
Model Assumptions
The indicator operates under several key assumptions:
Market Behavior
Markets alternate between trending and lateral phases
Strong trends correlate with increased volatility
Price momentum confirms trend strength
Market transitions follow identifiable patterns
Signal Reliability
Low ADX values indicate lateral markets
Valid signals require both volatility and momentum confirmation
Multi-filter confirmation increases signal reliability
Price normalization enhances signal quality
Trading Applications
The indicator supports different trading approaches:
Trend Trading
Strong signals when all filters align
Clear distinction between bullish and bearish trends
Momentum confirmation for trend continuation
Range Trading
Clear identification of lateral markets
Band-based trading boundaries
Reduced false breakout signals
Transition Trading
Early identification of trend-to-range transitions
Clear signals for range-to-trend transitions
Momentum-based confirmation of breakouts
Risk Considerations
Important factors to consider:
Signal Limitations
Potential delay in fast-moving markets
False signals during extreme volatility
Time frame dependency
Best Practices
Use in conjunction with other indicators
Apply proper position sizing
Focus on liquid instruments
Consider market context
Performance Characteristics
The indicator shows optimal performance under specific conditions:
Ideal Conditions
Daily timeframe analysis
Clear trending market phases
Liquid market environments
Normal volatility conditions
Challenging Conditions
Choppy market conditions
Extremely low volatility
Highly volatile markets
Illiquid instruments
Implementation Recommendations
For optimal use, consider:
Market Selection
Best suited for major markets
Requires adequate liquidity
Works well with trending instruments
Timeframe Selection
Primary: Daily charts
Secondary: 4-hour charts
Caution on lower timeframes
Risk Management
Use appropriate position sizing
Set clear stop-loss levels
Consider market volatility
Monitor overall exposure
This indicator serves as a comprehensive tool for market analysis, combining traditional technical analysis with modern filtering techniques. Its effectiveness depends on proper implementation and understanding of market conditions.

Trend with ADX/EMA - Buy & Sell SignalsThis script is designed to help traders make buy and sell decisions based on trend analysis using two key methods: ADX (Average Directional Index) and EMA (Exponential Moving Averages). Here's a breakdown in simple terms:
What Does It Do?
Identifies the Trend's Strength and Direction:
Uses the ADX indicator to determine how strong the trend is.
Compares two lines (DI+ and DI−) to identify whether the trend is moving up or down.
Generates Buy and Sell Signals:
Uses two EMAs (a fast one and a slow one) to check when the price crosses key levels, signaling a possible buy or sell opportunity.
Plots visual indicators (arrows and labels) for easy interpretation.
Color-Codes the Chart:
Highlights the background in green when the trend is bullish (uptrend).
Highlights the background in red when the trend is bearish (downtrend).
Alerts the User:
Creates alerts when specific conditions for buying or selling are met.
Key Components:
1. ADX (Trend Strength & Direction)
What is ADX?
ADX measures how strong the trend is (not the direction). Higher ADX means a stronger trend.
It also calculates two lines:
DI+: Measures upward movement strength.
DI−: Measures downward movement strength.
How It Works in the Script:
If DI+ is greater than DI−, it’s a bullish trend (upward).
If DI− is greater than DI+, it’s a bearish trend (downward).
The background turns green for an uptrend and red for a downtrend.
2. EMA (Buy and Sell Decisions)
What is EMA?
EMA is a moving average that gives more weight to recent prices. It’s used to smooth out price fluctuations.
How It Works in the Script:
The script calculates two EMAs:
Fast EMA (short-term average): Reacts quickly to price changes.
Slow EMA (long-term average): Reacts slower and shows overall trends.
When the Fast EMA crosses above the Slow EMA, it’s a signal to Buy.
When the Fast EMA crosses below the Slow EMA, it’s a signal to Sell.
These signals are marked on the chart as "Buy" and "Sell" labels.
3. Buy and Sell Alerts
The script sets up alerts for the user:
Buy Alert: When a crossover indicates a bullish signal.
Sell Alert: When a crossunder indicates a bearish signal.
Visual Elements on the Chart:
Background Colors:
Green: When the DI+ line indicates an uptrend.
Red: When the DI− line indicates a downtrend.
EMA Lines:
Green Line: Fast EMA.
Red Line: Slow EMA.
Buy/Sell Labels:
"Buy" label: Shown when the Fast EMA crosses above the Slow EMA.
"Sell" label: Shown when the Fast EMA crosses below the Slow EMA.
Why Use This Script?
Trend Analysis: Helps you quickly identify the strength and direction of the market trend.
Buy/Sell Signals: Gives clear signals to enter or exit trades based on trend and EMA crossovers.
Custom Alerts: Ensures you never miss a trading opportunity by notifying you when conditions are met.
Visual Simplicity: Makes it easy to interpret trading signals with color-coded backgrounds and labeled arrows.

RSI + ADX + ATR 18-01-25Combining RSI (Relative Strength Index), ADX (Average Directional Index), and ATR (Average True Range) creates a synergistic approach to technical analysis. This powerful trio covers momentum, trend strength, and volatility, providing comprehensive insights into market conditions. Here's a deeper exploration of their combined results:
1. Momentum Assessment with RSI
Purpose: RSI measures the speed and magnitude of recent price changes to determine overbought or oversold levels.
Benefit in Combination:
When RSI indicates overbought (above 70) or oversold (below 30) levels, it signals a potential reversal or correction.
However, these signals can be false in strongly trending markets, which is why ADX is used alongside it.
2. Trend Strength Confirmation with ADX
Purpose: ADX confirms the presence and strength of a trend.
Benefit in Combination:
If RSI shows a potential reversal but ADX indicates a strong trend (above 25), the trend is likely to continue, and RSI signals may need to be approached with caution.
Conversely, if ADX is below 20 (weak trend), RSI signals are more likely to indicate genuine reversals, as the market lacks a strong directional push.
3. Volatility Analysis with ATR
Purpose: ATR evaluates the level of price volatility.
Benefit in Combination:
High ATR values indicate volatile conditions where prices can move significantly; this helps in setting wider stop-loss levels to avoid premature exits.
Low ATR values suggest quieter markets, where tighter stop-losses and profit targets are more suitable.

ADXcellenceThis advanced trading indicator, inspired by Dr. Charles B. Schaap's book "ADXcellence: Power Trend Strategies", leverages the principles of the Average Directional Index (ADX) to help traders identify and exploit trending conditions in the market.
The ADXcellence Indicator uses multiple levels of analysis to evaluate the strength and direction of trends.
In addition to the classic ADX+DMI input settings, these features are included:
ADX Slope Signal: This parameter, controls the sensitivity of the ADX slope, which will indicate when the trend strength is increasing or decreasing.
The indicator provides three trend levels: strong trend level, trending level, and low volatility level, which can be customized to suit various trading strategies.
The color gradients for the ADX, DI+, and DI- lines are designed to visually represent the trend strength from the low volatility level to the strong trend level. The indicator also uses a dynamic background color, highlighting the periods when the ADX is rising. The color will vary depending on the dominant DI.
The ADXcellence Indicator also offers a unique feature of dynamically adjusting the fill between DI+ and DI-, with the color and fill intensity changing based on the relative value of the two.
This indicator is a powerful tool for traders who use trend-following strategies and is best used in conjunction with other technical analysis tools to confirm signals and avoid potential false signals.
Remember, no indicator is perfect and every trading strategy should include risk management and proper due diligence.
Enjoy :)

DJ Soori Trading StrategyThe strategy combines three indicators: Exponential Moving Average (EMA), Weighted Moving Average (WMA), and Average Directional Index (ADX).
The EMA and WMA are used to track the average price over different time periods.
The ADX measures the strength of a trend in the market.
The strategy generates buy signals when the EMA is higher than the WMA and the ADX is above a certain threshold. It suggests a potential uptrend.
It generates sell signals when the EMA is lower than the WMA and the ADX is above the threshold. It suggests a potential downtrend.
The strategy also considers whether the ADX is rising or falling to indicate the strength of the trend.
The EMA, WMA, and ADX values are plotted on the chart.
Buy and sell signals are shown as labels on the chart, indicating "Buy (Strong)" or "Buy (Weak)" for buy signals, and "Sell (Strong)" or "Sell (Weak)" for sell signals.

MarkRoboTS Highest Lowest ADX**********************************************
( M | a | r | k | R | o | b | o | T | S )
**********************************************
The indicator is created starting from the maximum and minimum values at 15 periods of the ADX ; the intermediate levels are created with the FIBO parameters.
level 0 = low_Period
level 1 = low_Period + (High_Period - low_Period) * 0.786
level 2 = low_Period + (High_Period - low_Period) * 0.618
level 3 = low_Period + (High_Period - low_Period) * 0.50
level 4 = low_Period + (High_Period - low_Period) * 0.382
level 5 = low_Period + (High_Period - low_Period) * 0.236
level 6 = High_Period
When ADX exceeds level 1 trend ( bullish or bearish ) gets strong
When ADX goes from level 6 to lower levels it means that the trend is weakening (better to close the position)
L'indicatore è creato partendo dai valori massimi e minimi a 15 periodi dell'ADX; i livelli intermedi sono creati con i parametri FIBO.
level 0 = low_Period
level 1 = low_Period + (High_Period - low_Period) * 0.786
level 2 = low_Period + (High_Period - low_Period) * 0.618
level 3 = low_Period + (High_Period - low_Period) * 0.50
level 4 = low_Period + (High_Period - low_Period) * 0.382
level 5 = low_Period + (High_Period - low_Period) * 0.236
level 6 = High_Period
Quando ADX supera il livello 1 il trend (rialzista o ribassista) prende forza
Quando ADX passa da livello 6 a livelli più bassi vuol dire che il trend si sta indebolendo (meglio chiudere la posizione)

COG SSMACD COL combo with ADX Filter [orion35]This indicator consists of a combination of indicators produced by the most valuable developers in the market.
These are: Center of Gravity (COG) and Super Smoothed MACD (SSMACD) shared by @KivancOzbilgic and Center of Linearity (COL) shared by @alexgrover
I produced this indicator by writing new conditions that compare the signals given by these indicators with each other. I re-coded the change in the thickness of the cloud from the COL indicator as the middle horizontal line with varying color intensity and type. I have provided options for switching between these three indicators when desired.
Note: The strongest signals in the indicator are the blue colored triangles. Moderately strong ones are yellow signals. White colored signals are considered as the weakest signals.
Some minor fixes:
Some confusing words were thrown in the alarms section,
Added new alarm codes for any Triple or Double signals.
Major changes have been made with this update.
It is very important to know the direction and strength of the trend in financial markets. Therefore, ADX (Average Directional movement index) was developed by J. Welles Wilder in 1978 as an indicator of the trend strength in the prices of a financial instrument.
Especially in sideways markets, most indicators produce many false signals. However, these signals can be filtered with the ADX indicator. The price is considered sideways when the ADX is less than 20 as the threshold value.
With this update,
ADX filter can be activated when desired, and signals can be filtered flexibly according to the "threshold" value determined by the user. When the ADX filter is active, it will also reflect on the alarm conditions. Therefore, if an alarm is to be set according to the ADX filter, the filter must be activated first.
The colors of the lines and signals have been made changeable.
The visual level and thickness of the COL line has been made adjustable.
With this update, signals can be filtered according to the MavilimW indicator developed by @KivancOzbilgic
Filter Methods:
Normal: If the price is below the BlueW line, "bull" signals are filtered out, and above "bear" signals are filtered out.
Reverse : Applies the opposite of the normal method.
Fixed some visual bugs in switching between indicators.

Measure Volume, Momentum, Trend, VolatilityThis script displays the following indicators in one pane to quickly determine several important factors regarding price action. It allows the user to quickly see all of most important factors surrounding price action in one pane with one quick glance. This should be incredibly helpful and allow things like double divergence and trend confirmation to be spotted much more quickly. I personally use the data in this indicator to replace four separate indicators and it has brought my win rate and profit factor significantly higher. I hadn't seen any place where all of the best J. Welles Wilder indicators such as RSI, Parabolic SAR, and DMI/ADX were brought into one easy to use interface. This is my attempt at fixing that gap. For a much deeper understanding of how to use these indicators, I recommend reading New Concepts in Technical Trading Systems written by J. Welles Wilder.
Momentum via RSI (Relative Strength Index)
Volume via MFI (Money Flow Index)
Volatility via DMI/ADX (Direction Movement Index/Average Directional Index)
Trend via Parabolic SAR (Parabolic Stop and Reverse)
It is worth noting that DMI/ADX and Parabolic SAR can both help determine trend strength and volatility.
The Volatility mechanism is measured by DMI and ADX and displayed at the top of the pane using circles. The top, tiny circles reflect if show if positive DI or negative DI has a higher value. The small circles directly underneath indicate whether or not the ADX is above 20 (configurable, some may choose to increase this to 25 or even 30).
The Momentum mechanism is shown as standard RSI with the default being a white line and default period of 14, which is all configurable.
The Volume mechanism is shown as standard MFI with the default being a fuchsia line and default period of 14, which is also configurable.
The momentum and volume oscillators should be used in conjunction to help spot whether the trend is strong or weak using divergences and the middle, overbought, and oversold levels. These levels are also configurable.
The Trend mechanism is measured by Parabolic SAR and displayed at the bottom of the pane using diamonds. The default is red diamonds when in a bear trend, green when in an uptrend which is configurable. When price is above the Parabolic SAR, it is considered to be an uptrend. When price is below the Parabolic SAR, it is considered to be a downtrend. The way price is measured is also configurable (i.e. open, close, ohlc4, hlc3, etc.). When price crossed above or below the Parabolic SAR, the diamonds will change colors.
All the indicators displayed should be used in a well rounded strategy. For instance, I only trade when ADX is above 20 and rarely trade against the trend shown via PSAR. When trend shifts and divergences helped indicate a trend shift would occur using the RSI and MFI, it can be a great spot to take an entry. RSI/MFI can also confirm the trend is strong when they are not showing divergences and inline with price action. All of this data should be used in conjunction with good fundamental data and technical levels. Divergences with RSI and MFI on double tops or bottoms can also be incredibly powerful. There is no right or wrong way to use all the data displayed in this indicator, however using all four pillars of trading (Momentum, Volume, Trend, Volatility) will help ensure only the best trades are taken.

The Namib SpikeThank you to Karl S who coded my idea. Below are the trigger conditions. Testing would be welcomed. I have not looked at the effectivity on higher or lower timeframes. Feedback highly appreciated.
A 3-tiered alert/notification system:
Level 1 Alert (Pop-up notification "Level 1 Bullish Alert" or "Level 1 Bearish Alert"
1. Determine bullish or bearish trend of price above or below 200 EMA
2. RSI level (customizable level)
3. ADX (customizable level as well as option to filter that the current ADX value is higher/lower as 1,2,3,4,or 5 candles ago)
AND/OR
Level 2 Alert (Pop-up notification "Level 2 Bullish Alert" or "Level 2 Bearish Alert"
1. Determine bullish or bearish trend of price above or below 200 EMA
2. RSI level (customizable level)
3. ADX (customizable level as well as option to filter that the current ADX value is higher/lower as 1,2,3,4,or 5 candles ago)
4. Higher Timeframe trends for 2 higher Timeframes (price above/below 200EMA) agrees with current Timeframe
AND/OR
Level 3 Alert (Pop-up notification "Level 3 Bullish Alert" or "Level 3 Bearish Alert"
1. Determine bullish or bearish trend of price above or below 200 EMA
2. RSI level (customizable level)
3. ADX (customizable level as well as option to filter that the current ADX value is higher/lower as 1,2,3,4,or 5 candles ago)
4. Higher Timeframe trends for 2 higher Timeframes (price above/below 200EMA) agrees with current Timeframe
5. Percentage (customizable) from previous H1/H4/D1/W1's (customizable) high & low prices

TridentI call this strategy "Trident", as it uses three different, modified, customizable indicators:
50 Exponential Moving Average (Trend)
Relative Strength Index (Momentum)
Average Directional Index (Volatility)
Strategy will be improved with future updates. You alone decide when to enter and when to exit a trade. PRICE ACTION IS KING and the TREND IS YOUR FRIEND
What do these three indicators tell us
Exponential Moving Average:
Trend
Price < EMA = downtrend
Price > EMA = uptrend
trend direction and reducing noise
Average Directional Index:
Volatility
direction of market movement when there is a sharp increase in volatility
Relative Strength Index:
Momentum
Strength
Possible shift in momentum
How this strategy works
As I mentioned above, this strategy uses uses three different, modified, customizable indicators:
Exponential Moving Average (50) (Trend): When price closes above or below the 50 period EMA, then the first condition is met. I know some people use multiple EMAs as dynamic support and resistance levels. Therefore, I also added a 21 and a 200 period EMA, but this strategy uses specifically the 50 period EMA as one of three conditions. All EMAs can be adjusted, turned on and off.
Relative Strength Index (80, 20, 3) (Momentum): In his video, TSM uses a 3 period RSI and 80 and 20 bands. If price is above 80, it`s overbought and if it`s below 20, then it`s oversold. Two out of three conditions are met.
Average Directional Index (5, 5) (Volatility): TSM uses the ADX to measure the volatility. Both ADX Smoothing and DI Length are set to 5. If this indicator moves above 30, then the third contidion is met.
Rules to enter the trade
Long Entry:
50 EMA < Price
RSI < 20
ADX > 30
Enter trade at breakout of high of the green candle, which is the candle that pulls the RSI from oversold conditions back inside.
Short Entry:
50 EMA > Price
RSI > 80
ADX > 30
Enter trade at breakout of low of the red candle, which is the candle that pulls the RSI from overbought conditions back inside.
Risk:Reward and Timeframe
Use a 1:1 to 1:1.5
Set your S/L below key levels (-> 2nd point @ Tips), or twice the length of the signal candle
Preferably 5 Minute Time Frame, but at the end you decide
Tips
Avoid periods of consolidation
Trade from support/resistance-levels, supply/demand-levels, pivot points-levels, Fibonacci-levels, swing high/low-levels
Trade during market hours, for example London and New York Session
Trade narrow spreads, if you scalp
Use Price Action
Trade with the trade, not against
The further away the price moves from the EMA the stronger the trend
The long the price doesn't touch the EMA the stronger the trend
RSI + ADX: Confirm when the market is turning and pick a good entry point
ADX + 50 EMA: Filters trades when there is not much activity in the market
I mentioned above that the code of this strategy is still under development. You can not only rely on this strategy alone as it might give you false signals. I coded this, because it makes it easier to visualize were all three conditions are met.
Use your brain, use price action, use these tips, use this strategy.
Frequently Asked Questions
Does it only work for scalping? - No, but try it out yourself
Does it only work for Forex? - No, but try it out yourself
Does only work on the 5 Minute Timeframe? - No, but try it out yourself
Good Luck!

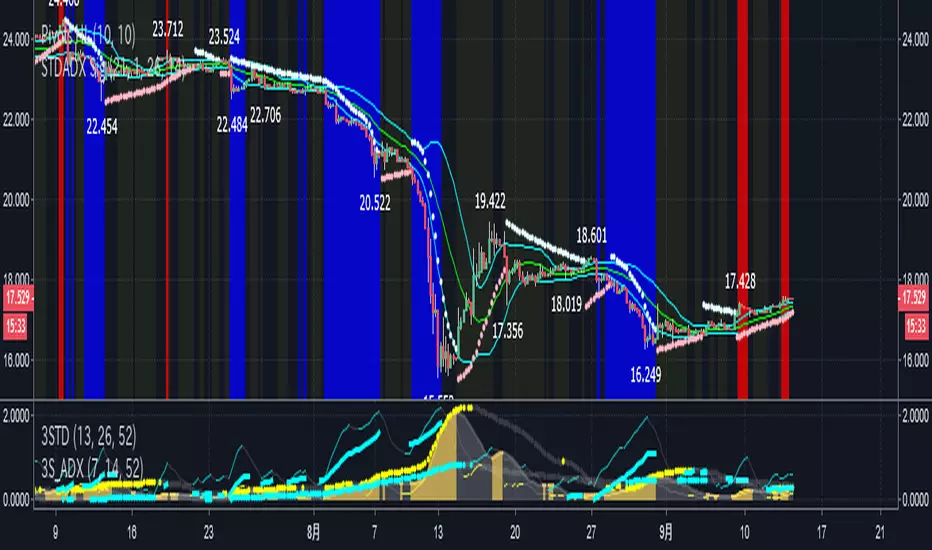
STD-ADX Trade Signal(Basic Ver1.0)==日本語説明も併記 // Japanese discription is following ==
Draw the trend judgment on the chart by combining the "ADX", "Standard deviation" and "Bollinger Band".
Red = Up trend
Blue = Down trend
Yellow = Range
" Triple Smoothed ADX "and" Triple Standard Deviation "in combination with" Triple STD-ADX "is recommended.
========================================================
「ADX」と「Standard Deviation」と「Bollinger Band」を組み合わせたトレンド判断をチャート上に描画します。
赤=上昇トレンド
青=下降トレンド
黄=レンジ
「 Triple Smoothed ADX 」と「 Triple Standard Deviation 」を組み合わせた「Triple STD-ADX」を併せて表示させることをおすすめします。
SUPERTREND ADX FACTOR Modular Trading System - SuperTrend + ADX + DI
A comprehensive trend-following system with customizable filters for precise trade execution.
CORE COMPONENTS:
- SuperTrend with visual fill (trend detection)
- ADX + Directional Indicators (trend strength confirmation)
- Volume filter (optional)
- EMAs 7/21/50 (optional)
- Daily VWAP (optional)
- Previous Day High/Low levels (support/resistance)
KEY FEATURES:
✓ One entry per trend - avoids overtrading
✓ Entry: ADX crosses above threshold with SuperTrend alignment
✓ Exit: SuperTrend direction change
✓ Real-time status dashboard showing all filter conditions
✓ Clear BUY/SELL signals with EXIT markers
✓ All filters can be toggled ON/OFF for testing
✓ Customizable parameters for each indicator
DASHBOARD DISPLAY:
- Live ADX value (green >23 / red <23)
- DI+/DI- values with color coding
- Volume metrics
- Position status (IN/OUT)
- Signal status (BUY/SELL/WAIT)
IDEAL FOR:
Swing traders and position traders on 4H timeframe looking for high-probability trend entries with proper confirmation.
Default configuration: SuperTrend (ATR 10, 3.0) + ADX >23 + DI alignment

QuantMotions - TPR SentinelQuantMotions – TPR Sentinel
The TPR Sentinel Band is a full trade-assistant for discretionary traders.
It combines an adaptive trend engine, directional TPR logic, volume intelligence, ATR-based risk management, a brute-force parameter optimizer, and a modern on-chart UI (entries/TP/SL panel + stats). The goal: fewer fake flips, clearer trend shifts, and visually guided trade management.
1. Core Concept
The Sentinel Line is built from a blend of:
- SMA + EMA
- Midline of highest/lowest high/low (Kijun-style)
- Donchian-style mid close
On top of that, the script calculates a Directional TPR (Time-Price-Ratio):
- Short / medium / long slopes of price
- Normalized by ATR
- Converted into a trend state:
+1 = Uptrend
-1 = Downtrend
0 = Neutral / transition
Hysteresis (Flux) controls how easily the trend flips:
- Higher hysteresis → harder to reverse → fewer fake-outs in chop.
2. Signals, Filters & Volume Intelligence
Signals
- Trend Flip Long: TrendState changes from −1/0 → +1.
- Trend Flip Short: TrendState changes from +1/0 → −1.
Filters
- ADX Filter (optional):
- Only allows trades if ADX is above a chosen threshold.
- Avoids trading in flat, low-energy markets.
R:R Filter:
- Before any signal is accepted, the script checks whether the distance to TP1 is at least the configured Risk:Reward ratio relative to the distance to SL.
- Only if that minimum R:R is reached, a signal becomes valid.
Volume Intelligence & Clouds
- Aggregates up/down volume (optionally across multiple tickers you define).
- Builds Volume Clouds around the Sentinel Line:
a) Positive intensity → buying pressure (bullish cloud).
b) Negative intensity → selling pressure (bearish cloud).
Optional Volume Direction Filter:
- Long only when volume intensity ≥ 0.
- Short only when volume intensity ≤ 0.
3. Risk, Exits & Trailing Stop
The indicator includes a complete exit framework (for visual/manual trading):
Stop Loss Modes
- ATR Fixed: SL placed at a fixed ATR multiple from the entry.
- Trend Line (Dynamic): SL placed directly on the Sentinel Band (structural stop).
Take Profits
- TP1 – “safe target”:
a) Based on ATR distance.
b) Closes a configurable percentage of the position (e.g., 50%).
- TP2 (optional):
Second fixed target used only when Trailing Stop is OFF.
- Trend Runner Mode (Use TP = OFF):
Ignores fixed TP levels and rides the trend until the trend state flips.
Trailing Stop
- Activates after TP1 is hit (if enabled).
- Moves with price at a configurable ATR distance:
a) Long: trail creeps up under price.
b) Short: trail creeps down above price.
- Visually plotted as a purple trail line, dynamically replacing the original SL as the effective exit point.
Each trade is tracked internally and drawn as a green/red box with PnL labels between entry and exit.
4. UI & Stats
Candle Coloring (TRON Theme)
- Cyan = active uptrend & valid environment.
- Orange = active downtrend & valid environment.
Modern Trade Panel (on last bar)
- Live overlay of:
a) Entry
b) TP1
c) TP2
d) SL or active Trail (with dynamic label text: “SL (ATR)”, “SL (Struct)”, “TRAIL”)
Info label shows:
- Historical win rate in the current direction (Long/Short).
- Distance to SL, TP1, TP2 from current price.
- Box color blends from red → green depending on whether price is closer to SL or TP.
Stats Table (Bottom Right)
- Separate stats for Long and Short trades:
a) Win rate (%)
b) Cumulative PnL
Alerts
- Generates JSON alerts on signals, for example: {"side":"buy","ticker":"XYZ","price":123.45}
Perfect for webhooks, bots, or external automation.
5. Brute Force Optimizer (TPR Lab) – Important Limitations
The built-in Optimizer is a numerical helper, not a full strategy optimizer.
What it does:
- Runs brute-force simulations over a sliding window of historical data.
- Scans user-defined ranges for:
- Best Period (“Best Cycle”)
- Best Hysteresis (“Best Flux”)
Uses an efficiency score (average profit per trade) to rank combinations.
Displays results in the bottom-left TRON panel:
- Best Cycle
- Best Hysteresis
- Efficiency Score
What it does NOT optimize or take into account:
- It does not include your actual minimum R:R filter.
- It does not simulate or optimize your Stop Loss modes.
- It does not simulate Trailing Stops.
- It does not use the ADX filter.
- It does not use the Volume filters or Volume Clouds.
Because of this, the suggested “best” Period and Hysteresis are purely computational recommendations based on a simplified internal model.
In real trading, with your full setup (R:R filter, SL mode, Trailing, ADX, Volume confirmation, personal style), other parameter combinations can be superior to what the Optimizer suggests.
You should treat the Optimizer as:
A starting point or a research tool, not the final truth.
Always validate its suggestions visually, in the context of your full system and risk management.
6. Practical Usage
- Works on FX, indices, crypto, commodities – anything with decent liquidity.
- Scalping → use lower Period values, higher responsiveness.
- Swing → use higher Period values, more stability.
Recommended:
- Keep ADX filter ON to avoid dead markets.
- Use Volume Clouds as directional bias.
- Use the Info Panel and Stats to align with your own R:R and risk rules.
Disclaimer
This script is for educational/analytical purposes only and does not constitute financial advice. It does not execute trades or manage your risk automatically. Always combine it with your own strategy, money management, and independent decision-making.
Use the Info Panel and Stats to align with your own R:R and risk rules.
