BOT O/C-EMA-SAR-ADX-ICHIMOKUIt is a study based on Open Close, crossing of EMA's, ADX, PARABOLIC SAR, RSI and VOLUME. He also has alerts and does not repaint.
Cerca negli script per "adx"

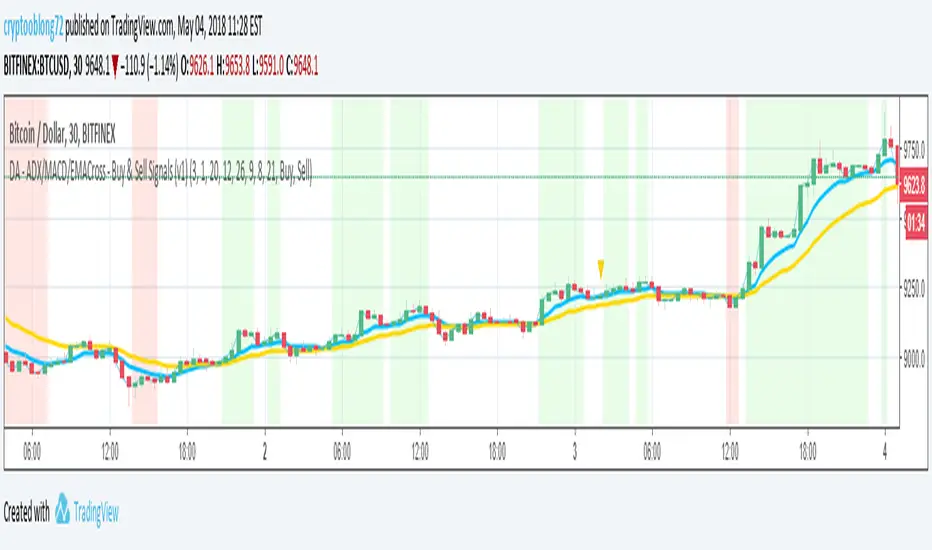
DA - ADX/MACD/EMACross - Buy & Sell Signals (v1)DA - ADX/MACD/EMACross - Buy & Sell Signals (v1)
Version 1
04/05/2018
By Digital Assassins
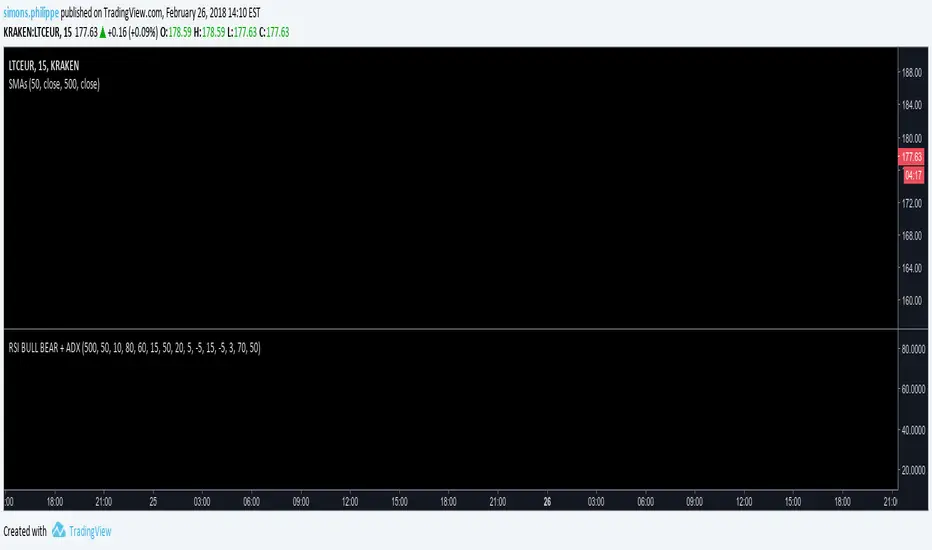
RSI BULL BEAR + ADXlong-signal when crossig the lower threshold
short-signal when crossing the upper threshold
Bryan - Multi Indicator v2Developed as a professional service and published for customer acceptance/verification.
Notes
Ichimoku and ADX combined strategy.
Strategy logic ported to the indicator to allow automation through 3rd party services. (Position management, orders etc)
Long and exit long alert conditions created
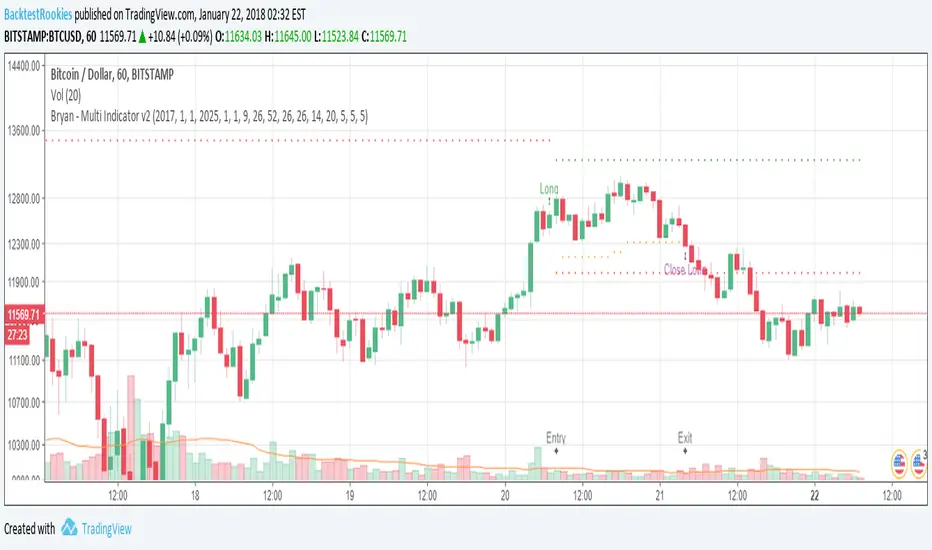
Bryan - Multi IndicatorCustom Indicator - Developed for a Backtest-Rookies customer and published for testing and acceptance.
Ichimoku + ADX combined indicator with custom entry criteria and plotting for buy signals.

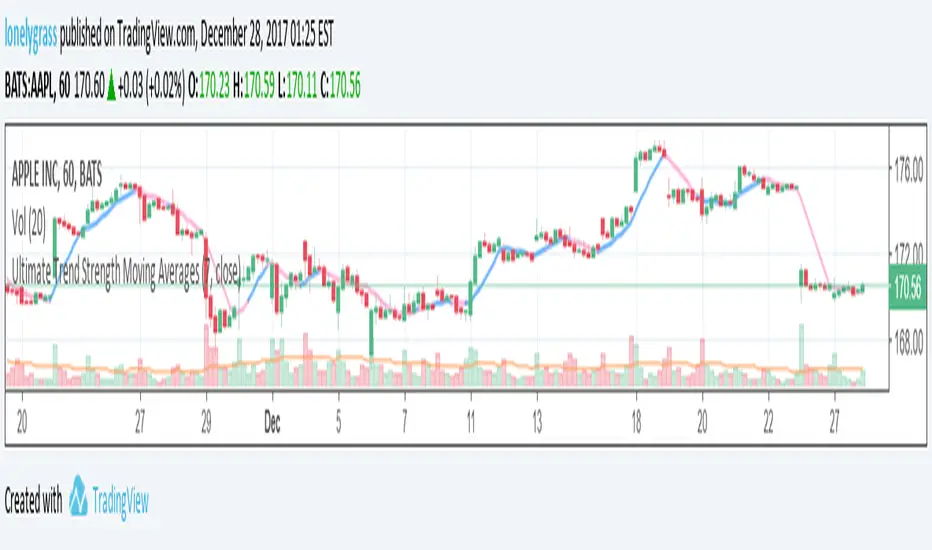
Ultimate Trend Strength Moving AveragesHi , this is lonelygrass. Since the day I joined Tradingview, I decided to challenge myself and to code at least one indicator every single day. Keep grinding, stay focused and everything will pay off.
It is called "Ultimate Trend Strength Moving Averages" .
I have taken several factors to write this moving average indicator, adx ,bar location (above/below the moving average), open v close, to name a few.
It is meant to let users know the current market trend in a timely order. I can say that this will be one of the most practical indicators for intraday, swing and other kinds of trading.
Users can select the sort of moving average they would like to use, such as SMA, EMA, WMA and VWMA, and just change the time span you want to look at! Blue color signalizes an uptrend while pink color signalizes a downtrend. Let's utilize it to its fullest.
Happy trading! Stay tuned!
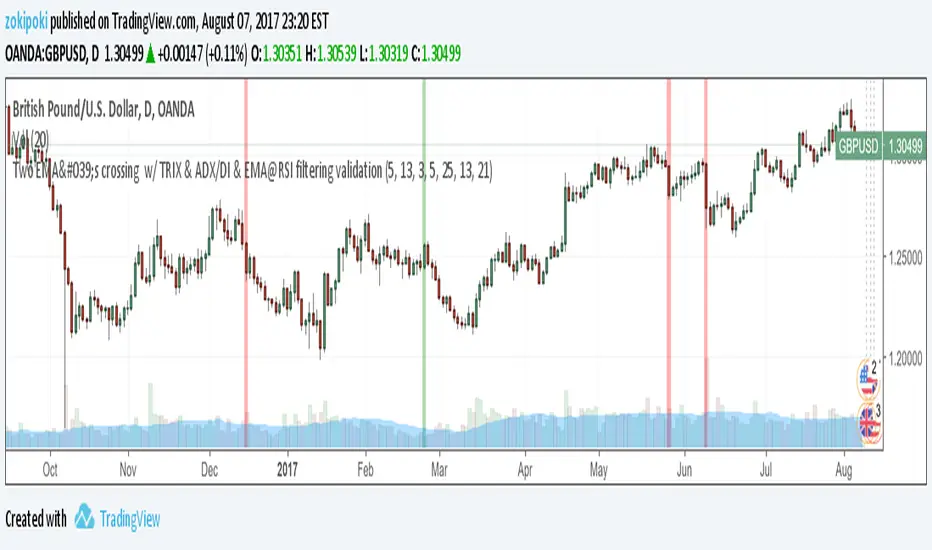
Two EMA's crossing w/ TRIX & ADX/DI & EMA@RSI filteringThe initial idea for the "X-candle" script is from @nmike, and the requirement was to mark the bar with positive or negative as EMA(5) and EMA(13) cross. Later, it was requested to filter the above with Trix(3) so it just crosses the "zero" line and goes in either positive or negative territory - confirming the EMA's crossing.
In addition, one of my ideas was to integrate 2 more rules, and the final looked something like this ...
The script marks the candle vertical background with green or red when all 4 rules are satisfied:
1. Between the current and previous bar has to be a cross of the EMA lines (by default: EMA 5 and EMA 13)
2. The current bar is the first or second bar crossing the zero TRIX line ... going in either Positive or Negative range, confirming the first rule
3. ADX is above threshold 25 & DI is also valid (higher than the opposite DI) ... confirming trend direction and strength
4. EMA(21) on top of RSI(13), one of my favorites, so it has to be valid also
At the end the script did extensive filtering, and it does filter some good ones also. Needs more work, less filtering, more tolerance, and new rules. All of the above indicator parameters can be modified easily, so anybody can play with. If you find some better indicator parameters that will provide a more efficient filtering, please let us know and drop me a note.
Thanks!
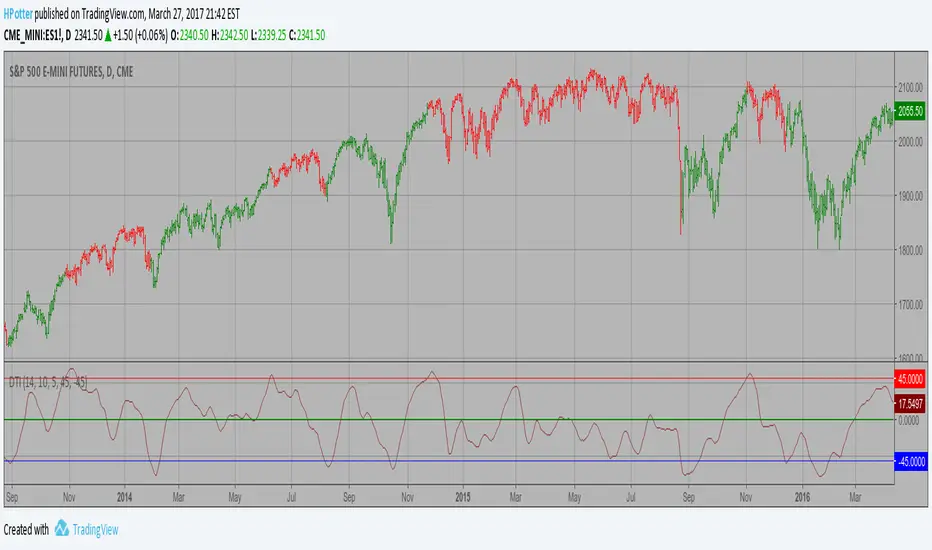
Directional Trend Index (DTI) Strategy This technique was described by William Blau in his book "Momentum,
Direction and Divergence" (1995). His book focuses on three key aspects
of trading: momentum, direction and divergence. Blau, who was an electrical
engineer before becoming a trader, thoroughly examines the relationship between
price and momentum in step-by-step examples. From this grounding, he then looks
at the deficiencies in other oscillators and introduces some innovative techniques,
including a fresh twist on Stochastics. On directional issues, he analyzes the
intricacies of ADX and offers a unique approach to help define trending and
non-trending periods.
Directional Trend Index is an indicator similar to DM+ developed by Welles Wilder.
The DM+ (a part of Directional Movement System which includes both DM+ and
DM- indicators) indicator helps determine if a security is "trending." William
Blau added to it a zeroline, relative to which the indicator is deemed positive or
negative. A stable uptrend is a period when the DTI value is positive and rising, a
downtrend when it is negative and falling.
HYPER ADX V2Fixed version of ADXH. There was a render problem at new bar formation in previous version.

Intraday TS ,BB + Buy/Sell +Squeeze Mom.+ adx-dmiIntraday 5+ min indicator/strategy. Mix of indicator as BB, Ema , Roc , adx/dmi with buy and TP/SL point. All in 1 indicator easy to use . Just look the color chnge and the shape add the the bars

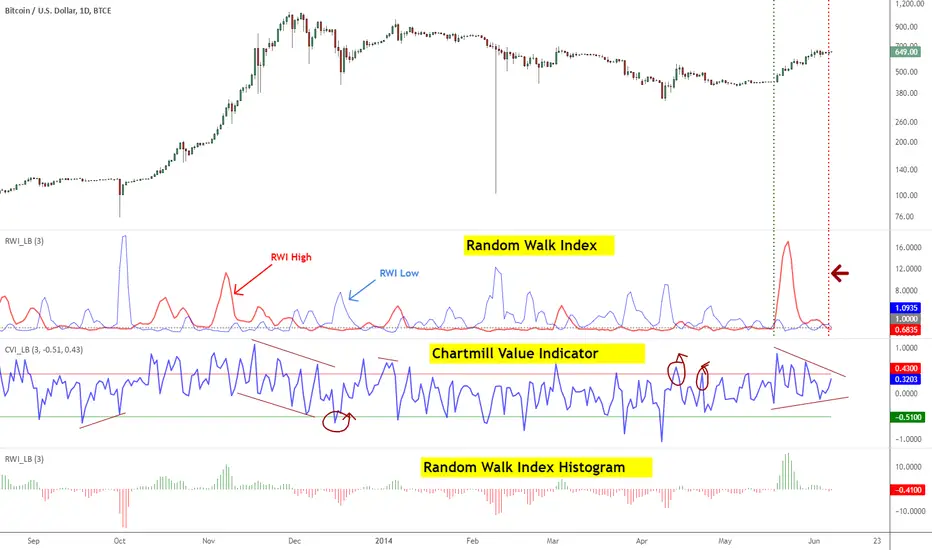
Indicators: Chartmill Value Indicator & Random Walk IndexChartMill Value Indicator & Modified ChartMill Value Indicator :
-------------------------------
Developed by Dirk Vandycke, CVI tracks how far the price spread is from its MA. Since MA keeps increasing even when price consolidates or stalls, it is very difficult for the deviation from a moving average to remain in the overbought or oversold regions for extended periods, which represents a significant improvement over other oscillators such as the RSI and Stochastic indicators.
However, a simple price spread from a moving average would not be comparable across all securities, which would preclude us from using the spread in systematic strategies. Fortunately, Mr.Vandycke addresses this problem by dividing the spread by the average true range, which is dependent on both the price level and volatility of the underlying security.
There is a variation of CVI called Modified CVI, which does time normalization of ATR (not the MA). This indicator supports displaying "Modified CVI" too. Check the options page.
This indicator is best used with other oscillators, to confirm signals. Zero line (in this case, "1" line since the gray line is drawn at the value of 1) crossovers should also be considered as signals.
I suggest tuning the OB/OS levels to match your instrument (usually it is around 0.5/-0.5 range).
More info:
www.traders.com
Random Walk Index
-------------------------
RWI is used to determine if an issue is trending or in a random trading range (like ADX/Aroon). It attempts to do this by first determining an issue's trading range. The next step is to calculate a series of RWI indexes for the maximum look-back period. The largest index move in relation to a random walk is used as today's index.
Michael Poulos, inventor of RWI, recommends 2 to 7 for the short-term time frames and 8-64 for long terms. An issue is trending higher if the long term RWI of highs is greater than 1, while a downtrend is indicated if the long term RWI of lows is greater than 1.
Below are some more rules developed by Mr.Poulos:
- Enter a long (or close short) when the long-term RWI of the highs is greater than 1 and the short-term RWI of lows peaks above 1
- Enter short (or close long) when the long-term RWI of the lows is greater than 1 and the short-term RWI of highs peaks above 1
More info:
- tradingsim.com
For displaying only the histogram (as shown in the bottom pane), select "ShowOnlyHistogram" in the options page.


ADX y DI + ATRADR + DI
Every time ADR cross 25, print an ATR value label
Every time ADR +25 and DI+ cross DI-, print an ATR value label
Every time ADR +25 and DI- cross DI+, print an ATR value label
I use ATR for my SL.

ADX + RSI + Volume Adjusted CandlesThis simple but beautiful script does a few things;
It modulates the transparency of drawn candles based on trend strength
It modulates between the specified buy and sell colours based on volume - e.g. higher buys = stronger buy colour, higher sells = stronger sell colour
It draws configurable RSI supports and resistances
It solid fills candles that close above their volume-weighted moving average
I've found myself consistently reaching for these tools individually on almost every chart I open, so I figured I'd throw something together that does all of that whilst being theme-able.
Enjoy.

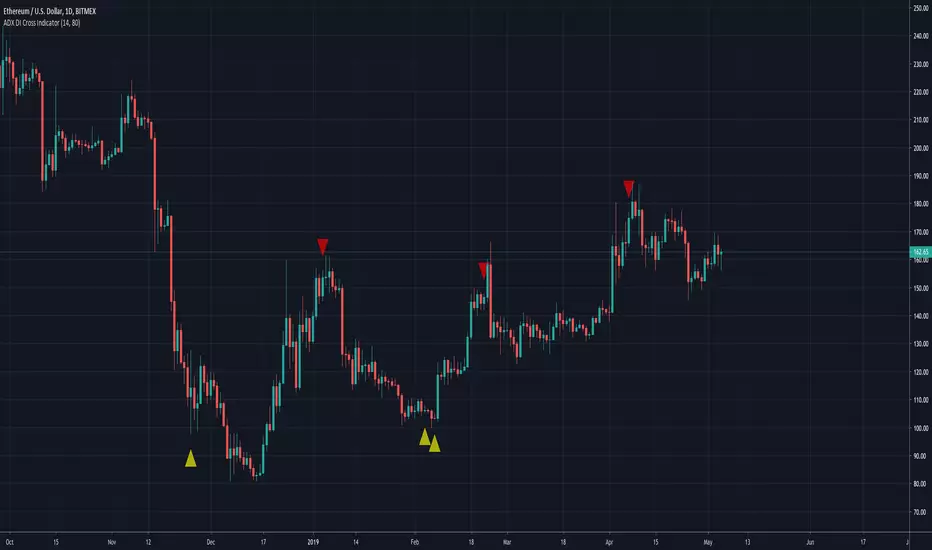
ADX DI Signal v1.BitUniversityAverage Directional Index with buy and sell signals
This oscillator is used in a training course conducted by @Bituniversity
For a reliable trading you need more information related to market and this oscillator just give us a big picture of of the market.
Please, do not trade just using this tool alone.

ADX and DI+ & DI- sub levelsThis indicator contains 3 levels of configuration to measure the strength of DI + and DI- when any of the two is below level 20 it is possible that the price will change trend.
Este indicador contiene 3 niveles de configuracion para medir la fuerza de DI+ y DI- cuando cualquira de los dos este por debajo del nivel 20 es posible que el precio cambie de tendencia.

ADX indicatorUsed for trendanalysis - fill colors give the user an idea of trend direction - and/or shift in trend.
Enjoy