Momentum Cloud.V33🌟 Introducing MomentumCloud.V33 🌟
MomentumCloud.V33 is a cutting-edge indicator designed to help traders capture market momentum with clarity and precision. This versatile tool combines moving averages, directional movement indexes (DMI), and volume analysis to provide real-time insights into trend direction and strength. Whether you’re a scalper, day trader, or swing trader, MomentumCloud.V33 adapts to your trading style and timeframe, making it an essential addition to your trading toolkit. 📈💡
🔧 Customizable Parameters:
• Moving Averages: Adjust the periods of the fast (MA1) and slow (MA2) moving averages to fine-tune your trend analysis.
• DMI & ADX: Customize the DMI length and ADX smoothing to focus on strong, actionable trends.
• Volume Multiplier: Modify the cloud thickness based on trading volume, emphasizing trends with significant market participation.
📊 Trend Detection:
• Color-Coded Clouds:
• Green Cloud: Indicates a strong uptrend, suggesting buying opportunities.
• Red Cloud: Indicates a strong downtrend, signaling potential short trades.
• Gray Cloud: Reflects a range-bound market, helping you avoid low-momentum periods.
• Dynamic Volume Integration: The cloud thickness adjusts dynamically with trading volume, highlighting strong trends supported by high market activity.
📈 Strength & Momentum Analysis:
• Strength Filtering: The ADX component ensures that only strong trends are highlighted, filtering out market noise and reducing false signals.
• Visual Momentum Gauge: The cloud color and thickness provide a quick visual representation of market momentum, enabling faster decision-making.
🔔 Alerts:
• Custom Alerts: Set up alerts for when the trend shifts or reaches critical levels, keeping you informed without needing to constantly monitor the chart.
🎨 Visual Enhancements:
• Gradient Cloud & Shadows: The indicator features a gradient-filled cloud with shadowed moving averages, enhancing both aesthetics and clarity on your charts.
• Adaptive Visual Cues: MomentumCloud.V33’s color transitions and dynamic thickness provide an intuitive feel for the market’s rhythm.
🚀 Quick Guide to Using MomentumCloud.V33
1. Add the Indicator: Start by adding MomentumCloud.V33 to your chart. Customize the settings such as MA periods, DMI length, and volume multiplier to match your trading style.
2. Analyze the Market: Observe the color-coded cloud and its thickness to gauge market momentum and trend direction. The thicker the cloud, the stronger the trend.
3. Set Alerts: Activate alerts for trend changes or key levels to capture trading opportunities without needing to watch the screen continuously.
⚙️ How It Works:
MomentumCloud.V33 calculates market momentum by combining moving averages, DMI, and volume. The cloud color changes based on the trend direction, while its thickness reflects the strength of the trend as influenced by trading volume. This integrated approach ensures you can quickly identify robust market movements, making it easier to enter and exit trades at optimal points.
Settings Overview:
• Moving Averages: Define the lengths for the fast and slow moving averages.
• DMI & ADX: Adjust the DMI length and ADX smoothing to focus on significant trends.
• Volume Multiplier: Customize the multiplier to control cloud thickness, highlighting volume-driven trends.
📚 How to Use MomentumCloud.V33:
• Trend Identification: The direction and color of the cloud indicate the prevailing trend, while the cloud’s thickness suggests the trend’s strength.
• Trade Execution: Use the green cloud to look for long entries and the red cloud for short positions. The gray cloud advises caution, as it represents a range-bound market.
• Alerts: Leverage the custom alerts to stay on top of market movements and avoid missing critical trading opportunities.
Unleash the power of trend and momentum analysis with MomentumCloud.V33! Happy trading! 📈🚀✨
Cerca negli script per "adx"

Session MasterSession Master Indicator
Overview
The "Session Master" indicator is a unique tool designed to enhance trading decisions by providing visual cues and relevant information during the critical last 15 minutes of a trading session. It also integrates advanced trend analysis using the Average Directional Index (ADX) and Directional Movement Index (DI) to offer insights into market trends and potential entry/exit points.
Originality and Functionality
This script combines session timing, visual alerts, and trend analysis in a cohesive manner to give traders a comprehensive view of market behavior as the trading day concludes. Here’s a breakdown of its key features:
Last 15 Minutes Highlight : The script identifies the last 15 minutes of the trading session and highlights this period with a semi-transparent blue background, helping traders focus on end-of-day price movements.
Previous Session High and Low : The script dynamically plots the high and low of the previous trading session. These levels are crucial for identifying support and resistance and are highlighted with dashed lines and labeled for easy identification during the last 15 minutes of the current session.
Directional Movement and Trend Analysis : Using a combination of ADX and DI, the script calculates and plots trend strength and direction. A 21-period Exponential Moving Average (EMA) is plotted with color coding (green for bullish and red for bearish) based on the DI difference, offering clear visual cues about the market trend.
Technical Explanation
Last 15 Minutes Highlight:
The script checks the current time and compares it to the session’s last 15 minutes.
If within this period, the background color is changed to a semi-transparent blue to alert the trader.
Previous Session High and Low:
The script retrieves the high and low of the previous daily session.
During the last 15 minutes of the session, these levels are plotted as dashed lines and labeled appropriately.
ADX and DI Calculation:
The script calculates the True Range, Directional Movement (both positive and negative), and smoothes these values over a specified length (28 periods by default).
It then computes the Directional Indicators (DI+ and DI-) and the ADX to gauge trend strength.
The 21-period EMA is plotted with dynamic color changes based on the DI difference to indicate trend direction.
How to Use
Highlight Key Moments: Use the blue background highlight to concentrate on market movements in the critical last 15 minutes of the trading session.
Identify Key Levels: Pay attention to the plotted high and low of the previous session as they often act as significant support and resistance levels.
Assess Trend Strength: Use the ADX and DI values to understand the strength and direction of the market trend, aiding in making informed trading decisions.
EMA for Entry/Exit: Use the color-coded 21-period EMA for potential entry and exit signals based on the trend direction indicated by the DI.
Conclusion
The "Session Master" indicator is a powerful tool designed to help traders make informed decisions during the crucial end-of-session period. By combining session timing, previous session levels, and advanced trend analysis, it provides a comprehensive overview that is both informative and actionable. This script is particularly useful for intraday traders looking to optimize their strategies around session close times.

Adaptive Price Channel StrategyThis strategy is an adaptive price channel strategy based on the Average True Range (ATR) indicator and the Average Directional Index (ADX). It aims to identify sideways markets and trends in the price movements and make trades accordingly.
The strategy uses a length parameter for the ATR and ADX indicators, which determines the length of the calculation for these indicators. The strategy also uses an ATR multiplier, which is multiplied by the ATR to determine the upper and lower bounds of the price channel.
The first step of the strategy is to calculate the highest high (HH) and lowest low (LL) over the specified length. The ATR is also calculated over the same length. Then the strategy calculates the positive directional indicator (+DI) and negative directional indicator (-DI) based on the up and down moves in the price, and uses these to calculate the ADX.
If the ADX is less than 25, the market is considered to be in a sideways phase. In this case, if the price closes above the upper bound of the price channel (HH - ATR multiplier * ATR), the strategy enters a long position, and if the price closes below the lower bound of the price channel (LL + ATR multiplier * ATR), the strategy enters a short position.
If the ADX is greater than or equal to 25 and the +DI is greater than the -DI, the market is considered to be in a bullish phase. In this case, if the price closes above the upper bound of the price channel, the strategy enters a long position. If the ADX is greater than or equal to 25 and the +DI is less than the -DI, the market is considered to be in a bearish phase. In this case, if the price closes below the lower bound of the price channel, the strategy enters a short position.
The strategy exits a position after a certain number of bars have passed since the entry, as specified by the exit_length input.
In summary, this strategy attempts to trade in accordance with the prevailing market conditions by identifying sideways markets and trends and making trades based on price movements within a dynamically-adjusted price channel.
This strategy takes a read on the market and either takes a channel strategy or trades volatility based on current trend. Works well on 2, 3 ,4, 12 hour for BTC. It’s my first attempt and creating a strategy. I am very interested in constructive criticism. I will look into better risk management, maybe a trailing stop loss. Other suggestions welcome. This is my first attempt at a strategy.
Here are the settings I used.
Inputs
Length 20
Exit 10
ATR 3.2
Dates I picked when I got into Crypto
Properties
Capital 1000
Order size 2 Contracts
Pyramiding 1
Commission .05

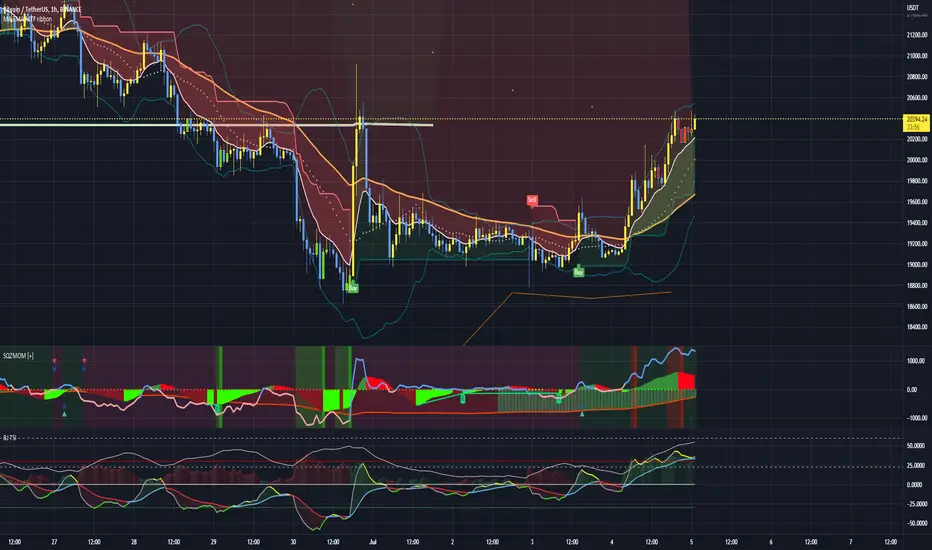
Squeeze Momentum Indicator + 2.0This is a squeeze momentum oscillator with ADX-RSI, Elliot waves oscillator, HMA background and more.
I recommend configure ADX-RSI with the following settings:
-ADX Length = 14
-ADX smooth = 14
-RSI Length = 14
-Threshold = 15
-Upline = 70
-Downline = 30
Thanks to OskarGallard for develop this indicator.
I am Sc4lp1ng, the developer of EMA MTF cloud and TSI-ADX Histogram.
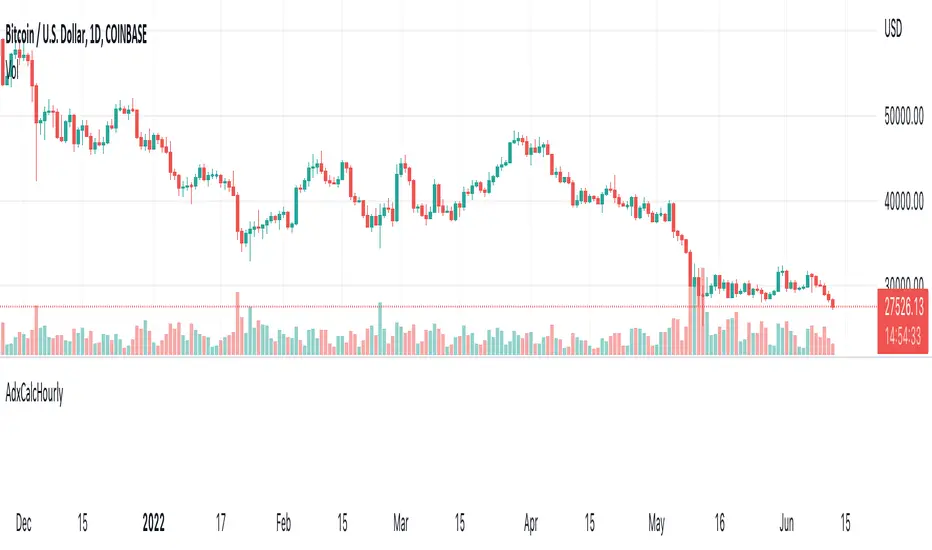
AdxCalcHourlyLibrary "AdxCalcHourly"
getBars()
getBars: Returns the number of bars to use in the historical lookback period
Returns: simple int
directionDown()
directionDown: Calculates the direction down for bar_index
Returns: series float
directionUp()
directionUp: Calculates the direction up for bar_index
Returns: series float
trueRangeMovingAverage()
trueRangeMovingAverage: Calculates the true range moving average over the historical lookback period
Returns: series float
positiveDirectionalMovement()
positiveDirectionalMovement: Calculates the positive direction movement for bar_index
Returns: series float
negativeDirectionalMovement()
negativeDirectionalMovement: Calculates the begative direction movement for bar_index
Returns: series float
totalDirectionDown()
totalDirectionDown: Calculates the total direction down for the historical lookback period
Returns: series float
totalDirectionUp()
totalDirectionUp: Calculates the total direction up for the historical lookback period
Returns: series float
totalDirection()
totalDirection: Calculates the total direction movement for the historical lookback period
Returns: series float
averageDirectionalIndex()
averageDirectionalIndex: Calculates the average directional index (ADX) based on the trend for the historical lookback period
Returns: series float
getAdxHistoricalAverage()
getAdxHistoricalAverage: Calculates the average directional index (ADX) for the historical lookback period
Returns: series float
getAdxHistoricalHigh()
getAdxHistoricalHigh: Calculates the historical high of the directional index (ADX) for the historical lookback period
Returns: series float
getAdxHistoricalLow()
getAdxHistoricalLow: Calculates the historical low of the directional index (ADX) for the historical lookback period
Returns: series float
getAdxOpinion()
getAdxOpinion: Calculatesa recomendation for the directional index (ADX) based on the historical lookback period
Returns: series float
Adaptive Average Vortex Index [lastguru]As a longtime fan of ADX, looking at Vortex Indicator I often wondered, where is the third line. I have rarely seen that anybody is calculating it. So, here it is: Average Vortex Index - an ADX calculated from Vortex Indicator. I interpret it similarly to the ADX indicator: higher values show stronger trend. If you discover other interpretation or have suggestions, comments are welcome.
Both VI+ and VI- lines are also drawn. As I use adaptive length calculation in my other scripts (based on the libraries I've developed and published), I have also included the possibility to have an adaptive length here, so if you hate the idea of calculating ADX from VI, you can disable that line and just look at the adaptive Vortex Indicator.
Note that as with all my oscillators, all the lines here are renormalized to -1..1 range unlike the original Vortex Indicator computation. To do that for VI+ and VI- lines, I subtract 1 from their values. It does not change the shape or the amplitude of the lines.
Adaptation algorithms are roughly subdivided in two categories: classic Length Adaptations and Cycle Estimators (they are also implemented in separate libraries), all are selected in Adaptation dropdown. Length Adaptation used in the Adaptive Moving Averages and the Adaptive Oscillators try to follow price movements and accelerate/decelerate accordingly (usually quite rapidly with a huge range). Cycle Estimators, on the other hand, try to measure the cycle period of the current market, which does not reflect price movement or the rate of change (the rate of change may also differ depending on the cycle phase, but the cycle period itself usually changes slowly).
VIDYA - based on VIDYA algorithm. The period oscillates from the Lower Bound up (slow)
VIDYA-RS - based on Vitali Apirine's modification of VIDYA algorithm (he calls it Relative Strength Moving Average). The period oscillates from the Upper Bound down (fast)
Kaufman Efficiency Scaling - based on Efficiency Ratio calculation originally used in KAMA
Fractal Adaptation - based on FRAMA by John F. Ehlers
MESA MAMA Cycle - based on MESA Adaptive Moving Average by John F. Ehlers
Pearson Autocorrelation* - based on Pearson Autocorrelation Periodogram by John F. Ehlers
DFT Cycle* - based on Discrete Fourier Transform Spectrum estimator by John F. Ehlers
Phase Accumulation* - based on Dominant Cycle from Phase Accumulation by John F. Ehlers
Length Adaptation usually take two parameters: Bound From (lower bound) and To (upper bound). These are the limits for Adaptation values. Note that the Cycle Estimators marked with asterisks(*) are very computationally intensive, so the bounds should not be set much higher than 50, otherwise you may receive a timeout error (also, it does not seem to be a useful thing to do, but you may correct me if I'm wrong).
The Cycle Estimators marked with asterisks(*) also have 3 checkboxes: HP (Highpass Filter), SS (Super Smoother) and HW (Hann Window). These enable or disable their internal prefilters, which are recommended by their author - John F. Ehlers . I do not know, which combination works best, so you can experiment.
If no Adaptation is selected ( None option), you can set Length directly. If an Adaptation is selected, then Cycle multiplier can be set.
The oscillator also has the option to configure the internal smoothing function with Window setting. By default, RMA is used (like in ADX calculation). Fast Default option is using half the length for smoothing. Triangle , Hamming and Hann Window algorithms are some better smoothers suggested by John F. Ehlers.
After the oscillator a Moving Average can be applied. The following Moving Averages are included: SMA , RMA, EMA , HMA , VWMA , 2-pole Super Smoother, 3-pole Super Smoother, Filt11, Triangle Window, Hamming Window, Hann Window, Lowpass, DSSS.
Postfilter options are applied last:
Stochastic - Stochastic
Super Smooth Stochastic - Super Smooth Stochastic (part of MESA Stochastic ) by John F. Ehlers
Inverse Fisher Transform - Inverse Fisher Transform
Noise Elimination Technology - a simplified Kendall correlation algorithm "Noise Elimination Technology" by John F. Ehlers
Momentum - momentum (derivative)
Except for Inverse Fisher Transform , all Postfilter algorithms can have Length parameter. If it is not specified (set to 0), then the calculated Slow MA Length is used. If Filter/MA Length is less than 2 or Postfilter Length is less than 1, they are calculated as a multiplier of the calculated oscillator length.
More information on the algorithms is given in the code for the libraries used. I am also very grateful to other TradingView community members (they are also mentioned in the library code) without whom this script would not have been possible.

Mawreez' Trend OscillatorA positive reading indicates an uptrend, a negative reading indicates a downtrend. For an uptrend, increasing values indicate that the trend is sustaining or strengthening while decreasing values indicate that the trend is stagnating or weakening. Vice versa for a downtrend. When the indicator reads 0, the price is not trending.
This indicator is based on the existing DMI indicator, but familiarity with the DMI is not required. The author's goal was to make a less laggy, more intuitively interpretable indicator compared to the DMI.
A comparison to the DMI is given above. The reader may see for themselves that trends are recognized quicker. A technical rundown of adjustments made to the DMI is given below.
Instead of interpreting the ADX, a sensitivity setting is added and its default value is 25. The value of this sensitivity setting is subtracted from the ADX. Then, any ADX values which fell below 0 are set to 0. Now, just flip the value of the ADX when the -DI is greater than the +DI. The result is then plotted as a histogram.
In addition, this indicator has less lag between price action and trend recognition. This is achieved by removing the EMA applied to the ADX, and instead applying lag-free smoothing to +DI and -DI before computing the ADX and then once more applying lag-free smoothing to the result of the computation.

Combo Backtest 123 Reversal and ADXR This is combo strategies for get
a cumulative signal. Result signal will return 1 if two strategies
is long, -1 if all strategies is short and 0 if signals of strategies is not equal.
First strategy
This System was created from the Book "How I Tripled My Money In The
Futures Market" by Ulf Jensen, Page 183. This is reverse type of strategies.
The strategy buys at market, if close price is higher than the previous close
during 2 days and the meaning of 9-days Stochastic Slow Oscillator is lower than 50.
The strategy sells at market, if close price is lower than the previous close price
during 2 days and the meaning of 9-days Stochastic Fast Oscillator is higher than 50.
Secon strategy
The Average Directional Movement Index Rating (ADXR) measures the strength
of the Average Directional Movement Index (ADX). It's calculated by taking
the average of the current ADX and the ADX from one time period before
(time periods can vary, but the most typical period used is 14 days).
Like the ADX, the ADXR ranges from values of 0 to 100 and reflects strengthening
and weakening trends. However, because it represents an average of ADX, values
don't fluctuate as dramatically and some analysts believe the indicator helps
better display trends in volatile markets.
WARNING:
- For purpose educate only
- This script to change bars colors.

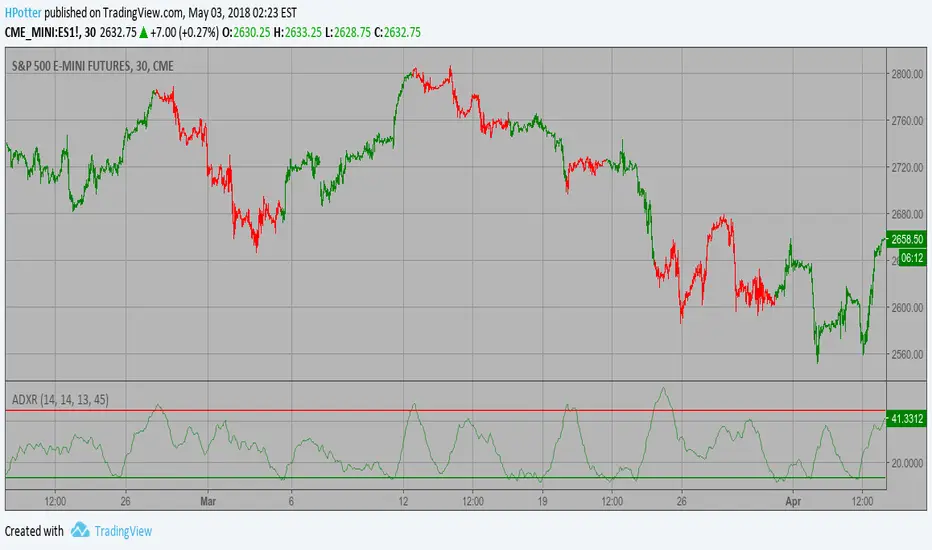
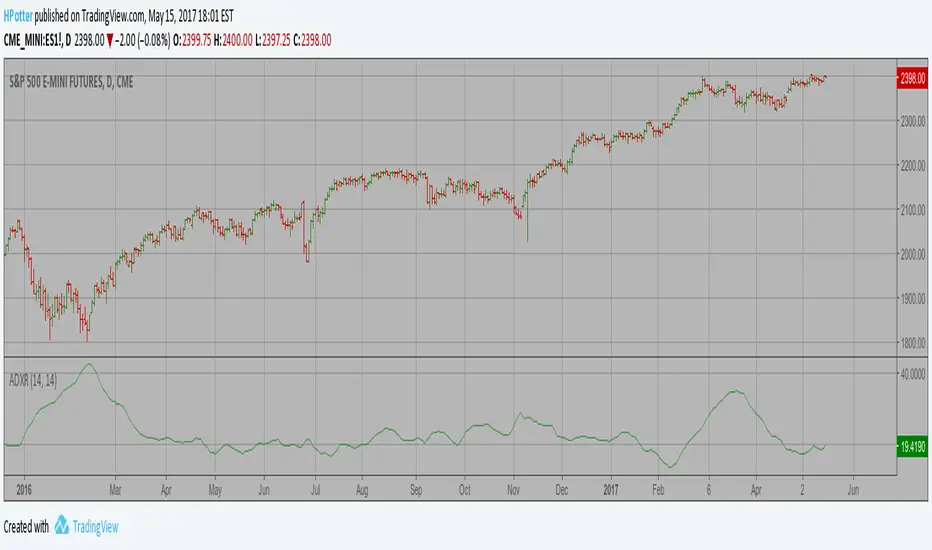
Average Directional Movement Index Rating Backtest The Average Directional Movement Index Rating (ADXR) measures the strength
of the Average Directional Movement Index (ADX). It's calculated by taking
the average of the current ADX and the ADX from one time period before
(time periods can vary, but the most typical period used is 14 days).
Like the ADX, the ADXR ranges from values of 0 to 100 and reflects strengthening
and weakening trends. However, because it represents an average of ADX, values
don't fluctuate as dramatically and some analysts believe the indicator helps
better display trends in volatile markets.
You can change long to short in the Input Settings
WARNING:
- For purpose educate only
- This script to change bars colors.

Average Directional Movement Index Rating Strategy The Average Directional Movement Index Rating (ADXR) measures the strength
of the Average Directional Movement Index (ADX). It's calculated by taking
the average of the current ADX and the ADX from one time period before
(time periods can vary, but the most typical period used is 14 days).
Like the ADX, the ADXR ranges from values of 0 to 100 and reflects strengthening
and weakening trends. However, because it represents an average of ADX, values
don't fluctuate as dramatically and some analysts believe the indicator helps
better display trends in volatile markets.
WARNING:
- This script to change bars colors.
Average Directional Movement Index Rating The Average Directional Movement Index Rating (ADXR) measures the strength
of the Average Directional Movement Index (ADX). It's calculated by taking
the average of the current ADX and the ADX from one time period before
(time periods can vary, but the most typical period used is 14 days).
Like the ADX, the ADXR ranges from values of 0 to 100 and reflects strengthening
and weakening trends. However, because it represents an average of ADX, values
don't fluctuate as dramatically and some analysts believe the indicator helps
better display trends in volatile markets.
Momentum ChecklistMomentum Checklist - Visual Trading Dashboard
A clean, easy-to-read dashboard that displays key momentum indicators in one convenient table. This indicator helps traders quickly determine the directional bias of price action by combining ADX, Directional Movement Index (DMI), and Money Flow Index (MFI).
What It Shows:
ADX (Average Directional Index): Measures trend strength. Green checkmark appears when ADX ≥ 20, indicating a strong trending market
DI+ (Positive Directional Indicator): Tracks upward price movement
DI- (Negative Directional Indicator): Tracks downward price movement
MFI (Money Flow Index): Volume-weighted momentum indicator. When > 50 indicates bullish money flow
Bias: Automatically calculates directional bias:
LONG: When DI+ > 25 and DI- < 20
SHORT: When DI- > 25 and DI+ < 20
NEUTRAL: When conditions are mixed
Trading Strategy:
This indicator helps determine the bias of price movement in a certain direction. When coupled with Bollinger Bands, it becomes a very powerful combination to catch those big explosive moves up or down. The momentum confirmation from this checklist combined with Bollinger Band squeezes or breakouts can significantly improve entry timing.
Recommended Usage:
Timeframes: 5-minute to 15-minute charts for optimal performance
Best Assets: US30, XAUUSD (Gold), BTCUSD, and most major indices
Works exceptionally well on volatile instruments with strong directional moves
Features:
Color-coded cells for instant visual confirmation
Customizable position (Top Right, Top Left, Bottom Right, Bottom Left)
Adjustable text size (Tiny, Small, Normal)
Configurable ADX, DMI, and MFI period settings
Perfect for day traders and scalpers looking for quick momentum confirmation before entering trades! Feel free to adjust any part of this description to match your style! 🎯

THMA ~ CharonQuantTHMA is a high-precision trend following indicator designed to detect market transitions early while filtering out low-quality, low-momentum conditions.
Built on the Hull Moving Average framework, THMA extends the concept into a triple-nested structure that significantly reduces lag without sacrificing smoothness. The result is a fast, stable trend line that adapts well to volatile markets such as crypto, forex, and intraday equities.
Signals are not generated in isolation. Every long or short condition is validated through three independent filters :
Trend alignment via a higher-timeframe EMA
Directional control using DI (+DI / −DI)
Trend strength confirmation through ADX
Only when all filters align does a final signal trigger, helping suppress noise and whipsaw during ranging markets.
Visual Design
Persistent THMA state coloring
Long, muted gold (#D4A017)
Short, deep burgundy (#6B2A3A)
Lighter confirmation states when conditions are partially met
Trend EMA and dynamic price reference
ADX with threshold displayed in a separate pane
Alerts
Two native alert conditions are included:
THMA Long
Fires when finalLong becomes true
Condition, price > THMA, price > Trend EMA, ADX > threshold, +DI > −DI
THMA Short
Fires when finalShort becomes true
Condition, price < THMA, price < Trend EMA, ADX > threshold, −DI > +DI
Alert messages include exchange and ticker placeholders for automation and webhook use.
Important
No indicator replaces discipline or context.
THMA exists to reduce uncertainty, not eliminate risk.
Use it to escort price through volatility, not to chase it.

N Option Selling 2
---
## 📌 Script Description
**NIFTY Weekly Option Seller – Regime-Based Risk-Controlled System**
This indicator is designed for **systematic weekly option selling on NIFTY**, using a **rule-based regime and scoring framework** to decide **what to sell, how aggressively to sell, and when to defend or harvest**.
The script does **not generate buy/sell signals**.
Instead, it acts as a **decision and risk-management engine** for option sellers.
---
## 🔹 Core Idea
The market is always in one of three regimes:
1. **Iron Condor (IC)** → Range / mean-reverting market
2. **Put Credit Spread (PCS)** → Bullish trending market
3. **Call Credit Spread (CCS)** → Bearish trending market
This script **scores all three regimes (0–5)** on the current chart timeframe and automatically selects the **dominant regime**.
---
## 🔹 How Scoring Works (High Level)
Each regime score is built using **price structure + volatility + momentum context**:
### PCS (Bullish bias)
* EMA alignment (8 > 13 > 34)
* ADX trend strength
* Price above VWAP
* CPR breakout
* RSI sanity checks (size is reduced in extremes)
* Daily trend confirmation
### CCS (Bearish bias)
* EMA alignment (8 < 13 < 34)
* ADX trend strength
* Price below VWAP
* CPR breakdown
* RSI sanity checks (size is reduced in extremes)
* Daily trend confirmation
### IC (Range bias)
* Low ADX (both intraday & daily)
* Price inside CPR
* Price near VWAP
* Price inside Camarilla H3–L3
* RSI near equilibrium (45–55)
A **cross-penalty system** ensures that strong trends suppress IC scores and vice-versa, preventing conflicting signals.
Scores are **smoothed** to reduce noise and avoid over-trading.
---
## 🔹 Regime Selection Logic
* The regime with the **highest score** is selected.
* If scores tie:
* **Trending markets → PCS / CCS**
* **Non-trending markets → IC**
This ensures **trend takes priority over range** when volatility expands.
---
## 🔹 Strike Selection (ATR-Based)
The script suggests **volatility-adjusted strike distances** using ATR:
* **Iron Condor:** ±1.0 × ATR
* **PCS / CCS:** ±1.25 × ATR
This adapts automatically to changing volatility instead of using fixed point distances.
---
## 🔹 Risk-First Trade Management
The script provides **three actionable alerts only**:
### 🔴 DEFEND
Triggered when:
* Price approaches short strike
* Trend breaks beyond Camarilla levels
* Volatility expansion threatens the position
→ Signals the need to **roll, widen, or convert**
### 🟢 HARVEST
Triggered when:
* Adequate price cushion exists
* Market remains range-bound or stable
→ Signals opportunity to **book profits or roll closer**
### 🔵 REGIME CHANGE
Triggered when:
* Market structure flips decisively
→ Signals need to **switch strategy bias**
A **cooldown system** prevents alert spam.
---
## 🔹 Position Sizing Philosophy
* Scores determine **directional conviction**
* RSI-based **size multiplier** automatically reduces exposure in extreme momentum conditions
* Optional **minimum lot floor** ensures participation without over-risking
* Designed to support **Risk:Reward frameworks (1:2 or 1:3)** through premium-based stop discipline
---
## 🔹 Visual & UX Features
* Background color reflects active regime and conviction
* On-chart panel displays:
* Active strategy
* Scores (IC / PCS / CCS)
* ADX & RSI
* VWAP, CPR, Camarilla levels
* Clean, non-repainting levels (previous day data)
---
## 🔹 Intended Use
* Weekly option selling (IC / PCS / CCS)
* Works best on **30m–1h charts**
* Designed for **rule-based traders**, not discretionary scalpers
* Focused on **capital preservation, consistency, and disciplined adjustments**
---
## ⚠️ Disclaimer
This script is **not financial advice**.
It is a **decision-support and risk-management tool** for experienced option sellers who already understand spreads, adjustments, and margin dynamics.

SIV Trading LightSmartInVisions Trading Light (SIV Trading Light)
**Multi-Factor Market Regime & Trade Bias Indicator**
---
## Overview and Purpose
**SmartInVisions Trading Light (SIV Trading Light)** is a market **context and trade-bias indicator**, not a signal generator.
Its purpose is to answer one practical trading question:
> *“Given the current market conditions, is it statistically more favorable to think LONG, SHORT, or stay neutral?”*
Instead of relying on a single indicator, SIV Trading Light **combines several independent market dimensions into one coherent score**.
This allows traders to avoid over-trading in unfavorable environments and to align trades with the dominant market context.
---
## Why This Is NOT a Simple Indicator Mashup
This script does **not** simply merge popular indicators.
Each component is:
* normalized,
* weighted,
* evaluated against thresholds,
* and translated into **positive, neutral, or negative score contributions**.
Only the **combined interaction** of these components produces the final trade bias.
No single indicator can dominate the result on its own.
---
## Core Calculation Concept
At every bar, the indicator evaluates multiple independent factors.
Each factor contributes points to a **total bias score**.
The score is then classified into one of three states:
* **LONG bias**
* **NEUTRAL**
* **SHORT bias**
The indicator does **not** predict price direction.
It classifies the **current trading environment**.
---
## Components and How They Work Together
### 1. Trend Structure (Moving Averages)
**Purpose:** Identify the dominant directional structure.
* Fast MA vs Slow MA relationship
* Price position relative to the slow MA
* Optional slope confirmation
Contribution:
* Positive points in aligned uptrends
* Negative points in aligned downtrends
* Neutral in mixed or unclear structures
---
### 2. Momentum (RSI)
**Purpose:** Measure directional strength.
* RSI above upper threshold → bullish momentum
* RSI below lower threshold → bearish momentum
* Mid-range RSI → neutral
Momentum refines trend signals by confirming or weakening them.
---
### 3. Trend Quality / Choppiness (ADX)
**Purpose:** Filter out sideways or noisy markets.
* ADX above threshold → trending environment
* ADX below threshold → choppy environment
ADX does **not** define direction.
It modifies how much weight trend and momentum signals receive.
---
### 4. Volatility Risk (ATR%)
**Purpose:** Penalize structurally dangerous environments.
ATR is normalized as a percentage of price:
* Excessively high volatility → risk penalty
* Extremely low volatility → participation penalty
* Balanced volatility → neutral or positive contribution
This prevents aggressive trading in unstable regimes.
---
### 5. Market Participation (Relative Volume)
**Purpose:** Confirm whether moves are supported by volume.
* High relative volume → confirmation
* Low volume → weaker confidence
Volume acts as a confidence modifier, not as a directional signal.
---
### 6. Higher-Timeframe Market Regime (Optional)
**Purpose:** Align trades with the dominant higher-timeframe context.
On a user-defined **regime timeframe**, the script evaluates:
* trend structure
* RSI momentum
The regime filter can:
* amplify signals aligned with the higher timeframe
* suppress signals against it
This avoids trading aggressively against dominant market structure.
---
## Multi-Timeframe Design
The indicator separates two concepts:
* **Trading Timeframe**: the chart timeframe used for execution
* **Regime Timeframe**: a higher timeframe used for contextual bias
This design allows the same logic to be applied to:
* day trading
* swing trading
* longer-term investing
---
## Presets and Customization
Built-in presets are provided for:
* Day Trading (USA / Europe)
* Swing Trading (USA / Europe)
* Investing (USA / Europe)
Presets define:
* factor weights
* thresholds
* score boundaries
They do **not** define:
* timeframes
* moving average types or lengths
This keeps structural decisions under user control while simplifying parameter tuning.
A **Custom mode** allows full manual configuration.
---
## Visual Output
The indicator provides:
* two moving average overlays (fast / slow)
* an optional background color reflecting the current bias
* a compact badge summarizing mode, score, and state
* an optional breakdown table showing how each factor contributes to the score
These visuals are designed to explain **why** the current bias exists.
---
## Alerts
Alerts are based on **state changes**, not on every bar.
Alert outputs include:
* numerical state (`1 = LONG, 0 = NEUTRAL, -1 = SHORT`)
* score value
* rounded moving average values
This allows integration into discretionary or systematic workflows without alert noise.
---
## How This Indicator Should Be Used
✔ As a **trade filter**
✔ To avoid trading in unfavorable conditions
✔ To align discretionary entries with market context
---
## What This Indicator Is NOT
✘ Not a buy/sell signal
✘ Not a prediction model
✘ Not a replacement for risk management
---
## Credits and License
**Publisher:** SmartInVisions GmbH
**Concept & Design:** Reiner Ernst
**Implementation & Iterative Development:** SmartInVisions GmbH + ChatGPT (OpenAI)
**License:** Mozilla Public License 2.0 (MPL-2.0)
---
## Disclaimer
This script is provided for educational and research purposes only.
It does not constitute financial advice. Trading involves risk.
---

Gold Futures Prop-Firm Strategy (GC) 1-18-2026Overview
This is a long-only, session-based, multi-regime trading strategy designed specifically for Gold futures (GC / GC1!) on intraday timeframes (typically 5–15 minutes).
The strategy aims to capture high-probability moves during the New York and Asian sessions while avoiding major economic news events and enforcing strict daily risk limits — making it suitable for prop firm challenges (e.g. FTMO, FundedNext, Apex, etc.) that require consistent profitability, limited drawdown, and disciplined risk management.
Core Philosophy
Trade longs only (shorts were removed after analysis showed they were consistently unprofitable)
Different logic depending on session and market regime (trending vs ranging)
Heavy filtering using trend strength (ADX), volume confirmation, EMA alignment, Bollinger Bands, and RSI
Strict position sizing, daily loss cap, per-session trade limits, and news blackout periods
Trailing stop mechanism to let winners run while protecting against reversals
Trading Sessions & Time Windows (Eastern Time)
NY Session: 08:30 – 15:00 ET
NY AM (trend/breakout zone): 08:30 – 11:30 ET
NY PM (mean-reversion zone): 11:30 – 15:00 ET
Asia Session (mean-reversion zone): 18:00 – 02:00 ET
News blackouts: short windows around high-impact releases (CPI/NFP, ISM/Fed, FOMC)
Entry Logic (Long Only)
NY AM – Trend Following & Breakouts (strongest trend filter)
ADX > 30 (strong trend)
Price above 200 EMA (bull regime)
Fast EMA (21) crosses above Slow EMA (55) or breakout above 20-bar high
Volume spike (> 1.4 × 20-period SMA)
Max 2 trades per NY session per day
NY PM & Asia – Mean Reversion
ADX ≤ 30 (ranging market)
Price below lower Bollinger Band (20, 2.0)
RSI < 25 (deep oversold)
No volume filter required here
Max 2 trades per Asia session per day
Risk Management Rules
Position size: Fixed 1–2 contracts (user selectable)
Initial stop: 1.7 × ATR(14) below entry (tightened from original)
Trailing stop:
Activates after price moves +1.0 × ATR in profit
Trails by 1.0 × ATR (locked-in profits aggressively)
Daily loss limit: -$600 (stops all trading for the day once hit)
No trading during defined news windows
Pyramiding disabled (only one position at a time)
No short entries (removed after backtest analysis)
Indicators Used
EMA 21 / 55 / 200 (trend direction & filter)
ATR(14) × 0.85 (volatility base)
ADX(14) threshold 30 (strong trend confirmation)
Bollinger Bands (20, 2.0) for mean-reversion entries
RSI(14) with oversold < 25
Volume spike filter (1.4× SMA) for trend/breakout entries
20-bar highest high / lowest low for breakout detection
Visual Elements on Chart
Fast (blue), Slow (orange), and Filter (red) EMAs
Bollinger Bands (gray, semi-transparent fill)
Background coloring:
Red tint during news blackout periods
Purple tint when daily loss limit is hit
Intended Use Case
Prop trading firm evaluation accounts
Conservative intraday gold trading
Focus on high-quality long setups in trending (NY AM) and mean-reverting (Asia/PM) environments
Goal: positive expectancy with controlled drawdown, suitable for passing drawdown and profit targets

Triple Confirmation with Alerts//@version=5
indicator("Triple Confirmation with Alerts", overlay=true)
// Confirmation 1: ADX Trend Strength
adxlen = input(14, "ADX Length")
dilen = input(14, "DI Length")
= ta.dmi(dilen, adxlen)
trendStrong = adx > 25
uptrend = diplus > diminus and trendStrong
downtrend = diminus > diplus and trendStrong
// Confirmation 2: Stochastic
k = ta.sma(ta.stoch(close, high, low, 14), 3)
d = ta.sma(k, 3)
stochBullish = k > d and k <= d and k < 80
stochBearish = k < d and k >= d and k > 20
// Confirmation 3: Bollinger Bands
bbLength = input(20, "BB Length")
bbMult = input(2.0, "BB Multiplier")
basis = ta.sma(close, bbLength)
dev = bbMult * ta.stdev(close, bbLength)
upper = basis + dev
lower = basis - dev
bbBullish = close > lower and close <= lower
bbBearish = close < upper and close >= upper
// Generate Signals
buySignal = uptrend and stochBullish and bbBullish
sellSignal = downtrend and stochBearish and bbBearish
// Plot
plotshape(buySignal, "Buy", shape.triangleup, location.belowbar, color.green, size=size.small)
plotshape(sellSignal, "Sell", shape.triangledown, location.abovebar, color.red, size=size.small)
// Alerts
alertcondition(buySignal, "Triple Confirmation Buy", "Buy signal generated")
alertcondition(sellSignal, "Triple Confirmation Sell", "Sell signal generated")

PHEN ATLAS - Market Map & Playbook [PhenLabs]📊 PHEN ATLAS 🎂 #50 🎂
Version: PineScript™ v6
📌 Description
The PHEN ATLAS marks a historic milestone as the 50th official release from PhenLabs . This is a critical release you do not want to miss, serving as a comprehensive Market Map and Playbook designed to provide traders with a complete structural overview of price action. By synthesizing Market Structure, Liquidity concepts, and Regime detection, this script solves the problem of "analysis paralysis" by grading price action in real-time. It moves beyond simple indicators by offering a quantified "Playbook" that scores trade setups from 0 to 100, helping traders focus exclusively on high-probability opportunities while automating the complex math of position sizing and risk management.
🚀 Points of Innovation
Proprietary Scoring Engine: Unlike standard indicators, this script assigns a quantitative score (0-100) to every potential trade based on confluence factors like HTF alignment and displacement.
Dynamic Regime Detection: Features an integrated dashboard that classifies the market into specific phases (Expansion, Trend, Range) using ADX and EMA alignment logic.
Smart Liquidity Pools: Automatically identifies and visualizes resting liquidity, tracking when these pools are "swept" to generate high-probability reversal signals.
Integrated Trade Manager: Automates the calculation of Stop Loss, Take Profit (1:2 and 1:3), and Position Size based on account balance and risk percentage directly on the chart.
Multi-Mode Interface: Offers three distinct visual modes—Clean, Pro, and Sniper—allowing users to toggle between deep analysis and clutter-free execution instantly.
🔧 Core Components
Structure Module: Identifies Pivots, Break of Structure (BOS), and Change of Character (CHoCH) to define the current market bias.
Liquidity Engine: Plots liquidity pools at key swing points and detects "Sweeps" where price grabs liquidity before reversing.
Regime Filter: Uses a combination of EMAs (21/50) and ADX to determine if the market is trending or ranging, filtering out low-quality signals.
Setup Validator: Monitors for three specific setup types (Sweep, Snapback, FVG Retest) and triggers alerts only when specific scoring thresholds are met.
🔥 Key Features
Automated detection of High Timeframe (HTF) structure without repainting issues.
Real-time grading of price displacement to validate institutional intent.
Visual Risk/Reward boxes that automatically adjust to the volatility (ATR) of the asset.
Fair Value Gap (FVG) detection with auto-mitigation tracking to clean up the chart.
Customizable alerts for A+ setups, regime changes, and trade invalidations.
Detailed dashboard displaying current Trend, Phase, Bias, and the score of the last setup.
🎨 Visualization
Structure Points: Triangles for BOS and Diamonds for CHoCH events clearly mark trend shifts.
Liquidity Lines: Dotted lines extending from pivots indicate un-swept liquidity pools; these dim automatically when swept.
Setup Signals: Prominent "A+" labels appear on the chart when a setup meets the minimum score threshold defined by the user.
Risk Boxes: Color-coded boxes (Green for Long, Red for Short) show Entry, Stop Loss, and Take Profit levels visually.
Dashboard: A compact table in the bottom right corner provides a "Heads Up Display" of the market state.
📖 Usage Guidelines
Display Mode: Select between 'Clean' for signals only, 'Pro' for full analysis including FVGs and Structure, or 'Sniper' for only high-score setups.
HTF Timeframe: Sets the higher timeframe for structural analysis (Default: 240/4-Hour) to ensure you trade with the dominant trend.
Min Score for A+ Setup: Threshold (0-100) required to trigger a signal (Default: 83); increase this to filter for only the absolute best trades.
Risk %: Defines the percentage of your account you are willing to risk per trade (Default: 1.0%), used for the position size calculation.
Account Balance: Input your current capital (Default: 10,000) to receive accurate unit sizing for every trade setup.
ADX Threshold: Adjusts the sensitivity of the Regime detection filter (Default: 20) to determine when the market is trending versus ranging.
✅ Best Use Cases
Confluence Trading: Use the scoring system to filter discretionary entries, taking trades only when the system scores them above 80.
Prop Firm Trading: Utilize the built-in position size calculator to strictly adhere to risk management rules during evaluations.
Trend Following: Wait for the Regime Dashboard to show "Bullish Expansion" before taking Long "Snapback" entries.
Reversal Trading: Focus on "Sweep Reclaim" setups where price sweeps a liquidity pool and immediately closes back within range.
⚠️ Limitations
This tool is a trend-following and reversal system; it may produce lower scores during undefined, low-volatility chop.
The position size calculator is an estimation based on the entry candle; actual execution slippage is not accounted for.
HTF data relies on closed candles to prevent repainting, which may result in a slight lag during rapid volatility spikes.
💡 What Makes This Unique
Playbook Scoring: Most indicators just give a signal; PHEN ATLAS gives you a "Grade" (e.g., 85/100), allowing you to make informed decisions based on quality, not just frequency.
Context Awareness: The script understands "Market Regime" and creates a context-aware bias, rather than blindly firing signals in a range.
🔬 How It Works
Step 1 - Regime Definition: The script analyzes the 21/50 EMA relationship and ADX to define if the market is in a Trend or Range.
Step 2 - Structure & Liquidity: It maps key pivots and liquidity pools, waiting for a "Sweep" event or a structural break.
Step 3 - Setup Trigger: When a specific pattern occurs (like a Sweep Reclaim), the engine calculates a score based on displacement, volume, and key level alignment.
Step 4 - Execution Logic: If the score > Threshold, the Trade Manager calculates the invalidation point (SL) and projects 2R/3R targets automatically.
🎉 Message From The Team 🎉
2025 was an amazing year. 12 months of building, shipping, and improving together with you. Hitting our 50th indicator release marks one full year of weekly drops , and we couldn't have done it without this community, and of course, BIG thank you to TradingView and it's team.
Thank you for all the feedback, charts, and support. Let's make 2026 even bigger. We can't wait to show you what we've been working on. 🚀
💡 Note
For best results, we recommend using the "Pro" mode during analysis to understand the narrative, and switching to "Sniper" or "Clean" during execution to maintain focus. Always ensure your "Account Balance" input matches your broker balance for accurate risk calculations.

RSI Bollinger Band and Trend Confidence Gauge█ RSI BB Trend Confidence Gauge (ADX/DMI)
Cross-checks Trend + Momentum + Strength in real time so you focus on VERIFIED conditions.
Most of us have been there: you see a move starting, you jump in, and the market immediately turns into a sideways chop-fest that eats your stop. This is a simple dashboard that forces the market to “prove itself” before you put capital at risk.
█ WHAT MAKES THIS DIFFERENT?
Most indicators are “Yes/No” machines — they fire signals anytime two lines cross, even when the market is weak, noisy, or range-bound. This script is a Quality Filter .
Instead of asking “Is price moving?”, it asks: “Is the move backed by alignment, momentum, and strength?”
VERIFIED only appears when all three agree, helping you avoid low-probability chop and “no-trade” consolidation zones.
█ QUICK START
• UP + VERIFIED + High ➔ “A-Tier” state; favor pullbacks or continuation.
• DOWN + VERIFIED + High ➔ bearish control is real; avoid dip-buying.
• Conflict (gray) ➔ indicators disagree; step aside and wait for alignment.
• R or B markers ➔ overextension warnings; don’t chase into extremes.
█ THE "ANTI-CHOP" ENGINE
Trading is probability, not guessing. This script uses a 3-stage logic gate to verify conditions:
• 1) The Trend (HMA 13/34): Hull Moving Averages provide a fast, smooth regime filter. If fast vs. slow isn’t clean, the regime isn’t ready.
• 2) The Fuel (RSI 50): A trend without momentum is a trap. UP/DOWN only prints when RSI confirms.
• 3) The Proof (ADX/DMI): Final gate. VERIFIED only appears when ADX ≥ 22 and DI+/DI- agrees . If strength isn’t there, stay sidelined.
█ VISUALS YOU'LL ACTUALLY USE
• Live Dashboard: Bottom-center snapshot of RSI, Direction (UP/DOWN/Conflict), VERIFIED status, and Confidence tier (Low/Med/High).
• Exhaustion Markers: Orange icons when price is extended: "R" for RSI extremes and "B" for Bollinger Band hits. These flag caution zones.
• Trend Ribbon: Zero-line bias bar: Lime (bullish), Red (bearish), Gray (conflict/chop risk).
█ SETTINGS
• Action ADX Minimum (default 22): Want stricter verification? Try 25. Want earlier signals? Try 20 (higher noise/risk).
Disclaimer: Educational tool only. Not financial advice. Past performance does not guarantee future results. Always use strict risk management.

Multi-indicator Signal Builder [Skyrexio]Overview
Multi-Indicator Signal Builder is a versatile, all-in-one script designed to streamline your trading workflow by combining multiple popular technical indicators under a single roof.
It features a single-entry, single-exit logic, intrabar stop-loss/take-profit handling, an optional time filter, a visually accessible condition table, and a built-in statistics label.
Traders can choose any combination of 12+ indicators (RSI, Ultimate Oscillator, Bollinger %B, Moving Averages, ADX, Stochastic, MACD, PSAR, MFI, CCI, Heikin Ashi, and a “TV Screener” placeholder) to form entry or exit conditions.
This script aims to simplify strategy creation and analysis , making it a powerful toolkit for technical traders.
Indicators Overview
RSI (Relative Strength Index)
Measures recent price changes to evaluate overbought or oversold conditions on a 0–100 scale.
Ultimate Oscillator (UO)
Uses weighted averages of three different timeframes, aiming to confirm price momentum while avoiding false divergences.
Bollinger %B
Expresses price relative to Bollinger Bands, indicating whether price is near the upper band (overbought) or lower band (oversold).
Moving Average (MA)
Smooths price data over a specified period. The script supports both SMA and EMA to help identify trend direction and potential crossovers.
ADX (Average Directional Index)
Gauges the strength of a trend (0–100). Higher ADX signals stronger momentum, while lower ADX indicates a weaker trend.
Stochastic
Compares a closing price to a price range over a given period to identify momentum shifts and potential reversals.
MACD (Moving Average Convergence/Divergence)
Tracks the difference between two EMAs plus a signal line, commonly used to spot momentum flips through crossovers.
PSAR (Parabolic SAR)
Plots a trailing stop-and-reverse dot that moves with the trend. Often used to signal potential reversals when price crosses PSAR.
MFI (Money Flow Index)
Similar to RSI but incorporates volume data. A reading above 80 can suggest overbought conditions, while below 20 may indicate oversold.
CCI (Commodity Channel Index)
Identifies cyclical trends or overbought/oversold levels by comparing current price to an average price over a set timeframe.
Heikin Ashi
A type of candlestick charting that filters out market noise. The script uses a streak-based approach (multiple consecutive bullish or bearish bars) to gauge mini-trends.
TV Screener
A placeholder condition designed to integrate external buy/sell logic (like a TradingView “Buy” or “Sell” rating). Users can override or reference external signals if desired.
Unique Features
Multi-Indicator Entry and Exit
You can selectively enable any subset of 12+ classic indicators, each with customizable parameters and conditions. A position opens only if all enabled entry conditions are met, and it closes only when all enabled exit conditions are satisfied, helping reduce false triggers.
Single-Entry / Single-Exit with Intrabar SL/TP
The script supports a single position at a time. Once a position is open, it monitors intrabar to see if the price hits your stop-loss or take-profit levels before the bar closes, making results more realistic for fast-moving markets.
Time Window Filter
Users may specify a start/end date range during which trades are allowed, making it convenient to focus on specific market cycles for backtesting or live trading.
Condition Table and Statistics
A table at the bottom of the chart lists all active entry/exit indicators. Upon each closed trade, an integrated statistics label displays net profit, total trades, win/loss count, average and median PnL, etc.
Seamless Alerts and Automation
• Configure alerts in TradingView using “Any alert() function call.”
• The script sends JSON alert messages you can route to your own webhook.
• The indicator can be integrated with Skyrexio alert bots to automate execution on major cryptocurrency exchanges.
Optional MA/PSAR Plots
For added visual clarity, optionally plot the chosen moving averages or PSAR on the chart to confirm signals without stacking multiple indicators.
Methodology
Multi-Indicator Entry Logic
When multiple entry indicators are enabled (e.g., RSI + Stochastic + MACD), the script requires all signals to align before generating an entry. Each indicator can be set for crossovers, crossunders, thresholds (above/below), etc. This “AND” logic aims to filter out low-confidence triggers.
Single-Entry Intrabar SL/TP
• One Position At a Time: Once an entry signal triggers, a trade opens at the bar’s close.
• Intrabar Checks: Stop-loss and take-profit levels (if enabled) are monitored on every tick. If either is reached, the position closes immediately, without waiting for the bar to end.
Exit Logic
All Conditions Must Agree: If the trade is still open (SL/TP not triggered), then all enabled exit indicators must confirm a closure before the script exits on the bar’s close.
Time Filter
Optional Trading Window: You can activate a date/time range to constrain entries and exits strictly to that interval.
Justification of Methodology
Indicator Confluence: Combining multiple tools (RSI, MACD, etc.) can reduce noise and false signals.
Intrabar SL/TP: Capturing real-time spikes or dips provides a more precise reflection of typical live trading scenarios.
Single-Entry Model: Straightforward for both manual and automated tracking (especially important in bridging to bots).
Custom Date Range: Helps refine backtesting for specific market conditions or to avoid known irregular data periods.
How to Use
Add the Script to Your Chart
• In TradingView, open Indicators , search for “Multi-indicator Signal Builder” .
• Click to add it to your chart.
Configure Inputs
• Time Filter: Set a start and end date for trades.
• Alerts Messages: Input any JSON or text payload needed by your external service or bot.
• Entry Conditions: Enable and configure any indicators (e.g., RSI, MACD) for a confluence-based entry.
• Close Conditions: Enable exit indicators, along with optional SL (negative %) and TP (positive %) levels.
Set Up Alerts
• In TradingView, select “Create Alert” → Condition = “Any alert() function call” → choose this script.
• Entry Alert: Triggers on the script’s entry signal.
• Close Alert: Triggers on the script’s close signal (or if SL/TP is hit).
• Skyrexio Alert Bots: You can route these alerts via webhook to Skyrexio alert bots to automate order execution on major crypto exchanges (or any other supported broker).
Visual Reference
• A condition table at the bottom summarizes active signals.
• Statistics Label updates automatically as trades are closed, showing PnL stats and distribution metrics.
Backtesting Guidelines
Symbol/Timeframe: Works on multiple assets and timeframes; always do thorough testing.
Realistic Costs: Adjust commissions and potential slippage to match typical exchange conditions.
Risk Management: If using the built-in stop-loss/take-profit, set percentages that reflect your personal risk tolerance.
Longer Test Horizons: Verify performance across diverse market cycles to gauge reliability.
Example of statistic calculation
Test Period: 2023-01-01 to 2025-12-31
Initial Capital: $1,000
Commission: 0.1%, Slippage ~5 ticks
Trade Count: 680 (varies by strategy conditions)
Win rate: 75.44% (varies by strategy conditions)
Net Profit: +90.14% (varies by strategy conditions)
Disclaimer
This indicator is provided strictly for informational and educational purposes.
It does not constitute financial or trading advice.
Past performance never guarantees future results.
Always test thoroughly in demo environments before using real capital.
Enjoy exploring the Multi-Indicator Signal Builder! Experiment with different indicator combinations and adjust parameters to align with your trading preferences, whether you trade manually or link your alerts to external automation services. Happy trading and stay safe!

Quantum RCI FusionDescription:
Overview: The Quantum Momentum Engine Quantum RCI Fusion is a sophisticated momentum oscillator designed to solve the #1 problem of classic indicators: false signals in sideways markets. At the core of this script is the Rank Correlation Index (RCI), a powerful statistical tool based on Spearman’s correlation. Unlike RSI or Stochastic which only look at price levels, the RCI evaluates the "quality" of a trend by measuring the temporal correlation of price ranks.
This script is not just a line drawing: it is a complete trading ecosystem that fuses three RCI timeframes, volatility filters, and a real-time Risk Management simulation.
🛠 How It Works: The "Fusion" Logic
The strength of this indicator lies in the synergy between its components. It is not a simple mashup, but a filtered logical system:
Triple RCI Engine (Fast, Mid, Slow):
Fast (13) & Mid (18): These generate the Crossover signal for precise entry timing.
Slow (30) - The "Trend Shield": The true innovation. It acts as a directional shield; if the baseline is bullish, the script protects Long positions by ignoring premature exit signals, allowing you to ride the full trend.
HMA Smoothing: Raw price data passes through a Hull Moving Average before the RCI calculation. This drastically reduces market "noise" without sacrificing the responsiveness typical of the RCI.
Intelligent Filters (Anti-Whipsaw):
ADX Integration: Signals are blocked if the ADX is below the threshold (default 20), preventing trading in flat/ranging markets.
Momentum Impulse: Requires a minimum variation (Delta) in the RCI to confirm that the move has real drive and is not just random fluctuation.
🛡 Risk Management & Simulation
Since timing is useless without risk management, Quantum RCI Fusion includes a Dashboard and sophisticated exit logic:
Multiple Exits:
Take Profit / Stop Loss: Based on dynamic ATR multipliers.
Shield Break: Safety exit if the underlying trend (Slow RCI) changes direction.
Emergency: Immediate close if momentum sharply reverses across the zero line.
Live Dashboard: Monitors Win Rate, virtual PnL, and Trade Status (Long/Short/Scanning) in real-time directly on the chart, removing the need for external backtesters.
🚀 How to Use It
Setup: Add the script to a separate pane below your price chart.
Entry Signals:
LONG (Green Triangle): RCI Fast crosses Mid upwards + Oversold Zone (< -80) + ADX > 20 + Bullish Shield.
SHORT (Red Triangle): RCI Fast crosses Mid downwards + Overbought Zone (> 80) + ADX > 20 + Bearish Shield.
Customization:
Scalping: Reduce RCI lengths (e.g., 8/12/20) and disable the "Trend Shield" for quick entries and exits.
Swing Trading: Keep defaults and use the ATR Trailing logic to manage positions on H4 or Daily timeframes.
⚖️ Notes & Credits
Originality: This script enhances the standard RCI by implementing Array-based calculations (optimized for Pine v6), proprietary HMA smoothing, and unique "Trend Shield" logic.
Open Source: The code is released under the MPL 2.0 license. Credits to the Pine community for the foundational mathematical formulas of Spearman's correlation.
Disclaimer: The statistics shown in the dashboard are simulations based on live data and do not guarantee future profits. You are responsible for your own trading decisions.
🖼 Instructions for the Publication Chart (Preview)
To ensure your script gets approved and attracts users, follow these steps for the cover image:
Symbol: Use a volatile and liquid asset, e.g., BTCUSD or XAUUSD (Gold), on a 1H or 4H timeframe.
Clean Layout: Remove all other indicators from the chart (no Moving Averages on price, no Bollinger Bands). The focus must be solely on your script in the bottom pane.
Visualization:
Ensure the Dashboard (stats table) is clearly visible and does not obscure the most recent candle.
The chart should show at least one clear BUY and one clear SELL signal, ideally with the exit icons (the "X" or flags) visible to demonstrate the exit logic.

Clock&Flow: Elements of Cycle Analysis 2nd partClock&Flow – Elements of Cycle Analysis (ECA) | Complete Suite
Elements of Cycle Analysis (ECA) is an advanced cyclic analysis suite designed to interpret the market through time, structure, strength, and energy, combining cycles, volatility, and participation into a single operational framework.
The suite consists of two complementary modules:
🔹ECA 1 – Cycles, Structure, and Volatility (Overlay: True)
ECA 1 is dedicated to the structural and temporal analysis of the market.
Cyclic SMAs (Cyclic Ratio) Moving averages are calibrated according to nominal cycles and timeframes to monitor multiple cycles simultaneously (from the lower cycle to the upper cycles). Crossovers between fast and slow SMAs certify the closing or transition of the cycle related to the faster SMA. The specific cycle is identified in the Info Table at the bottom right (for 15m - 1h - 2h - 1D timeframes). You can select the number of cycles to observe and the asset type to apply them to:
Index: Standard quotes (e.g., Cash sessions).
Future: Extended quotes (24h).
50-200: Classic institutional references for the medium-long term.
ATR-based Dynamic Cyclic Channels The channels represent a lower cycle and its upper counterpart; their width is determined by the observed timeframe and calculated based on average volatility (ATR). Volatility is not treated as noise but as a structural component of the cycle, essential for contextualizing excesses, compressions, and expansions.
Info Table and Quick Guide Dynamic tables automatically link SMAs, timeframes, and time cycles, providing an immediate reading of the current cyclic context.
Time Bands (Weekly / Daily) Temporal visualization helps identify cyclic pivots and rhythm transitions.
🔹 ECA 2 – Market Excesses, Strength, and Energy
ECA 2 analyzes how the market moves within the cyclic structure.
Excesses and Divergences (Cyclic Stochastic) An oscillator calibrated on the same cyclic ratio as the suite. Crossovers between the lower cycle (blue) and upper cycle (red) signal potential phase changes. In areas of excess, divergences often confirm the closing and restart of a cycle.
Directional Movement System (DMS) The ADX measures the strength of the movement, while +DI and -DI indicate direction. A simultaneous crossover of ADX, +DI, and -DI signals imminent acceleration, even before the strength is fully expressed.
Market Pulse – Real Market Energy The Market Pulse measures the amount of real energy moving through the market by relating three factors:
Price Velocity
Normalized Volume
Volatility (ATR relative to price)
These three factors are combined multiplicatively: if one is missing, the impulse weakens. The zero line represents a state of energy equilibrium; values above or below indicate a real imbalance (bullish or bearish). Note: Market Pulse is not a classic oscillator and should not be interpreted as overbought or oversold; it is used to evaluate the energetic quality of a movement.
Operational Convergence
The maximum operational effectiveness of the ECA suite is achieved when all modules converge on the same market phase.
When cyclic timing, volatility, price structure, trend strength, and movement energy align, the context signals a high-probability operational phase. The system is applicable to any timeframe or asset because it is not bound by dogmatic or subjective interpretations of technical or fundamental analysis; instead, it leverages what is actually happening in the market. Major chart patterns and Volume Profile (technically not includable in this specific suite) provide further confirmation.
Under these conditions, the signal does not originate from a single indicator but from the consistency of the entire system: time, volatility, and energy moving in the same direction.
Entries should always be accompanied by proper risk management.
––––––––––––––––––––––––––––––––––––––––––––––––––––––––––––––––––––––––
Clock&Flow – Elements of Cycle Analysis (ECA) | Suite Completa
Elements of Cycle Analysis (ECA) è una suite avanzata di analisi ciclica progettata per leggere il mercato attraverso tempo, struttura, forza ed energia, combinando cicli, volatilità e partecipazione in un unico framework operativo.
La suite è composta da due moduli complementari:
🔹 ECA 1 – Cicli, Struttura e Volatilità (overlay true)
ECA 1 è dedicato all’analisi strutturale e temporale del mercato.
SMA cicliche (ratio ciclica)
Le medie mobili sono calibrate in funzione dei cicli nominali e del timeframe per monitorare più cicli simultaneamente (dal ciclo inferiore fino ai cicli superiori).
Gli incroci tra SMA veloci e lente certificano la chiusura o transizione del ciclo correlato alla SMA più veloce. Il ciclo in questione è segnalato nella info table in basso a destra (per i time frame 15’ - 1h - 2h - 1D) Puoi selezionare il numero dei cicli da osservare e su quali asset applicarle (Index = quotazioni standard / Future = quotazioni estese / 50-200 i classici riferimenti istituzionali per il medio-lungo periodo
Canali ciclici dinamici basati su ATR
I canali rappresentano un ciclo inferiore e il suo superiore, l’ampiezza è data dal time frame osservato e calcolata sulla volatilità media (ATR).
La volatilità non è trattata come rumore, ma come componente strutturale del ciclo, utile per contestualizzare eccessi, compressioni ed espansioni.
Info Table e Quick Guide
Tabelle dinamiche collegano automaticamente SMA, timeframe e cicli temporali, fornendo una lettura immediata del contesto ciclico in corso.
Time Bands (Weekly / Daily)
La visualizzazione temporale aiuta a individuare pivot ciclici e transizioni di ritmo.
––––––––––––––––––––––––––––––––––––––––––––––––––––––––––––––––––––––
🔹 ECA 2 – Eccessi, Forza ed Energia del Mercato
ECA 2 analizza come il mercato si muove all’interno della struttura ciclica.
Eccessi e divergenze (Stochastic ciclico)
Oscillatore calibrato sulla stessa ratio ciclica della suite.
Gli incroci tra ciclo inferiore (blu) e superiore (rosso) segnalano potenziali cambi di fase; in area di eccesso, le divergenze certificano spesso la chiusura e ripartenza del ciclo.
Directional Movement System (DMS)
L’ADX misura la forza del movimento, mentre +DI e –DI ne indicano la direzione.
L’incrocio simultaneo di ADX, +DI e –DI segnala un’accelerazione imminente, anche in assenza di forza già espressa.
Market Pulse – Energia reale del mercato
Il Market Pulse misura quanta energia reale sta attraversando il mercato mettendo in relazione:
velocità del prezzo
volume normalizzato
volatilità (ATR rapportato al prezzo)
I tre fattori sono combinati in modo moltiplicativo: se uno manca, l’impulso si indebolisce.
La linea dello zero rappresenta una condizione di equilibrio energetico; valori sopra o sotto indicano uno sbilanciamento reale, rialzista o ribassista.
Il Market Pulse non è un oscillatore classico e non va interpretato in termini di ipercomprato o ipervenduto: serve a valutare la qualità energetica del movimento.
La massima efficacia operativa della suite ECA si ottiene quando tutti i moduli convergono sulla stessa fase di mercato.
Quando tempi ciclici, volatilità, struttura del prezzo, forza del trend ed energia del movimento risultano allineati, il contesto segnala una fase ad alta probabilità operativa.
È applicabile su qualunque time frame o asset perché non è vincolato a dogmatiche e soggettive interpretazioni di analisi tecnica - fondamentale ma sfrutta ciò che realmente sta accadendo sul mercato.
I principali pattern grafici e il Volume Profile (in questa suite tecnicamente non inseribili) forniscono ulteriori conferme e/o indicazioni.
In queste condizioni il segnale non nasce da un singolo indicatore, ma dalla coerenza dell’intero sistema: tempo, volatilità ed energia si muovono nella stessa direzione.
Gli ingressi vanno sempre accompagnati da una corretta gestione del rischio.

Clock&Flow: Elements of Cycle Analysis 1st partClock&Flow – Elements of Cycle Analysis (ECA) | Complete Suite
Elements of Cycle Analysis (ECA) is an advanced cyclic analysis suite designed to interpret the market through time, structure, strength, and energy, combining cycles, volatility, and participation into a single operational framework.
The suite consists of two complementary modules:
🔹 ECA 1 – Cycles, Structure, and Volatility (Overlay: True)
ECA 1 is dedicated to the structural and temporal analysis of the market.
Cyclic SMAs (Cyclic Ratio) Moving averages are calibrated according to nominal cycles and timeframes to monitor multiple cycles simultaneously (from the lower cycle to the upper cycles). Crossovers between fast and slow SMAs certify the closing or transition of the cycle related to the faster SMA. The specific cycle is identified in the Info Table at the bottom right (for 15m - 1h - 2h - 1D timeframes). You can select the number of cycles to observe and the asset type to apply them to:
Index: Standard quotes (e.g., Cash sessions).
Future: Extended quotes (24h).
50-200: Classic institutional references for the medium-long term.
ATR-based Dynamic Cyclic Channels The channels represent a lower cycle and its upper counterpart; their width is determined by the observed timeframe and calculated based on average volatility (ATR). Volatility is not treated as noise but as a structural component of the cycle, essential for contextualizing excesses, compressions, and expansions.
Info Table and Quick Guide Dynamic tables automatically link SMAs, timeframes, and time cycles, providing an immediate reading of the current cyclic context.
Time Bands (Weekly / Daily) Temporal visualization helps identify cyclic pivots and rhythm transitions.
🔹 ECA 2 – Market Excesses, Strength, and Energy
ECA 2 analyzes how the market moves within the cyclic structure.
Excesses and Divergences (Cyclic Stochastic) An oscillator calibrated on the same cyclic ratio as the suite. Crossovers between the lower cycle (blue) and upper cycle (red) signal potential phase changes. In areas of excess, divergences often confirm the closing and restart of a cycle.
Directional Movement System (DMS) The ADX measures the strength of the movement, while +DI and -DI indicate direction. A simultaneous crossover of ADX, +DI, and -DI signals imminent acceleration, even before the strength is fully expressed.
Market Pulse – Real Market Energy The Market Pulse measures the amount of real energy moving through the market by relating three factors:
Price Velocity
Normalized Volume
Volatility (ATR relative to price)
These three factors are combined multiplicatively: if one is missing, the impulse weakens. The zero line represents a state of energy equilibrium; values above or below indicate a real imbalance (bullish or bearish). Note: Market Pulse is not a classic oscillator and should not be interpreted as overbought or oversold; it is used to evaluate the energetic quality of a movement.
Operational Convergence
The maximum operational effectiveness of the ECA suite is achieved when all modules converge on the same market phase.
When cyclic timing, volatility, price structure, trend strength, and movement energy align, the context signals a high-probability operational phase. The system is applicable to any timeframe or asset because it is not bound by dogmatic or subjective interpretations of technical or fundamental analysis; instead, it leverages what is actually happening in the market. Major chart patterns and Volume Profile (technically not includable in this specific suite) provide further confirmation.
Under these conditions, the signal does not originate from a single indicator but from the consistency of the entire system: time, volatility, and energy moving in the same direction.
Entries should always be accompanied by proper risk management.
––––––––––––––––––––––––––––––––––––––––––––––––––––––––––––––––––––––––
Clock&Flow – Elements of Cycle Analysis (ECA) | Suite Completa
Elements of Cycle Analysis (ECA) è una suite avanzata di analisi ciclica progettata per leggere il mercato attraverso tempo, struttura, forza ed energia, combinando cicli, volatilità e partecipazione in un unico framework operativo.
La suite è composta da due moduli complementari:
🔹 ECA 1 – Cicli, Struttura e Volatilità (overlay true)
ECA 1 è dedicato all’analisi strutturale e temporale del mercato.
SMA cicliche (ratio ciclica)
Le medie mobili sono calibrate in funzione dei cicli nominali e del timeframe per monitorare più cicli simultaneamente (dal ciclo inferiore fino ai cicli superiori).
Gli incroci tra SMA veloci e lente certificano la chiusura o transizione del ciclo correlato alla SMA più veloce. Il ciclo in questione è segnalato nella info table in basso a destra (per i time frame 15’ - 1h - 2h - 1D) Puoi selezionare il numero dei cicli da osservare e su quali asset applicarle (Index = quotazioni standard / Future = quotazioni estese / 50-200 i classici riferimenti istituzionali per il medio-lungo periodo
Canali ciclici dinamici basati su ATR
I canali rappresentano un ciclo inferiore e il suo superiore, l’ampiezza è data dal time frame osservato e calcolata sulla volatilità media (ATR).
La volatilità non è trattata come rumore, ma come componente strutturale del ciclo, utile per contestualizzare eccessi, compressioni ed espansioni.
Info Table e Quick Guide
Tabelle dinamiche collegano automaticamente SMA, timeframe e cicli temporali, fornendo una lettura immediata del contesto ciclico in corso.
Time Bands (Weekly / Daily)
La visualizzazione temporale aiuta a individuare pivot ciclici e transizioni di ritmo.
––––––––––––––––––––––––––––––––––––––––––––––––––––––––––––––––––––––
🔹 ECA 2 – Eccessi, Forza ed Energia del Mercato
ECA 2 analizza come il mercato si muove all’interno della struttura ciclica.
Eccessi e divergenze (Stochastic ciclico)
Oscillatore calibrato sulla stessa ratio ciclica della suite.
Gli incroci tra ciclo inferiore (blu) e superiore (rosso) segnalano potenziali cambi di fase; in area di eccesso, le divergenze certificano spesso la chiusura e ripartenza del ciclo.
Directional Movement System (DMS)
L’ADX misura la forza del movimento, mentre +DI e –DI ne indicano la direzione.
L’incrocio simultaneo di ADX, +DI e –DI segnala un’accelerazione imminente, anche in assenza di forza già espressa.
Market Pulse – Energia reale del mercato
Il Market Pulse misura quanta energia reale sta attraversando il mercato mettendo in relazione:
velocità del prezzo
volume normalizzato
volatilità (ATR rapportato al prezzo)
I tre fattori sono combinati in modo moltiplicativo: se uno manca, l’impulso si indebolisce.
La linea dello zero rappresenta una condizione di equilibrio energetico; valori sopra o sotto indicano uno sbilanciamento reale, rialzista o ribassista.
Il Market Pulse non è un oscillatore classico e non va interpretato in termini di ipercomprato o ipervenduto: serve a valutare la qualità energetica del movimento.
La massima efficacia operativa della suite ECA si ottiene quando tutti i moduli convergono sulla stessa fase di mercato.
Quando tempi ciclici, volatilità, struttura del prezzo, forza del trend ed energia del movimento risultano allineati, il contesto segnala una fase ad alta probabilità operativa.
È applicabile su qualunque time frame o asset perché non è vincolato a dogmatiche e soggettive interpretazioni di analisi tecnica - fondamentale ma sfrutta ciò che realmente sta accadendo sul mercato.
I principali pattern grafici e il Volume Profile (in questa suite tecnicamente non inseribili) forniscono ulteriori conferme e/o indicazioni.
In queste condizioni il segnale non nasce da un singolo indicatore, ma dalla coerenza dell’intero sistema: tempo, volatilità ed energia si muovono nella stessa direzione.
Gli ingressi vanno sempre accompagnati da una corretta gestione del rischio.
