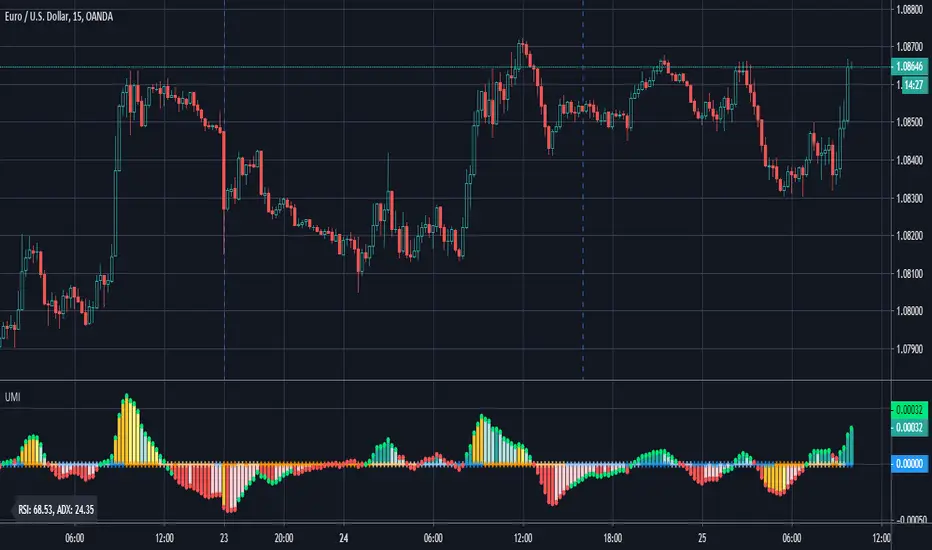
Pro Momentum Table + Trade Alerts📊 Indicator Name: Pro Momentum Table – ADX + DI + ATR + Astro Timing
🧠 Concept:
This indicator is designed for professional scalpers and intraday traders who want to capture only strong momentum waves — not noise. It combines trend strength, volatility, directional movement, momentum oscillation, vega divergence, and astrological timing into a single compact table on your chart.
⚙️ Components Explained:
Metric Description
ADX (Average Directional Index) Measures the strength of the trend. Values above 20 indicate that a meaningful move is starting.
+DI / -DI (Directional Indicators) Show whether buyers (+DI) or sellers (-DI) are dominating. Increasing +DI with ADX rising = bullish momentum. Increasing -DI with ADX rising = bearish momentum.
ATR (Average True Range) Shows volatility and expected range. Used for setting realistic stop-loss and multi-level targets (1×, 1.5×, 2×, 2.5× ATR).
Price Displays the current price level for quick reference.
CMO (Chande Momentum Oscillator) Measures short-term momentum direction and strength. Helps identify overbought/oversold conditions in trend continuation.
Vega Divergence Shows a synthetic reading of volatility pressure — "Bullish" when volatility expansion supports upward moves, "Bearish" for downward pressure, and "Neutral" otherwise.
Astro Remark Suggests ideal time windows based on planetary cycles for scalping entries. “Bullish Window” often aligns with high-probability long trades; “Bearish Window” favors shorts.
Trade Signal The core momentum condition: “Bullish Momentum” if ADX > 20 and +DI rising, “Bearish Momentum” if ADX > 20 and -DI rising, else “No Clear Momentum.”
📈 How to Use:
Wait for ADX > 20 – This confirms that the market is entering a strong momentum phase.
Check DI direction:
✅ +DI rising: Buyers gaining strength → look for long setups.
✅ -DI rising: Sellers gaining strength → look for short setups.
Use ATR to plan exits:
🎯 TP1 = Entry ± 1 × ATR
🎯 TP2 = Entry ± 1.5 × ATR
🎯 TP3 = Entry ± 2 × ATR
🎯 TP4 = Entry ± 2.5 × ATR
CMO & Vega Divergence: Confirm momentum direction and volatility expansion before committing.
Astro Remark: Align your scalping activity with the planetary support window for higher probability trades.
🪙 Pro Tips for Scalpers:
Only trade when ADX > 20 and DI is consistently rising. Ignore signals in choppy or sideways phases.
Avoid trades if Vega is neutral and CMO is flat – these usually indicate fake breakouts.
If targets aren’t hit within expected ATR-based time, treat the move as false and exit early.
Combine with 9 EMA and 20 EMA (hidden) for wave structure confirmation without cluttering the chart.
💡 Summary:
This indicator acts as a real-time trade decision dashboard. It removes clutter from the chart and delivers everything a professional scalper needs — strength, direction, volatility, momentum, timing, and actionable trade bias — all in one elegant table.
Cerca negli script per "adx"

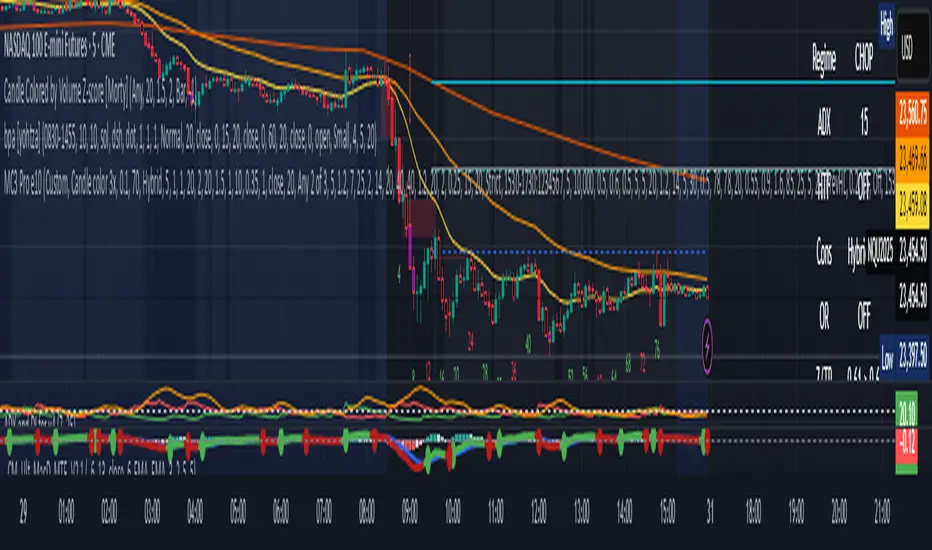
MC3 Pro Ultra e10Al-Brooks style MC3/Thrust signals with smart gating: EMA, Wilder ADX/DI, Consolidation, BO+FT, Z-score, Volume, RSI div, HTF EMA, Structure, OR/Blackout, Smart Cooldown. Non-repainting.
Full Description (for the main page)
MC3 Pro Ultra — Invite-Only (Al Brooks–inspired)
A high-discipline entry tool for 3-bar micro-channels (MC3) and optional 1-bar thrusts (MC1). Signals are filtered by a layered “gate” system: EMA side/slope/distance, Wilder ADX/DI, Consolidation (Box, BB<KC, Efficiency Ratio), Breakout+Follow-Through (BO+FT), TR Z-score expansion, Volume (mild/strict), true RSI divergence, HTF EMA (side/slope/strict), Market Structure (HH/HL vs LH/LL with optional BOS), Liquidity sweep guard, Open Range gate, Blackout windows (news) and Smart Cooldown v2.
Everything is non-repainting (evaluated on bar close or using closed higher-TF values).
What it does
MC3 (3-bar micro-channel) & Thrust (MC1) entries in both directions.
Auto regime: dynamically tightens thresholds in chop and relaxes them in trend.
BO+FT confirm: bar-3 must close beyond prior H/L by X points and near the extreme; optional follow-through (no immediate pullback).
Z-Score (TR): requires statistical range expansion (any bar inside the MC3).
EMA filter: side rule (All 3 / Any 2 / Last), slope, and max ATR distance.
Wilder ADX/DI: strength/rend bias; optional DI dominance.
Consolidation filter: Box+ATR (with break confirmation), Squeeze (BB<KC), or ER (Efficiency Ratio).
Volume gate: mild (above SMA×mult) or strict (3-bar rising).
True RSI divergence: pivot-based; blocks when divergence contradicts direction.
HTF EMA (non-repainting): side/slope/strict from a higher timeframe using closed bars.
Market Structure: longs only in HH/HL, shorts only in LH/LL; optional fresh BOS.
Liquidity Sweep guard: block-against or require-with sweep.
Open Range gate: require OR breakout before entries (optional).
Blackout windows: disable signals during macro/news windows.
Smart Cooldown v2: EMA-stretch + clustering penalty to avoid over-trading.
Retest mode (visual): after a signal, watch for a pullback to prev H/L or an EMA±ATR band.
Panel & Debug: status panel (regime, ADX, HTF, CONS, Z/TR, score, gates) + debug reasons for blocked signals.
R overlay: draws entry/stop/targets and an approximate position size.
Non-repainting: uses barstate.isconfirmed and closed HTF values. Signals print on bar close.
Presets
NQ A+ (2m/5m) – fast trend bias. BO+FT & Z-score on, Volume mild, DI dominance on, HTF strict.
NQ Pullback-safe (5m) – more conservative, higher min score & BO/Z thresholds.
ES 5m – balanced default.
(You can also use Custom and tweak only 2–3 knobs at a time.)
Suggested markets/timeframes: CME index futures (NQ/ES), 2m/5m/15m. Works on FX/indices/crypto with sensible retuning.
How to read signals
Green/Red arrows mark confirmed MC3 or Thrust entries (printed after bar closes).
Label shows S=Score and THR if the thrust override triggered.
Panel (top-right) shows: Regime (TREND/CHOP), ADX (prev closed bar optional), HTF (side/slope), Consolidation mode, OR status, current Z/TR vs threshold, Score≥, and quick Gates (✓/✗) for long/short.
Debug (optional, last bar): concatenated reasons why a signal did not pass (e.g., ).
Retest mode places “RT” markers when price pulls back to the chosen retest source.
Key inputs (high-level)
Definition: MC3 (color / close-to-close / micro-channel HL / combo), optional Thrust override.
EMA: side rule, slope, max ATR distance (with soft scoring).
ADX/DI: Wilder ADX len/threshold, optional DI dominance.
Consolidation: Box+ATR (with min breaks & confirm), Squeeze (BB<KC), ER.
BO+FT: min points beyond prior H/L, close% near extreme, “no-pullback” option.
Z-Score: TR Z-score length & min threshold.
Volume: mild (SMA×mult) or strict (3-bar rising).
RSI divergence: pivot L/R, max lookback age.
HTF: timeframe/length, rule (Side only / Slope only / Strict).
Structure gate: pivot L/R, optional BOS with max age.
Sweep guard: Off / BlockAgainst / RequireWith.
Open Range: session window + “require breakout” toggle.
Blackout: one or two session windows (e.g., FOMC/CPI).
Smart Cooldown v2: base cooldown, EMA-stretch bonus, cluster penalty.
Alerts
Comes with alertconditions for Bull/Bear signals.
Optional JSON payload (direction, score, preset, regime, price, est. R, symbol, timeframe) for webhook-based managers (auto-filtering or auto-sizing).
How to set: Add alert on this indicator → choose condition “Bull MC3/Thrust” or “Bear MC3/Thrust” → Once-per-bar-close → webhook (optional).
Best practices
In trend: keep Auto regime ON; you can slightly lower min score / Z / BO.
In chop: raise min score (+1~2), use Volume strict + DI dominance, increase Z and close% thresholds, optionally require OR breakout.
Retest entries: enable “Retest mode” to get better fills (prev H/L or EMA band).
HTF Strict + Structure gate will materially improve selectivity (fewer trades, higher quality).
Avoid trading during Blackout windows (macro releases, roll).
Respect Smart Cooldown to prevent clustering and revenge trades.
Disclaimers
This is not financial advice. Backtest/forward-test before risking capital.
No indicator guarantees win rate or profits; use stops and position sizing.
Invite-Only access at the author’s discretion. Redistribution is prohibited.
Credits
Inspired by Al Brooks methodology (micro-channels, breakouts, trend vs chop context) and classic Wilder ADX/DI.
Momentum_EMABand📢 Reposting Notice
I am reposting this script because my earlier submission was hidden due to description requirements under TradingView’s House Rules. This updated version fully explains the originality, the reason for combining these indicators, and how they work together. Follow me for future updates and refinements.
🆕 Momentum EMA Band, Rule-Based System
Momentum EMA Band is not just a mashup — it is a purpose-built trading tool for intraday traders and scalpers that integrates three complementary technical concepts into a single rules-based breakout & retest framework.
Originality comes from the specific sequence and interaction of these three filters:
Supertrend → Sets directional bias.
EMA Band breakout with retest logic → Times precise entries.
ADX filter → Confirms momentum strength and avoids noise.
This system is designed to filter out weak setups and false breakouts that standalone indicators often fail to avoid.
🔧 How the Indicator Works — Combined Logic
1️⃣ EMA Price Band — Dynamic Zone Visualization
Plots upper & lower EMA bands (default: 9-period EMA).
Green Band → Price above upper EMA = bullish momentum
Red Band → Price below lower EMA = bearish pressure
Yellow Band → Price within band = neutral zone
Acts as a consolidation zone and breakout trigger level.
2️⃣ Supertrend Overlay — Reliable Trend Confirmation
ATR-based Supertrend adapts to volatility:
Green Line = Uptrend bias
Red Line = Downtrend bias
Ensures trades align with the prevailing trend.
3️⃣ ADX-Based No-Trade Zone — Choppy Market Filter
Manual ADX calculation (default: length 14).
If ADX < threshold (default: 20) and price is inside EMA Band → gray background marks low-momentum zones.
🧩 Why This Mashup Works
Supertrend confirms trend direction.
EMA Band breakout & retest validates the breakout’s strength.
ADX ensures the market has enough trend momentum.
When all align, entries are higher probability and whipsaws are reduced.
📈 Example Trade Walkthrough
Scenario: 5-minute chart, ADX threshold = 20.
Supertrend turns green → trend bias is bullish.
Price consolidates inside the yellow EMA Band.
ADX rises above 20 → trend momentum confirmed.
Price closes above the green EMA Band after retesting the band as support.
Entry triggered on candle close, stop below band, target based on risk-reward.
Exit when Supertrend flips red or ADX momentum drops.
This sequence prevents premature entries, keeps trades aligned with trend, and avoids ranging markets.
🎯 Key Features
✅ Multi-layered confirmation for precision trading
✅ Built-in no-trade zone filter
✅ Fully customizable parameters
✅ Clean visuals for quick decision-making
⚠ Disclaimer: This is Version 1. Educational purposes only. Always use with risk management.

UngliMulti-Indicator Confluence System
This is a **multi-indicator confluence trading signal system** called "Ungli" that combines RSI, ADX, and MACD to identify high-probability momentum opportunities when used alongside chart pattern and trend line breakouts.
## Core Concept
The script identifies moments when multiple technical indicators align to suggest potential price momentum moves, specifically looking for oversold and overbought conditions with momentum confirmation. Use green and red highlights along with chart patterns and trend line breakouts that signal a breakout for confluence for a likely momentum move.
## Technical Indicators Used
**RSI (Relative Strength Index)**
- Default 14-period RSI
- Oversold threshold: < 40
- Overbought threshold: > 60
**ADX (Average Directional Index)**
- Default 14-period ADX with DI+ and DI-
- Threshold: 21
- Looks for ADX below threshold but ticking upward (momentum building)
**MACD (Moving Average Convergence Divergence)**
- Fast: 12, Slow: 26, Signal: 9
- Uses MACD line direction as trend filter
## Signal Logic
**Green Background (Bullish Momentum Signal):**
- RSI > 60 (overbought)
- ADX < 21 AND rising
- MACD line trending upward
**Red Background (Bearish Momentum Signal):**
- RSI < 40 (oversold)
- ADX < 21 AND rising
- MACD line trending downward
## Key Strategy Elements
1. **Confluence Approach**: Requires all three indicators to align, reducing false signals
2. **Momentum Filter**: ADX must be building (rising) even if low, indicating emerging trend strength
3. **Trend Confirmation**: MACD direction must match the expected move
4. **Visual Simplicity**: Clean background highlighting without chart clutter
5. **Pattern Integration**: Designed to work with chart patterns and breakout strategies
## Use Case
This indicator is designed for swing trading and breakout strategies, identifying moments when oversold/overbought conditions coincide with building momentum in the expected direction. The ADX filter helps avoid choppy, trendless markets. Best used in conjunction with:
- Support/resistance breakouts
- Chart pattern breakouts (triangles, flags, channels)
- Trend line breaks
- Key level violations
The background highlights serve as confluence confirmation when combined with your chart analysis and breakout setups.
DMI-LuminateIndicator Description: DMI-Luminate (DMI-LMT)
DMI-Luminate is an enhanced version of the Directional Movement Index (DMI) indicator that combines multiple moving averages for smoothing and offers various options to customize the calculation of ADX, +DM, -DM, DX, and ADXR. It is ideal for traders looking to analyze trend strength and equilibrium points between buyers and sellers.
Components and Features
+DM and -DM: Indicators measuring positive and negative directional movement, helping identify trend direction.
DX (Directional Movement Index): Measures the relative difference between +DM and -DM, indicating the current trend strength.
ADX (Average Directional Index): A smoothed line showing trend strength regardless of direction. Values above 25 generally indicate a strong trend.
ADXR (Average Directional Movement Rating): A moving average of ADX that detects trend strength changes with less sensitivity.
Equilibrium Points: Visual markers (blue circles) that appear when +DM and -DM cross, signaling potential reversals or changes in trend strength.
Customizable Settings
DM Length: The period used to calculate directional movements.
ADX Smoothing: The smoothing period for ADX.
MA Type Universal: Select the moving average type used for smoothing calculations. Options include SMA, EMA, WMA, ALMA, T3, and advanced averages like DNA⚡ and RNA🐢.
T3 Hot Factor: Parameter to adjust the intensity of the T3 moving average (when selected).
Show Lines: Toggle the display of ADX, ADXR, DX, and +DM/-DM lines as you prefer.
Show Equilibrium Points: Enable to visualize crossing points between +DM and -DM.
Background Color and Offset: Customize the background color and offset for better visibility.
How to Use
Trend Identification
Watch the ADX line to gauge trend strength. When ADX is above 25, the trend is considered strong. The +DM and -DM lines indicate if the trend is bullish (+DM > -DM) or bearish (-DM > +DM).
Entry/Exit Signals
Use the equilibrium points (blue circles) to identify potential reversals or changes in trend dynamics based on +DM and -DM crossings.
Moving Average Selection
Experiment with different moving averages to smooth the data and tailor the indicator to your trading style and asset. Faster averages like EMA react better in volatile markets, while SMMA and ALMA suit more stable conditions.
Using ADXR
ADXR offers a smoother view of trend strength to avoid false signals during sideways markets.
Visual Customization
Adjust colors and background to improve readability, especially across different chart themes.
Recommendations
Combine DMI-Luminate with other indicators (e.g., volume, RSI, chart patterns) to confirm entries and exits.
Adjust DM Length and ADX Smoothing according to the timeframe you trade.
Use different moving average types to find the setup that works best for your asset and strategy.

Adaptive Strength MACD [UM]Indicator Description
Adaptive Strength MACD is an adaptive variant of the classic MACD that uses a customized Strength Momentum moving average for both its oscillator and signal lines. This makes the indicator more responsive in trending conditions and more stable in sideways markets.
Key Features
1. Adaptive Strength Momentum MA
Leverages the Adaptive Momentum Oscillator to scale smoothing coefficients dynamically.
2. Trend-Validity Filters
Optional ADX filter ensures signals only fire when trend strength (ADX) exceeds a user threshold.
3. Directional Filter (DI+) confirms bullish or bearish momentum.
4. Color-Coded Histogram
5. Bars turn bright when momentum accelerates, faded when slowing.
6. Grayed out when trend filters disqualify signals.
7. Alerts
Bullish crossover (histogram from negative to positive) and bearish crossover (positive to negative) only when filters validate trend.
Comparison with Regular MACD
1. Moving Averages
Classic MACD uses fixed exponential moving averages (EMAs) for its fast and slow lines, so the smoothing factor is constant regardless of how strong or weak price momentum is.
Adaptive Strength MACD replaces those EMAs with a dynamic “Strength Momentum” MA that speeds up when momentum is strong and slows down in quiet or choppy markets.
2. Signal Line Smoothing
In the classic MACD, the signal is simply an EMA of the MACD line, with one user-selected period.
In the Adaptive Strength MACD , the signal line also uses the Strength Momentum MA on the MACD series—so both oscillator and signal adapt together to the underlying momentum strength.
3. Responsiveness to Momentum
A static EMA reacts the same way whether momentum is surging or fading; you either get too-slow entries when momentum spikes or too-fast whipsaws in noise.
The adaptive MA in your indicator automatically gives you quicker crossovers when there’s a trending burst, while damping down during low-momentum chop.
4. Trend Validation Filters
The classic MACD has no built-in mechanism to know whether price is actually trending versus ranging—you’ll see crossovers in both regimes.
Adaptive Strength MACD includes optional ADX filtering (to require a minimum trend strength) and a DI filter (to confirm bullish vs. bearish directional pressure). When those filters aren’t met, the histogram grays out to warn you.
5. Histogram Coloring & Clarity
Typical MACD histograms often use two colors (above/below zero) or a simple ramp but don’t distinguish accelerating vs. decelerating moves.
Your version employs four distinct states—accelerating bulls, decelerating bulls, accelerating bears, decelerating bears—plus a gray “no-signal” state when filters fail. This makes it easy at a glance to see not just direction but the quality of the move.
6. False-Signal Reduction
Because the classic MACD fires on every crossover, it can generate whipsaws in ranging markets.
The adaptive MA smoothing combined with ADX/DI gating in your script helps suppress those false breaks and keeps you focused on higher-quality entries.
7. Ideal Use Cases
Use the classic MACD when you need a reliable, well-understood trend-following oscillator and you’re comfortable manually filtering choppy signals.
Choose Adaptive Strength MACD \ when you want an all-in-one, automated way to speed up in strong trends, filter out noise, and receive clearer visual cues and alerts only when conditions align.
How to Use
1. Setup
- Adjust Fast and Slow Length to tune sensitivity.
- Change Signal Smoothing to smooth the histogram reaction.
- Enable ADX/DI filters and set ADX Threshold to suit your preferred trend strength (default = 20).
2. Interpretation
- Histogram > 0: Short‐term momentum above long‐term → bullish.
- Histogram < 0: Short‐term below long‐term → bearish.
- Faded greyed bars indicate a weakening move; gray bars show filter invalidation.
How to Trade
Buy Setup:
- Histogram crosses from negative to positive.
- ADX ≥ threshold and DI+ > DI–.
- Look for confirmation (bullish candlestick patterns or support zone).
Sell Setup:
- Histogram crosses from positive to negative.
- ADX ≥ threshold and DI– > DI+.
- Confirm with bearish price action (resistance test or bearish pattern).
Stop & Target
- Place stop just below recent swing low (long) or above recent swing high (short).
- Target risk–reward of at least 1:2, or trail with a shorter‐period adaptive MA.

RSI Strength & Consolidation Zones (Zeiierman)█ Overview
RSI Strength & Consolidation Zones (Zeiierman) is a hybrid momentum and volatility visualization tool that blends enhanced RSI interpretation with ADX-driven consolidation detection. This indicator doesn't just show where RSI is trending — it interprets how strong that trend is, when that strength changes, and where the market may be consolidating in anticipation of breakout movement.
Using a combination of Kalman-filtered RSI, custom-built DMI/ADX, and low-volatility zone recognition, it gives traders a dynamic RSI with strength-based coloring, while also highlighting consolidation zones to spot breakout opportunities.
█ Its uniqueness
Traditional RSI indicators lack context. They may show you when the market is overbought or oversold, but they won’t tell you how strong that condition is, or whether it’s likely to result in continuation or consolidation.
This tool aims to solve that by introducing adaptive strength metrics and structural compression zones, allowing traders to anticipate when the market is likely preparing for a move.
█ How It Works
⚪ Enhanced RSI
Combines traditional RSI and a custom RSI implementation
Smooths both through a Kalman filter for trend direction
Final RSI line reflects smoothed consensus between manual and built-in RSI
Adds an RSI + Strength overlay to show when the directional conviction is increasing
⚪ ADX-Driven Strength Layer
Directional Movement Index (DMI) is calculated both manually and with built-in smoothing
The average ADX value is used to calculate a strength modifier
When ADX exceeds 20, RSI is dynamically enhanced or dampened to reflect directional force
Resulting visual: RSI appears stronger or weaker based on confirmed trend conditions
⚪ Consolidation Zone Detection
When ADX falls below 20, the indicator enters a consolidation zone state
Boxes are drawn dynamically to contain the price within these low-volatility structures
Once the price breaks out of the zone, the indicator plots a breakout signal (▲ or ▼)
⚪ Breakouts
Breakout markers are placed at the first close outside the consolidation box
These signals serve as early indicators for potential trend continuation or reversal
█ How to Use
⚪ Confirm Momentum Strength
Use the RSI + Strength line to determine whether current momentum is backed by trend conviction. If strength expands alongside rising RSI, the move has confirmation.
⚪ Consolidations Zones
When RSI is around the midline, and a consolidation box appears, expect lower volatility and a range-bound market, followed by a breakout.
⚪ Use Breakout Signals for Entry
Look for ▲ or ▼ markers as early triggers. These often coincide with volume expansions or structural breaks.
█ Settings Explained
RSI Length – Number of bars used for RSI. Shorter = more sensitive.
DMI Length – Used in both custom and built-in ADX/DI calculations.
ADX Smoothing – Smooths the trend strength signal. Higher values = smoother strength detection.
Trend Confirmation (Filter Strength) – Adjusts the responsiveness of the Kalman filter.
-----------------
Disclaimer
The content provided in my scripts, indicators, ideas, algorithms, and systems is for educational and informational purposes only. It does not constitute financial advice, investment recommendations, or a solicitation to buy or sell any financial instruments. I will not accept liability for any loss or damage, including without limitation any loss of profit, which may arise directly or indirectly from the use of or reliance on such information.
All investments involve risk, and the past performance of a security, industry, sector, market, financial product, trading strategy, backtest, or individual's trading does not guarantee future results or returns. Investors are fully responsible for any investment decisions they make. Such decisions should be based solely on an evaluation of their financial circumstances, investment objectives, risk tolerance, and liquidity needs.

Range Filter Buy and Sell 5min## **Enhanced Range Filter Strategy: A Comprehensive Overview**
### **1. Introduction**
The **Enhanced Range Filter Strategy** is a powerful technical trading system designed to identify high-probability trading opportunities while filtering out market noise. It utilizes **range-based trend filtering**, **momentum confirmation**, and **volatility-based risk management** to generate precise entry and exit signals. This strategy is particularly useful for traders who aim to capitalize on trend-following setups while avoiding choppy, ranging market conditions.
---
### **2. Key Components of the Strategy**
#### **A. Range Filter (Trend Determination)**
- The **Range Filter** smooths price fluctuations and helps identify clear trends.
- It calculates an **adjusted price range** based on a **sampling period** and a **multiplier**, ensuring a dynamic trend-following approach.
- **Uptrends:** When the current price is above the range filter and the trend is strengthening.
- **Downtrends:** When the price falls below the range filter and momentum confirms the move.
#### **B. RSI (Relative Strength Index) as Momentum Confirmation**
- RSI is used to **filter out weak trades** and prevent entries during overbought/oversold conditions.
- **Buy Signals:** RSI is above a certain threshold (e.g., 50) in an uptrend.
- **Sell Signals:** RSI is below a certain threshold (e.g., 50) in a downtrend.
#### **C. ADX (Average Directional Index) for Trend Strength Confirmation**
- ADX ensures that trades are only taken when the trend has **sufficient strength**.
- Avoids trading in low-volatility, ranging markets.
- **Threshold (e.g., 25):** Only trade when ADX is above this value, indicating a strong trend.
#### **D. ATR (Average True Range) for Risk Management**
- **Stop Loss (SL):** Placed **one ATR below** (for long trades) or **one ATR above** (for short trades).
- **Take Profit (TP):** Set at a **3:1 reward-to-risk ratio**, using ATR to determine realistic price targets.
- Ensures volatility-adjusted risk management.
---
### **3. Entry and Exit Conditions**
#### **📈 Buy (Long) Entry Conditions:**
1. **Price is above the Range Filter** → Indicates an uptrend.
2. **Upward trend strength is positive** (confirmed via trend counter).
3. **RSI is above the buy threshold** (e.g., 50, to confirm momentum).
4. **ADX confirms trend strength** (e.g., above 25).
5. **Volatility is supportive** (using ATR analysis).
#### **📉 Sell (Short) Entry Conditions:**
1. **Price is below the Range Filter** → Indicates a downtrend.
2. **Downward trend strength is positive** (confirmed via trend counter).
3. **RSI is below the sell threshold** (e.g., 50, to confirm momentum).
4. **ADX confirms trend strength** (e.g., above 25).
5. **Volatility is supportive** (using ATR analysis).
#### **🚪 Exit Conditions:**
- **Stop Loss (SL):**
- **Long Trades:** 1 ATR below entry price.
- **Short Trades:** 1 ATR above entry price.
- **Take Profit (TP):**
- Set at **3x the risk distance** to achieve a favorable risk-reward ratio.
- **Ranging Market Exit:**
- If ADX falls below the threshold, indicating a weakening trend.
---
### **4. Visualization & Alerts**
- **Colored range filter line** changes based on trend direction.
- **Buy and Sell signals** appear as labels on the chart.
- **Stop Loss and Take Profit levels** are plotted as dashed lines.
- **Gray background highlights ranging markets** where trading is avoided.
- **Alerts trigger on Buy, Sell, and Ranging Market conditions** for automation.
---
### **5. Advantages of the Enhanced Range Filter Strategy**
✅ **Trend-Following with Noise Reduction** → Helps avoid false signals by filtering out weak trends.
✅ **Momentum Confirmation with RSI & ADX** → Ensures that only strong, valid trades are executed.
✅ **Volatility-Based Risk Management** → ATR ensures adaptive stop loss and take profit placements.
✅ **Works on Multiple Timeframes** → Effective for day trading, swing trading, and scalping.
✅ **Visually Intuitive** → Clearly displays trade signals, SL/TP levels, and trend conditions.
---
### **6. Who Should Use This Strategy?**
✔ **Trend Traders** who want to enter trades with momentum confirmation.
✔ **Swing Traders** looking for medium-term opportunities with a solid risk-reward ratio.
✔ **Scalpers** who need precise entries and exits to minimize false signals.
✔ **Algorithmic Traders** using alerts for automated execution.
---
### **7. Conclusion**
The **Enhanced Range Filter Strategy** is a powerful trading tool that combines **trend-following techniques, momentum indicators, and risk management** into a structured, rule-based system. By leveraging **Range Filters, RSI, ADX, and ATR**, traders can improve trade accuracy, manage risk effectively, and filter out unfavorable market conditions.
This strategy is **ideal for traders looking for a systematic, disciplined approach** to capturing trends while **avoiding market noise and false breakouts**. 🚀

MLB Momentum IndicatorMLB Momentum Indicator is a no‐lookahead technical indicator designed to signal intraday trend shifts and potential reversal points. It combines several well‐known technical components—Moving Averages, MACD, RSI, and optional ADX & Volume filters—to deliver high‐probability buy/sell signals on your chart.
Below is an overview of how it works and what each part does:
1. Moving Average Trend Filter
The script uses two moving averages (fast and slow) to determine the primary trend:
isUpTrend if Fast MA > Slow MA
isDownTrend if Fast MA < Slow MA
You can select the MA method—SMA, EMA, or WMA—and customize lengths.
Why it matters: The indicator only gives bullish signals if the trend is up, and bearish signals if the trend is down, helping avoid trades that go against the bigger flow.
2. MACD Confirmation (Momentum)
Uses MACD (with user‐defined Fast, Slow, and Signal lengths) to check momentum:
macdBuySignal if the MACD line crosses above its signal line (bullish)
macdSellSignal if the MACD line crosses below its signal line (bearish)
Why it matters: MACD crossovers confirm an emerging momentum shift, aligning signals with actual price acceleration rather than random fluctuation.
3. RSI Overbought/Oversold Filter
RSI (Relative Strength Index) is calculated with a chosen length, plus Overbought & Oversold thresholds:
For long signals: the RSI must be below the Overbought threshold (e.g. 70).
For short signals: the RSI must be above the Oversold threshold (e.g. 30).
Why it matters: Prevents buying when price is already overbought or shorting when price is too oversold, filtering out possible poor‐risk trades.
4. Optional ADX Filter (Trend Strength)
If enabled, ADX must exceed a chosen threshold (e.g., 20) for a signal to be valid:
This ensures you’re only taking trades in markets that have sufficient directional momentum.
Why it matters: It weeds out choppy, sideways conditions where signals are unreliable.
5. Optional Volume Filter (High‐Participation Moves)
If enabled, the indicator checks whether current volume is above a certain multiple of its moving average (e.g., 1.5× average volume).
Why it matters: High volume often indicates stronger institutional interest, validating potential breakouts or reversals.
6. ATR & Chandelier (Visual Reference)
For reference only, the script can display ATR‐based stop levels or a Chandelier Exit line:
ATR (Average True Range) helps gauge volatility and can inform stop‐loss distances.
Chandelier Exit is a trailing stop technique that adjusts automatically as price moves.
Why it matters: Though this version of the script doesn’t execute trades, these lines help you see how far to place stops or how to ride a trend.
7. Final Bullish / Bearish Signal
When all conditions (trend, MACD, RSI, optional ADX, optional Volume) line up for a long, a green “Long” arrow appears.
When all conditions line up for a short, a red “Short” arrow appears.
Why it matters: You get a clear, on‐chart signal for each potential entry, rather than needing to check multiple indicators manually.
8. Session & Date Filtering
The script allows choosing a start/end date and an optional session window (e.g. 09:30–16:00).
Why it matters: Helps limit signals to a specific historical backtest range or trading hours, which can be crucial for day traders (e.g., stock market hours only).
Putting It All Together
Primary Trend → ensures you trade in line with the bigger direction.
MACD & RSI → confirm momentum and avoid overbought/oversold extremes.
ADX & Volume → optional filters for strong trend strength & genuine interest.
Arrows → each potential buy (Long) or sell (Short) signal is clearly shown on your chart.
Use Cases
5‐Minute Scalping: Shorter RSI/MACD lengths to catch small, frequent intraday moves.
Swing Trading: Larger MAs, bigger RSI thresholds, and using ADX to filter only major trends.
Cautious Approach: Enable volume & ADX filters to reduce false signals in choppy markets.
Benefits & Limitations
Benefits:
Consolidates multiple indicators into one overlay.
Clear buy/sell signals with optional dynamic volatility references.
Flexible user inputs adapt to different trading styles/timeframes.
Limitations:
Like all technical indicators, it can produce false signals in sideways or news‐driven markets.
Success depends heavily on user settings and the particular market’s behavior.
Summary
The MLB Momentum Indicator combines a trend filter (MAs), momentum check (MACD), overbought/oversold gating (RSI), and optional ADX/Volume filters to create clear buy/sell arrows on your chart. This approach encourages trading in sync with both trend and momentum, and helps avoid suboptimal entries when volume or trend strength is lacking. It can be tailored to scalp micro‐moves on lower timeframes or used for higher‐timeframe swing trading by adjusting the input settings.

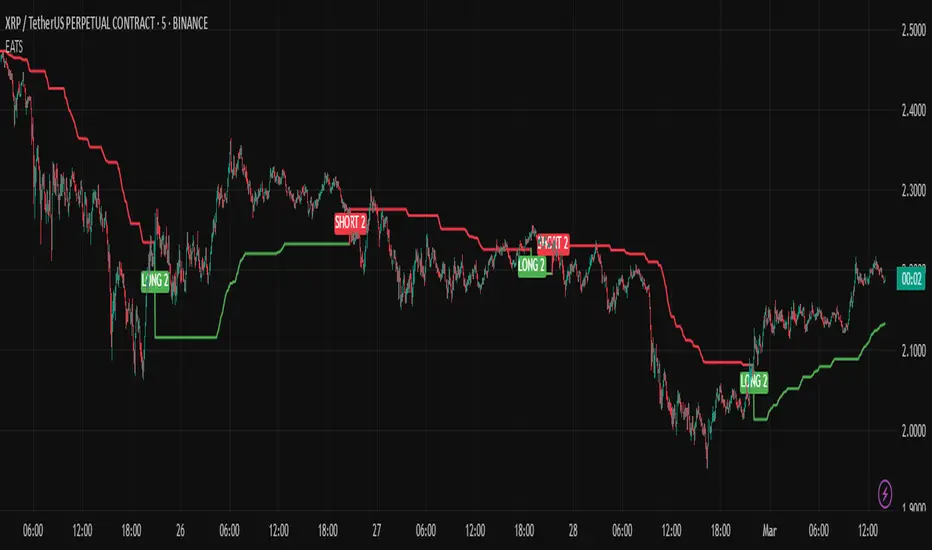
EMA Adaptive Trailing StopThe EMA Adaptive Trailing Stop Strategy is a versatile and comprehensive Pine Script designed for TradingView. This script provides an adaptive trailing stop mechanism that leverages the Exponential Moving Average (EMA) to adjust trailing stops based on market conditions. The strategy dynamically switches between trending and ranging markets by utilizing both Average True Range (ATR) and Average Directional Index (ADX) to detect market conditions.
Key Features:
EMA-Based Trailing Stop:
The script uses the EMA value to set trailing stops precisely. The EMA offers a more responsive calculation to price changes, ensuring closer and more accurate trailing stops that follow market movements effectively.
Market Condition Detection:
The script employs ATR and ADX to distinguish between trending and ranging markets. ATR measures market volatility, while ADX gauges trend strength. The combination of these two indicators provides a more accurate market condition detection.
Customizable Settings:
The script offers various flexible parameters to adjust EMA length, multipliers, and ATR length. Users can customize these settings according to their preferences and trading strategy.
Two Modes:
The script adapts to market conditions by providing two modes: trending mode and ranging mode. In trending mode, the trailing stop is tighter to follow price movements closely, whereas in ranging mode, the trailing stop is looser to accommodate lower volatility.
Entry and Exit Conditions:
The script detects market conditions to set buy and sell signals. These conditions include the calculations of EMA, ATR, and ADX to ensure the signals generated are valid and profitable.
Alerts:
The script provides buy and sell signals through alert conditions for efficient trade management. Users can enable these alerts to get real-time notifications when valid buy or sell signals are detected.
Suitable for Scalping and Swing Trading:
The script is well-suited for both scalping and swing trading strategies. Scalpers can benefit from the responsive and tighter trailing stops during trending conditions, while swing traders can take advantage of the adaptive and looser trailing stops during ranging conditions, allowing them to capture larger price movements.
Explanation of Mode 1 and Mode 2:
Mode 1: Trending Market:
In this mode, the market is identified as trending based on the ADX and ATR values.
LONG 1: This label indicates a buy signal in the trending market mode. It signifies that the trailing stop has been activated and a long position (buy) should be taken when the market is trending.
SHORT 1: This label indicates a sell signal in the trending market mode. It signifies that the trailing stop has been activated and a short position (sell) should be taken when the market is trending.
Mode 2: Ranging Market:
In this mode, the market is identified as ranging based on the ADX and ATR values.
LONG 2: This label indicates a buy signal in the ranging market mode. It signifies that the trailing stop has been activated and a long position (buy) should be taken with a looser trailing stop when the market is ranging.
SHORT 2: This label indicates a sell signal in the ranging market mode. It signifies that the trailing stop has been activated and a short position (sell) should be taken with a looser trailing stop when the market is ranging.
Technical Usage:
Variable Initialization:
The script initializes variables to store values such as trailing stop, long position status, and short position status.
Market Condition Detection:
The script calculates ATR and ADX values to detect whether the market is trending or ranging. This includes the use of f_adx function to calculate ADX values and determine market conditions.
EMA-Based Trailing Stop Calculation:
The script adjusts the trailing stop based on EMA values and ATR. The calculation involves customizable multipliers and parameters that influence the trailing stop's precision.
Plot Trailing Stop:
The script displays the trailing stop on the chart for clear visualization. This includes plotting the trailing stop line with appropriate colors to indicate long and short positions.
Entry and Exit Conditions:
The script determines the entry (buy) and exit (sell) conditions based on market condition detection and trailing stop settings. These conditions are crucial for generating valid buy or sell signals.
Plotshape and Alert:
The script provides plotshapes for buy and sell signals and sets up alert conditions for real-time notifications when a valid buy or sell signal is detected.
Rosiz Support 2### **Indicator Name**: Custom RSI, Stochastic, and ADX
### **Description**:
This is a multi-functional indicator that combines three popular technical analysis tools—**RSI (Relative Strength Index)**, **Stochastic Oscillator**, and **ADX (Average Directional Index)**—into a single, customizable pane. This indicator helps traders analyze momentum, overbought/oversold conditions, and trend strength simultaneously, making it a powerful tool for making informed trading decisions.
---
### **Features**:
1. **RSI (Relative Strength Index)**:
- Measures the speed and change of price movements.
- Helps identify overbought (>70) and oversold (<30) conditions.
- Includes customizable length and source options.
- Background shading visually highlights overbought and oversold zones.
2. **Stochastic Oscillator**:
- Determines momentum by comparing a security's closing price to its price range over a specific period.
- Includes %K and %D lines for crossovers, which signal potential entry or exit points.
- Highlights overbought (>80) and oversold (<20) zones with background fill.
3. **ADX (Average Directional Index)**:
- Measures trend strength (higher values indicate stronger trends).
- Includes customizable smoothing and DI (Directional Indicator) length.
---
### **How to Use**:
- **RSI**: Look for overbought or oversold conditions for potential reversal points. Divergences between price and RSI may signal weakening trends.
- **Stochastic Oscillator**: Watch for %K and %D crossovers near overbought or oversold zones to confirm buy or sell signals.
- **ADX**: Use ADX values to assess trend strength:
- **ADX > 25**: Strong trend.
- **ADX < 20**: Weak or ranging market.
---
### **Customization Options**:
- **RSI Settings**: Adjust length, source, and visual parameters.
- **Stochastic Settings**: Modify %K and %D lengths and smoothing factors.
- **ADX Settings**: Fine-tune smoothing and directional index lengths.
---
### **Advantages**:
- Combines three indicators into one, reducing chart clutter.
- Customizable inputs for flexibility in various trading strategies.
- Visual enhancements (background fills and lines) for better readability.
This indicator is perfect for traders looking to combine momentum analysis, overbought/oversold signals, and trend strength in a single tool!

Detecting Sideways Market or Strong Trends| Copy Trade Tungdubai**Tool Description**:
The **"Detecting Sideways Market or Strong Trends | Copy Trade Tungdubai"** tool is designed to help traders identify two key market conditions:
1. **Sideways Market**:
- This condition is detected when the ADX is below 20, the price stays within the Bollinger Bands, and the RSI is between 45 and 55.
- When the market is sideways, the chart background will turn yellow as a visual alert.
2. **Strong Trend Market**:
- This condition is identified when the ADX is above 25, and either the price breaks out of the Bollinger Bands or the RSI surpasses the overbought (70) or oversold (30) levels.
- When the market is in a strong trend, the chart background will turn blue as a visual alert.
**Key Components of the Tool**:
- **ADX**: Measures the strength of the market trend, with key thresholds at 20 and 25.
- **Bollinger Bands**: Helps determine volatility and checks if the price is within or outside the bands.
- **RSI**: Measures momentum, helping identify overbought and oversold levels.
**Visual Features on the Chart**:
- ADX, RSI, and Bollinger Bands are clearly plotted with their respective key thresholds for easier recognition of market conditions.
- The chart background changes color to reflect the current market condition (yellow for sideways, blue for strong trends).
**Alerts**:
- Alerts are triggered when the market enters either a sideways or strong trend phase, providing notifications to help users act promptly.
This tool serves as a practical aid in recognizing market conditions, allowing traders to make informed decisions aligned with their strategies.
**Mô tả công cụ**:
Công cụ **"Detecting Sideways Market or Strong Trends | Copy Trade Tungdubai"** được thiết kế để giúp các nhà giao dịch xác định hai trạng thái chính của thị trường:
1. **Thị trường đi ngang (Sideways)**:
- Điều kiện được xác định dựa trên chỉ số ADX thấp hơn ngưỡng 20, giá nằm trong dải Bollinger Bands, và chỉ số RSI dao động trong khoảng từ 45 đến 55.
- Khi thị trường đi ngang, nền của biểu đồ sẽ chuyển sang màu vàng để cảnh báo trực quan.
2. **Thị trường bùng nổ sóng mạnh (Strong Trend)**:
- Điều kiện được xác định khi ADX vượt qua ngưỡng 25 và giá phá vỡ dải Bollinger Bands (hoặc) chỉ số RSI vượt ngưỡng quá mua 70 hoặc quá bán 30.
- Khi thị trường bùng nổ sóng mạnh, nền biểu đồ sẽ chuyển sang màu xanh để cảnh báo trực quan.
**Các thành phần chính của công cụ**:
- **ADX**: Được sử dụng để đo sức mạnh xu hướng thị trường, với các ngưỡng quan trọng là 20 và 25.
- **Bollinger Bands**: Được sử dụng để xác định mức độ biến động và kiểm tra giá nằm trong hay ngoài dải.
- **RSI**: Dùng để đo mức độ quá mua/quá bán, xác định động lượng giá.
**Hiển thị trên biểu đồ**:
- Các đường ADX, RSI, và Bollinger Bands được vẽ rõ ràng, cùng với các ngưỡng quan trọng (hỗ trợ nhận biết trạng thái thị trường).
- Nền biểu đồ thay đổi màu sắc tương ứng với điều kiện thị trường.
**Cảnh báo**:
- Cảnh báo sẽ được kích hoạt khi thị trường rơi vào trạng thái đi ngang hoặc bùng nổ sóng mạnh, với các thông báo giúp người dùng hành động kịp thời.
Công cụ này là một trợ thủ hữu ích trong việc nhận biết trạng thái thị trường, từ đó giúp các nhà giao dịch đưa ra quyết định phù hợp với chiến lược của mình.
Trend IdentifierThe “Trend Identifier” indicator is designed to help traders quickly identify trending and sideways market conditions, allowing them to adapt their strategies based on the prevailing market sentiment. By combining several technical analysis tools—ATR (Average True Range), ADX (Average Directional Index), EMA (Exponential Moving Average), and RSI (Relative Strength Index)—this script provides insights into the market’s strength, direction, and volatility to improve trade decision-making.
How It Works
1. ATR (Average True Range):
• ATR measures market volatility. In this script, ATR is used in combination with a moving average to identify periods of rising or falling volatility, which helps differentiate between trending and non-trending conditions.
2. ADX (Average Directional Index):
• ADX is a key component in identifying the strength of a trend. The script uses a threshold system to classify market conditions:
• If ADX is low (below a specified threshold plus a buffer) and ATR indicates low volatility, the market is likely in a sideways condition.
• If ADX is high (above a threshold minus a buffer) with increasing ATR, the market is likely in a trending condition.
3. EMA (Exponential Moving Average):
• A 20-period EMA is used instead of a simple moving average to enhance trend detection speed. The close price’s position relative to the EMA helps identify bullish or bearish trends when combined with ADX and ATR data.
4. RSI (Relative Strength Index):
• RSI acts as a confirmation tool for trend strength. A bullish trend is confirmed if RSI is above 50 and the price is above the EMA, whereas a bearish trend is confirmed if RSI is below 50 and the price is below the EMA.
Market Condition Signals
• Sideways Signal:
• When ADX and ATR indicate a low-volatility, sideways market, the indicator changes the background color to gray, signaling potential low-trend movement or consolidation. A “S” symbol appears above the bars, making it easier to spot this condition.
• Bullish Trend:
• When conditions favor a strong upward trend, the background changes to green. A “B” symbol is displayed below the bar, indicating the onset of a bullish market condition.
• Bearish Trend:
• Conversely, if conditions indicate a downward trend, the background color changes to red. A “S” symbol is displayed below the bar, showing a bearish trend condition.
Using the Indicator
This indicator helps traders understand the current market structure in a glance:
• Sideways (Gray): Low-volatility consolidation period, ideal for range-bound strategies or waiting for a breakout.
• Bullish (Green): Confirmed uptrend, potentially suitable for buying or long entries.
• Bearish (Red): Confirmed downtrend, ideal for short selling or exiting long positions.
The “Trend Identifier” is a powerful tool for traders who seek a clear view of the market structure, using a balanced approach of volatility, trend strength, and momentum. By combining the power of ATR, ADX, EMA, and RSI, this indicator provides a nuanced picture of the market’s behavior, assisting traders in making more informed decisions.

Trend Filtered Signals with Confidence LevelThe Trend Filtered Signals with Confidence Level is a powerful technical analysis tool designed for trend-following traders. It provides clear buy and sell signals, enhanced by a unique confidence level indicator, helping traders filter out market noise and focus on higher-probability trades. This indicator is built with advanced trend detection, volatility filtering, and volume confirmation, making it suitable for various markets such as stocks, forex, and cryptocurrencies.
Key Features:
Precise Trend Detection:
The indicator uses the Average Directional Index (ADX) to measure the strength of the trend, only generating signals when the trend is strong enough (above a user-defined threshold). This prevents false signals during sideways markets and ensures the system follows meaningful trends.
Buy and Sell Signals:
Buy signals are generated when the price crosses above the fast moving average, and the market is in a strong uptrend based on ADX and other filters. Conversely, sell signals are created when the price crosses below the fast moving average in a strong downtrend. These signals appear directly on the chart with visual markers, making them easy to spot in real-time trading.
Confidence Level for Signals:
Each buy and sell signal is given a confidence percentage, calculated from multiple factors:
The strength of the trend (ADX).
The price’s relationship to moving averages (fast MA and slow MA).
The current trading volume compared to its moving average.
The distance between the price and the moving averages, which is checked against the ATR (Average True Range).
A higher confidence percentage indicates a stronger, more reliable signal. Traders can choose to act only on signals that meet or exceed their preferred confidence level.
ATR-Based Volatility Filtering:
To avoid over-trading or receiving signals that are too close together, the ATR (Average True Range) is used as a volatility filter. This ensures that the signals are spaced out, and traders only receive alerts when the price has moved a meaningful distance, considering market volatility.
Volume Confirmation:
Volume plays a crucial role in signal accuracy. The indicator compares the current volume to its moving average, ensuring that signals are generated only when there is sufficient market participation. This feature helps traders avoid signals during low-volume or illiquid market conditions.
Exit Alerts for Trend Reversals:
The indicator doesn’t just help you enter trades; it also assists with exits. When the trend shows signs of weakening or reversing (such as price crossing back over the moving average or losing ADX strength), the indicator will issue an exit alert, helping traders lock in profits or minimize losses.
How to Use the Indicator:
Choosing Timeframes:
The Trend Filtered Signals with Confidence Level works on multiple timeframes. For intraday traders, it can be applied on 5-minute or 15-minute charts. Swing traders might prefer the 1-hour or daily timeframe to capture longer-term trends. Adjust the inputs based on the volatility of the asset you're trading and the timeframe.
Customizing Inputs:
ADX Length: Defines the length for calculating ADX. A typical setting is 14, but this can be adjusted based on how quickly or slowly you want the indicator to react to changes in trend strength.
ADX Threshold: Set this value to filter out weak trends. The default is 20, but for stronger trend signals, a threshold of 25 or 30 may be more suitable.
ATR Length & Multiplier: Used to calculate the average true range, helping to filter out signals that are too close to each other. The ATR multiplier increases the signal’s precision in volatile markets.
Fast and Slow Moving Averages: These moving averages help define the short- and long-term trend. The default fast MA is 9, and the slow MA is 21, but traders can adjust these based on their strategy.
Volume MA: Defines the length of the moving average applied to volume. A longer setting may be more appropriate for swing trading, while a shorter setting can work better for day trading.
Interpreting the Confidence Percentage:
Signals with a confidence level above 50% are generally considered reliable. However, traders can choose to filter trades based on their risk tolerance by only acting on signals above a certain confidence level (e.g., 70% or higher for conservative traders).
Use the confidence percentage as a guide to increase the likelihood of entering higher-probability trades.
Signal Alerts:
The indicator provides customizable alerts for both buy and sell signals. It also generates alerts when it's time to exit a position due to weakening trend conditions.
Alerts can be set up through TradingView’s alert system to notify you via mobile, email, or browser pop-up, so you never miss an opportunity.
Managing Entries and Exits:
Combine the buy and sell signals with the confidence level to time entries more effectively. After entering a position, keep an eye on the exit signals generated by the indicator to manage your trades.
For trend-following strategies, stay in the trade as long as the indicator shows a strong trend. When the confidence level drops significantly, or the exit alert triggers, it may be time to close the trade.
Inputs Overview:
ADX Length: Default 14, for trend strength.
ADX Threshold: Default 20, minimum trend strength for signal generation.
ATR Length & Multiplier: Adjust for volatility filtering.
Fast MA & Slow MA Lengths: Define the short-term and long-term trend.
Volume MA Length: Confirm signals with volume strength.
Minimum Signal Distance: Prevents excessive signal clustering.
Conclusion:
The Trend Filtered Signals with Confidence Level indicator by Danytradehit is a comprehensive tool that not only identifies trends and trend reversals but also helps you gauge the reliability of each signal through a confidence percentage. It simplifies decision-making for traders by filtering out weak or low-probability trades, ensuring you only act on the most promising market opportunities. This indicator is highly customizable and works across various timeframes and asset classes.

Artaking 2Components of the Indicator:
Moving Averages:
Short-Term Moving Average (MA): This is a 50-period Simple Moving Average (SMA) applied to the closing price. It is used to track the short-term trend of the market.
Long-Term Moving Average (MA): This is a 200-period SMA used to track the long-term trend.
Day Trading Moving Average: A 20-period SMA is used specifically for day trading signals, focusing on shorter-term price movements.
Purpose:
The crossing of these moving averages (short-term crossing above or below long-term) provides basic buy and sell signals, indicative of potential trend reversals or continuations.
ADX (Average Directional Index) for Trend Strength:
ADX Calculation: The ADX is calculated using a 14-period length with 14-period smoothing. The ADX value indicates the strength of a trend, regardless of direction.
Strong Trend Condition: The indicator considers a trend to be strong if the ADX value is above 25. This threshold helps filter out trades during weak or sideways markets.
Purpose:
To ensure that the strategy only generates signals when there is a strong trend, thus avoiding whipsaws in low volatility or range-bound conditions.
Support Levels:
Support Level Calculation: The indicator calculates the lowest close over the last 100 periods. This level is used to identify significant support zones where the price might find a floor.
Purpose:
Support levels are critical in identifying potential areas where the price might bounce, making them ideal for setting stop losses or identifying buy opportunities.
Volatility Spike (Proxy for News Trading):
ATR (Average True Range) Calculation: The indicator uses a 14-period ATR to measure market volatility. A volatility spike is identified when the ATR is greater than 1.5 times the 14-period SMA of the ATR.
Purpose:
This serves as a proxy for news events or other sudden market movements that could make the market unpredictable. The indicator avoids generating signals during these periods to reduce the risk of being caught in a volatile, potentially news-driven move.
Fibonacci Retracement Levels:
61.8% Fibonacci Level: Calculated from the highest high and lowest low over the long MA period, this retracement level is widely regarded as a significant support or resistance level.
Purpose:
Position traders often use Fibonacci levels to identify potential reversal points. The indicator incorporates the 61.8% level to fine-tune entries and exits.
Candlestick Patterns for Price Action Trading:
Bullish Engulfing Pattern: A bullish reversal pattern where a green candle fully engulfs the previous red candle.
Bearish Engulfing Pattern: A bearish reversal pattern where a red candle fully engulfs the previous green candle.
Purpose:
These patterns are classic signals used in price action trading to identify potential reversals at key levels, especially when they align with other conditions like support/resistance or Fibonacci levels.
Signal Generation:
The indicator generates buy and sell signals by combining the above elements:
Buy Signal:
A buy signal is triggered when:
The short-term MA crosses above the long-term MA (indicating a potential uptrend).
The trend is strong (ADX > 25).
The current price is near or below the 61.8% Fibonacci retracement level, suggesting a potential reversal.
No significant volatility spike is detected, ensuring the market isn’t reacting unpredictably to news.
Sell Signal:
A sell signal is triggered when:
The short-term MA crosses below the long-term MA (indicating a potential downtrend).
The trend is strong (ADX > 25).
The current price is near or above the 61.8% Fibonacci retracement level, suggesting potential resistance.
No significant volatility spike is detected.
Day Trading Signals:
Independent of the main trend signals, the indicator also generates intraday buy and sell signals when the price crosses above or below the 20-period day trading MA.
Price Action Signals:
The indicator can trigger buy or sell signals based purely on price action, such as the occurrence of bullish or bearish engulfing patterns. This is optional and can be enabled or disabled.
Alerts:
The indicator includes built-in alert conditions that notify the trader when a buy or sell signal is generated. This allows traders to act immediately without having to constantly monitor the charts.
Practical Application:
This indicator is versatile and can be used across various trading styles:
Position Trading: The long-term MA, Fibonacci retracement, and ADX provide a solid foundation for identifying long-term trends and potential entry/exit points.
Day Trading: The short-term MA and day trading MA offer quick signals for intraday trading.
Price Action: Candlestick pattern recognition allows for precise entry points based on market sentiment and behavior.
News Trading: The volatility spike filter helps avoid trading during periods of market instability, often driven by news events.
Conclusion:
The Comprehensive Trading Strategy Indicator is a robust tool designed to help traders navigate various market conditions by integrating multiple strategies into a single, coherent framework. It provides clear, actionable signals while filtering out potentially dangerous trades during volatile or weak market conditions. Whether you're a long-term trader, a day trader, or someone who relies on price action, this indicator can be a valuable addition to your trading toolkit.

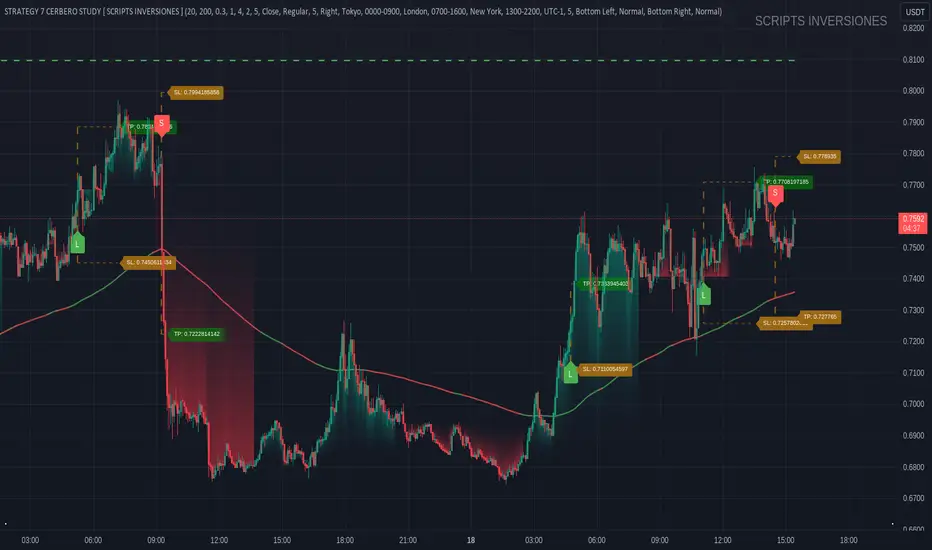
STRATEGY 7 CERBERO STUDY [ SCRIPTS INVERSIONES ]USE:
ADXCONFIG:
Purpose: Select the range for the strength required in the ADX for our alert condition. This setting allows traders to define the threshold at which the ADX indicates sufficient market momentum for trading decisions.
USETRENDLOGIC:
Function: Utilizes the trend EMA to make long entries when the price is above and short entries when it is below the EMA. This provides a simple, clear rule based on the relative position of the price to the EMA, facilitating trend-following strategies.
SELECT A VALUE FOR EMA:
Description: Choose the range for the EMA, and the alert conditions will be applied depending on whether the price is above or below when USETRENDLOGIC is activated. This allows for flexibility in setting the sensitivity of the EMA to price movements.
ACTIVATE/DEACTIVATE EMA 35 AND EMA 50:
Usage: These EMAs are used to determine the trend in shorter periods of time, providing traders with quick insights into market dynamics and potential trend shifts.
LOGIC 1:
ENABLE/DEACTIVATE STRATEGY 1/1:
Conditions: If the 1/1 strategy is activated, it will use the following setup:
Volume entry + EMA condition + BREAK
ADX > ADXCONF
DMI+/DMI- higher depending on the trend
Explanation: This strategy combines volume analysis with EMA and trend indicators to identify strong, actionable trading signals.
This image shows its use.
LOGIC 2:
ENABLE/DEACTIVATE STRATEGY 1/2:
Conditions: If the 1/2 strategy is activated, it utilizes:
Volume entry + EMA condition + BREAK
Purpose: Focuses on significant breaks in EMA levels with accompanying high volume, suggesting a strong momentum-backed entry point.
This image shows its use.
LOGIC 3:
ENABLE/DEACTIVATE STRATEGY 1/3:
Conditions: If the 1/3 strategy is activated, it involves:
Volume entry + EMA condition
RSI
ADX > ADXCONF and DMI+/DMI- higher depending on the trend
Utility: Combines volume, EMA, and RSI indicators with ADX strength to filter entries during extreme market conditions, enhancing the probability of capturing significant moves.
This image shows its use.
LOGIC 4:
ENABLE/DEACTIVATE STRATEGY 1/4:
Conditions: If the 1/4 strategy is activated, it incorporates:
Volume entry + EMA condition
RSI ABOVE/BELOW your EMA
Application: This strategy uses RSI levels in relation to an EMA to fine-tune entry points, helping to confirm momentum before entering trades.
This image shows its use.
LOGIC 5:
ENABLE/DEACTIVATE STRATEGY 1/5:
Conditions: If the 1/5 strategy is activated, it utilizes:
Volume entry + EMA condition
Function: A straightforward strategy that uses volume and EMA conditions to identify primary entry points, focusing on the basic elements of trend and momentum.
This image shows its use.
POI LOGIC (Point of Interest)
Activate/Deactivate 2/1 POI Strategy
When the 2/1 POI strategy is activated, it employs the following conditions to determine market entries:
Volume Entry + EMA Condition + POI TOUCHED + ADX > ADXCONF and DMI+/DMI- higher depending on the trend:
Volume Entry: Looks for significant volume as confirmation that there is enough interest at the current price level.
EMA Condition: A specific condition regarding the Exponential Moving Average (EMA) must be met, such as the price being above or below the EMA, depending on the anticipated direction of price movement.
POI Touched: The price must have touched a previously identified Point of Interest, indicating a level where the price has reacted before.
ADX > ADXCONF: The Average Directional Movement Index (ADX) must be greater than a set value (ADXCONF), indicating sufficient trend strength.
DMI+/DMI- higher depending on the trend: The Directional Movement Indicator Plus (DMI+) or Minus (DMI-) needs to be higher, depending on whether the trend is bullish or bearish, respectively.
This strategy is designed to capitalize on price levels where the market has shown previous reactions, using a combination of technical analysis and volume to confirm entry signals.
This image shows its use.
DIVERGENCE LOGIC
Activate/Deactivate Divergence Strategy
When the divergence strategy is activated, it employs the following conditions for making trading decisions:
Volume Entry + Divergence: This condition indicates that a market entry should be considered when there is a divergence between the price and a technical indicator (such as RSI, MACD, etc.), accompanied by significant volume.
Divergence occurs when the price of an asset moves in the opposite direction of the technical indicator, which may suggest a potential reversal in market trends. Volume plays a crucial role here, as high volume during a divergence can confirm the strength of the potential trend reversal.
This strategy aims to capitalize on moments when the market shows signs of exhaustion in a trend and is potentially gearing up to reverse, making divergences a key component in anticipating significant movements.
This image shows its use.
FOREX LOGIC
Activate/Deactivate FOREX Strategy
When the Forex strategy is activated, it uses the following conditions to execute trades:
Volume Entry + DI+ > DI- for long entries: This condition means that to consider a long position (buy), the Positive Directional Indicator (DI+) must be greater than the Negative Directional Indicator (DI-). This suggests that the market trend is moving upward, supported by sufficient trading volume backing this direction.
DI- > DI+ for short entries: For short entries (sells), the required condition is that the DI- (Negative Directional Indicator) is greater than the DI+ (Positive Directional Indicator). This indicates that the market trend is downward and that there is adequate volume confirming this bearish trend.
These conditions ensure that market entries are made with a clear confirmation of market direction based on volume and directional movement, which is crucial for increasing the probabilities of successful Forex trades.
This image shows its use.
ICT STUDY
Activate/Deactivate Strategy ICT
USAGE:
We use all these components in our indicator to provide comprehensive and effective control when trading using the ICT (Inner Circle Trader) methodology. Each element aids in visualizing and anticipating market movements more accurately, facilitating informed and strategic decision-making.
POI (Point of Interest): Used to identify critical points where the market has shown significant past activity, offering clues on potential future price reactions.
Imbalances: Crucial for spotting areas where supply or demand has been lacking, suggesting potential entry or exit points based on trend reversal or continuation.
ZigZag: Helps to eliminate market noise, allowing for clear identification of significant highs and lows, vital for trend analysis and reversal.
Supports and Resistances: Fundamental in determining price levels at which the market might stop or reverse, essential for any trading strategy.
Fibonacci: Utilized to find support and resistance levels based on mathematical proportions that naturally occur in markets, informing potential areas of interest.
Inducement: We observe these patterns to identify moments when price manipulations might be occurring, helping to avoid traps and enhance entries.
Sweep: Analyzed to understand how and where major market players are clearing accumulated orders, which can indicate significant price movements.
CHOCH (Change of Character): Used to detect a shift in price behavior, which may signal a reversal or trend change.
BOS (Break of Structure): Key for detecting when the price breaks through significant structures, suggesting changes in market direction.
Forecasting Length: Determines how far the price may reach into the future based on current analysis, crucial for planning long-term trades.
This image shows its use.
IF USE TP AND SL
RSI/MFI Selling Sentiment IndexPsychological Sales Index (Psychological Sales Index)
Fundamental Indicators of Market Sentiment: The Importance of MFI and RSI
The two fundamental indicators that best reflect market sentiment are Money Flow Index (MFI) and Relative Strength Index (RSI). MFI is an indicator of the flow of funds in a market by combining price and volume, which is used to determine whether a stock is over-bought or over-selling. RSI is an indicator of the overheating of the market by measuring the rise and fall of prices, which is applied to the analysis of the relative strength of stock prices. These two indicators allow a quantitative assessment of the market's buying and selling pressure, which provides important information to understand the psychological state of market participants.
Using timing and fundamental metrics
In order to grasp the effective timing of the sale, in-depth consideration was needed on how to use basic indicators. MFI and RSI represent the buying and selling pressures of the market, respectively, but there is a limit to reflecting the overall trend of the market alone. As a result, a study on how to capture more accurate selling points was conducted by comprehensively considering technical analysis along with psychological factors of the market.
The importance of ADX integration and weighting
The "Average Regional Index (ADX)" was missing in the early version. ADX is an indicator of the strength of a trend, and has experienced a problem of less accuracy in selling sentiment indicators, especially in the upward trend. To address this, we incorporated ADX and adopted a method of adjusting the weights of MFI and RSI according to the values of ADX. A high ADX value implies the existence of a strong trend, in which case it is appropriate to reduce the influence of MFI and RSI to give more importance to the strength of the trend. Conversely, a low ADX value increases the influence of MFI and RSI, putting more weight on the psychological elements of the market.
How to use and interpret
The user can adjust several parameters. Key inputs include 'Length', 'Overbought Threshold', 'DI Length', and 'ADX Smoothing'. These parameters are used to set the calculation period, overselling threshold, DI length, and ADX smoothing period of the indicator, respectively. The script calculates the psychological selling index based on MFI, RSI, and ADX. The calculated index is normalized to values between 0 and 100 and is displayed in the graph. Values above 'Overbought Threshold' indicate an overselling state, which can be interpreted as a potential selling signal. This index allows investors to comprehensively evaluate the psychological state of the market and the strength of trends, which can be used to make more accurate selling decisions.

Multi-Timeframe (MTF) Dashboard by RiTzMulti-Timeframe Dashboard
Shows values of different Indiactors on Multiple-Timeframes for the selected script/symbol
VWAP : if LTP is trading above VWAP then Bullish else if LTP is trading below VWAP then Bearish.
ST(21,1) : if LTP is trading above Supertrend (21,1) then Bullish , else if LTP is trading below Supertrend (21,1) then Bearish.
ST(14,2) : if LTP is trading above Supertrend (14,2) then Bullish , else if LTP is trading below Supertrend (14,2) then Bearish.
ST(10,3) : if LTP is trading above Supertrend (10,3) then Bullish , else if LTP is trading below Supertrend (10,3) then Bearish.
RSI(14) : Shows value of RSI (14) for the current timeframe.
ADX : if ADX is > 75 and DI+ > DI- then "Bullish ++".
if ADX is < 75 but >50 and DI+ > DI- then "Bullish +".
if ADX is < 50 but > 25 and DI+ > DI- then "Bullish".
if ADX is above 75 and DI- > DI+ then "Bearish ++".
if ADX is < 75 but > 50 and DI- > DI+ then "Bearish+".
if ADX is < 50 but > 25 and DI- > DI+ then "Bearish".
if ADX is < 25 then "Neutral".
MACD : if MACD line is above Signal Line then "Bullish", else if MACD line is below Signal Line then "Bearish".
PH-PL : "< PH > PL" means LTP is trading between Previous Timeframes High(PH) & Previous Timeframes Low(PL) which indicates Rangebound-ness.
"> PH" means LTP is trading above Previous Timeframes High(PH) which indicates Bullish-ness.
"< PL" means LTP is trading below Previous Timeframes Low(PL) which indicates Bearish-ness.
Alligator : If Lips > Teeth > Jaw then Bullish.
If Lips < Teeth < Jaw then Bearish.
If Lips > Teeth and Teeth < Jaw then Neutral/Sleeping.
If Lips < Teeth and Teeth > Jaw then Neutral/Sleeping.
Settings :
Style settings :-
Dashboard Location: Location of the dashboard on the chart
Dashboard Size: Size of the dashboard on the chart
Bullish Cell Color: Select the color of cell whose value is showing Bullish-ness.
Bearish Cell Color: Select the color of cell whose value is showing Bearish-ness.
Neutral Cell Color: Select the color of cell whose value is showing Rangebound-ness.
Cell Transparency: Select Transparency of cell.
Column Settings :-
You can select which Indicators values should be displayed/hidden.
Timeframe Settings :-
You can select which timeframes values should be displayed/hidden.
Note :- I'm not a pro Developer/Coder , so if there are any mistakes or any suggestions for improvements in the code then do let me know!
Note :- Use in Live market , might show wrong values for timeframes other than current timeframe in closed market!!

Nifty / Banknifty Dashboard by RiTzNifty / Banknifty Dashboard :
Shows Values of different Indicators on current Timeframe for the selected Index & it's main constituents according to weightage in index.
customized for Nifty & Banknifty (You can customize it according to your needs for the markets/indexes you trade in)
Interpretation :-
VWAP : if LTP is trading above VWAP then Bullish else if LTP is trading below VWAP then Bearish.
ST(21,1) : if LTP is trading above Supertrend (21,1) then Bullish , else if LTP is trading below Supertrend (21,1) then Bearish.
ST(14,2) : if LTP is trading above Supertrend (14,2) then Bullish , else if LTP is trading below Supertrend (14,2) then Bearish.
ST(10,3) : if LTP is trading above Supertrend (10,3) then Bullish , else if LTP is trading below Supertrend (10,3) then Bearish.
RSI(14) : Shows value of RSI (14) for the current timeframe.
ADX : if ADX is > 75 and DI+ > DI- then "Bullish ++".
if ADX is < 75 but >50 and DI+ > DI- then "Bullish +".
if ADX is < 50 but > 25 and DI+ > DI- then "Bullish".
if ADX is above 75 and DI- > DI+ then "Bearish ++".
if ADX is < 75 but > 50 and DI- > DI+ then "Bearish+".
if ADX is < 50 but > 25 and DI- > DI+ then "Bearish".
if ADX is < 25 then "Neutral".
MACD : if MACD line is above Signal Line then "Bullish", else if MACD line is below Signal Line then "Bearish".
PDH-PDL : "< PDH > PDL" means LTP is trading between Previous Days High(PDH) & Previous Days Low(PDL) which indicates Rangebound-ness.
"> PDH" means LTP is trading above Previous Days High(PDH) which indicates Bullish-ness.
"< PDL" means LTP is trading below Previous Days Low(PDL) which indicates Bearish-ness.
Alligator : If Lips > Teeth > Jaw then Bullish.
If Lips < Teeth < Jaw then Bearish.
If Lips > Teeth and Teeth < Jaw then Neutral/Sleeping.
If Lips < Teeth and Teeth > Jaw then Neutral/Sleeping.
Settings :
Style settings :-
Dashboard Location: Location of the dashboard on the chart
Dashboard Size: Size of the dashboard on the chart
Bullish Cell Color: Select the color of cell whose value is showing Bullish-ness.
Bearish Cell Color: Select the color of cell whose value is showing Bearish-ness.
Neutral Cell Color: Select the color of cell whose value is showing Rangebound-ness.
Cell Transparency: Select Transparency of cell.
Columns Settings :-
You can select which Indicators values should be displayed/hidden.
Rows Settings :-
You can select which Stocks/Symbols values should be displayed/hidden.
Symbol Settings :-
Here you can select the Index & Stocks/Symbols
Dashboard for Index : select Nifty/Banknifty
if you select Nifty then Nifty spot, Nifty current Futures and the stocks with most weightage in Nifty index will be displayed on the Dashboard/Table.
if you select Banknifty then Banknifty spot, Banknifty current Futures and the stocks with most weightage in Banknifty index will be displayed on the Dashboard/Table.
You can Customise it according to your needs, you can choose any Symbols you want to use.
Note :- This is inspired from "RankDelta" by AsitPati and "Nifty and Bank Nifty Dashboard v2" by cvsk123 (Both these scripts are closed source!)
I'm not a pro Developer/Coder , so if there are any mistakes or any suggestions for improvements in the code then do let me know!

40 crypto screener [LUPOWN]// ENGLISH
This indicator shows two tables, with 10 assets each, they can be currencies, stocks or cryptos, the columns can be changed to the information you want to see, among the options are price or change (change in percentage of the candle in the temporality where you are seeing it), TL are buy or sell signals according to the Latin trading strategy (Squeeze momentum combined with ADX) buy if the momentum changes to range or rise and the ADX has a negative slope, sell if the momentum changes to range or fall and The ADX has a negative slope, the signals are not 100% effective, you must support it with price action and market speculation, directionality in the momentum, slope of the ADX, if there is divergence in the momoentum squeeze, lux something and cipher use an indicator of Lazy bear, lux something signals when two wave trends cross and the cipher signals when the wave trend crosses above or below the 0 point.
You can choose between seeing one or two tables, this so that it can be seen on small screens, there is also the option to hide the tables and show the label, which is also an alternative to see it on small screens
i got the main idea from @QuantNomad
//SPANISH
Este indicador muestra dos tablas, con 10 activos cada una, pueden ser divisas, acciones o cryptos, las columnas se pueden cambiar a la información que quieras ver, entre las opciones están precio o cambio (cambio en porcentaje de la vela en la temporalidad donde lo estes viendo), TL son señales de compra o venta según estrategia de trading latino (Squeeze momentum combinado con ADX) compra si el momentum cambia a rango o subida y el ADX tiene pendiente negativa, venta si el momentum cambia a rango o caída y el ADX tiene pendiente negativa, las señales no son 100% efectivas debes apoyarla con la acción del precio y especulación del mercado, direccionalidad en el momentum, pendiente del ADX, si hay divergencia en el squeeze momoentum, lux algo y cipher utilizan un indicador de Lazy bear, lux algo da señal cuando dos wave trend se cruzan y el cipher da señal cuando el wave trend cruza por encima o debajo del punto 0.
Puedes elegir entre ver una o dos tablas, esto para que se pueda ver en pantallas pequeñas, también esta la opción de ocultar las tablas y mostrar el label, que también es una alternativa para verlo en pantallas pequeñas
La idea principal la tome de @QuantNomad

Dual SuperTrend, Ichimoku and DMI Color Weighted by DGTThis study interprets SuperTrend with Ichimoku Cloud, one of the popular technical analysis indicator, and interprets Directional Movement (DMI), which is another quite valuable technical analysis indicator.
Then combines the interpreted SuperTrend with interpreted Directional Movement (DMI) and Volume Based Colored Bars indicator created by Kıvaç ÖZBİLGİÇ (permission has been granted from the author)
Here are details of the concept applied
1- SuperTrend Line colored based on Ichimoku Cloud
Definition
The Ichimoku Cloud, developed by Goichi Hosoda and published in the late 1960s, is a collection of technical indicators that give it a unique capacity to show support and resistance levels, momentum and trend direction
What Does the Ichimoku Cloud Tells?
The overall trend is up when price is above the cloud, known as Kumo Cloud, down when price is below the Kumo Cloud, and trendless or transitioning when price is in the Kumo Cloud
When Senkou Span A (Leading Span A) is rising and above Senkou Span B (Leading Span B), this helps confirm the uptrend and space between the lines is typically colored green. When Senkou Span A is falling and below Senkou Span B, this helps confirm the downtrend. The space between the lines is typically colored red
Traders often use the Kumo Cloud as an area of support and resistance depending on the relative location of the price. The Kumo Cloud provides support/resistance levels that can be projected into the future. This sets the Ichimoku Cloud apart from many other technical indicators that only provide support and resistance levels for the current date and time
Crossovers, also known as TK Cross among Ichimoku Cloud traders, are another way the indicator can be used. Watch for the Tenkan-Sen Line, or Conversion Line, to move above the Kijun-Sen Line, or Base Line, especially when price is above the Kumo cloud. This can be a powerful buy signal. One option is to hold the trade until the Tenkan-Sen drops back below the Kijun-Sen Line. Any of the other lines could be used as exit points as well.
With this study:
Allow Traders to use the Ichimoku Cloud in conjunction with other technical indicators to maximize their risk-adjusted returns
The Ichimoku Cloud can make a chart look busy with all the lines. To Remedy this a different approach is applied in this study showing the Price and the Kumo Cloud relation as well as TK Crosses displayed. The SuperTrend Indicator is chosen to display Ichimoku Indicator, where the SuperTrend is another trend following indicator.
How it works:
SuperTrend Line is colored as:
Green when the Price is above the Kumo Cloud
Red when the Price is below the Kumo Cloud
Black when the Price is within the Kumo Cloud
And Finally Blue when the Kumo Cloud Is not ready to be drawn or not Kumo Cloud available
Additionally intensity of the colors used in all cases above are defined by values of Tenkan-Sen and Kijun-Sen Line, which allows us to detect TK Crosses
2- Plots Colored Directional Movement Line
Definition
Directional Movement (DMI) (created by J. Welles Wilder ) is actually a collection of three separate indicators combined into one. Directional Movement consists of the Average Directional Index (ADX) , Plus Directional Indicator (+D I) and Minus Directional Indicator (-D I) . ADX's purposes is to define whether or not there is a trend present. It does not take direction into account at all. The other two indicators (+DI and -DI) are used to compliment the ADX. They serve the purpose of determining trend direction. By combining all three, a technical analyst has a way of determining and measuring a trend's strength as well as its direction.
This study combines all three lines in a single colored shapes series plotted on the top of the price chart indicating the trend strength with different colors and its direction with triangle up and down shapes.
What to look for
Trend Strength : Analyzing trend strength is the most basic use for the DMI. Wilder believed that a DMI reading above 25 indicated a strong trend, while a reading below 20 indicated a weak or non-existent trend
Crosses : DI Crossovers are the significant trading signal generated by the DMI
With this study
A Strong Trend is assumed when ADX >= 25
Bullish Trend is defined as (+D I > -DI ) and (ADX >= 25), which is plotted as green triangle up shape on top of the price chart
Bearish Trend is defined as (+D I < -DI ) and (ADX >= 25), which is plotted as red triangle down shape on top of the price chart
Week Trend is assumed when 17< ADX < 25, which is plotted as black triangles up or down shape, depending on +DI-DI values, on top of the price chart
Non-Existent Trend is assumed when ADX < 17, which is plotted as yellow triangles up or down shape, depending on +DI-DI values, on top of the price chart
Additionally intensity of the colors used in all cases above are defined by comparing ADX’s current value with its previous value
3- Volume Based Colored Bars indicator created by Kıvaç ÖZBİLGİÇ
Volume Based Colored Bars colors the bars into volume weighted signals increasing the visibility of the Volume changes. Intensity of the colors of the bars varies according to average value of the volume for given length of bars (default value set to 30 bars)
Disclaimer: The script is for informational and educational purposes only. Use of the script does not constitutes professional and/or financial advice. You alone the sole responsibility of evaluating the script output and risks associated with the use of the script. In exchange for using the script, you agree not to hold dgtrd tradingview user liable for any possible claim for damages arising from any decision you make based on use of the script

Colored Directional Movement and Bollinger Band's Cloud by DGTThis study combines Bollinger Bands, one of the most popular technical analysis indicators on the market, and Directional Movement (DMI), which is another quite valuable technical analysis indicator.
Bollinger Bands used in conjunction with Directional Movement (DMI) may help getting a better understanding of the ever changing landscape of the market and perform more advanced technical analysis
Here are details of the concept applied
1- Plots Bollinger Band’s (BB) Cloud colored based on Bollinger Band Width (BBW) Indicator’s value
Definition
Bollinger Bands (created by John Bollinger ) are a way to measure volatility . As volatility increases, the wider the bands become and similarly as volatility decreases, the gap between bands narrows
Bollinger Bands, in widely used approach, consist of a band of three lines. Likewise common usage In this study a band of five lines is implemented
The line in the middle is a Simple Moving Average (SMA) set to a period of 20 bars (the most popular usage). The SMA then serves as a base for the Upper and Lower Bands. The Upper and Lower Bands are used as a way to measure volatility by observing the relationship between the Bands and price. the Upper and Lower Bands in this study are set to two and three standard deviations (widely used form is only two standard deviations) away from the SMA (The Middle Line), hence there are two Upper Bands and two Lower Bands. The background between two Upper Bands is filled with a green color and the background between two Lower Bands is filled with a red color. In this we have obtained Bollinger Band’s (BB) Clouds (Upper Cloud and Lower Cloud)
Additionally the intensity of the color of the background is calculated with Bollinger Bands Width ( BBW ), which is a technical analysis indicator derived from the standard Bollinger Bands indicator. Bollinger Bands Width, quantitatively measures the width between the Upper and Lower Bands. In this study the intensity of the color of the background is increased if BBW value is greater than %25
What to look for
Price Actions : Prices are almost always within the bands especially at this study the bands of three standard deviations away from the SMA. Price touching or breaking the BB Clouds could be considered as buying or selling opportunity. However this is not always the case, there are exceptions such as Walking the Bands. “Walking the Bands” can occur in either a strong uptrend or a strong downtrend. During a strong trend, there may be repeated instances of price touching or breaking through the BB Clouds. Each time that this occurs, it is not a signal, it is a result of the overall strength of the move. In this study in order to get a better understanding of the trend and add ability to perform some advanced technical analysis Directional Movement Indicator (DMI) is added to be used in conjunction with Bollinger Bands.
Cycling Between Expansion and Contraction : One of the most well-known theories in regards to Bollinger Bands is that volatility typically fluctuates between periods of expansion (Bands Widening : surge in volatility and price breaks through the BB Cloud) and contraction (Bands Narrowing : low volatility and price is moving relatively sideways). Using Bollinger Bands in conjunction with Bollinger Bands Width may help identifying beginning of a new directional trend which can result in some nice buying or selling signals. Of course the trader should always use caution
2- Plots Colored Directional Movement Line
Definition
Directional Movement (DMI) (created by J. Welles Wilder ) is actually a collection of three separate indicators combined into one. Directional Movement consists of the Average Directional Index (ADX) , Plus Directional Indicator (+D I) and Minus Directional Indicator (-D I) . ADX's purposes is to define whether or not there is a trend present. It does not take direction into account at all. The other two indicators (+DI and -DI) are used to compliment the ADX. They serve the purpose of determining trend direction. By combining all three, a technical analyst has a way of determining and measuring a trend's strength as well as its direction.
This study combines all three lines in a single colored shapes series plotted on the top of the price chart indicating the trend strength with different colors and its direction with triangle up and down shapes.
What to look for
Trend Strength : Analyzing trend strength is the most basic use for the DMI. Wilder believed that a DMI reading above 25 indicated a strong trend, while a reading below 20 indicated a weak or non-existent trend
Crosses : DI Crossovers are the significant trading signal generated by the DMI
With this study
A Strong Trend is assumed when ADX >= 25
Bullish Trend is defined as (+D I > -DI ) and (ADX >= 25), which is plotted as green triangle up shape on top of the price chart
Bearish Trend is defined as (+D I < -DI ) and (ADX >= 25), which is plotted as red triangle down shape on top of the price chart
Week Trend is assumed when 17< ADX < 25, which is plotted as black triangles up or down shape, depending on +DI-DI values, on top of the price chart
Non-Existent Trend is assumed when ADX < 17, which is plotted as yellow triangles up or down shape, depending on +DI-DI values, on top of the price chart
Additionally intensity of the colors used in all cases above are defined by comparing ADX’s current value with its previous value
Summary of the Study:
Even more simplified and visually enhanced DMI drawing comparing to its classical usage (may require a bit practice to get used to it)
As said previously, to get a better understanding of the trend and add ability to perform some advanced technical analysis Directional Movement Indicator (DMI) is used in conjunction with Bollinger Bands.
PS: Analysis and tests are performed with high volatile Cryptocurrency Market
Source of References : definitions provided herein are gathered from TradingView’s knowledgebase/library
Disclaimer: The script is for informational and educational purposes only. Use of the script does not constitutes professional and/or financial advice. You alone the sole responsibility of evaluating the script output and risks associated with the use of the script. In exchange for using the script, you agree not to hold dgtrd tradingview user liable for any possible claim for damages arising from any decision you make based on use of the script

Ultimate Momentum IndicatorThis is an indicator I've been playing with for a while, based on my previous MACD w/ RSI Warning indicator. This one takes it a step further, including information from MACD, RSI, ADX, and Parabolic SAR. These four indicators are represented in this indicator as follows:
MACD: The histogram itself is a normal MACD histogram. Nothing strange about it, and you can adjust the settings for it just as you would a normal MACD.
RSI: Any time the RSI is outside of normal ranges (which can be adjusted in the settings), the bar on the histogram will turn amber to warn you. The actual RSI value is also shown in a label to the left side of the indicator.
ADX: Crosses are drawn along the 0 line to indicate ADX. Blue means the ADX is below the trending level (adjustable in the settings), and orange means it is above that level. Darker colors indicate the ADX has gone up since the previous bar, while lighter colors indicate it has gone down. The actual ADX value is also shown in the label to the left side of the indicator.
Parabolic SAR: At the outside point of each bar in the histogram, a colored dot is drawn. If the dot is green, the Parabolic SAR (settings adjustable) is currently below the closing price. If the dot is red, the SAR is above the closing price.
I must stress that this indicator is not a replacement for any one of the indicators it includes, as it's really only pulling small bits of information from each. The point of this indicator is to give a cohesive picture of momentum at a quick glance. I encourage you to continue to use the normal versions of whichever of the basic indicators you already use, especially if those indicators are a key part of your strategy. This indicator is designed purely as a way to get a bird's eye view of the momentum.
Pretty much every normally adjustable value can be adjusted in the settings for each of the base indicators. You can also set:
The RSI warning levels (30 and 70 by default)
The ADX Crossover, i.e. the point at which you consider the ADX value to indicate a strong trend (25 by default)
The offset for the label which shows the actual RSI & ADX values (109 by default, which happens to line up with my chart layout--yours will almost certainly need to be different to look clean)
All of the colors, naturally
As always, I am open to suggestions on how I might make the indicator look cleaner, or even other indicators I might try to include in the data this indicator produces. My choice of indicators to base this one from is entirely based on the ones I use and know, but I'm sure there are other great indicators that may improve this combination indicator even more!