Consolidation Zones[RanaAlgo]Overview
This indicator helps traders identify price consolidation zones (ranges) and potential breakouts in the market. It is useful for spotting periods of low volatility before significant price movements.
How It Works
Detects Consolidation Zones
Uses the ADX (Average Directional Index) to determine when the market is in a consolidation phase .
When ADX is below the threshold , the indicator marks the start of a consolidation zone.
Draws a semi-transparent box around the price range, adjusting its height as new highs/lows form.
Tracks Breakouts
When price breaks above/below the consolidation box, it signals a potential trend continuation.
Displays breakout arrows/labels (configurable shape & style) when price exits the range.
Visual Features
Boxes highlight consolidation areas (customizable color, border, and style).
Labels show real-time status ("CONSOLIDATING" or "TRENDING").
Breakout signals appear as arrows or shapes (up/down).
Usefulness in Trading
Range Trading: Helps traders identify sideways markets for buying low and selling high.
Breakout Trading: Signals potential trend entries when price exits consolidation.
Trend Confirmation: Low ADX + consolidation box = weak trend; breakout = possible trend start.
Example: If price stays in a blue box (consolidation) and then breaks above with an arrow, it suggests a bullish move.
Cerca negli script per "adx"

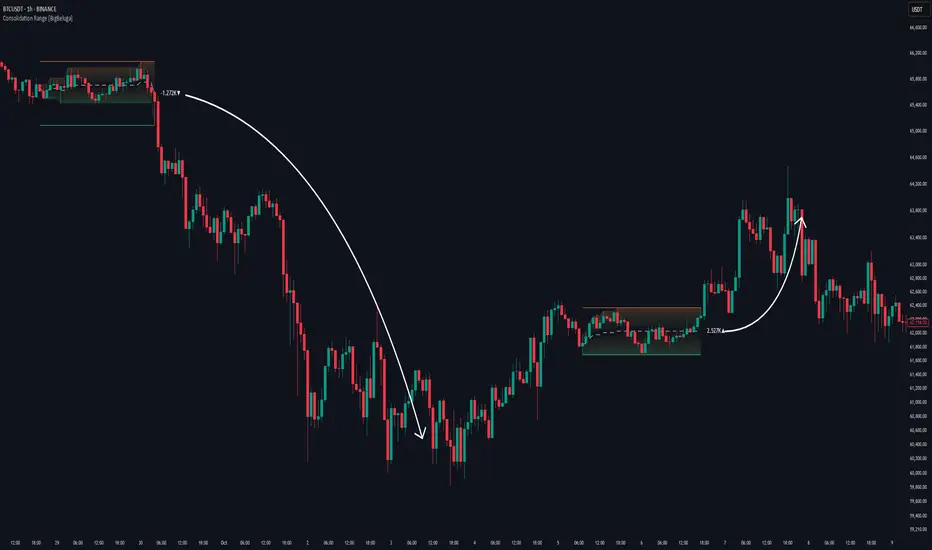
Consolidation Range [BigBeluga]A hybrid volatility-volume indicator that isolates periods of price equilibrium and reveals the directional force behind each range buildup.
Consolidation Range is a powerful tool designed to detect compression phases in the market using volatility thresholds while visualizing volume imbalance within those phases. By combining low-volatility detection with directional volume delta, it highlights where accumulation or distribution is occurring—giving traders the confidence to act when breakouts follow. This indicator is particularly valuable in choppy or sideways markets where range identification and sentiment context are key.
🔵 CONCEPTS
Volatility Compression: Uses ADX (Average Directional Index) to detect periods of low trend strength—specifically when ADX drops below a configurable threshold.
Range Structure: Upon a low-volatility trigger, the script dynamically anchors horizontal upper and lower bounds based on local highs and lows.
Directional Volume Delta: Inside each active range, it calculates the net difference between buy and sell volume, showing who controlled the range.
Sentiment Bias: A label appears in the center of the zone on breakout, showing the accumulated delta and bias direction (▲ for positive, ▼ for negative).
Range Validity Filter: Only ranges with more than 15 bars are considered valid—short-lived consolidations are auto-filtered.
🔵 KEY FEATURES
Detects low volatility market phases using ADX logic (crosses under "Volatility Threshold Input").
Automatically plots adaptive consolidation zones with upper and lower boundary lines.
Includes dynamic midline to visualize the price average inside the range.
Visual range is filled with a progressive gradient to reflect distance between highs and lows.
When the range is active, the indicator accumulates volume delta (Buy - Sell volume) .
Upon breakout, the total volume delta is displayed at the midpoint , providing insight into market sentiment during the consolidation phase.
Filters out weak or short-lived consolidations under 15 bars.
🔵 HOW TO USE
Spot ranging or compression zones with minimal effort.
Use breakouts with volume delta bias to assess the strength or weakness of moves.
Combine with trend-following tools or volume-based confirmation for stronger setups.
Apply to higher timeframes for macro consolidation tracking .
🔵 CONCLUSION
Consolidation Range now brings together volatility filtering and directional volume delta into one smart module. This hybrid logic allows traders to not only identify balance zones but also understand who was in control during the buildup—offering a sharper edge for breakout and trend continuation strategies.
Canuck Trading IndicatorOverview
The Canuck Trading Indicator is a versatile, overlay-based technical analysis tool designed to assist traders in identifying potential trading opportunities across various timeframes and market conditions. By combining multiple technical indicators—such as RSI, Bollinger Bands, EMAs, VWAP, MACD, Stochastic RSI, ADX, HMA, and candlestick patterns—the indicator provides clear visual signals for bullish and bearish entries, breakouts, long-term trends, and options strategies like cash-secured puts, straddles/strangles, iron condors, and short squeezes. It also incorporates 20-day and 200-day SMAs to detect Golden/Death Crosses and price positioning relative to these moving averages. A dynamic table displays key metrics, and customizable alerts help traders stay informed of market conditions.
Key Features
Multi-Timeframe Adaptability: Automatically adjusts parameters (e.g., ATR multiplier, ADX period, HMA length) based on the chart's timeframe (minute, hourly, daily, weekly, monthly) for optimal performance.
Comprehensive Signal Generation: Identifies short-term entries, breakouts, long-term bullish trends, and options strategies using a combination of momentum, trend, volatility, and candlestick patterns.
Candlestick Pattern Detection: Recognizes bullish/bearish engulfing, hammer, shooting star, doji, and strong candles for precise entry/exit signals.
Moving Average Analysis: Plots 20-day and 200-day SMAs, detects Golden/Death Crosses, and evaluates price position relative to these averages.
Dynamic Table: Displays real-time metrics, including zone status (bullish, bearish, neutral), RSI, MACD, Stochastic RSI, short/long-term trends, candlestick patterns, ADX, ROC, VWAP slope, and MA positioning.
Customizable Alerts: Over 20 alert conditions for entries, exits, overbought/oversold warnings, and MA crosses, with actionable messages including ticker, price, and suggested strategies.
Visual Clarity: Uses distinct shapes, colors, and sizes to plot signals (e.g., green triangles for bullish entries, red triangles for bearish entries) and overlays key levels like EMA, VWAP, Bollinger Bands, support/resistance, and HMA.
Options Strategy Signals: Suggests opportunities for selling cash-secured puts, straddles/strangles, iron condors, and capitalizing on short squeezes.
How to Use
Add to Chart: Apply the indicator to any TradingView chart by selecting "Canuck Trading Indicator" from the Pine Script library.
Interpret Signals:
Bullish Signals: Green triangles (short-term entry), lime diamonds (breakout), blue circles (long-term entry).
Bearish Signals: Red triangles (short-term entry), maroon diamonds (breakout).
Options Strategies: Purple squares (cash-secured puts), yellow circles (straddles/strangles), orange crosses (iron condors), white arrows (short squeezes).
Exits: X-cross shapes in corresponding colors indicate exit signals.
Monitor: Gray circles suggest holding cash or monitoring for setups.
Review Table: Check the top-right table for real-time metrics, including zone status, RSI, MACD, trends, and MA positioning.
Set Alerts: Configure alerts for specific signals (e.g., "Short-Term Bullish Entry" or "Golden Cross") to receive notifications via TradingView.
Adjust Inputs: Customize input parameters (e.g., RSI period, EMA length, ATR period) to suit your trading style or market conditions.
Input Parameters
The indicator offers a wide range of customizable inputs to fine-tune its behavior:
RSI Period (default: 14): Length for RSI calculation.
RSI Bullish Low/High (default: 35/70): RSI thresholds for bullish signals.
RSI Bearish High (default: 65): RSI threshold for bearish signals.
EMA Period (default: 15): Main EMA length (15 for day trading, 50 for swing).
Short/Long EMA Length (default: 3/20): For momentum oscillator.
T3 Smoothing Length (default: 5): Smooths momentum signals.
Long-Term EMA/RSI Length (default: 20/15): For long-term trend analysis.
Support/Resistance Lookback (default: 5): Periods for support/resistance levels.
MACD Fast/Slow/Signal (default: 12/26/9): MACD parameters.
Bollinger Bands Period/StdDev (default: 15/2): BB settings.
Stochastic RSI Period/Smoothing (default: 14/3/3): Stochastic RSI settings.
Uptrend/Short-Term/Long-Term Lookback (default: 2/2/5): Candles for trend detection.
ATR Period (default: 14): For volatility and price targets.
VWAP Sensitivity (default: 0.1%): Threshold for VWAP-based signals.
Volume Oscillator Period (default: 14): For volume surge detection.
Pattern Detection Threshold (default: 0.3%): Sensitivity for candlestick patterns.
ROC Period (default: 3): Rate of change for momentum.
VWAP Slope Period (default: 5): For VWAP trend analysis.
TradingView Publishing Compliance
Originality: The Canuck Trading Indicator is an original script, combining multiple technical indicators and custom logic to provide unique trading signals. It does not replicate existing public scripts.
No Guaranteed Profits: This indicator is a tool for technical analysis and does not guarantee profits. Trading involves risks, and users should conduct their own research and risk management.
Clear Instructions: The description and usage guide are detailed and accessible, ensuring users understand how to apply the indicator effectively.
No External Dependencies: The script uses only built-in Pine Script functions (e.g., ta.rsi, ta.ema, ta.vwap) and requires no external libraries or data sources.
Performance: The script is optimized for performance, using efficient calculations and adaptive parameters to minimize lag on various timeframes.
Visual Clarity: Signals are plotted with distinct shapes and colors, and the table provides a concise summary of market conditions, enhancing usability.
Limitations and Risks
Market Conditions: The indicator may generate false signals in choppy or low-liquidity markets. Always confirm signals with additional analysis.
Timeframe Sensitivity: Performance varies by timeframe; test settings on your preferred chart (e.g., 5-minute for day trading, daily for swing trading).
Risk Management: Use stop-losses and position sizing to manage risk, as suggested in alert messages (e.g., "Stop -20%").
Options Trading: Options strategies (e.g., straddles, iron condors) carry unique risks; consult a financial advisor before trading.
Feedback and Support
For questions, suggestions, or bug reports, please leave a comment on the TradingView script page or contact the author via TradingView. Your feedback helps improve the indicator for the community.
Disclaimer
The Canuck Trading Indicator is provided for educational and informational purposes only. It is not financial advice. Trading involves significant risks, and past performance is not indicative of future results. Always perform your own due diligence and consult a qualified financial advisor before making trading decisions.

Elliott Wave Noise FilterElliott Wave Noise Filter
Overview
The Elliott Wave Noise Filter is a specialized indicator for TradingView, designed to solve one of the biggest challenges in Elliott Wave analysis on lower timeframes: the identification of market noise. By combining multiple advanced filtering techniques, this indicator helps distinguish meaningful price action from random fluctuations.
The Problem
On lower timeframes—especially below 15 minutes—Elliott Wave analysis is significantly impacted by excessive market noise. This noise can lead to misinterpretation of wave structures, making it difficult to execute reliable trading decisions.
The Solution
The Elliott Wave Noise Filter utilizes four powerful methods to detect and filter noise:
ATR-Based Volatility Analysis: Identifies price movements too small to be structurally meaningful
Volume Confirmation: Filters out price moves that occur with insufficient volume
Trend Strength Measurement (ADX): Detects periods of weak trend activity, where noise tends to dominate
Fractal Pattern Recognition: Marks significant turning points that could be relevant for Elliott Wave analysis
Features
Visual Indicators
Background Coloring: Red indicates noise; green signifies a clear signal
Hull Moving Average: Smooths price action and highlights the prevailing trend
Fractal Markers: Triangles mark significant highs and lows
Status Panel: Displays current noise status and ADX value
Customization Options
ATR Period: Adjust the lookback period for ATR calculations
Noise Threshold: Defines the percentage of ATR below which a movement is considered noise
Volume Filter: Can be enabled or disabled
Volume Threshold: Sets the ratio to average volume for a move to be deemed significant
Hull MA Display and Length: Configure the moving average settings
ADX Parameters: Adjust trend strength sensitivity
Use Cases
For Elliott Wave Analysis
Eliminate noise to identify cleaner wave structures
Use fractal markers as potential wave endpoints
Reference the Hull MA for determining the broader trend
For General Trading
Identify high-noise periods to avoid low-quality setups
Spot clearer market phases for better entries
Assess price action quality through visual cues
Multi-Timeframe Approach
Apply the indicator across different timeframes for a comprehensive view
Prefer trading when both higher and lower timeframes align with consistent signals
Optimal Settings
For Very Short Timeframes (1–5 minutes)
Higher Noise Threshold (0.4–0.5)
Longer ATR Period (20–30)
Higher Volume Threshold (1.0–1.2)
For Medium Timeframes (15–60 minutes)
Medium Noise Threshold (0.2–0.3)
Standard ATR Period (14)
Standard Volume Threshold (0.8)
For Higher Timeframes (4h and above)
Lower Noise Threshold (0.1–0.2)
Shorter ATR Period (10)
Lower Volume Threshold (0.6–0.7)
Conclusion
The Elliott Wave Noise Filter is an essential tool for any Elliott Wave analyst or trader working on lower timeframes. By reducing noise and emphasizing significant market movements, it enables more precise analysis and potentially more profitable trading decisions.
Note: As with any technical indicator, the Elliott Wave Noise Filter should be used as part of a broader trading strategy and not as a standalone signal for trade execution.

MLExtensions_CoreLibrary "MLExtensions_Core"
A set of extension methods for a novel implementation of a Approximate Nearest Neighbors (ANN) algorithm in Lorentzian space, focused on computation.
normalizeDeriv(src, quadraticMeanLength)
Returns the smoothed hyperbolic tangent of the input series.
Parameters:
src (float) : The input series (i.e., the first-order derivative for price).
quadraticMeanLength (int) : The length of the quadratic mean (RMS).
Returns: nDeriv The normalized derivative of the input series.
normalize(src, min, max)
Rescales a source value with an unbounded range to a target range.
Parameters:
src (float) : The input series
min (float) : The minimum value of the unbounded range
max (float) : The maximum value of the unbounded range
Returns: The normalized series
rescale(src, oldMin, oldMax, newMin, newMax)
Rescales a source value with a bounded range to anther bounded range
Parameters:
src (float) : The input series
oldMin (float) : The minimum value of the range to rescale from
oldMax (float) : The maximum value of the range to rescale from
newMin (float) : The minimum value of the range to rescale to
newMax (float) : The maximum value of the range to rescale to
Returns: The rescaled series
getColorShades(color)
Creates an array of colors with varying shades of the input color
Parameters:
color (color) : The color to create shades of
Returns: An array of colors with varying shades of the input color
getPredictionColor(prediction, neighborsCount, shadesArr)
Determines the color shade based on prediction percentile
Parameters:
prediction (float) : Value of the prediction
neighborsCount (int) : The number of neighbors used in a nearest neighbors classification
shadesArr (array) : An array of colors with varying shades of the input color
Returns: shade Color shade based on prediction percentile
color_green(prediction)
Assigns varying shades of the color green based on the KNN classification
Parameters:
prediction (float) : Value (int|float) of the prediction
Returns: color
color_red(prediction)
Assigns varying shades of the color red based on the KNN classification
Parameters:
prediction (float) : Value of the prediction
Returns: color
tanh(src)
Returns the the hyperbolic tangent of the input series. The sigmoid-like hyperbolic tangent function is used to compress the input to a value between -1 and 1.
Parameters:
src (float) : The input series (i.e., the normalized derivative).
Returns: tanh The hyperbolic tangent of the input series.
dualPoleFilter(src, lookback)
Returns the smoothed hyperbolic tangent of the input series.
Parameters:
src (float) : The input series (i.e., the hyperbolic tangent).
lookback (int) : The lookback window for the smoothing.
Returns: filter The smoothed hyperbolic tangent of the input series.
tanhTransform(src, smoothingFrequency, quadraticMeanLength)
Returns the tanh transform of the input series.
Parameters:
src (float) : The input series (i.e., the result of the tanh calculation).
smoothingFrequency (int)
quadraticMeanLength (int)
Returns: signal The smoothed hyperbolic tangent transform of the input series.
n_rsi(src, n1, n2)
Returns the normalized RSI ideal for use in ML algorithms.
Parameters:
src (float) : The input series (i.e., the result of the RSI calculation).
n1 (simple int) : The length of the RSI.
n2 (simple int) : The smoothing length of the RSI.
Returns: signal The normalized RSI.
n_cci(src, n1, n2)
Returns the normalized CCI ideal for use in ML algorithms.
Parameters:
src (float) : The input series (i.e., the result of the CCI calculation).
n1 (simple int) : The length of the CCI.
n2 (simple int) : The smoothing length of the CCI.
Returns: signal The normalized CCI.
n_wt(src, n1, n2)
Returns the normalized WaveTrend Classic series ideal for use in ML algorithms.
Parameters:
src (float) : The input series (i.e., the result of the WaveTrend Classic calculation).
n1 (simple int)
n2 (simple int)
Returns: signal The normalized WaveTrend Classic series.
n_adx(highSrc, lowSrc, closeSrc, n1)
Returns the normalized ADX ideal for use in ML algorithms.
Parameters:
highSrc (float) : The input series for the high price.
lowSrc (float) : The input series for the low price.
closeSrc (float) : The input series for the close price.
n1 (simple int) : The length of the ADX.
regime_filter(src, threshold, useRegimeFilter)
Parameters:
src (float)
threshold (float)
useRegimeFilter (bool)
filter_adx(src, length, adxThreshold, useAdxFilter)
filter_adx
Parameters:
src (float) : The source series.
length (simple int) : The length of the ADX.
adxThreshold (int) : The ADX threshold.
useAdxFilter (bool) : Whether to use the ADX filter.
Returns: The ADX.
filter_volatility(minLength, maxLength, sensitivityMultiplier, useVolatilityFilter)
filter_volatility
Parameters:
minLength (simple int) : The minimum length of the ATR.
maxLength (simple int) : The maximum length of the ATR.
sensitivityMultiplier (float) : Multiplier for the historical ATR to control sensitivity.
useVolatilityFilter (bool) : Whether to use the volatility filter.
Returns: Boolean indicating whether or not to let the signal pass through the filter.

Gradient Range [BigBeluga]
This indicator highlights range-bound market conditions by dynamically plotting gradient-colored candlesticks within a defined price box. It detects whether the market is ranging or trending using ADX and can identify mean reversion points when price steps outside the established range.
🔵KEY FEATURES:
Range Detection Box:
➣ A transparent box is drawn based on the highest and lowest price close over a user-defined period.
➣ Helps visualize range boundaries and the midline for support/resistance reference.
Gradient Candlestick Coloring:
➣ Candles inside the range are colored with a gradient from top to bottom based on proximity to the midline.
➣ Top range candles are shaded with bearish tones, while bottom range candles use bullish tones.
Ranging/Trending State Detection:
➣ Uses ADX to determine if the market is currently in a ranging or trending state.
➣ A label in the bottom right corner shows a real-time status (🟢 Ranging / 🟡 Trending).
Mean Reversion Signal Circles:
➣ When the market is ranging, white circles are plotted at highs/lows that breach the box boundary, indicating potential mean reversion points.
➣ These levels can act as fade trade setups or exhaustion markers.
🔵USAGE:
Range Trading: Trade between the upper and lower boundaries during range-bound conditions with clearer visual feedback.
Mean Reversion Plays: Use circle signals as early alerts to identify when price extends beyond the range and may revert to the mean.
Visual Trend Strength: Instantly recognize where price is concentrated inside the range via the color gradient system.
Ranging Filter: Use the ADX label to avoid false setups during strong trending periods.
Gradient Range provides an elegant and data-driven approach to range-bound market analysis. With its gradient visualization and smart reversion detection, it empowers traders to better time entries and exits within consolidation zones.

Pro Scalper AI [BullByte]The Pro Scalper AI is a powerful, multi-faceted scalping indicator designed to assist active traders in identifying short-term trading opportunities with precision. By combining trend analysis, momentum indicators, dynamic weighting, and optional AI forecasting, this tool provides both immediate and latched trading signals based on confirmed (closed bar) data—helping to avoid repainting issues. Its flexible design includes customizable filters such as a higher timeframe trend filter, and adjustable settings for ADX, ATR, and Hull Moving Average (HMA), giving traders the ability to fine-tune the strategy to different markets and timeframes.
Key Features :
- Confirmed Data Processing :
Utilizes a helper function to lock in price and volume data only from confirmed (closed) bars, ensuring the reliability of signals without the risk of intrabar repainting.
- Trend Analysis :
Employs ADX and Directional Movement (DI) calculations along with a locally computed HMA to detect short-term trends. An optional higher timeframe trend filter can further refine the analysis.
- Flexible Momentum Modes :
Choose between three momentum calculation methods—Stochastic RSI, Fisher RSI, or Williams %R—to match your preferred style of analysis. This versatility allows you to optimize the indicator for different market conditions.
- Dynamic Weighting & Volatility Adjustments :
Adjusts the contribution of trend, momentum, volatility, and volume through dynamic weighting. This ensures that the indicator responds appropriately to varying market conditions by scaling its sensitivity with user-defined maximum factors.
- Optional AI Forecast :
For those who want an extra edge, the built-in AI forecasting module uses linear regression to predict future price moves and adjusts oscillator thresholds accordingly. This feature can be toggled on or off, with smoothing options available for more stable output.
- Latching Mode for Signal Persistenc e:
The script features a latching mechanism that holds signals until a clear reversal is detected, preventing whipsaws and providing more reliable trade entries and exits.
- Comprehensive Visualizations & Dashboard :
- Composite Oscillator & Dynamic Thresholds : The oscillator is plotted with dynamic upper and lower thresholds, and the area between them is filled with a color that reflects the active trading signal (e.g., Strong Buy, Early Sell).
- Signal Markers : Both immediate (non-latching) and stored (latched) signals are marked on the chart with distinct shapes (circles, crosses, triangles, and diamonds) to differentiate between signal types.
- Real-Time Dashboard : A customizable dashboard table displays key metrics including ADX, oscillator value, chosen momentum mode, HMA trend, higher timeframe trend, volume factor, AI bias (if enabled), and more, allowing traders to quickly assess market conditions at a glance.
How to Use :
1. S ignal Interpretation :
- Immediate Signals : For traders who prefer quick entries, the indicator displays immediate signals such as “Strong Buy” or “Early Sell” based on the current market snapshot.
- Latched Signals : When latching is enabled, the indicator holds a signal state until a clear reversal is confirmed, offering sustained trade setups.
2. Trend Confirmation :
- Use the HMA trend indicator and the optional higher timeframe trend filter to confirm the prevailing market direction before acting on signals.
3. Dynamic Thresholds & AI Forecasting :
- Monitor the dynamically adjusted oscillator thresholds and, if enabled, the AI bias to gauge potential shifts in market momentum.
4. Risk Management :
- Combine these signals with additional analysis and sound risk management practices to determine optimal entry and exit points for scalping trades.
Disclaimer :
This script is provided for educational and informational purposes only and does not constitute financial advice. Trading involves risk, and past performance is not indicative of future results. Always perform your own analysis and use proper risk management strategies before trading.

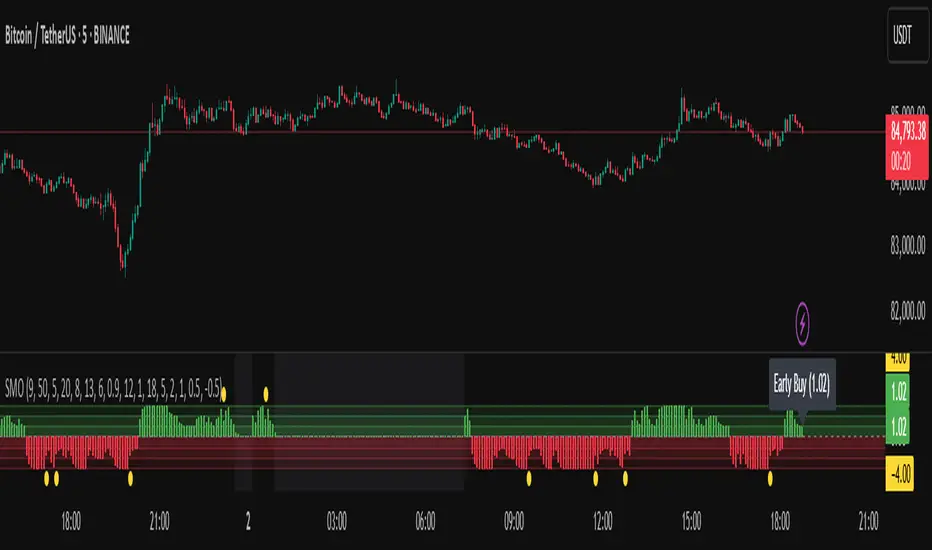
Sentiment Master Oscillator[BullByte]
The Sentiment Master Oscillator is a modern market sentiment indicator designed for traders seeking to identify early trend shifts and potential reversals with clarity. This oscillator combines multiple technical tools—RSI, MACD, EMAs, ADX, ATR, and volume filters—to deliver layered signals that help you assess market momentum in a clear and simplified manner.
Key Features:
- Multi-Indicator Approach :
Integrates RSI (with a smoothing function), MACD, and two EMAs to gauge momentum and trend direction. The oscillator also includes ADX and ATR filters to ensure that only markets with sufficient directional strength and volatility generate signals.
- Dynamic Signal Zones :
The oscillator produces a raw value ranging roughly from -3 to +3 (adjustable via a scaling factor). Positive readings suggest bullish conditions, while negative readings indicate bearish trends. Visual zones (Early, Confirmed, Strong) are clearly marked with color-coded horizontal lines to help you interpret the strength of the signal at a glance.
- Adaptive Smoothing :
For those who prefer quicker, more responsive signals (ideal for scalping), an adaptive smoothing option is available. When enabled, it applies a shorter smoothing period to the oscillator; otherwise, a more conservative base period is used.
- Reversal Alerts :
Yellow dots are plotted on the chart to highlight potential reversal points. These alerts are triggered when the oscillator crosses specific thresholds, coupled with volume and ATR conditions, signaling that a top or bottom may be forming.
- Customizable Filters :
- ATR Filter :Ensures that the market's volatility is above a set threshold before signaling.
- ADX Filter :Confirms sufficient trend strength.
- Volume Filter : Requires that trading volume surges above a multiple of its simple moving average, filtering out low-volume noise.
- Clear Signal Messaging :
Based on the combined signals from various indicators, the script categorizes market sentiment into actionable messages such as "Early Buy", "Confirmed Buy", "Strong Buy", "Early Sell", "Confirmed Sell", and "Strong Sell". A "Grey Zone" label is used when the oscillator is near neutral, indicating that no clear trend is present.
How to Use :
1. Entry and Exit Decisions : Use the different signal stages (Early, Confirmed, Strong) as guides for your entries and exits.
2. Trend Confirmation : Rely on the multi-indicator setup for added confirmation of prevailing market conditions before executing trades.
3. Reversal Cues : Pay attention to the reversal dots for potential turning points in the market, which can be used to adjust positions or initiate trades.
Disclaimer:
This indicator is intended for educational and informational purposes only. It should not be taken as financial advice. Always use appropriate risk management and combine it with your analysis before making any trading decisions. Past performance is not indicative of future results.
By adhering to TradingView's publishing guidelines, the BullByte Sentiment Master is designed to provide transparency, simplicity, and robust analysis tools to enhance your trading strategy. Enjoy a clearer view of market sentiment and make more informed trading decisions!
Dynamic Trend Indicator (DTI) - VWAP FilterThe Dynamic Trend Indicator (DTI) with VWAP Filter is a trend-following indicator.
It aims to identify and follow market trends while minimizing false signals in choppy or ranging markets.
The DTI combines a dynamically adjusted Exponential Moving Average (EMA) with a daily Volume Weighted Average Price (VWAP) confirmation filter and a cooldown mechanism to enhance signal reliability. This indicator is particularly useful for traders on intraday timeframes (e.g., 4-hour charts) who want to align their trades with the broader daily trend while avoiding whipsaws.
Key Features:
Dynamic Trend Line:
The core of the DTI is a trend line calculated using a custom EMA that adjusts its period dynamically based on market conditions.
The period of the EMA is determined by a combination of volatility (measured via ATR) and trend strength (measured via price momentum). In strong trends, the period shortens for faster responsiveness; in weak or ranging markets, it lengthens to reduce noise.
An optional smoothing EMA can be applied to the dynamic trend line to further reduce noise, with a user-defined smoothing length.
Daily VWAP Confirmation Filter:
A daily VWAP is calculated to provide a higher-timeframe trend bias. VWAP represents the average price paid for an asset during the day, weighted by volume, and is often used as a benchmark by institutional traders.
Buy signals are only generated when the price is above the daily VWAP (indicating a bullish daily bias), and sell signals are only generated when the price is below the VWAP (indicating a bearish daily bias).
The VWAP resets at the start of each day, ensuring it reflects the current day’s trading activity.
Cooldown Mechanism:
To prevent rapid signal reversals (whipsaws), the indicator includes a cooldown period between signals. After a buy or sell signal is generated, no new signals can be generated for a user-defined number of bars (default: 5 bars).
This helps filter out noise in choppy markets, ensuring signals are spaced out and more likely to align with significant trend changes.
Visual Elements:
Trend Line: Plotted on the chart, colored green when the price is above (uptrend) and red when below (downtrend). A gray color indicates a neutral trend.
Buy/Sell Signals: Displayed as green triangles below the bar for buy signals and red triangles above the bar for sell signals.
Background Coloring: The chart background is shaded green during uptrends and red during downtrends, providing a quick visual cue of the trend direction.
Daily VWAP Line: Optionally plotted as a purple step line, allowing traders to see the VWAP level and its relationship to the price.
Alerts:
The indicator includes built-in alerts for buy and sell signals, triggered when the price crosses the trend line and satisfies the VWAP filter and cooldown conditions.
Alert messages specify whether the signal is a buy or sell and confirm that the VWAP condition was met (e.g., "DTI Buy Signal: Price crossed above trend line and VWAP").
Input Parameters
Base Length (default: 14): The base period for calculating volatility and trend strength, used to adjust the dynamic EMA period.
Volatility Multiplier (default: 1.5): Adjusts the sensitivity of the dynamic period to market volatility (via ATR).
Trend Threshold (default: 0.5): Controls the sensitivity of the dynamic period to trend strength (via price momentum).
Use Smoothing (default: true): Enables/disables smoothing of the trend line with an additional EMA.
Smoothing Length (default: 3): The period for the smoothing EMA, if enabled.
Cooldown Bars (default: 5): The minimum number of bars between consecutive signals, reducing signal frequency in choppy markets.
Show Daily VWAP (default: true): Toggles the display of the daily VWAP line on the chart.
How It Works
Dynamic Trend Line Calculation:
Volatility is measured using the Average True Range (ATR) over the base length, scaled by the volatility multiplier.
Trend strength is calculated as the absolute price momentum (change in price over the base length) divided by the volatility factor.
The dynamic EMA period is adjusted based on the trend strength: stronger trends result in a shorter period (faster response), while weaker trends result in a longer period (more stability). The period is constrained between 5 and 50 to avoid extreme values.
A custom EMA function is used to handle the dynamic period, as Pine Script’s built-in ta.ema() requires a fixed length. The trend line is optionally smoothed with a secondary EMA.
Signal Generation:
A buy signal is generated when the price crosses above the trend line, the price is above the daily VWAP, and the cooldown period has elapsed.
A sell signal is generated when the price crosses below the trend line, the price is below the daily VWAP, and the cooldown period has elapsed.
The cooldown mechanism ensures that signals are not generated too frequently, reducing false signals in ranging markets.
Daily VWAP Calculation:
The VWAP is calculated by accumulating the price-volume product (close * volume) and total volume for the day, resetting at the start of each new day.
The VWAP is then computed as the cumulative price-volume divided by the cumulative volume, providing a volume-weighted average price for the day.
Usage
Timeframe: Best suited for intraday timeframes (e.g., 1-hour, 4-hour) where the daily VWAP provides a higher-timeframe trend bias. It can also be used on daily charts with adjustments to the cooldown period.
Markets: Works well in trending markets (e.g., forex, crypto, stocks) where the dynamic trend line can capture sustained price movements. The VWAP filter helps align signals with the daily trend, making it effective for assets with clear daily biases.
Trading Strategy:
Buy: Enter a long position when a green triangle (buy signal) appears, indicating the price has crossed above the trend line and is above the daily VWAP.
Sell: Enter a short position (or exit a long) when a red triangle (sell signal) appears, indicating the price has crossed below the trend line and is below the daily VWAP.
Use the trend line and VWAP as dynamic support/resistance levels to set stop-losses or take-profit targets.
Backtesting: Use TradingView’s strategy tester to evaluate the indicator’s performance on your chosen market and timeframe, adjusting parameters like cooldown_bars and volatility_mult to optimize for profitability.
Example
On a 4-hour SOLUSDT chart, the DTI with VWAP Filter might show:
An uptrend with the price above the green trend line and above the daily VWAP, generating buy signals as the price continues to rise.
A downtrend where the price falls below the red trend line and the daily VWAP, generating sell signals that align with the bearish daily bias.
During choppy periods, the cooldown mechanism and VWAP filter reduce false signals, ensuring trades are taken only when the price aligns with the daily trend.
Limitations
Lagging Nature: Like all trend-following indicators, the DTI may lag during sharp price reversals, as the dynamic EMA needs time to adjust.
Ranging Markets: While the VWAP filter and cooldown mechanism reduce whipsaws, the indicator may still generate some false signals in strongly ranging markets. Combining it with a trend strength filter (e.g., ADX) can help.
VWAP Dependency: The effectiveness of the VWAP filter depends on the market’s respect for the daily VWAP as a support/resistance level. In markets with low volume or erratic price action, the VWAP may be less reliable.
Potential Improvements
VWAP Buffer: Add a percentage buffer around the VWAP (e.g., require the price to be 1% above/below) to further reduce noise.
Multi-Timeframe VWAP: Incorporate a weekly VWAP for additional trend confirmation on longer timeframes.
Trend Strength Filter: Add an ADX filter to ensure signals are generated only during strong trends (e.g., ADX > 25).

Impulse MACD enhancedThis indicator is designed to provide robust trade entry signals by combining multiple technical filters. Here’s a summary of its key components:
Impulse MACD Calculation:
Uses a Zero-Lag EMA (ZLEMA) based approach to generate a momentum indicator (with a signal line and histogram) that identifies shifts in market momentum.
Simulated Higher Timeframe (HTF) Trend Filter:
Computes an SMA over a multiplied period to simulate a higher timeframe trend. It requires the price to be in line with this broader trend before signaling an entry.
RSI Filter:
Ensures that for bullish entries the RSI is above a set threshold (indicating momentum) and for bearish entries it’s below a threshold.
ADX Filter:
Uses a manually calculated ADX to confirm that the market is in a strong trend (ADX > 30) to reduce false signals in weakly trending or sideways markets.
Volume Filter:
Compares the current volume to a 20‑bar SMA of volume, requiring volume to be significantly higher (by a user-defined percentage) to confirm the strength of the move.
VWAP Confirmation:
Uses the Volume-Weighted Average Price as an extra layer of confirmation: bullish signals require the price to be above VWAP, bearish signals below.
Optional Long-Term & Short-Term MA Filters:
These filters can be enabled to ensure the price is trading above (or below) longer-term and shorter-term moving averages, further aligning the trade with the prevailing trend.
ATR Volatility Filter:
Checks that volatility (as measured by the ATR relative to price) is below a maximum threshold, which helps avoid taking trades in overly volatile conditions.
Price Action Filter:
Ensures that for a bullish signal the current close is above the highest high over a specified lookback period (and vice versa for bearish), indicating a clear breakout.
Signal Throttling:
Signals are limited to one every 10 bars to prevent excessive trading.
When all these conditions are met, the indicator outputs an entry signal for either a bullish or bearish trade.
This multi-filter approach aims to increase win rate by reducing false signals and aligning trades with strong, confirmed trends while filtering out noise.

[MAD] Weighted Trend Detector--> Purpose
The Weighted Trend Detector evaluates market direction by combining multiple technical indicators (RSI, MACD, Moving Averages, ADX, and Volume) across up to three different timeframes.
It calculates an overall trend score to help visualize whether conditions are bullish, bearish, or neutral.
--> Scaling & Weightings
Each component indicator contributes a score between -1.0 and +1.0. User-defined weights (e.g., 0.2 for RSI, 0.3 for MACD) determine how much each indicator influences the final score. An adaptive scaling mechanism ensures extreme values remain in view by dynamically setting the minimum and maximum of the score range over a specified lookback period.
--> Basic Parameters of Individual Indicators
RSI Period: Number of bars for the Relative Strength Index calculation; higher values smooth out noise but may lag.
MACD Fast/Slow/Signal: EMA-based periods to identify momentum shifts. A shorter “Fast” length reacts quickly, while a longer “Slow” length is smoother.
Moving Averages (Short & Long Lengths): Simple Moving Averages used to gauge shorter- vs. longer-term price direction.
ADX Length: Defines how many bars are considered when measuring trend strength. Higher values produce smoother ADX lines.
Volume MA Length: Period over which the average volume is calculated to compare against current volume.
--> Colors & How They Are Mixed
The background color scales from a negative color (for lower scores) to a positive color (for higher scores).
Near the highest or lowest parts of the score range, additional blending occurs if the slope (change in score) reverses:
Turning Down: Mixes with a user-chosen “warning” color if the score is high but moving lower.
Turning Up: Mixes with a user-chosen “recovery” color if the score is low but moving higher.
All colors (including line and label text) can be adjusted in the script’s inputs to suit personal preferences.colors are customizable via inputs.
Have fun :-)

DIN: Dynamic Trend NavigatorDIN: Dynamic Trend Navigator
Overview
The Dynamic Trend Navigator script is designed to help traders identify and capitalize on market trends using a combination of Weighted Moving Averages (WMA), Volume Weighted Average Price (VWAP), and Anchored VWAP (AVWAP). The script provides customizable settings and flexible alerts for various crossover conditions, enhancing its utility for different trading strategies.
Key Features
- **1st and 2nd WMA**: Allows users to set and visualize two Weighted Moving Averages. These can be customized to any period, providing flexibility in trend identification.
- **VWAP and AVWAP**: Incorporates both VWAP and AVWAP, offering insights into price levels adjusted by volume.
- **ATR and ADX Indicators**: Includes the Average True Range (ATR) and Average Directional Index (ADX) to help assess market volatility and trend strength.
- **Flexible Alerts**: Configurable buy and sell alerts for any crossover condition, making it versatile for various trading strategies.
How to Use the Script
1. **Set the WMA Periods**: Customize the periods for the 1st and 2nd WMAs to suit your trading strategy.
2. **Enable VWAP and AVWAP**: Choose whether to include VWAP and AVWAP in your analysis by enabling the respective settings.
3. **Configure Alerts**: Set up alerts for the desired crossover conditions (WMA, VWAP, AVWAP) to receive notifications for potential trading opportunities.
4. **Monitor Signals**: Watch for buy and sell signals indicated by triangle shapes on the chart, which appear at the selected crossover points.
When to Use
- **Best Time to Use**: The script is most effective in trending markets where price movements are well-defined. It helps traders stay on the right side of the trend and avoid false signals during periods of low volatility.
- **When Not to Use**: Avoid using the script in choppy or sideways markets where price action lacks direction. The script may generate false signals in such conditions, leading to potential losses.
Benefits of VWAP and AVWAP
- **VWAP**: The Volume Weighted Average Price provides a price benchmark that adjusts for volume, helping traders identify fair value levels. It is particularly useful for intraday trading and gauging market sentiment.
- **AVWAP**: The Anchored VWAP allows traders to set a starting point for VWAP calculations, providing flexibility in analyzing price levels over specific periods or events. This helps in identifying key support and resistance levels based on volume.
Unique Aspects
- **Customizability**: The script offers extensive customization options for WMA periods, VWAP, AVWAP, and alert conditions, making it adaptable to various trading strategies.
- **Combining Indicators**: By integrating WMAs, VWAP, AVWAP, ATR, and ADX, the script provides a comprehensive view of market conditions, enhancing decision-making.
- **Real-Time Alerts**: The flexible alert system ensures traders receive timely notifications for potential trade setups, improving responsiveness to market changes.
Examples
- **Example 1**: A trader sets the 1st WMA to 8 and the 2nd WMA to 100, enabling the VWAP. When the 1st WMA crosses above the 2nd WMA or VWAP, a buy signal is triggered, indicating a potential long entry.
- **Example 2**: A trader sets the AVWAP to start 30 bars ago and monitors for crossovers with the 1st WMA. When the 1st WMA crosses below the AVWAP, a sell signal is triggered, suggesting a potential short entry.
Final Notes
The Dynamic Trend Navigator script is a powerful tool for traders looking to enhance their market analysis and trading decisions. Its unique combination of customizable indicators and flexible alert system sets it apart from other scripts, making it a valuable addition to any trader's toolkit.
Disclaimer: Never any financial advice. Just ThisGirl loving experimenting with indicators to help myself, as well as others.

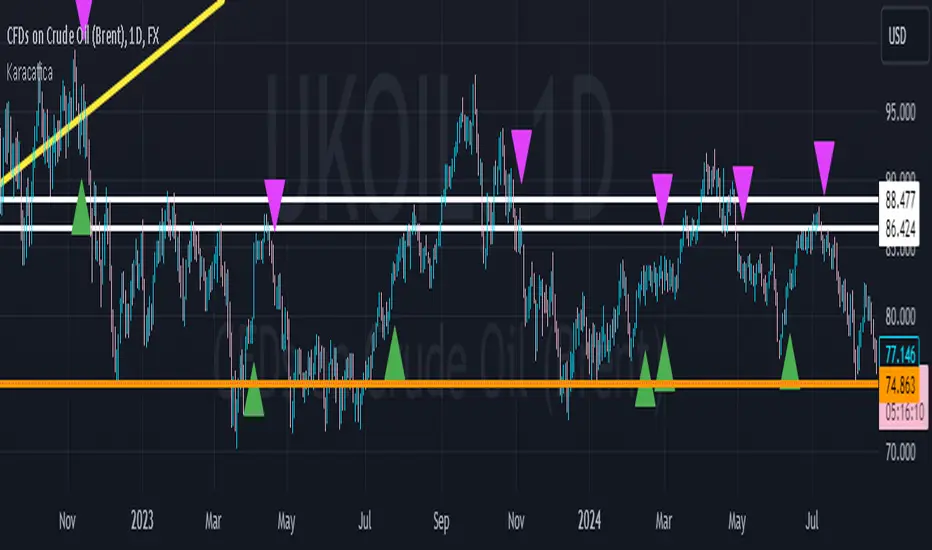
KaracaticaKaracatica Indicator - Dynamic Trend Following.
The Karacatica Indicator is designed for traders looking for a comprehensive approach to trend trading by combining directional movements and Average True Range (ATR).
Key Features: ATR-Based Trend Detection: The indicator uses Average True Range (ATR) to measure market volatility and integrates with price action to capture strong trend movements.
Directional Indicators (DI's): Calculates DI's (Positive Directional Index Di+ and Negative Directional Index Di-) to compare buying and selling pressure. This allows for more accurate trend identification, highlighting when buyers or sellers dominate.
Signal Generation: Buy Signal: Generated when price action is bullish (close is above the previous period's close) and DI+ exceeds DI-, indicating that buyers are in control.
Sell Signal: Triggered when price action is bearish (close is below the previous period’s close) and DI- exceeds DI+, showing that sellers dominate the market.
Visual Signals: Green triangle (▲) indicating a buy opportunity, plotted below the bar.
Fuchsia triangle (▼) signaling a sell opportunity, plotted above the bar.
Customizable Inputs: The indicator allows users to adjust the ATR period, DI length, and ADX smoothing parameters, giving it the flexibility to suit different trading styles and timeframes.
Why should you use it?
This indicator simplifies the process of analyzing the combination market direction and trend strength. It is especially useful for traders who like strong directional movements and want clear, visually represented entry signals. The Karacatica Indicator can generate good buy or sell signals in trading and can be used on multiple assets and timeframes, making it adaptable to different market conditions.
Settings Overview: ATR Period: Sets the period for calculating ATR, used to determine market volatility.
DI Length: The length of the lookback period for DI+ and DI- calculations.
ADX Smoothing: Smooths the ADX (Average Directional Index) to reduce noise.
Feel free to experiment with this indicator, share feedback, and adapt it to your trading strategy. Good trading!
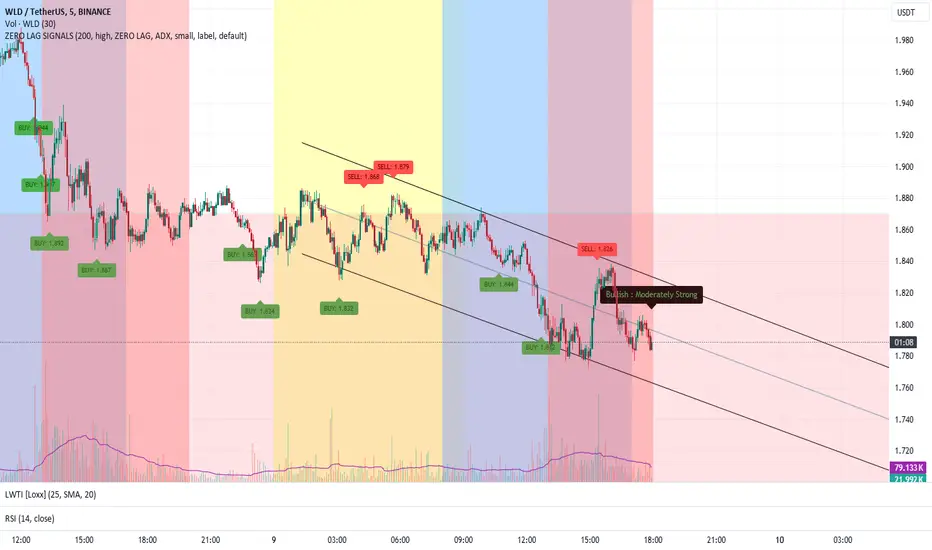
ZERO LAG TRADE SIGNALS by BootcampZeroThe ZERO LAG TRADE SIGNALS by BootcampZero indicator is a versatile tool designed to help traders identify optimal entry and exit points for both short-term scalping and long-term trading across multiple time frames. It combines several well-known technical analysis methods, including moving averages, trend analysis, directional indicators, and adaptive trend calculations, to deliver reliable buy and sell signals.
Short-Term Scalping (Under 5-Minute Time Frames)
For short-term traders who prefer quick trades on lower time frames, such as under 5 minutes, this indicator uses a combination of the EMA (Exponential Moving Average) and SMA (Simple Moving Average) to spot fast trend reversals. The indicator is particularly useful for scalpers because it focuses on detecting short-term price momentum by comparing the faster-moving averages with slower ones, triggering signals based on their crossover.
Buy Signals are generated when a fast-moving EMA crosses above a slower-moving SMA, indicating upward momentum.
Sell Signals are triggered when the fast-moving EMA crosses below the slower-moving SMA, signaling potential downward price movement.
In addition, the Adaptive Trend Finder feature dynamically adjusts to recent price deviations and volatility, making it easier for scalpers to spot the prevailing short-term trend with high confidence. The indicator also uses ADX (Average Directional Index) for momentum confirmation, ensuring that signals are only generated during strong price trends, reducing false positives in sideways markets.
Long-Term Trading (Above 1-Day Charts)
When applied to higher time frames such as daily charts or above, this indicator excels in generating reliable long-term buy and sell signals, perfect for swing traders and long-term investors. The Kaufman Adaptive Moving Average (KAMA) and the Ichimoku Cloud are used to assess long-term trends by filtering out market noise and focusing on sustainable price direction.
KAMA helps to adapt the moving average based on market volatility, providing smoother signals that minimize whipsawing in longer-term trades.
Ichimoku Cloud provides additional trend confirmation by identifying whether the market is bullish or bearish based on the relationship between key lines like the Tenkan-Sen (Conversion Line) and Kijun-Sen (Base Line), and how the current price interacts with the Ichimoku Cloud itself.
The indicator also integrates PPO (Percentage Price Oscillator) to capture divergences between price and momentum, further supporting traders in holding positions for extended periods when the signal strength is robust.
Key Technical Values and Factors for Signals
EMA and SMA Crossover: Fast EMA vs. Slow SMA to detect short-term trend reversals.
ADX: Helps gauge the strength of the trend; signals are only generated in trending markets.
KAMA: Filters noise in long-term trends, providing smooth signals based on market volatility.
Ichimoku Cloud: Offers insight into long-term trends and momentum by analyzing price relative to the cloud.
PPO: Detects divergences between price and momentum for trend continuation or reversal signals.
How It Works
Buy signals are generated when bullish conditions are met, and the indicator confirms momentum with ADX, crossover of the EMAs, or a bullish breakout from the Ichimoku Cloud.
Sell signals are triggered when bearish conditions prevail, confirmed by the same factors in reverse, such as a bearish EMA crossover or weakness in ADX.
By combining these powerful tools, ZERO LAG TRADE SIGNALS by BootcampZero offers traders a comprehensive system for both quick scalping trades and more conservative long-term positioning, providing reliable and adaptive signals across different market conditions.
Six PillarsGeneral Overview
The "Six Pillars" indicator is a comprehensive trading tool that combines six different technical analysis methods to provide a holistic view of market conditions.
These six pillars are:
Trend
Momentum
Directional Movement (DM)
Stochastic
Fractal
On-Balance Volume (OBV)
The indicator calculates the state of each pillar and presents them in an easy-to-read table format. It also compares the current timeframe with a user-defined comparison timeframe to offer a multi-timeframe analysis.
A key feature of this indicator is the Confluence Strength meter. This unique metric quantifies the overall agreement between the six pillars across both timeframes, providing a score out of 100. A higher score indicates stronger agreement among the pillars, suggesting a more reliable trading signal.
I also included a visual cue in the form of candle coloring. When all six pillars agree on a bullish or bearish direction, the candle is colored green or red, respectively. This feature allows traders to quickly identify potential high-probability trade setups.
The Six Pillars indicator is designed to work across multiple timeframes, offering a comparison between the current timeframe and a user-defined comparison timeframe. This multi-timeframe analysis provides traders with a more comprehensive understanding of market dynamics.
Origin and Inspiration
The Six Pillars indicator was inspired by the work of Dr. Barry Burns, author of "Trend Trading for Dummies" and his concept of "5 energies." (Trend, Momentum, Cycle, Support/Resistance, Scale) I was intrigued by Dr. Burns' approach to analyzing market dynamics and decided to put my own twist upon his ideas.
Comparing the Six Pillars to Dr. Burns' 5 energies, you'll notice I kept Trend and Momentum, but I swapped out Cycle, Support/Resistance, and Scale for Directional Movement, Stochastic, Fractal, and On-Balance Volume. These changes give you a more dynamic view of market strength, potential reversals, and volume confirmation all in one package.
What Makes This Indicator Unique
The standout feature of the Six Pillars indicator is its Confluence Strength meter. This feature calculates the overall agreement between the six pillars, providing traders with a clear, numerical representation of signal strength.
The strength is calculated by considering the state of each pillar in both the current and comparison timeframes, resulting in a score out of 100.
Here's how it calculates the strength:
It considers the state of each pillar in both the current timeframe and the comparison timeframe.
For each pillar, the absolute value of its state is taken. This means that both strongly bullish (2) and strongly bearish (-2) states contribute equally to the strength.
The absolute values for all six pillars are summed up for both timeframes, resulting in two sums: current_sum and alternate_sum.
These sums are then added together to get a total_sum.
The total_sum is divided by 24 (the maximum possible sum if all pillars were at their strongest states in both timeframes) and multiplied by 100 to get a percentage.
The result is rounded to the nearest integer and capped at a minimum of 1.
This calculation method ensures that the Confluence Strength meter takes into account not only the current timeframe but also the comparison timeframe, providing a more robust measure of overall market sentiment. The resulting score, ranging from 1 to 100, gives traders a clear and intuitive measure of how strongly the pillars agree, with higher scores indicating stronger potential signals.
This approach to measuring signal strength is unique in that it doesn't just rely on a single aspect of price action or volume. Instead, it takes into account multiple factors, providing a more robust and reliable indication of potential market moves. The higher the Confluence Strength score, the more confident traders can be in the signal.
The Confluence Strength meter helps traders in several ways:
It provides a quick and easy way to gauge the overall market sentiment.
It helps prioritize potential trades by identifying the strongest signals.
It can be used as a filter to avoid weaker setups and focus on high-probability trades.
It offers an additional layer of confirmation for other trading strategies or indicators.
By combining the Six Pillars analysis with the Confluence Strength meter, I've created a powerful tool that not only identifies potential trading opportunities but also quantifies their strength, giving traders a significant edge in their decision-making process.
How the Pillars Work (What Determines Bullish or Bearish)
While developing this indicator, I selected and configured six key components that work together to provide a comprehensive view of market conditions. Each pillar is set up to complement the others, creating a synergistic effect that offers traders a more nuanced understanding of price action and volume.
Trend Pillar: Based on two Exponential Moving Averages (EMAs) - a fast EMA (8 period) and a slow EMA (21 period). It determines the trend by comparing these EMAs, with stronger trends indicated when the fast EMA is significantly above or below the slow EMA.
Directional Movement (DM) Pillar: Utilizes the Average Directional Index (ADX) with a default period of 14. It measures trend strength, with values above 25 indicating a strong trend. It also considers the Positive and Negative Directional Indicators (DI+ and DI-) to determine trend direction.
Momentum Pillar: Uses the Moving Average Convergence Divergence (MACD) with customizable fast (12), slow (26), and signal (9) lengths. It compares the MACD line to the signal line to determine momentum strength and direction.
Stochastic Pillar: Employs the Stochastic oscillator with a default period of 13. It identifies overbought conditions (above 80) and oversold conditions (below 20), with intermediate zones between 60-80 and 20-40.
Fractal Pillar: Uses Williams' Fractal indicator with a default period of 3. It identifies potential reversal points by looking for specific high and low patterns over the given period.
On-Balance Volume (OBV) Pillar: Incorporates On-Balance Volume with three EMAs - short (3), medium (13), and long (21) periods. It assesses volume trends by comparing these EMAs.
Each pillar outputs a state ranging from -2 (strongly bearish) to 2 (strongly bullish), with 0 indicating a neutral state. This standardized output allows for easy comparison and aggregation of signals across all pillars.
Users can customize various parameters for each pillar, allowing them to fine-tune the indicator to their specific trading style and market conditions. The multi-timeframe comparison feature also allows users to compare pillar states between the current timeframe and a user-defined comparison timeframe, providing additional context for decision-making.
Design
From a design standpoint, I've put considerable effort into making the Six Pillars indicator visually appealing and user-friendly. The clean and minimalistic design is a key feature that sets this indicator apart.
I've implemented a sleek table layout that displays all the essential information in a compact and organized manner. The use of a dark background (#030712) for the table creates a sleek look that's easy on the eyes, especially during extended trading sessions.
The overall design philosophy focuses on presenting complex information in a simple, intuitive format, allowing traders to make informed decisions quickly and efficiently.
The color scheme is carefully chosen to provide clear visual cues:
White text for headers ensures readability
Green (#22C55E) for bullish signals
Blue (#3B82F6) for neutral states
Red (#EF4444) for bearish signals
This color coding extends to the candle coloring, making it easy to spot when all pillars agree on a bullish or bearish outlook.
I've also incorporated intuitive symbols (↑↑, ↑, →, ↓, ↓↓) to represent the different states of each pillar, allowing for quick interpretation at a glance.
The table layout is thoughtfully organized, with clear sections for the current and comparison timeframes. The Confluence Strength meter is prominently displayed, providing traders with an immediate sense of signal strength.
To enhance usability, I've added tooltips to various elements, offering additional information and explanations when users hover over different parts of the indicator.
How to Use This Indicator
The Six Pillars indicator is a versatile tool that can be used for various trading strategies. Here are some general usage guidelines and specific scenarios:
General Usage Guidelines:
Pay attention to the Confluence Strength meter. Higher values indicate stronger agreement among the pillars and potentially more reliable signals.
Use the multi-timeframe comparison to confirm signals across different time horizons.
Look for alignment between the current timeframe and comparison timeframe pillars for stronger signals.
One of the strengths of this indicator is it can let you know when markets are sideways – so in general you can know to avoid entering when the Confluence Strength is low, indicating disagreement among the pillars.
Customization Options
The Six Pillars indicator offers a wide range of customization options, allowing traders to tailor the tool to their specific needs and trading style. Here are the key customizable elements:
Comparison Timeframe:
Users can select any timeframe for comparison with the current timeframe, providing flexibility in multi-timeframe analysis.
Trend Pillar:
Fast EMA Period: Adjustable for quicker or slower trend identification
Slow EMA Period: Can be modified to capture longer-term trends
Momentum Pillar:
MACD Fast Length
MACD Slow Length
MACD Signal Length These can be adjusted to fine-tune momentum sensitivity
DM Pillar:
ADX Period: Customizable to change the lookback period for trend strength measurement
ADX Threshold: Adjustable to define what constitutes a strong trend
Stochastic Pillar:
Stochastic Period: Can be modified to change the sensitivity of overbought/oversold readings
Fractal Pillar:
Fractal Period: Adjustable to identify potential reversal points over different timeframes
OBV Pillar:
Short OBV EMA
Medium OBV EMA
Long OBV EMA These periods can be customized to analyze volume trends over different timeframes
These customization options allow traders to experiment with different settings to find the optimal configuration for their trading strategy and market conditions. The flexibility of the Six Pillars indicator makes it adaptable to various trading styles and market environments.

DynamicFunctionsLibrary "DynamicFunctions"
Custom Dynamic functions that allow an adaptive calculation beginning from the first bar
RoC(src, period)
Dynamic RoC
Parameters:
src (float) : and period
Custom function to calculate the actual period considering non-na source values
period (int)
dynamicMedian(src, length)
Dynamic Median
Parameters:
src (float) : and length
length (int)
kernelRegression(src, bandwidth, kernel_type)
Dynamic Kernel Regression Calculation \n Uses either of the following inputs for kernel_type:\nEpanechnikov\nLogistic\nWave
Parameters:
src (float)
bandwidth (int)
kernel_type (string)
waveCalculation(source, bandwidth, width)
Use together with kernelRegression function to get chart applicable band
Parameters:
source (float)
bandwidth (int)
width (float)
Rsi(src, length)
Dynamic RSI function
Parameters:
src (float)
length (int)
dynamicStdev(src, period)
Dynamic SD function
Parameters:
src (float)
period (int)
stdv_bands(src, length, mult)
Dynamic SD Bands
Parameters:
src (float)
length (int)
mult (float)
Returns: Basis, Positive SD, Negative SD
Adx(dilen, adxlen)
Dynamic ADX
Parameters:
dilen (int)
adxlen (int)
Returns: adx
Atr(length)
Dynamic ATR
Parameters:
length (int)
Returns: ATR
Macd(source, fastLength, slowLength, signalSmoothing)
Dynamic MACD
Parameters:
source (float)
fastLength (int)
slowLength (int)
signalSmoothing (int)
Returns: macdLine, signalLine, histogram
Market Trend Indicator (FinnoVent)The Market Trend Indicator (FinnoVent) is a comprehensive trading tool designed to provide clear visual cues for market trends on TradingView charts. This indicator combines the principles of Exponential Moving Averages (EMAs), Bollinger Bands, the Average Directional Index (ADX), and the Relative Strength Index (RSI) to offer a nuanced view of market movements.
How It Works:
Trend Identification with EMAs: The indicator uses two EMAs (3-period and 30-period) to identify the primary trend. An upward trend is signaled when the 3-period EMA crosses above the 30-period EMA, while a downward trend is indicated when the 3-period EMA crosses below the 30-period EMA.
Sideways Market Detection: To identify sideways trends, the indicator employs Bollinger Bands, ADX, and RSI. A sideways (or consolidating) market condition is identified when:
The price is between the middle 60% of the Bollinger Bands (avoiding the top and bottom 20%).
The ADX is below 30, indicating a lack of a strong trend.
The RSI is between 40 and 60, suggesting a neutral market momentum.
Visual Representation:
Bar Colors: The indicator colors the price bars on the chart based on the identified trend:
Green Bars: Indicate an upward trend.
Red Bars: Indicate a downward trend.
Grey Bars: Indicate a sideways or consolidating market.
How to Use:
Trend Following: Use the colored bars as a guide for trend following. Green bars suggest a potential entry for a long position, while red bars may indicate opportunities for short positions.
Sideways Market Caution: Grey bars signal a sideways market. In such conditions, traders might exercise caution and avoid trend-following strategies, as the market lacks a clear direction.
Complementary Analysis: While the Market Trend Indicator (FinnoVent) provides valuable insights, it's recommended to use it in conjunction with other forms of analysis (like fundamental analysis, other technical indicators, or price action) for comprehensive decision-making.
Suitable for: This indicator is versatile and can be applied to various timeframes and trading instruments, including stocks, forex, commodities, and indices.
Important Notes:
The indicator is designed to minimize repainting but always consider the latest data for the most accurate analysis.
Like all indicators, it is not foolproof. It works best when combined with a solid trading plan and risk management strategies.
LNL Trend SystemLNL Trend System is an ATR based day trading system specifically designed for intra-day traders and scalpers. The System works on any chart time frame & can be applied to any market. The study consist of two components - the Trend Line and the Stop Line. Trend System is based on a special ATR calculation that is achieved by combining the previous values of the 13 EMA in relation to the ATR which creates a line of deviations that visually look similar to the basic moving average but actually produce very different results ESPECIALLY in sideways market.
Trend Line:
Trend Line is a simple line which is basically a fast gauge represented by the 13 EMA that can change the color based on the current trend structure defined by multiple averages (8,13,21,34 EMAs). Trend Line is there to simply add the confluence for the current trend. Colors of the line are pretty much self-explanatory. Whenever the line turns red it states that the current structure is bearish. Vice versa for green line. Gray line represents neutral market structure.
Stop Line:
Stop Line is an ATR deviaton line with special calculation based on the previous bar ATRs and position of the price in relation to the current and previous values of 13 EMA. As already stated, this creates an ATR deviation marker either above or below the price that trails the price up or down until they touch. Whenever the price comes into the Stop Line it means it is making an ATR expansion move up or down .This touch will usually resolve into a reaction (a bounce) which provides trade opportunities.
Trend Bars:
When turned ON, Trend Bars can provide additional confulence of the current trend alongside with the Trend Line color. Trend Bars are based on the DMI and ADX indicators. Whenever the DMI is bearish and ADX is above 20 the candles paint themselfs red. And vice versa applies for the green candles and bullish DMI. Whenever the ADX falls below the 20, candles are netural (Gray) which means there is no real trend in place at the moment.
Trend Mode:
There are total of 5 different trend modes available. Each mode is visualizing different ATR settings which provides either aggressive or more conservative approach. The more tigher the mode, the more closer the distance between the price and the Stop Line. First two modes were designed for slower markets, whereas the "Loose" and "FOMC" modes are more suitable for products with high volatility.
Trend Modes:
1. Tight
Ideal for the slowest markets. Slowest market can be any market with unusually small average true range values or just simply a market that does have a personality of a "sleeper". Tight Mode can be also used for aggresive entries in the most ridiculous trends. Sometimes price will barely pullback to the Trend Line not even the Stop Line.
2. Normal
Normal Mode is the golden mean between the modes. "Normal" provides the ideal ATR lengths for the most used markets such as S&P Futures (ES) or SPY, AAPL and plenty of other highly popular stocks. More often than not, the length of this mode is respected considering there is no breaking news or high impact market event scheduled.
3. Loose
The "Loose" mode is basically a normal mode but a little bit more loose. This mode is useful whenever the ATRs jump higher than usual or during the days of highly anticipated news events. This mode is also better suited for more active markets such as NQ futures.
4. FOMC
The FOMC mode is called FOMC for a reason. This mode provides the maximum amount of wiggle room between the price and the Stop Line. This mode was designed for the extreme volatility, breaking news events or post-FOMC trading. If the market quiets down, this mode will not get the Stop Line touch as frequently as othete modes, thus it is not very useful to run this on markets with the average volatlity. Although never properly tested, perhaps the FOMC mode can find its value in the crypto market?
5. The Net
The net mode is basically a combination of all modes into one stop line system which creates "the net" effect. The Net provides the widest Stop Line zone which can be mainly appreciated by traders that like to use scale-in scale-out methods for their trading. Not to mention the visual side of the indicator which looks pretty great with the net mode on.
HTF (Higher Time Frame) Trend System:
The system also includes additional higher time frame (HTF) trend system. This can be set to any time frame by manual HTF mode. HTF mode set to "auto" will automatically choose the best suitable higher time frame trend system based on how appropriate the aggregation is. For everything below 5min the HTF Trend System will stay on 5min. Anything between 5-15min = 30min. 30min - 120min will turn on the 240min. 180min and higher will result in Daily time frame. Anything above the Daily will result in Weekly HTF aggregation, above W = Monthly, above M = Quarterly.
Background Clouds:
In terms of visualization, each trend system is fully customizable through the inputs settings. There is also an option to turn on/off the background clouds behind the stop lines. These clouds can make the charts more clean & visible.
Tips & Tricks:
1. Different Trend Modes
Try out different modes in different markets. There is no one single mode that will fit to everyone on the same type of market. I myself actually prefer more Loose than the Normal.
2. Stop Line Mirroring
Whenever the Stop Lines start to mirror each other (there is one above the price and one below) this means the price is entering a ranging sideways market. It does not matter which Stop Line will the price touch first. They can both be faded until one of them flips.
3. Signs of the Ranging Market
Watch out for signs of ranging market. Whenever the Trend System looses its colors whether on trend line or trend bars, if everything turns neutral (gray) that is usually a solid indication of a range type action for the following moments. Also as already stated before, the Stop Line mirroring is a good sign of the range market.
4. Trailing Tool, Trend System as an Additional Study?
In case you are not a fan of the colorful green / red charts & candles. You can switch all of them off and just leave the Stop Line on. This way you can use the benefits of the trend system and still use other studies on top of that. Similarly as the Parabolic SAR is often used.
5. The Flip Setup
One of my favorite trades is the Flip Setup on the 5min charts. Whenever the Stop Line is broken , the very first opposing touch after the Trend System flips is a usually a highly participated touch. If there is a strong reaction, this means this is likely a beginning of a new trend. Once I am in the position i like to trail the Stop Line on the 1min charts.
Hope it helps.

Directional Movement Index FLEXA common problem experienced by short term traders using DMI/ADX is that the session breaks results in carry-over effects from the prior session. For example, a large gap up would result in a positive DMI, even though momentum is clearly negative. Note the extremely different results in the morning session, when the gap is reversed.
The DMI-FLEX algoritm resets the +DI and -DI values to the prior session ending midpoint, so that new momentum can be observed from the indicator. (Note for Pinescript coders: rma function does not accept series int, thus the explicit pine_rma function)
DMI-FLEX has the added feature that the ADX value, instead of a separate line, is shown as shading between the +DI and -DI lines, and the color itself is determined by whether +DI is above -DI for a bullish color, or -DI is above +DI for a bearish color.
DMI Flex also gives you the flexibility of inverse colors, in case your chart has inverted scale.
Summary and How to use:
1) Green when +DI is above -DI
2) Red when -DI is above +DI
3) Deeper shading represents a higher ADX value.

Sniffer
╭━━━╮╱╱╱╱╭━╮╭━╮
┃╭━╮┃╱╱╱╱┃╭╯┃╭╯
┃╰━━┳━╮╭┳╯╰┳╯╰┳━━┳━╮
╰━━╮┃╭╮╋╋╮╭┻╮╭┫┃━┫╭╯
┃╰━╯┃┃┃┃┃┃┃╱┃┃┃┃━┫┃
╰━━━┻╯╰┻╯╰╯╱╰╯╰━━┻╯
Overview
A vast majority of modern data analysis & modelling techniques rely upon the idea of hidden patterns, wether it is some type of visualisation tool or some form of a complex machine learning algorithm, the one thing that they have in common is the belief, that patterns tell us what’s hidden behind plain numbers. The same philosophy has been adopted by many traders & investors worldwide, there’s an entire school of thought that operates purely based on chart patterns. This is where Sniffer comes in, it is a tool designed to simplify & quantify the job of pattern recognition on any given price chart, by combining various factors & techniques that generate high-quality results.
This tool analyses bars selected by the user, and highlights bar clusters on the chart that exhibit similar behaviour across multiple dimensions. It can detect a single candle pattern like hammers or dojis, or it can handle multiple candles like morning/evening stars or double tops/bottoms, and many more. In fact, the tool is completely independent of such specific candle formations, instead, it works on the idea of vector similarity and generates a degree of similarity for every single combination of candles. Only the top-n matches are highlighted, users get to choose which patterns they want to analyse and to what degree, by customising the feature-space.
Background
In the world of trading, a common use-case is to scan a price chart for some specific candlestick formations & price structures, and then the chart is further analysed in reference to these events. Traders are often trying to answer questions like, when was the last time price showed similar behaviour, what are the instances similar to what price is doing right now, what happens when price forms a pattern like this, what were some of other indicators doing when this happened last(RSI, CCI, ADX etc), and many other abstract ideas to have a stronger confluence or to confirm a bias.Having such a context can be vital in making better informed decisions, but doing this manually on a chart that has thousands of candles can have many disadvantages. It’s tedious, human errors are rather likely, and even if it’s done with pin-point accuracy, chances are that we’ll miss out on many pieces of information. This is the thought that gave birth to Sniffer .
Sniffer tries to provide a general solution for pattern-based analysis by deploying vector-similarity computation techniques, that cover the full-breadth of a price chart and generate a list of top-n matches based on the criteria selected by the user. Most of these techniques come from the data science space, where vector similarity is often implemented to solve classification & clustering problems. Sniffer uses same principles of vector comparison, and computes a degree of similarity for every single candle formation within the selected range, and as a result generates a similarity matrix that captures how similar or dissimilar a set of candles is to the input set selected by the user.
How It Works
A brief overview of how the tool is implemented:
- Every bar is processed, and a set of features are mapped to it.
- Bars selected by the user are captured, and saved for later use.
- Once the all the bars have been processed, candles are back-tracked and degree of similarity is computed for every single bar(max-limit is 5000 bars).
- Degree of similarity is computed by comparing attributes like price range, candle breadth & volume etc.
- Similarity matrix is sorted and top-n results are highlighted on the chart through boxes of different colors.
A brief overview of the features space for bars:
- Range: Difference between high & low
- Body: Difference between close & open
- Volume: Traded volume for that candle
- Head: Upper wick for green candles & lower wick for red candles
- Tail: Lower wick for green candles & upper wick for red candles
- BTR: Body to Range ratio
- HTR: Head to Range ratio
- TTR: Tail to Range ratio
- HTB: Head to Body ratio
- TTB: Tail to Body ratio
- ROC: Rate of change for HL2 for four different periods
- RSI: Relative Strength Index
- CCI: Commodity Channel Index
- Stochastic: Stochastic Index
- ADX: DMI+, DMI- & ADX
A brief overview of how degree of similarity is calculated:
- Each bar set is compared to the inout bar set within the selected feature space
- Features are represented as vectors, and distance between the vectors is calculated
- Shorter the distance, greater the similarity
- Different distance calculation methods are available to choose from, such as Cosine, Euclidean, Lorentzian, Manhattan, & Pearson
- Each method is likely to generate slightly different results, users are expected to select the method & the feature space that best fits their use-case
How To Use It
- Usage of this tool is relatively straightforward, users can add this indicator to their chart and similar clusters will be highlighted automatically
- Users need to select a time range that will be treated as input, and bars within that range become the input formation for similarity calculations
- Boxes will be draw around the clusters that fit the matching criteria
- Boxes are color-coded, green color boxes represent the top one-third of the top-n matches, yellow boxes represent the middle third, red boxes are for bottom third, and white box represents user-input
- Boxes colors will be adjusted as you adjust input parameters, such as number of matches or look-back period
User Settings
Users can configure the following options:
- Select the time-range to set input bars
- Select the look-back period, number of candles to backtrack for similarity search
- Select the number of top-n matches to show on the chart
- Select the method for similarity calculation
- Adjust the feature space, this enables addition of custom features, such as pattern recognition, technical indicators, rate of change etc
- Toggle verbosity, shows degree of similarity as a percentage value inside the box
Top Features
- Pattern Agnostic: Designed to work with variable number of candles & complex patterns
- Customisable Feature Space: Users get to add custom features to each bar
- Comprehensive Comparison: Generates a degree of similarity for all possible combinations
Final Note
- Similarity matches will be shown only within last 4500 bars.
- In theory, it is possible to compute similarity for any size candle formations, indicator has been tested with formations of 50+ candles, but it is recommended to select smaller range for faster & cleaner results.
- As you move to smaller time frames, selected time range will provide a larger number of candles as input, which can produce undesired results, it is advised to adjust your selection when you change time frames. Seeking suggestions on how to directly receive bars as user input, instead of time range.
- At times, users may see array index out of bound error when setting up this indicator, this generally happens when the input range is not properly configured. So, it should disappear after you select the input range, still trying to figure out where it is coming from, suggestions are welcome.
Credits
- @HeWhoMustNotBeNamed for publishing such a handy PineScript Logger, it certainly made the job a lot easier.

SPY 1 Minute Day TraderWhen scalping options, users are looking for where breakouts are going to occur instead of sitting thru areas choppy price action that drain delta and cause them to lose value even if price is up trending. This script tries to identify when a trend reversal is expected based on one minute price action on the SPY. It alerts users to prepare for potential breakout when 5 out of the 6 key optimized parameters are discovered by showing a white L or S. Once all six trigger, it informs the user at the close of that candle with a golden triangle with Pivot Up or Pivot Down. As scalping options is something that is expected to be short in duration, a take profit and stop loss of 30 cents of price actions is established. If five or more parameters occur after the pivot is initiated, then stop losses and take profits are adhered to; however, if there are less, then it waits to take profit or stop the trade, as likely it is just noise and it will finish trend with an additional breakout.
This script has been created to take into account how the following variables impact trend for SPY 1 Minute:
ema vs 13 ema : A cross establishes start of trend
MACD (Line, Signal & Slope) : If you have momentum
ADX : if you are trending
RSI : If the trend has strength
The above has been optimized to determine pivot points in the trend using key values for these 6 indicators
bounce up = ema5 > ema13 and macdLine < .5 and adx > 20 and macdSlope > 0 and signalLine > -.1 and rsiSignal > 40
bounce down = ema5 < ema13 and macdLine > -.5 and adx > 20 and signalLine < 0 and macdSlope < 0 and rsiSignal < 60
White L's indicate that 5 of 6 conditions are met due to impending uptrend w/ missing one in green below it
Yellow L's indicate that 6 of 6 conditions still are met
White S's indicate that 5 of 6 conditions are met due to impending downtrend w/ missing condition in red above it
Yellow S's indicate that 6 of 6 conditions still are met
After a downtrend or uptrend is established, once it closes it can't repeat for 10 minutes
Won't open any trades on last two minutes of any hours to avoid volatility
Will close any open trades going into last minute of hour to avoid large overnight random swings.

MLExtensionsLibrary "MLExtensions"
normalizeDeriv(src, quadraticMeanLength)
Returns the smoothed hyperbolic tangent of the input series.
Parameters:
src : The input series (i.e., the first-order derivative for price).
quadraticMeanLength : The length of the quadratic mean (RMS).
Returns: nDeriv The normalized derivative of the input series.
normalize(src, min, max)
Rescales a source value with an unbounded range to a target range.
Parameters:
src : The input series
min : The minimum value of the unbounded range
max : The maximum value of the unbounded range
Returns: The normalized series
rescale(src, oldMin, oldMax, newMin, newMax)
Rescales a source value with a bounded range to anther bounded range
Parameters:
src : The input series
oldMin : The minimum value of the range to rescale from
oldMax : The maximum value of the range to rescale from
newMin : The minimum value of the range to rescale to
newMax : The maximum value of the range to rescale to
Returns: The rescaled series
color_green(prediction)
Assigns varying shades of the color green based on the KNN classification
Parameters:
prediction : Value (int|float) of the prediction
Returns: color
color_red(prediction)
Assigns varying shades of the color red based on the KNN classification
Parameters:
prediction : Value of the prediction
Returns: color
tanh(src)
Returns the the hyperbolic tangent of the input series. The sigmoid-like hyperbolic tangent function is used to compress the input to a value between -1 and 1.
Parameters:
src : The input series (i.e., the normalized derivative).
Returns: tanh The hyperbolic tangent of the input series.
dualPoleFilter(src, lookback)
Returns the smoothed hyperbolic tangent of the input series.
Parameters:
src : The input series (i.e., the hyperbolic tangent).
lookback : The lookback window for the smoothing.
Returns: filter The smoothed hyperbolic tangent of the input series.
tanhTransform(src, smoothingFrequency, quadraticMeanLength)
Returns the tanh transform of the input series.
Parameters:
src : The input series (i.e., the result of the tanh calculation).
smoothingFrequency
quadraticMeanLength
Returns: signal The smoothed hyperbolic tangent transform of the input series.
n_rsi(src, n1, n2)
Returns the normalized RSI ideal for use in ML algorithms.
Parameters:
src : The input series (i.e., the result of the RSI calculation).
n1 : The length of the RSI.
n2 : The smoothing length of the RSI.
Returns: signal The normalized RSI.
n_cci(src, n1, n2)
Returns the normalized CCI ideal for use in ML algorithms.
Parameters:
src : The input series (i.e., the result of the CCI calculation).
n1 : The length of the CCI.
n2 : The smoothing length of the CCI.
Returns: signal The normalized CCI.
n_wt(src, n1, n2)
Returns the normalized WaveTrend Classic series ideal for use in ML algorithms.
Parameters:
src : The input series (i.e., the result of the WaveTrend Classic calculation).
n1
n2
Returns: signal The normalized WaveTrend Classic series.
n_adx(highSrc, lowSrc, closeSrc, n1)
Returns the normalized ADX ideal for use in ML algorithms.
Parameters:
highSrc : The input series for the high price.
lowSrc : The input series for the low price.
closeSrc : The input series for the close price.
n1 : The length of the ADX.
regime_filter(src, threshold, useRegimeFilter)
Parameters:
src
threshold
useRegimeFilter
filter_adx(src, length, adxThreshold, useAdxFilter)
filter_adx
Parameters:
src : The source series.
length : The length of the ADX.
adxThreshold : The ADX threshold.
useAdxFilter : Whether to use the ADX filter.
Returns: The ADX.
filter_volatility(minLength, maxLength, useVolatilityFilter)
filter_volatility
Parameters:
minLength : The minimum length of the ATR.
maxLength : The maximum length of the ATR.
useVolatilityFilter : Whether to use the volatility filter.
Returns: Boolean indicating whether or not to let the signal pass through the filter.
backtest(high, low, open, startLongTrade, endLongTrade, startShortTrade, endShortTrade, isStopLossHit, maxBarsBackIndex, thisBarIndex)
Performs a basic backtest using the specified parameters and conditions.
Parameters:
high : The input series for the high price.
low : The input series for the low price.
open : The input series for the open price.
startLongTrade : The series of conditions that indicate the start of a long trade.`
endLongTrade : The series of conditions that indicate the end of a long trade.
startShortTrade : The series of conditions that indicate the start of a short trade.
endShortTrade : The series of conditions that indicate the end of a short trade.
isStopLossHit : The stop loss hit indicator.
maxBarsBackIndex : The maximum number of bars to go back in the backtest.
thisBarIndex : The current bar index.
Returns: A tuple containing backtest values
init_table()
init_table()
Returns: tbl The backtest results.
update_table(tbl, tradeStatsHeader, totalTrades, totalWins, totalLosses, winLossRatio, winrate, stopLosses)
update_table(tbl, tradeStats)
Parameters:
tbl : The backtest results table.
tradeStatsHeader : The trade stats header.
totalTrades : The total number of trades.
totalWins : The total number of wins.
totalLosses : The total number of losses.
winLossRatio : The win loss ratio.
winrate : The winrate.
stopLosses : The total number of stop losses.
Returns: Updated backtest results table.

Fibonacci Zone DCA Strategy - R3c0nTraderCredits:
Thank you "eykpunter" for granting me permission to use "Fibonacci Zones" to create this strategy
Thank you "junyou0424" for granting me permission to use "DCA Bot with SuperTrend Emulator" which I used for adding bot inputs, calculations, and strategy
Pre-requisites:
You can use this script without a 3Commas account and see how 3Commas DCA Bot would perform. However, I highly recommend signing up for their free account, going through their training, and testing this strategy with a paper bot. This would give you a base understanding of the settings you will see in this strategy and why you will need to know them.
What can this do?
First off, this is a Long only strategy as I wrote it with DCA in mind. It cannot be used for shorting. Shorting defeats the purpose of a DCA bot which has a goal that is Long a position not Short a position. If you want to short, there are plenty of free scripts out there that do this.
I created this script out of curiosity and I wanted to see how a strategy based on “Fibonacci” levels would work with a 3Commas DCA bot. I came across "eykpunter’s" "Fibonacci Zones" study and in TradingView and I found it to be a very interesting concept. The "Fib Zones" in his study are basically a "Donchian Channel" of 4 Fibonacci lines. These are the High @ 0.236, Center High @ 0.382, Center Low @ 0.618, and Low @ 0.764.
The Fib Zones in this strategy can be used as conditions to open a trade as well as closing a trade. There is also the option to close a trade based on a Target Take Profit (%).
Advanced Fibonacci trading is also supported by specifying additional parameters for Trade Entry and Exit.
For example, for order entry, you can increase the minimum trend strength to open an order via the "minimum ADX value" option. You can also further limit order entry by selecting the option to "Only open trades on bullish +DI" (Positive Directional Index).
Or you can play the contrarian. For example, I would look for "buying the dip" opportunities by doing the following under "Trade Entry Settings":
Set the "Min ADX value to open trade" to zero
Set the option "Open a trade when the price moves" to "1-To the bottom of Downtrend Fib zone" or "2-Higher than the top of the Downtrend Fib zone"
Uncheck option "Only open trades on bullish +DI"
Set the 'Min ADX value to open trade' to Zero
Set the 'Max +DI value to open trade' to a value between 10-20.
For Trade Exit settings, I can use a "Target Take Profit (%)" or one of the High Fib levels to close the trade.
Here's an example result when using a Contrarian-Fibonacci-Zone-DCA strategy:
Explanation of Chart lines and colors on chart
Six Options for Entering a Fibonacci Trade
Open a trade when the price moves:
1-To the bottom of Downtrend Fib zone
2-Higher than the top of the Downtrend Fib zone
3-Higher than the bottom of Ranging Fib Zone
4-Higher than the top of Ranging Fib Zone
5-Higher than the bottom of Uptrend Fib Zone
6-To the top of Uptrend Fib Zone
Three Options for Exiting a Fibonacci Trade
Take profit using:
"Target Take Profit (%)"
"High Fibonacci Border-1"
"High Fibonacci Border-2"
