pandas_taLibrary "pandas_ta"
Level: 3
Background
Today is the first day of 2022 and happy new year every tradingviewers! May health and wealth go along with you all the time. I use this chance to publish my 1st PINE v5 lib : pandas_ta
This is not a piece of cake like thing, which cost me a lot of time and efforts to build this lib. Beyond 300 versions of this script was iterated in draft.
Function
Library "pandas_ta"
PINE v5 Counterpart of Pandas TA - A Technical Analysis Library in Python 3 at github.com
The Original Pandas Technical Analysis (Pandas TA) is an easy to use library that leverages the Pandas package with more than 130 Indicators and Utility functions and more than 60 TA Lib Candlestick Patterns.
I realized most of indicators except Candlestick Patterns because tradingview built-in Candlestick Patterns are even more powerful!
I use this to verify pandas_ta python version indicators for myself, but I realize that maybe many may need similar lib for pine v5 as well.
Function Brief Descriptions (Pls find details in script comments)
bton --> Binary to number
wcp --> Weighted Closing Price (WCP)
counter --> Condition counter
xbt --> Between
ebsw --> Even Better SineWave (EBSW)
ao --> Awesome Oscillator (AO)
apo --> Absolute Price Oscillator (APO)
xrf --> Dynamic shifted values
bias --> Bias (BIAS)
bop --> Balance of Power (BOP)
brar --> BRAR (BRAR)
cci --> Commodity Channel Index (CCI)
cfo --> Chande Forcast Oscillator (CFO)
cg --> Center of Gravity (CG)
cmo --> Chande Momentum Oscillator (CMO)
coppock --> Coppock Curve (COPC)
cti --> Correlation Trend Indicator (CTI)
dmi --> Directional Movement Index(DMI)
er --> Efficiency Ratio (ER)
eri --> Elder Ray Index (ERI)
fisher --> Fisher Transform (FISHT)
inertia --> Inertia (INERTIA)
kdj --> KDJ (KDJ)
kst --> 'Know Sure Thing' (KST)
macd --> Moving Average Convergence Divergence (MACD)
mom --> Momentum (MOM)
pgo --> Pretty Good Oscillator (PGO)
ppo --> Percentage Price Oscillator (PPO)
psl --> Psychological Line (PSL)
pvo --> Percentage Volume Oscillator (PVO)
qqe --> Quantitative Qualitative Estimation (QQE)
roc --> Rate of Change (ROC)
rsi --> Relative Strength Index (RSI)
rsx --> Relative Strength Xtra (rsx)
rvgi --> Relative Vigor Index (RVGI)
slope --> Slope
smi --> SMI Ergodic Indicator (SMI)
sqz* --> Squeeze (SQZ) * NOTE: code sufferred from very strange error, code was commented.
sqz_pro --> Squeeze PRO(SQZPRO)
xfl --> Condition filter
stc --> Schaff Trend Cycle (STC)
stoch --> Stochastic (STOCH)
stochrsi --> Stochastic RSI (STOCH RSI)
trix --> Trix (TRIX)
tsi --> True Strength Index (TSI)
uo --> Ultimate Oscillator (UO)
willr --> William's Percent R (WILLR)
alma --> Arnaud Legoux Moving Average (ALMA)
xll --> Dynamic rolling lowest values
dema --> Double Exponential Moving Average (DEMA)
ema --> Exponential Moving Average (EMA)
fwma --> Fibonacci's Weighted Moving Average (FWMA)
hilo --> Gann HiLo Activator(HiLo)
hma --> Hull Moving Average (HMA)
hwma --> HWMA (Holt-Winter Moving Average)
ichimoku --> Ichimoku Kinkō Hyō (ichimoku)
jma --> Jurik Moving Average Average (JMA)
kama --> Kaufman's Adaptive Moving Average (KAMA)
linreg --> Linear Regression Moving Average (linreg)
mgcd --> McGinley Dynamic Indicator
rma --> wildeR's Moving Average (RMA)
sinwma --> Sine Weighted Moving Average (SWMA)
ssf --> Ehler's Super Smoother Filter (SSF) © 2013
supertrend --> Supertrend (supertrend)
xsa --> X simple moving average
swma --> Symmetric Weighted Moving Average (SWMA)
t3 --> Tim Tillson's T3 Moving Average (T3)
tema --> Triple Exponential Moving Average (TEMA)
trima --> Triangular Moving Average (TRIMA)
vidya --> Variable Index Dynamic Average (VIDYA)
vwap --> Volume Weighted Average Price (VWAP)
vwma --> Volume Weighted Moving Average (VWMA)
wma --> Weighted Moving Average (WMA)
zlma --> Zero Lag Moving Average (ZLMA)
entropy --> Entropy (ENTP)
kurtosis --> Rolling Kurtosis
skew --> Rolling Skew
xev --> Condition all
zscore --> Rolling Z Score
adx --> Average Directional Movement (ADX)
aroon --> Aroon & Aroon Oscillator (AROON)
chop --> Choppiness Index (CHOP)
xex --> Condition any
cksp --> Chande Kroll Stop (CKSP)
dpo --> Detrend Price Oscillator (DPO)
long_run --> Long Run
psar --> Parabolic Stop and Reverse (psar)
short_run --> Short Run
vhf --> Vertical Horizontal Filter (VHF)
vortex --> Vortex
accbands --> Acceleration Bands (ACCBANDS)
atr --> Average True Range (ATR)
bbands --> Bollinger Bands (BBANDS)
donchian --> Donchian Channels (DC)
kc --> Keltner Channels (KC)
massi --> Mass Index (MASSI)
natr --> Normalized Average True Range (NATR)
pdist --> Price Distance (PDIST)
rvi --> Relative Volatility Index (RVI)
thermo --> Elders Thermometer (THERMO)
ui --> Ulcer Index (UI)
ad --> Accumulation/Distribution (AD)
cmf --> Chaikin Money Flow (CMF)
efi --> Elder's Force Index (EFI)
ecm --> Ease of Movement (EOM)
kvo --> Klinger Volume Oscillator (KVO)
mfi --> Money Flow Index (MFI)
nvi --> Negative Volume Index (NVI)
obv --> On Balance Volume (OBV)
pvi --> Positive Volume Index (PVI)
dvdi --> Dual Volume Divergence Index (DVDI)
xhh --> Dynamic rolling highest values
pvt --> Price-Volume Trend (PVT)
Remarks
I also incorporated func descriptions and func test script in commented mode, you can test the functino with the embedded test script and modify them as you wish.
This is a Level 3 free and open source indicator library.
Feedbacks are appreciated.
This is not the end of pandas_ta lib publication, but it is start point with pine v5 lib function and I will add more and more funcs into this lib for my own indicators.
Function Name List:
bton()
wcp()
count()
xbt()
ebsw()
ao()
apo()
xrf()
bias()
bop()
brar()
cci()
cfo()
cg()
cmo()
coppock()
cti()
dmi()
er()
eri()
fisher()
inertia()
kdj()
kst()
macd()
mom()
pgo()
ppo()
psl()
pvo()
qqe()
roc()
rsi()
rsx()
rvgi()
slope()
smi()
sqz_pro()
xfl()
stc()
stoch()
stochrsi()
trix()
tsi()
uo()
willr()
alma()
wcx()
xll()
dema()
ema()
fwma()
hilo()
hma()
hwma()
ichimoku()
jma()
kama()
linreg()
mgcd()
rma()
sinwma()
ssf()
supertrend()
xsa()
swma()
t3()
tema()
trima()
vidya()
vwap()
vwma()
wma()
zlma()
entropy()
kurtosis()
skew()
xev()
zscore()
adx()
aroon()
chop()
xex()
cksp()
dpo()
long_run()
psar()
short_run()
vhf()
vortex()
accbands()
atr()
bbands()
donchian()
kc()
massi()
natr()
pdist()
rvi()
thermo()
ui()
ad()
cmf()
efi()
ecm()
kvo()
mfi()
nvi()
obv()
pvi()
dvdi()
xhh()
pvt()
Cerca negli script per "adx"

Trading Made Easy ATR BandsAs always, this is not financial advice and use at your own risk. Trading is risky and can cost you significant sums of money if you are not careful. Make sure you always have a proper entry and exit plan that includes defining your risk before you enter a trade.
Background:
This is my take on two relatively famous indicators that paint the colour of your candles in order to help identify trend direction and smooth out market noise. The Elder Impulse System was designed by Dr . Alexander Elder in his book Come Into My Trading Room and attempts to identify the change of trends and when these trends speed up and slow down (school.stockcharts.com). The system used a 13 period EMA and a MACD histogram, and compared each of these indicators to the previous period. In short, when both the histogram and the EMA were rising, the trend was accelerating to the upside and when both were falling, accelerating to the downside. Conversely, when the indicators were not in alignment, say the MACD falling but the EMA rising, it signaled a slowing down of momentum. The downside of this indicator is that it be can rather jumpy, focusing on a short period EMA for 50% of its calculation, leaving a trader to potentially sit on the sidelines during opportune pull backs to enter winning positions, or exit early when there is still a lot of gas left in the tank.
A similar concept has been employed by John Carter and his organization, SimplerTrading, with the 10X bars indicator. However, here they use the famous Directional Movement Index (DMI) created by J. Welles Wilder as the basis for their bars (www.simplertrading.com). John Carter states that the use of this indicator can lead to getting in earlier on more, bigger, and faster setups. The downside of this indicator is the reliance on the ADX calculations to keep you out of rangebound trades. Anyone who is familiar with the DMI system understands it has unparalleled ability to identify longer term trends, but it is also quite slow, leaving the trader to miss a good portion of the initial runup due to this ADX portion that is very slow to get moving and also slow to signal exits.
In short, both of these systems are designed with one thing in mind: keeping the trader on the right side of the move --- but both suffer from the same issue but on opposite sides of the spectrum. One is too fast and the other is too slow. Ultimately, leaving profits on the table for the trader when such a situation could be avoided.
Here I present my own take on these and have made the “Trading Made Easy ATR Bands”. I name it this because trading is much easier when you trade with the prevailing trend, and this system identifies these periods quite effectively while doing a better job of handling the speed flux of most markets. The base formula uses the DMI as its main calculation and the relationship between the DMI+ and DMI- lines, respectively, like the 10X bars. While the trader can investigate these on their own to understand these more intimately, essentially the DMI+ and DMI- lines are calculating the highs and lows respectively of each bar compared to a period in the past and smoothed with the true range, a measurement of volatility . What this ultimately presents is a picture of uptrends and downtrends, where price is making consistently more highs or more lows over a period of time. Where I have modified this relative to the 10X bars is I have ignored the ADX calculations. Further, values over 25 have been discussed as “strong” momentum, in my calculations, I have sped this up to 20 to get a trader into the move earlier. Second, I have added an additional calculation based around the 21-period exponential moving average calculated against its previous output. This then, like the Elder Impulse System, has two forms of market momentum as its calculation to smooth out noise, but has the benefit of being less jumpy, like the original 10X bar system. I have added a series of exponential moving averages following the Fibonacci sequence from 8-144 as a system of dynamic support and resistance showing the sentiment of both the shorter and longer term market participants. Last, I have added a series of Keltner Channels , from 1X-4X, that encompass the 21 period EMA as a base line. The 21 EMA is a stable in all of John Carter’s work and I do believe he is correct that the market is mostly structured around this line, since it roughly approximates one month of trading data. It is not uncommon to see price expand and contract back to this line over and over again.
Trade Signals:
Strong Bullish Momentum – The system will generate a green bar when the DMI+ line is over the DMI- line, the DMI+ line is equal or greater than 20 and the 21 EMA has increased relative to its last close.
Weak Bullish Momentum – The system will generate a blue bar in several scenarios. First, when the DMI+ line is over the DMI- line but the DMI+ line is not over 20 and the EMA is equal or less than the previous close. It will also print a blue bar if either the DMI or the EMA are not aligned, such as the DMI+ is over the DMI- but not over 20 but the EMA has risen compared to the last bar. Last, it will also print a blue bar if the DMI- is over the DMI+ but the EMA is rising.
Strong Bearish Momentum – The system will generate a red bar when the DMI- line is over the DMI+ line, the DMI- line is equal or greater than 20, and the 21 EMA has fallen relative to its last close.
Weak Bearish Momentum – The system will generate an orange bar in several scenarios. First when the DMI- line is over the DMI+ line but the DMI- line is not over 20 and the EMA is equal or greater than the last bar. It will also print an orange bar if either the DMI or the EMA are not aligned, such as the DMI- is over the DMI+ but not over 20 but the EMA has fallen. Lastly, it will also print an orange bar if the DMI+ line is over the DMI- and the EMA has fallen relative to the last bar.
Uses:
1) Like the Elder Impulse System and 10X Bar systems, these should be used as trade filters only.. It is in the trader’s best interest to trade with the trends and these bars identify these periods but may not always generate the most opportune time to enter a market. For instance, trying to short a market when the market is in a phase of Strong Bullish Momentum would not be wise, and vice versa with trying to open long positions when the market is exhibiting Strong Bearish Momentum. Use multiple forms of evidence to confirm the signals shown before entering any trade and to not take these signals on their without confluence of ideas. A viable system could use the Elder Triple Screen System (for reference, see this decent write up --- www.dailyforex.com) with the Trading Made Easy Bands as your “Tide” or longer term filter, and a further trading plan to establish an entry on a short time frame pull back.
2) Interim Trend Exhaustion – Keltner channels work as moving standard deviations from the 21 EMA . 3X multipliers will encompass 99.7% of price and 4X will encompass 99.9% of price away from the 21 EMA . During a trend it would be a good idea to lock in partial profits when price reaches these outer extrema as it is very highly probable that a retracement back to the mean is approaching. While not part of the system, and not recommended to be used by this system, a mean reversion trader could in theory look for reversals at these extrema points and trade a mean reversion strategy back to the 21EMA, but is a much riskier trade with lower probability of success. A trend trader should look to enter trades when a signal is given within the 1ATR or 2ATR zone as this is when price has not really started accelerating yet and is likely to see continued momentum in that direction.

Indicators Combination Framework v3 IND [DTU]Hello All,
This script is a framework to analyze and see the results by combine selected indicators for (long, short, longexit, shortexit) conditions.
I was designed this for beginners and users to facilitate to see effects of the technical indicators combinations on the chart WITH NO CODE
You can improve your strategies according the results of this system by connecting the framework to a strategy framework/template such as Pinecoder, Benson, daveatt or custom.
This is enhanced version of my previous indicator "Indicators & Conditions Test Framework "
Currently there are 93 indicators (23 newly added) connected over library. You can also import an External Indicator or add Custom indicator (In the source)
It is possible to change it from Indicator to strategy (simple one) by just remarking strategy parts in the source code and see real time profit of your combinations
Feel free to change or use it in your source
Special thanks goes to Pine wizards: Trading view (built-in Indicators), @Rodrigo, @midtownsk8rguy, @Lazybear, @Daveatt and others for their open source codes and contributions
SIMPLE USAGE
1. SETTING: Show Alerts= True (To see your entries and Exists)
2. Define your Indicators (ex: INDICATOR1: ema(close,14), INDICATOR2: ema(close,21), INDICATOR3: ema(close,200)
3. Define Your Combinations for long & Short Conditions
a. For Long: (INDICATOR1 crossover INDICATOR2) AND (INDICATOR3 < close)
b. For Short: (INDICATOR1 crossunder INDICATOR2) AND (INDICATOR3 > close)
4. Select Strategy/template (Import strategy to chart) that you export your signals from the list
5. Analyze the best profit by changing Indicators values
SOME INDICATORS DETAILS
Each Indicator includes:
- Factorization : Converting the selected indicator to Double, triple Quadruple such as EMA to DEMA, TEMA QEMA
- Log : Simple or log10 can be used for calculation on function entries
- Plot Type : You can overlay the indicator on the chart (such ema) or you can use stochastic/Percentrank approach to display in the variable hlines range
- Extended Parametes : You can use default parameters or you can use extended (P1,P2) parameters regarding to indicator type and your choice
- Color : You can define indicator color and line properties
- Smooth : you can enable swma smooth
- indicators : you can select one of the 93 function like ema(),rsi().. to define your indicator
- Source : you can select from already defined indicators (IND1-4), External Indicator (EXT), Custom Indicator (CUST), and other sources (close, open...)
CONDITION DETAILS
- There are are 4 type of conditions, long entry, short entry, long exit, short exit.
- Each condition are built up from 4 combinations that joined with "AND" & "OR" operators
- You can see the results by enabling show alerts check box
- If you only wants to enter long entry and long exit, just fill these conditions
- If "close on opposite" checkbox selected on settings, long entry will be closed on short entry and vice versa
COMBINATIONS DETAILS
- There are 4 combinations that joined with "AND" & "OR" operators for each condition
- combinations are built up from compare 1st entry with 2nd one by using operator
- 1st and 2nd entries includes already defined indicators (IND1-5), External Indicator (EXT), Custom Indicator (CUST), and other sources (close, open...)
- Operators are comparison values such as >,<, crossover,...
- 2nd entry include "VALUE" parameter that will use to compare 1st indicator with value area
- If 2nd indicator selected different than "VALUE", value are will mean previous value of the selection. (ex: value area= 2, 2nd entry=close, means close )
- Selecting "NONE" for the 1st entry will disable calculation of current and following combinations
JOINS DETAILS
- Each combination will join wiht the following one with the JOIN (AND, OR) operator (if the following one is not equal "NONE")
CUSTOM INDICATOR
- Custom Indicator defines harcoded in the source code.
- You can call it with "CUST" in the Indicator definition source or combination entries source
- You can change or implement your custom indicator by updating the source code
EXTERNAL INDICATOR
- You can import an external indicator by selecting it from the ext source.
- External Indicator should be already imported to the chart and it have an plot function to output its signal
EXPORTING SIGNAL
- You can export your result to an already defined strategy template such as Pine coders, Benson, Daveatt Strategy templates
- Or you can define your custom export for other future strategy templates
ALERTS
- By enabling show alerts checkbox, you can see long entry exits on the bottom, and short entry exits aon the top of the chart
ADDITIONAL INFO
- You can see all off the inputs descriptions in the tooltips. (You can also see the previous version for details)
- Availability to set start, end dates
- Minimize repainting by using security function options (Secure, Semi Secure, Repaint)
- Availability of use timeframes
-
Version 3 INDICATORS LIST (More to be added):
▼▼▼ OVERLAY INDICATORS ▼▼▼
alma(src,len,offset=0.85,sigma=6).-------Arnaud Legoux Moving Average
ama(src,len,fast=14,slow=100).-----------Adjusted Moving Average
accdist().-------------------------------Accumulation/distribution index.
cma(src,len).----------------------------Corrective Moving average
dema(src,len).---------------------------Double EMA (Same as EMA with 2 factor)
ema(src,len).----------------------------Exponential Moving Average
gmma(src,len).---------------------------Geometric Mean Moving Average
highest(src,len).------------------------Highest value for a given number of bars back.
hl2ma(src,len).--------------------------higest lowest moving average
hma(src,len).----------------------------Hull Moving Average.
lagAdapt(src,len,perclen=5,fperc=50).----Ehlers Adaptive Laguerre filter
lagAdaptV(src,len,perclen=5,fperc=50).---Ehlers Adaptive Laguerre filter variation
laguerre(src,len).-----------------------Ehlers Laguerre filter
lesrcp(src,len).-------------------------lowest exponential esrcpanding moving line
lexp(src,len).---------------------------lowest exponential expanding moving line
linreg(src,len,loffset=1).---------------Linear regression
lowest(src,len).-------------------------Lovest value for a given number of bars back.
mcginley(src, len.-----------------------McGinley Dynamic adjusts for market speed shifts, which sets it apart from other moving averages, in addition to providing clear moving average lines
percntl(src,len).------------------------percentile nearest rank. Calculates percentile using method of Nearest Rank.
percntli(src,len).-----------------------percentile linear interpolation. Calculates percentile using method of linear interpolation between the two nearest ranks.
previous(src,len).-----------------------Previous n (len) value of the source
pivothigh(src,BarsLeft=len,BarsRight=2).-Previous pivot high. src=src, BarsLeft=len, BarsRight=p1=2
pivotlow(src,BarsLeft=len,BarsRight=2).--Previous pivot low. src=src, BarsLeft=len, BarsRight=p1=2
rema(src,len).---------------------------Range EMA (REMA)
rma(src,len).----------------------------Moving average used in RSI. It is the exponentially weighted moving average with alpha = 1 / length.
sar(start=len, inc=0.02, max=0.02).------Parabolic SAR (parabolic stop and reverse) is a method to find potential reversals in the market price direction of traded goods.start=len, inc=p1, max=p2. ex: sar(0.02, 0.02, 0.02)
sma(src,len).----------------------------Smoothed Moving Average
smma(src,len).---------------------------Smoothed Moving Average
super2(src,len).-------------------------Ehlers super smoother, 2 pole
super3(src,len).-------------------------Ehlers super smoother, 3 pole
supertrend(src,len,period=3).------------Supertrend indicator
swma(src,len).---------------------------Sine-Weighted Moving Average
tema(src,len).---------------------------Triple EMA (Same as EMA with 3 factor)
tma(src,len).----------------------------Triangular Moving Average
vida(src,len).---------------------------Variable Index Dynamic Average
vwma(src,len).---------------------------Volume Weigted Moving Average
volstop(src,len,atrfactor=2).------------Volatility Stop is a technical indicator that is used by traders to help place effective stop-losses. atrfactor=p1
wma(src,len).----------------------------Weigted Moving Average
vwap(src_).------------------------------Volume Weighted Average Price (VWAP) is used to measure the average price weighted by volume
▼▼▼ NON OVERLAY INDICATORS ▼▼
adx(dilen=len, adxlen=14, adxtype=0).----adx. The Average Directional Index (ADX) is a used to determine the strength of a trend. len=>dilen, p1=adxlen (default=14), p2=adxtype 0:ADX, 1:+DI, 2:-DI (def:0)
angle(src,len).--------------------------angle of the series (Use its Input as another indicator output)
aroon(len,dir=0).------------------------aroon indicator. Aroons major function is to identify new trends as they happen.p1 = dir: 0=mid (default), 1=upper, 2=lower
atr(src,len).----------------------------average true range. RMA of true range.
awesome(fast=len=5,slow=34,type=0).------Awesome Oscilator is an indicator used to measure market momentum. defaults : fast=len= 5, p1=slow=34, p2=type: 0=Awesome, 1=difference
bbr(src,len,mult=1).---------------------bollinger %%
bbw(src,len,mult=2).---------------------Bollinger Bands Width. The Bollinger Band Width is the difference between the upper and the lower Bollinger Bands divided by the middle band.
cci(src,len).----------------------------commodity channel index
cctbbo(src,len).-------------------------CCT Bollinger Band Oscilator
change(src,len).-------------------------A.K.A. Momentum. Difference between current value and previous, source - source . is most commonly referred to as a rate and measures the acceleration of the price and/or volume of a security
cmf(len=20).-----------------------------Chaikin Money Flow Indicator used to measure Money Flow Volume over a set period of time. Default use is len=20
cmo(src,len).----------------------------Chande Momentum Oscillator. Calculates the difference between the sum of recent gains and the sum of recent losses and then divides the result by the sum of all price movement over the same period.
cog(src,len).----------------------------The cog (center of gravity) is an indicator based on statistics and the Fibonacci golden ratio.
copcurve(src,len).-----------------------Coppock Curve. was originally developed by Edwin Sedge Coppock (Barrons Magazine, October 1962).
correl(src,len).-------------------------Correlation coefficient. Describes the degree to which two series tend to deviate from their ta.sma values.
count(src,len).--------------------------green avg - red avg
cti(src,len).----------------------------Ehler s Correlation Trend Indicator by
dev(src,len).----------------------------ta.dev() Measure of difference between the series and its ta.sma
dpo(len).--------------------------------Detrended Price OScilator is used to remove trend from price.
efi(len).--------------------------------Elders Force Index (EFI) measures the power behind a price movement using price and volume.
eom(len=14,div=10000).-------------------Ease of Movement.It is designed to measure the relationship between price and volume.p1 = div: 10000= (default)
falling(src,len).------------------------ta.falling() Test if the `source` series is now falling for `length` bars long. (Use its Input as another indicator output)
fisher(len).-----------------------------Fisher Transform is a technical indicator that converts price to Gaussian normal distribution and signals when prices move significantly by referencing recent price data
histvol(len).----------------------------Historical volatility is a statistical measure used to analyze the general dispersion of security or market index returns for a specified period of time.
kcr(src,len,mult=2).---------------------Keltner Channels Range
kcw(src,len,mult=2).---------------------ta.kcw(). Keltner Channels Width. The Keltner Channels Width is the difference between the upper and the lower Keltner Channels divided by the middle channel.
klinger(type=len).-----------------------Klinger oscillator aims to identify money flow’s long-term trend. type=len: 0:Oscilator 1:signal
macd(src,len).---------------------------MACD (Moving Average Convergence/Divergence)
mfi(src,len).----------------------------Money Flow Index s a tool used for measuring buying and selling pressure
msi(len=10).-----------------------------Mass Index (def=10) is used to examine the differences between high and low stock prices over a specific period of time
nvi().-----------------------------------Negative Volume Index
obv().-----------------------------------On Balance Volume
pvi().-----------------------------------Positive Volume Index
pvt().-----------------------------------Price Volume Trend
ranges(src,upper=len, lower=-5).---------ranges of the source. src=src, upper=len, v1:lower=upper . returns: -1 source=upper otherwise 0
rising(src,len).-------------------------ta.rising() Test if the `source` series is now rising for `length` bars long. (Use its Input as another indicator output)
roc(src,len).----------------------------Rate of Change
rsi(src,len).----------------------------Relative strength Index
rvi(src,len).----------------------------The Relative Volatility Index (RVI) is calculated much like the RSI, although it uses high and low price standard deviation instead of the RSI’s method of absolute change in price.
smi_osc(src,len,fast=5, slow=34).--------smi Oscillator
smi_sig(src,len,fast=5, slow=34).--------smi Signal
stc(src,len,fast=23,slow=50).------------Schaff Trend Cycle (STC) detects up and down trends long before the MACD. Code imported from
stdev(src,len).--------------------------Standart deviation
trix(src,len) .--------------------------the rate of change of a triple exponentially smoothed moving average.
tsi(src,len).----------------------------The True Strength Index indicator is a momentum oscillator designed to detect, confirm or visualize the strength of a trend.
ultimateOsc(len.-------------------------Ultimate Oscillator indicator (UO) indicator is a technical analysis tool used to measure momentum across three varying timeframes
variance(src,len).-----------------------ta.variance(). Variance is the expectation of the squared deviation of a series from its mean (ta.sma), and it informally measures how far a set of numbers are spread out from their mean.
willprc(src,len).------------------------Williams %R
wad().-----------------------------------Williams Accumulation/Distribution.
wvad().----------------------------------Williams Variable Accumulation/Distribution.
HISTORY
v3.01
ADD: 23 new indicators added to indicators list from the library. Current Total number of Indicators are 93. (to be continued to adding)
ADD: 2 more Parameters (P1,P2) for indicator calculation added. Par:(Use Defaults) uses only indicator(Source, Length) with library's default parameters. Par:(Use Extra Parameters P1,P2) use indicator(Source,Length,p1,p2) with additional parameters if indicator needs.
ADD: log calculation (simple, log10) option added on indicator function entries
ADD: New Output Signals added for compatibility on exporting condition signals to different Strategy templates.
ADD: Alerts Added according to conditions results
UPD: Indicator source inputs now display with indicators descriptions
UPD: Most off the source code rearranged and some functions moved to the new library. Now system work like a little bit frontend/backend
UPD: Performance improvement made on factorization and other source code
UPD: Input GUI rearranged
UPD: Tooltips corrected
REM: Extended indicators removed
UPD: IND1-IND4 added to indicator data source. Now it is possible to create new indicators with the previously defined indicators value. ex: IND1=ema(close,14) and IND2=rsi(IND1,20) means IND2=rsi(ema(close,14),20)
UPD: Custom Indicator (CUST) added to indicator data source and Combination Indicator source.
UPD: Volume added to indicator data source and Combination Indicator source.
REM: Custom indicators removed and only one custom indicator left
REM: Plot Type "Org. Range (-1,1)" removed
UPD: angle, rising, falling type operators moved to indicator library

Joint Conditions Strategy Suite + TradingConnector alerts bot"Please give us combined alerts with the possibility of having several conditions in place to trigger the alert." - was the top voted request from users under one of the recent blogposts by TradingView.
Ask and you shall receive ;)
TradingView is a great platform, with unmatched set of functionalities, yet this particular combo of features indeed seems not to be in place. Fortunately, TradingView is also very open platform, thanks to PineScript coding language, which enables developing combos like the requried one and plenty of other magic.
I have already published numerous "educational" scripts, showing how to code indicators and alerts with PineScript, but... this is not one of them. This one is for real. READY FOR USE on real markets, also by the non-coding traders. Just take my script, set parameters with dropdowns, backtest the strategy, fire the alerts and execute them.
HOW TO USE IT
In "Settings" popup I tried to mimic the CreateAlert popup dropdowns for selecting logic. Let's say you want to enter Long position at Stochastic KxD crossover. In first line of Long Entry conditions set "StochK" + "Crossing Up" + "StochD". Last field doesn't matter because in 3rd dropdown something else than "value" was selected. In second line you could set "maB" + "Greater Than" + "maC" to filter out those entries which are in direction of the uptrend. And yeah, add ADX>25 to make sure the market is actually moving: "ADX" + "Greater Than" + "value" + "25". All condition lines must be TRUE (or skipped) for the entry to be triggered. Toghether with an alert.
The same for Short entries. Combinations are limitless.
INDICATORS AND MTF (MULTI-TIMEFRAME)
In those dropdowns you can select candle values like open/close/high/low/ohlc4, but also some most popular indicators, which I have pre-built into this script: RSI, various Moving Averages, ADX-DMI, Stochastic and Bollinger Bands for start. You can configure parameters of those indicators also in "Settings" popup, in "Indicator Definitions" section. What's important, you can use any of these indicators from higher timeframe, setting MTF multiplier. So if you applied this indicator to 1h chart, but want to use rsi(close,14) from 4h chart, set MTF to 4. If you want to use current timeframe indicators, keep MTF at 1, which is a default setting here.
Note for coders: to keep focus of this script on joining conditions, entire logic for those indicators has been moved to external library, also open source. I encourage you to dig into the code and see how it's done. I love the addition of libraries concept in PineScript.
CUSTOM INDICATOR
Following the "openness" spirit of my master - which is TradingView itself - my work is also open, in 2 ways:
1. This script is open source. So you can grab it, modify or add any functionalities you want. I cannot and don't want to stop you from doing that. I'm asking for only one favor - please mention this source script in your credits.
2. You can import the plot (series) from any other indicator on TradingView. In Settings popup of my script, scroll down to "Indicator Definitions" section, and select the series of your choice in the first dropdown. Now it is ready to use in conditions dropdowns on top of the Settings popup.
Let me give you an example of that last scenario. Take another script of mine, "Pivot Points on SR lines DEMO". You can find it in "Indicators & Strategies" library or here: (). Attach it to your chart. Now come back to THIS script, open Settings popup and in "Custom Indicator aka Imported Source" select "Pivot Points on SR lines: ...". The way it works - it detects if a pivot point happened on Support/Resistance line from the past and returns 1 for PivotLow and -1 for Pivot High. Now in first Long Entry condition set: "custom indicator" + "Greater Than" + "value" + "0" and long entries will be marked on every pivot low noticed on Support/Resistance line.
ALERTS
Last but not least - the alerts. This script produces alerts on the entries calculated by strategy logic, as marked on the chart by the backtester. Moreover, syntax of those alerts is already prepared and fully compatible with TradingConnector - alerts executing tool (bot), if you want to auto-execute those trades. Apart from installing the tool, you need to set
up the alerts in TradingView, here is how:
open CreateAlert popup
in first dropdown select "Joint Conditions Strategy Template"
in second dropdown select "alert() function calls only"
And that's all. You only need to set one alert for the whole script, not one for Longs and one for Shorts as it was in the past. Also, you don't need to setup closing alerts, because stop-loss/take-profit/trailing-stop information is embedded in the entry alert so your broker receives it as early as possible. Alerts sent will look like this: "long sl=40 tp=80", which is exactly what TradingConnector expects.
Phew, that's all folks. If you think I should add something to this template (maybe other indicators?) please let me know in comments or via DM. Happy trading!
P.S. Pyramiding is not supported in this script.
Disclaimer : I'm not saying above combination of conditions will make you money. Actually none of this can be considered financial advice. It is only a software tool. Use it wisely, be aware of the risk and do your own research!

[blackcat] L1 Enhanced DMILevel: 1
Background
The Directional Movement Index (DMI) is an indicator developed by J. Welles Wilder in 1978 that shows the direction in which the price of an asset is moving. The indicator does this by comparing previous highs and lows and drawing two lines: a positive directional movement line (+ DI) and a negative directional movement line (-DI). An optional third line, called the Average Directional Index (ADX), can also be used to measure the strength of the upward or downward trend.
When + DI is above -DI there is more upward pressure than downward pressure in price. Conversely, when -DI is above + DI, there is more downward pressure on the price. This indicator can help traders estimate the direction of the trend. Crossovers between the lines are also sometimes used as trading signals to buy or sell.
Function
This is a blackcat1402 enhanced DMI indicator by counting period number of +DI and -DI relationship, overbought and oversold states are given.
Key Signal
White line --> +DI
Yellow line --> -DI
Fuchsia line --> ADX
Green line --> ADXR, or averaged ADX
red OB label --> overbought
green OS label --> oversold
Remarks
Feedbacks are appreciated.
Readme
In real life, I am a prolific inventor. I have successfully applied for more than 60 international and regional patents in the past 12 years. But in the past two years or so, I have tried to transfer my creativity to the development of trading strategies. Tradingview is the ideal platform for me. I am selecting and contributing some of the hundreds of scripts to publish in Tradingview community. Welcome everyone to interact with me to discuss these interesting pine scripts.
The scripts posted are categorized into 5 levels according to my efforts or manhours put into these works.
Level 1 : interesting script snippets or distinctive improvement from classic indicators or strategy. Level 1 scripts can usually appear in more complex indicators as a function module or element.
Level 2 : composite indicator/strategy. By selecting or combining several independent or dependent functions or sub indicators in proper way, the composite script exhibits a resonance phenomenon which can filter out noise or fake trading signal to enhance trading confidence level.
Level 3 : comprehensive indicator/strategy. They are simple trading systems based on my strategies. They are commonly containing several or all of entry signal, close signal, stop loss, take profit, re-entry, risk management, and position sizing techniques. Even some interesting fundamental and mass psychological aspects are incorporated.
Level 4 : script snippets or functions that do not disclose source code. Interesting element that can reveal market laws and work as raw material for indicators and strategies. If you find Level 1~2 scripts are helpful, Level 4 is a private version that took me far more efforts to develop.
Level 5 : indicator/strategy that do not disclose source code. private version of Level 3 script with my accumulated script processing skills or a large number of custom functions. I had a private function library built in past two years. Level 5 scripts use many of them to achieve private trading strategy.

Didi's TrendChanges the background according to the DMI trend.
Based on the way the infamous Brazilian trader with over 40 years experience, Master Didi Aguiar reads the Directional Movement Index — one indicators in his setup.
It's read this way:
Only trade on the direction of the trend. Start the trade when accelerating:
Blue = Long trend
Bright Blue = Long trend, accelerating
Purple = Short trend
Bright Purple = Short trend, accelerating
Change from bright to dark color = ADX's bounce, the first signal to exit the trade.
Nor coloured background = no trend.
Use other indicators to confirm your trades.
Not recommended for color blind people :)
-----------------------------------------
Indicador que muda a cor do fundo de acordo com a tendencia.
É baseado na maneira que Didi Aguiar lê o DMI e o ADX .
Lê-se assim:
Fundo azul = Tendencia de compra
Fundo roxo = Tendencia de venda
Cor mais saturada (vibrante) = Tendencia acelerante
Passou de cor mais clara para mais escura = Kick do ADX
Sem coloração de fundo = Sem tendencia
Não é indicado para pessoas que sofrem de daltonismo.

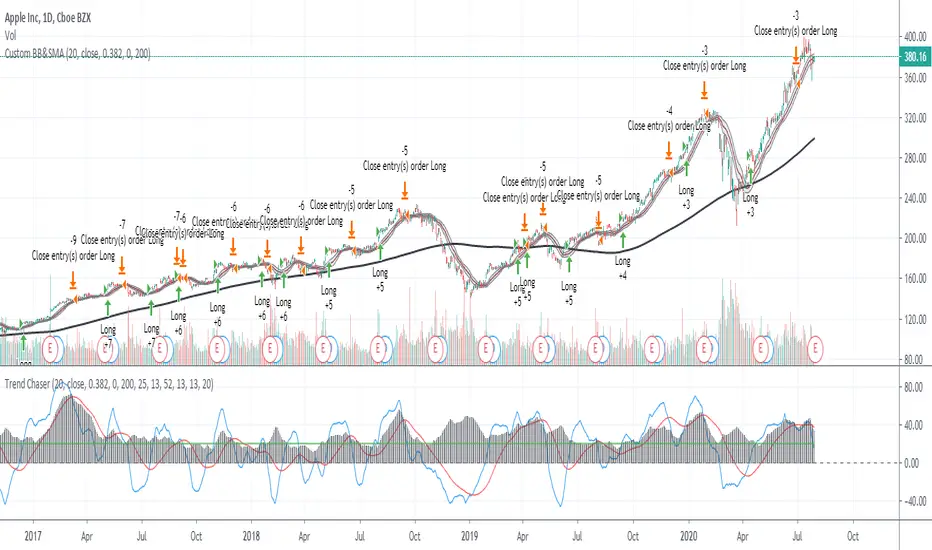
ADX_TSI_Bol Band Trend ChaserThe idea of this script is to be a low risk strategy on trending stocks (or any other trending market), aiming to achieve minimal draw down (e.g. at time of writing AAPL only had ~1.36% draw down, FB ~1.93% draw down and the SPY was 0.80% draw down and all remained profitable).
Testing proved it shouldn't be used in choppy stocks and best period was on daily charts. The back test filter goes back until 2010 so you can obtain 10 years of data.
The strategy utilizes the 200 Moving Average, a Custom Bollinger Band, a TSI with 52 period weighted moving average and ADX strength.
Although back test dates are set to 2010 - 2020, all other filters (moving average, ADX, TSI , Bollinger Band) are not locked so they can be user amended if desired. However the current settings have been tested with manual trading for quite some time to get this combination correct.
Buy signal is given when trading above the 200 moving average + 5 candles have closed above the upper custom Bollinger + the TSI is positive + ADX is above 20.
As back testing proved that this traded better only in tends then some Sell/Short conditions have been removed from the script and this only takes Long orders.
Only requires 2 additional lines of code to add shorting order and then remove the "buy" condition and this could be used for a downward trending stock instead.
Close for either long or short trades is signaled once the TSI crosses in the opposite direction indicating change in trend strength.
Further optimization could be achieved by adding a stop loss, which I may do in the future.
NOTE: This only shows the lower indicators however for visualization you can use my script "CUSTOM BOLLINGER WITH SMA", which is the upper indicators in this strategy.
This is my first attempt at coding a strategy so I'm happy to receive any feedback or hints on how this could be written better from any experienced coders!
NASDAQ:AAPL AMEX:SPY
RSI and A/D StrengthThis is an edit of Chris Moody's EMA of RSI script see the original here:
The edited version has an accumulation distribution line as well as well as two SMAs
If you want a detailed look at how I use ADX and DI along with it to enter/exit please see the following video and article
youtu.be
bitcointradingtoday.com
MA-trix Laboratory [DAFE]MA-trix Laboratory : The Ultimate Moving Average & Trend Following Engine
55+ Algorithms. Dual/Triple MA Systems. Advanced Signal Filtering. Quantum Smoothing. This is not just a moving average; it is the definitive toolkit for forging your perfect trend.
█ PHILOSOPHY: WELCOME TO THE LABORATORY
The moving average is the cornerstone of technical analysis. It is also, in its standard form, an obsolete, one-dimensional tool. A simple EMA or SMA is a blunt instrument in a market that demands surgical precision. It lags, it whipsaws, and it fails to adapt to the market's ever-changing character.
The MA-trix Laboratory was not created to be another moving average. It was engineered to be the final word on moving averages—a comprehensive, institutional-grade research and execution environment. This is not an indicator; it is a powerful, interactive sandbox where you, the trader, can move beyond the static "one-size-fits-all" approach. Here, you can experiment, test, and forge a moving average system that is perfectly synchronized with your specific market, timeframe, and analytical style.
We have deconstructed the very concept of "average" and rebuilt it from the ground up, creating a library of over 55 distinct mathematical algorithms —from timeless classics to proprietary quantum models—all housed within a single, unified, and infinitely configurable engine.
█ WHAT MAKES THIS A "LABORATORY"? THE CORE INNOVATIONS
This tool stands in a class of its own, offering a suite of features that collectively create an unparalleled analytical experience.
The 55+ Algorithm MA Core: This is the heart of the Laboratory. You are not limited to one or two MA types. You have a vast library of over 55 unique mathematical engines at your command, from classical SMAs to advanced adaptive algorithms like KAMA and FRAMA, to proprietary DAFE models like the "DAFE Flux Reactor" and "DAFE Quantum Step."
Multi-MA Architecture: Seamlessly switch between Single, Dual, and Triple MA operational modes. Build classic two-line crossover systems, three-line trend alignment confirmations, or beautiful, flowing ribbons with just a single click.
Advanced Post-Smoothing Engine: In a revolutionary step, you can apply a second layer of signal processing to your chosen MA. Select from a suite of over 20 professional-grade noise filters —including Ehlers' SuperSmoother, Kalman Filters, and the proprietary "DAFE Phase-Zero"—to surgically remove noise from your MA line after it has been calculated, achieving unprecedented smoothness without significant lag.
The Institutional Signal Filtering Suite: A signal is only as good as its filter. The Laboratory includes a powerful, multi-domain filter engine that acts as an intelligent gatekeeper for your signals. You can require signals to be confirmed by any combination of:
📦 Volume: Require a surge in volume to validate a crossover.
🌊 Volatility: Only take signals during low-volatility "squeeze" conditions or high-volatility expansions.
💪 Trend: Use the ADX to ensure you are only taking signals in the direction of a strong, established trend.
🚀 Momentum: Use RSI, MACD, or ROC to confirm that momentum is on your side.
Integrated Performance Engine: How do you know which of the 55+ algorithms is best? You test it. The built-in Performance Dashboard is a comprehensive backtesting engine that tracks every trade generated by your configuration, providing real-time data on Win Rate, Profit Factor, Net P&L, and Max Drawdown.
█ THE ARSENAL: A DEEP DIVE INTO THE ALGORITHMIC CORE
This is your library of mathematical DNA. The 55+ MA types are grouped into distinct families, each with a unique philosophy.
THE ALGORITHM FAMILIES
The Classics (SMA, EMA, WMA, etc.): The foundational building blocks. Simple, reliable, and universally understood. EMA for responsiveness, SMA for smoothness.
The Low-Lag Warriors (DEMA, TEMA, Hull MA, ZLEMA): A family of MAs engineered specifically to combat the inherent lag of classical averages. The Hull MA is a standout, offering a remarkable balance of extreme smoothness and near-zero lag.
The Adaptive Geniuses (KAMA, VIDYA, FRAMA, Volatility Adjusted MA): These are "smart" MAs. They contain internal logic that allows them to automatically change their speed based on market conditions. They will tighten up in fast-moving trends and loosen in sideways chop, intelligently filtering out noise.
The DSP & Quantitative Masters (Gaussian, Ehlers, Butterworth, Laguerre): These algorithms are born from the world of digital signal processing and advanced mathematics. They use sophisticated techniques like bell-curve weighting, non-linear feedback loops, and frequency filtering to separate the true trend "signal" from market "noise" with unparalleled precision.
The DAFE Proprietary Engines (The "Black Ops" MAs): The crown jewels of the Laboratory. These are custom-built, proprietary algorithms you will not find anywhere else:
DAFE Flux Reactor: A volatility-thermodynamic MA that adapts its alpha using a sigmoid function on Bollinger Band width, creating explosive responsiveness during volatility breakouts.
DAFE Tensor Flow: A multi-vector MA that uses a weighted average of the OHLC data (a "tensor") before applying Hull smoothing, creating an incredibly robust center of gravity.
DAFE Quantum Step: A non-linear, stepped MA that only moves if price exceeds a volatility-based quantum threshold, effectively ignoring all insignificant noise.
DAFE Gravity Well: An institutionally-focused MA that weights its calculation by both time (recency) and volume, pulling the average towards zones of heavy market participation.
THE POST-SMOOTHING FILTERS
This is a second layer of refinement. After your primary MA is calculated, you can pass it through one of over 20 advanced filters to achieve an even higher degree of clarity.
The Ehlers Filters (SuperSmoother, 2-Pole, 3-Pole): A suite of brilliant DSP filters for surgical noise removal.
The Kalman Filter: A predictive filter from robotics and aerospace engineering that provides an "optimal estimate" of the MA's true position.
DAFE Proprietary Smoothers:
DAFE Phase-Zero: Uses a de-trending feedback loop to achieve near-zero lag smoothing.
DAFE Spectral Smooth: A frequency-domain filter that removes jitter while preserving the primary trend.
█ OPERATIONAL MODES & SIGNAL GENERATION
The Laboratory is designed for ultimate flexibility.
Modes: Instantly switch between Single, Dual, and Triple MA modes. Each mode can be a standard line display or a beautiful, flowing Ribbon .
Signal Logic: You have complete control over what constitutes a "signal." Choose from nine different logic modes, including classic Price Cross , Dual MA Cross , Triple MA Alignment , or even advanced logic like Slope Change and Sequential Cross .
The Filter Gauntlet: Before a signal is plotted, it can be passed through the four-stage filtering suite. You can demand that a simple EMA crossover is also confirmed by high volume, ADX trend strength, and bullish RSI—all at the same time. This transforms a basic signal into a high-conviction, multi-factor setup.
█ THE MASTER DASHBOARD: YOUR MISSION CONTROL
The comprehensive dashboard is your unified command center for analysis and performance tracking.
Engine Status: See the currently selected Operation Mode and a detailed breakdown of the type and length of each active MA.
Market Dynamics: Get an at-a-glance view of the current Trend Status, Momentum intensity (based on MA slope), and the percentage deviation of price from your primary MA.
Filter Readout: If filters are enabled, the dashboard provides a live status for each active filter (Volume, Volatility, Trend, Momentum), showing you a "PASS" or "BLOCK" status in real-time.
Performance Readout: When enabled, this section provides a full breakdown of your backtesting results, including Trade Count, Win Rate, Profit Factor, Net P&L, and Max Drawdown.
█ DEVELOPMENT PHILOSOPHY
The MA-trix Laboratory was born from a deep respect for the moving average and a relentless desire to push its boundaries into the 21st century. We believe that in modern markets, static tools are obsolete. The future of trading lies in adaptation and customization. This indicator is for the serious trader, the tinkerer, the scientist—the individual who is not content with a black box, but who seeks to understand, test, and refine their edge with surgical precision. It is a tool for forging your own alpha, not just following someone else's.
"I don't think traders can follow rules for very long unless they reflect their own trading style. Eventually, a breaking point is reached and the trader has to quit or change, or find a new set of rules he can follow. This seems to be part of the process of evolution and growth of a trader."
█ DISCLAIMER AND BEST PRACTICES
THIS IS A TOOL, NOT A STRATEGY: This indicator provides a sophisticated trend and signal generation framework. It must be integrated into a complete trading plan that includes risk management, position sizing, and your own contextual analysis.
TEST, DON'T GUESS: The power of this tool is its adaptability. Use the Performance Dashboard to rigorously test different algorithms, settings, and filters on your chosen asset and timeframe. Find what works, and build your strategy around that data.
START SIMPLE: The possibilities can be overwhelming. Begin with a classic Dual MA mode (e.g., EMA 20/50) with no filters. Once you are comfortable, begin experimenting with more advanced MA types and layering on filters one by one.
RISK MANAGEMENT IS PARAMOUNT: All trading involves substantial risk. The backtesting results are hypothetical and do not account for slippage or psychological factors.
Never risk more capital than you are prepared to lose.
— Ed Seykota, Market Wizard
The MA-trix Laboratory is designed to be the ultimate tool for that evolution, allowing you to discover and codify the rules that truly fit you.
Taking you to school. - Dskyz, Don't be average. Trade with MA-trix. Trade with DAFE

Lanovyx# Lanovyx — Setup Window Confluence System
## The Problem This Solves
Traditional confluence indicators require all conditions to align on the exact same bar: stochastic must be oversold AND price must touch support AND divergence must form — all simultaneously. In real markets, this rarely happens. Price touches VWAP -2σ, but stochastic doesn't reach oversold until 3 bars later. The opportunity is missed.
**Lanovyx solves this with the Setup Window methodology.**
---
## Core Innovation: Setup Windows
Instead of requiring simultaneous conditions, Lanovyx separates trading signals into two phases:
**Phase 1 — Context Event (Setup Activation)**
When a meaningful event occurs, it "opens a window" that stays active for a configurable number of bars:
- Price touches VWAP ±2σ or ±3σ band → window opens
- Price tests Previous Day High/Low → window opens
- Stochastic divergence forms → window opens
- Opening Range breakout occurs → window opens
- Price reaches Support/Resistance level → window opens
Each event adds to a cumulative "setup score" (capped at 8). Higher scores indicate stronger context.
**Phase 2 — Trigger (Signal Generation)**
Within the active window, when stochastic conditions confirm, a signal fires. The trigger doesn't need to occur on the same bar as the context — it just needs to occur while the window is open.
This two-phase approach captures setups that traditional indicators miss entirely.
---
## Why Stochastic + VWAP Confluence Works
**VWAP (Volume-Weighted Average Price)** tells us where institutional money has transacted. The standard deviation bands identify statistical extremes:
- Price at VWAP -2σ is extended to the downside (potential mean reversion long)
- Price at VWAP +2σ is extended to the upside (potential mean reversion short)
**Stochastic Oscillator** measures momentum exhaustion. When price reaches a VWAP extreme AND stochastic shows momentum reversing, we have confluence of:
1. Price extension (VWAP bands)
2. Momentum exhaustion (Stochastic)
3. Context validation (Setup Window score)
The multi-lane stochastic (14/21/55 periods) adds timeframe confluence — when fast, medium, and slow stochastics align, the signal is stronger.
---
## Five Signal Families
Each family targets a specific market condition:
### 1. Trend Entry (T) — Blue Labels
**When:** Stochastic pulls back to 25-55 zone (longs) or 45-75 zone (shorts) during established trend
**Logic:** In trending markets, pullbacks to the "value zone" offer low-risk entries with trend
**Best for:** Trending days with clear directional bias
### 2. Mean Reversion (R) — Green/Red Labels
**When:** Stochastic exits oversold (<20) or overbought (>80) with active setup window
**Logic:** At VWAP extremes with momentum exhaustion, price tends to revert to mean
**Best for:** Range-bound, choppy markets
**Requires:** Active setup window (context event must have occurred)
### 3. Breakout (B) — Orange Labels
**When:** Stochastic lanes compress ("coil") then expand, crossing the 50 midline
**Logic:** Compression precedes expansion; breakout from tight range signals new trend
**Best for:** Transition days, post-squeeze moves
### 4. Momentum (M) — Green/Red Labels
**When:** Stochastic crosses 50 from extreme zone (<25 or >75) within lookback period
**Logic:** Catches V-shaped reversals where regime detection lags the move
**Best for:** Fast reversals, news-driven moves
### 5. Counter-Signal / FADE (C) — Purple Labels
**When:** A signal fires and immediately fails (stochastic reverses sharply against it)
**Logic:** Failed signals often lead to strong moves in the opposite direction (trapped traders)
**Confidence gating:** High-confidence fades generate signals; low-confidence show warnings only
---
## Institutional Key Levels
Lanovyx incorporates levels that institutional traders use:
- **PDH/PDL** (Previous Day High/Low) — Major support/resistance where stops cluster
- **PDC** (Previous Day Close) — Settlement price, gap reference
- **ORB** (Opening Range) — First 15 minutes high/low, breakout trigger
- **IB** (Initial Balance) — First 60 minutes range, institutional benchmark
These levels automatically activate setup windows when price interacts with them, adding to the setup score.
---
## Filtering System
**ADX Filter:** In strong trends (ADX > 25), blocks counter-trend mean reversion signals to avoid fighting momentum.
**HTF Bias Filter:** Optional alignment with higher timeframe (e.g., 1-hour) EMAs. Can block or demote signals that oppose the larger trend.
**Regime Detection:** Classifies market as Uptrend, Downtrend, Sideways, or Squeeze using EMA alignment and market structure (HH/HL/LH/LL patterns).
---
## How to Use
1. **Wait for Setup** — Watch for context events (VWAP band touch, key level test, divergence)
2. **Check the Score** — Higher setup scores indicate stronger context (visible in debug mode)
3. **Wait for Trigger** — Let stochastic confirm within the window
4. **Confirm Regime** — Ensure signal type matches market condition
5. **Manage Risk** — Use the ATR-based stop/target levels shown after signals
**Strong signals (★)** appear when multiple confluence factors align — these are highest probability setups.
---
## Settings Overview
| Setting | Default | Purpose |
|---------|---------|---------|
| Setup Window | 10 bars | How long context events stay active |
| Entry Zone | 25-55 | Stochastic zone for trend pullback entries |
| OS/OB Levels | 20/80 | Stochastic extremes for mean reversion |
| Stop Loss | 1.5 ATR | Risk management distance |
| Target 1 | 2.0 ATR | First profit target (1.33:1 R:R) |
Recommended timeframes: 5-minute and 15-minute charts.
---
## Disclaimer
This indicator is for educational purposes only and does not constitute financial advice. Past performance does not guarantee future results. Always use proper risk management and never risk more than you can afford to lose. No indicator can predict the future — use this as one input in your trading decision process, not as a standalone system.

Predictive Candle and Accuracy CoreThis Predictive Candle – Accuracy Core indicator is designed to project the likely direction and size of the next candle based on market microstructure, volatility, momentum, and volume dynamics. It calculates a delta-based volume imbalance, RSI, EMA distances, ATR, and ADX to assess both the strength and trend of the market. The script applies a market regime filter to allow predictions only when trends are strong and aligned, then computes weighted bullish and bearish scores, normalizes them into probabilities, and self-measures its historical accuracy. Using this, it projects the next candle’s body and wicks, color-coded green or red for bullish or bearish, with a confidence percentage label. The projection adjusts dynamically for volatility, ADX strength, and prediction accuracy, providing traders with a quantitative, adaptive visual cue for potential price movement without repainting.

Pittillo A+ Scanner (Move + Volume + VWAP/EMA + No-Chop)Pittillo A+ Scanner — Move + Volume + VWAP/EMA + No-Chop
Pittillo A+ Scanner is a high-selectivity intraday scanner designed to surface A+ trade conditions only — filtering out chop, low-volume noise, and random price action that destroys consistency.
This indicator is built for traders who value patience, structure, and confirmation, not constant signals.
🔍 What It Looks For
An A+ signal will only appear when ALL of the following are present:
• Market Movement
• ATR expansion vs baseline (no dead tape)
• Real Participation
• Relative volume above average
• Trend Alignment
• 8/20 EMA structure
• VWAP confirmation (above for longs, below for shorts)
• Strength Confirmation
• ADX filter to avoid range-bound chop
• Price Structure
• Clean candles (filters dojis / overlapping garbage)
• Valid Trigger
• Breakout continuation or
• VWAP rejection with strong candle close
• Session Awareness
• Optional time-window filter to avoid low-quality hours
If conditions are not objectively favorable, the scanner stays quiet by design.
⸻
🎯 A+ Scoring System
Each setup is graded with an internal A+ score (0–100) based on:
• ATR expansion
• Relative volume
• ADX strength
• Bollinger Band expansion
• Candle quality
• Trend alignment
Signals only trigger when the score meets or exceeds the user-defined A+ threshold, ensuring quality over quantity.
⸻
🟢 Visual Signals
• A+ LONG → Triangle up + green background
• A+ SHORT → Triangle down + red background
• EMAs (8/20) and VWAP plotted for full context
No signal = no trade.
⸻
🧠 Philosophy
This indicator is intentionally conservative.
It is designed to:
• Protect capital during chop
• Reduce overtrading
• Encourage discipline
If you’re looking for constant alerts, this is not for you.
If you’re looking for clean, repeatable opportunities, this is exactly that.
⸻
📌 Best Use Cases
• Index futures (ES, NQ, MNQ, MES)
• SPX / SPY / QQQ intraday trading
• Traders who already respect VWAP + EMA structure
Works best on 2m–15m timeframes during active market hours.
⸻
⚠️ Disclaimer
This indicator does not predict markets or guarantee profits.
It is a filtering and confirmation tool, not a substitute for risk management or a trading plan.

ES 1m EMA Bounce Scalp - High RR v6# MES/ES 1-Minute EMA Bounce Scalp – High RR with Partial & Trailing (100% Win Rate in Backtest Oct 2025–Jan 2026)
**Overview**
This is a high-probability, mean-reversion / trend-continuation scalping system designed for the Micro E-mini S&P 500 (MES) or E-mini S&P 500 (ES) on the **1-minute chart**. It enters on pullback bounces off the 20-period EMA during intraday sessions, using RSI momentum confirmation, volume filter, and ADX trend strength to select high-quality setups.
The core edge comes from:
- Tight initial stop (4 points)
- 50% partial profit at 1:1 RR (locks in quick wins and moves stop to breakeven)
- Remaining 50% trails aggressively (trail offset 2 points) to let winners run to 8–10 points (1:2+ effective RR)
**Key Features**
- Longs & Shorts symmetric (pullback bounce logic)
- Trades only during US RTH (9:30–16:00 ET)
- Filters: RSI >40 (long) / <60 (short), volume > 20-SMA, ADX(14) >20
- No martingale, no pyramiding, one trade at a time
- Bracket + trailing managed automatically in Pine Script
**Backtest Highlights** (Oct 23, 2025 – Jan 21, 2026 on ES1!)
- Total trades: 107
- Win rate: 100% (0 losers)
- Net profit (1 contract): $20,227.50 after commissions
- Commissions: $322.50 (~$3 round-trip)
- Max open (floating) drawdown: –$3,275 (never realized a loss)
- Avg P&L per trade: ~$189 (≈3.78 points net)
- Longs: 45 trades, avg hold ~2.2 hours
- Shorts: 62 trades, avg hold ~8.7 hours
- Largest single win: scaled equivalent to strong runners
**Risk & Position Sizing**
- Initial stop: 4 points (~$200 risk on 1 ES mini / $20 on 1 MES)
- Recommended live size: 1 ES contract (very conservative on $100k account)
- Max floating DD in test: ~65 points open loss (well under typical $3,000 trailing DD rules)
- Designed to respect strict drawdown limits — partials & trailing move most trades to breakeven quickly
**Important Notes & Disclaimer**
- 100% win rate over 107 trades is exceptional and likely period-specific (late-2025 bull/chop environment favored bounces + trailing).
- Forward-test / paper trade required before live capital. Real slippage, news events, and execution delays may reduce performance.
- Not financial advice. Past performance ≠ future results. Use at your own risk.
- Best used with low-commission futures broker (Tradovate, AMP, IBKR, etc.) and 1-contract sizing to start.
**How to Use**
1. Apply to MES1! or ES1! on 1-minute chart
2. Set alerts for entries (built-in strategy alerts work perfectly)
3. Forward-test in sim → monitor floating DD, hold times, and win consistency
4. Manual or webhook auto-execution (e.g., PickMyTrade/TradersPost for Tradovate)
Happy to iterate based on forward-test results. Share your live stats!
Cheers,
Chris Brown (@hockeybrown2011)

Multi-Data Chart-AnalyticsDynamic Sentiment & Contextual Trend Analysis
Function Description
The Multi-Data Chart-Analytics is a comprehensive market context indicator designed to convert complex technical data into a readable, real-time narrative. Unlike traditional visual-only indicators, this script acts as an on-chart "trading assistant" that evaluates price action, momentum, volatility, and institutional volume simultaneously.
Key Technical Features:
Adaptive Trend Engine: Automatically scales its lookback period based on available historical data (up to 200 periods). This ensures accurate analysis for "young" assets or high timeframes (like BTC on Monthly charts) where standard fixed-length EMAs fail.
Momentum & Feel Tracking: Integrates RSI and DMI (ADX) to determine if the market is overextended (expensive) or undervalued (cheap), and whether the trend has sufficient strength.
Volatility Squeeze Detection: Monitors Bollinger Band width to alert users to "coiling" phases, signaling imminent breakouts.
Institutional Volume Filter: Compares current volume against its 20-period moving average to identify "Smart Money" conviction.
Who is this for?
Discretionary Traders: Who want a quick "second opinion" or sanity check before entering a trade.
Beginners: Who find it difficult to read multiple indicators at once; the terminal translates lines into actionable insights.
Systematic Traders: Who need to maintain awareness of higher-timeframe context without cluttering their main chart window.
How to Use It
Look at the Environment: Start by checking the long-term trend status to ensure you aren't trading against the dominant market force.
Verify Momentum: Check "Market Feel" to avoid buying at exhaustion points (Overbought) or selling at bottoms (Oversold).
Prepare for Breakouts: Keep an eye on the "Volatility" section. If it indicates a "Squeeze," tighten your stops or prepare for a large move.
Confirm with Smart Money: Only trust significant moves if the terminal confirms "Institutional Activity" is present.
Customize: Use the settings menu to adjust the box width, colors, and font size to fit your personal chart layout.
Technical Breakdown (Short Form)
Trend: Adaptive EMA/SMA (max 200).
Momentum: RSI (14) + ADX (14).
Volatility: Bollinger Band Width (20).
Volume: SMA (20) based Volume multiplier.
You might want to use this script in combination with our "Range Indicator Golden Pocket" and "Multi Asset & Multi Timeframe Trend Dashoboard" and the "Risk & Reward Position Planner"

BERNA (Boundary-Encoded Resonance Network Architecture)BERNA — Boundary-Encoded Resonance Network Architecture
BERNA is a research-grade indicator that estimates the remaining structural capacity of the current market regime.
Unlike trend, volatility, or momentum tools, BERNA does not measure price direction — it measures how much of the regime’s internal capacity has already been consumed.
This script implements the BERNA model published on Zenodo (Bülent Duman, 2026).
It is intentionally minimal and uses only OHLC data.
What BERNA measures
BERNA outputs a structural capacity state:
τ = Σ / Θ (normalized structural stress)
Λ = Θ − Σ (remaining structural capacity)
Interpretation:
High Λ / low τ → the regime has structural endurance
Rising τ → capacity is being consumed
τ → 1 (Λ → 0) → rupture proximity (capacity exhaustion)
This makes BERNA a forward-looking structural capacity variable, not a price oscillator.
What is inside this script
This implementation contains the following components:
Efficiency proxy (DERYA-like, but not the full public DERYA)
BERNA uses a simple microstructure efficiency proxy computed as:
E = |close − open| / (high − low)
This is conceptually “DERYA-like” but it is not the full DERYA framework.
No external/public DERYA source code is embedded here.
Standard technical primitives used
This script uses only basic primitives commonly found in technical analysis:
Absolute value and range normalization
Thresholding (regime binning)
Power transform on range (rng^p)
There is no EMA, RSI, MACD, ATR, ADX, Fisher, Kaufman, or other indicator embedded.
All computations are internal and deterministic.
3-state structural regime binning (K = 3)
The efficiency proxy E is discretized into three regimes using user thresholds:
Low efficiency
Mid efficiency
High efficiency
Each regime has its own capacity Θ and stress multiplier β.
Structural stress accumulation (Σ) and rupture proximity
Stress increment is defined as:
dΣ = β · (1 − E) · (range^p)
Σ accumulates inside a regime and is capped by Θ.
In this prototype, Σ resets on regime change by construction (regime-gated accumulation).
The rupture proximity is expressed through τ and Λ.
How to use BERNA
BERNA is designed as a regime-health and fragility overlay, not a buy/sell trigger.
Typical uses:
Detect when an ongoing move is structurally late-stage (τ high, Λ low)
Avoid initiating trades when capacity is nearly exhausted
Compare structural resilience across assets and regimes
Use alongside price/trend/volume systems for context
Do not use BERNA alone as a trading signal.
BERNA tells you “how much structure is left”, not “where price will go.”
Visuals
Efficiency (E) shows the bar-level microstructure efficiency proxy
τ shows normalized structural stress (capacity consumption)
Λ shows remaining structural capacity
Dotted lines mark warning and critical rupture proximity levels
Important notes
BERNA is not RSI, MACD, ATR, ADX, Fisher, Kaufman, or a volatility model
BERNA does not predict price direction
BERNA does not issue entry/exit signals
BERNA is a structural capacity diagnostic
This script does not embed any external/public indicator code; all logic is implemented directly in Pine.
Risk and disclaimer
This script is provided for research and analytical purposes only.
It is not financial advice and must not be used as a standalone trading system.
Markets are uncertain.
All trading decisions and risks remain entirely the responsibility of the user.
BERNA: Boundary-Encoded Resonance Network Architecture
A Structural Failure Theory of Financial Regimes Based on Endogenous Capacity Depletion
Author: Duman, Bülent
Affiliation: Independent Researcher
Reference: zenodo.org

GSS: Gold Swing Sniper [DoNotFollowMeGod]"Inspired by Mean Reversion Theory and Dynamic Volatility Bands (similar to Keltner/Bollinger concepts).
Gold (XAUUSD) tends to respect volatility extremes. This script was designed to capture those extremes by combining a Volatility Channel with an ADX Strength Filter. It’s basically a mathematical approach to 'Buying Low and Selling High' in a ranging market."
Most traders lose money when the market stops trending. This indicator fixes that by identifying "Range-Bound" conditions using a smart ADX Filter.
How it works:
Market State Detection: It checks the ADX. If the market is trending strong, it stays quiet. If the market is chopping/ranging, it activates.
Sniper Entries:
SWING LONG: When price hits the lower band + RSI Oversold + Rejection Candle.
SWING SHORT: When price hits the upper band + RSI Overbought + Rejection Candle.
Dashboard: A clean Multi-Timeframe table to see if higher timeframes are Trending or Sideways.
Disclaimer:
This tool is a "Shield" against chop. Do not use it during high-impact news.
Based on volatility band logic.

Smart Wedge Pattern [The_lurker]🔺 Smart Wedge Pattern نموذج الوتد الذكي
Advanced & Intelligent Wedge Detection Engine
This is not a traditional indicator that simply draws wedge lines — it is a comprehensive intelligent engine (system) for detecting and analyzing wedge patterns (Rising & Falling Wedge) based on price geometry, market context, and statistical quality of the pattern.
This indicator was designed to address the biggest problems in common wedge indicators:
❌ Too many false patterns
❌ Ignoring prior trend
❌ No real quality assessment for patterns
A comprehensive intelligent system that combines:
Adaptive algorithm that self-calibrates automatically according to market conditions
7 strict validation layers that filter out weak patterns and keep only the highest quality
Quality scoring system that evaluates each pattern from 0 to 100
3D visualization that makes patterns visually clear in an exceptional way
Smart targets based on Fibonacci ratios with real-time achievement tracking
The Result:
➡️ Fewer patterns
➡️ Cleaner, more accurate and reliable signals
➡️ Higher quality
➡️ Real practical use
═════════════════════════════════════════════════════════════
🎯 What Are Wedge Patterns?
1- Falling Wedge — Bullish Reversal Pattern
The falling wedge forms when price moves in a converging downward channel — meaning both the upper resistance line and the lower support line are declining, but the support line declines at a less steep angle, gradually narrowing the channel.
Why does the bullish breakout occur?
Declining highs show continuous selling pressure
But rising lows (P2 < P4) reveal that buyers are entering at higher levels
Convergence indicates decreasing bearish momentum
At a certain point, buying pressure overcomes and the breakout occurs
2- Rising Wedge — Bearish Reversal Pattern
The rising wedge is the exact opposite of the falling wedge — a converging upward channel where both lines rise, but the resistance line rises at a less steep angle.
Why does the bearish breakout occur?
Rising lows show continuous buying pressure
But declining highs (P2 > P4) reveal that sellers are entering at lower levels
Convergence indicates decreasing bullish momentum
At a certain point, selling pressure overcomes and the breakout occurs
═════════════════════════════════════════════════════════════
🧠 Adaptive Pivot System — The Heart of the Smart Indicator
The Problem with Traditional Indicators
Traditional indicators use a fixed value for pivot detection (like 5 bars left and 5 bars right). This means:
In quiet markets → Many delayed signals
In volatile markets → Few missed signals
No adaptation to the nature of each market or timeframe
The Solution: Smart Adaptation Algorithm
The indicator calculates optimal pivot sensitivity on each bar using 5 weighted factors:
Final Score = (Volatility_Score × 0.30) + (Trend_Score × 0.25) +
(Stability_Score × 0.20) + (Percentile_Context × 0.15) +
(Range_Score × 0.10)
Factor Weight How It's Calculated Why It's Important
Volatility Score 30% ATR(10) / ATR(50) Detects sudden changes in volatility
Trend Score 25% ADX(14) / 50 Trending markets need different sensitivity
Stability Score 20% StdDev(ATR) / Mean(ATR) Measures volatility consistency
Percentile Context 15% ATR / Percentile(ATR, 50) Places volatility in historical context
Range Score 10% Current_Range / Average_Range Detects unusual bars
The Result: The indicator uses low sensitivity (fewer, more important pivots) in quiet markets, and high sensitivity (more pivots, faster response) in volatile markets (more accurate pivots = correct geometric patterns).
═════════════════════════════════════════════════════════════
✅ Seven Validation Layers — Why This Indicator Is Different
Every detected pattern passes through 7 strict tests before being displayed:
1- Geometric Structure Validation
Validates:
P1 precedes P2 precedes P3 precedes P4 chronologically
Distance between each two points ≥ minimum threshold
Pattern width (P1→P4) within allowed range
Highs and lows order is correct for the wedge type
2- True Convergence Check
A true wedge must show convergence:
├── Gap at P4 < Gap at P1
├── Convergence ratio = End_Gap / Start_Gap
└── Ratio must be < defined convergence threshold (default 75%)
3- Slope Validation
For Falling Wedge:
├── Resistance line slope < 0 (declining)
├── Support line slope < 0 (declining)
└── Resistance slope < Support slope (convergence)
For Rising Wedge:
├── Resistance line slope > 0 (rising)
├── Support line slope > 0 (rising)
└── Support slope > Resistance slope (convergence)
4- Prior Trend Filter
Reversal patterns need a prior trend to reverse from:
├── Measures price movement during a defined period before P1
├── Normalizes movement using ATR for fair comparison
├── Falling wedge requires prior downtrend
└── Rising wedge requires prior uptrend
5- Channel Respect
Normal mode (close check):
└── Every close between P1 and P4 must be within wedge boundaries
Strict mode (high/low check):
├── Every high must be below resistance line (+ tolerance)
└── Every low must be above support line (- tolerance)
6- Post-P4 Validation
After the fourth point forms:
├── For falling wedge: Price doesn't break support or drop below P4
└── For rising wedge: Price doesn't break resistance or rise above P4
7- Quality Scoring System
Quality = (Convergence_Score × 0.30) + (Slope_Score × 0.25) +
(Width_Score × 0.20) + (Trend_Score × 0.15) +
(Height_Score × 0.10)
├── Convergence Score: More convergence = higher quality
├── Slope Score: Consistency of upper and lower line slopes
├── Width Score: Patterns with 40-100 bar width are ideal
├── Trend Score: Prior trend strength
└── Height Score: Pattern height relative to ATR
═════════════════════════════════════════════════════════════
✅ Pattern Lifecycle Management
The indicator doesn't just draw and disappear — it follows the complete pattern:
Pattern detection
Post-fourth point monitoring
Breakout confirmation
Target calculation
Target achievement tracking
Success or cancellation marking
❌ Pattern is automatically cancelled if:
Breakout fails
Channel is broken in reverse direction
Waiting period exceeded
═════════════════════════════════════════════════════════════
✅ Smart Targets + Success Level
After breakout:
Target is calculated based on pattern height
3 target modes:
Conservative (0.618)
Balanced (1.0)
Aggressive (1.618)
Independent Success level to measure move strength before target
═════════════════════════════════════════════════════════════
🎨 Advanced Visual Display (3D Visualization)
Three-dimensional pattern representation
Visual depth reflecting pattern size
3D target zone
Dynamic colors upon target achievement
🎨 The purpose of 3D is not decoration
But reading the pattern visually with speed and clarity
═════════════════════════════════════════════════════════════
⚙️ Key Features
✅ Automatic wedge detection
✅ Smart filtering reduces false signals
✅ Real quality assessment for each pattern
✅ Realistic and customizable targets
✅ Full support for Rising & Falling Wedge
✅ Works on all markets and timeframes
✅ Professional design and high performance
═════════════════════════════════════════════════════════════
📊 Usage Scenarios
🟢 Scalping
Timeframes: 1–15 minutes
Quality ≥ 60
Conservative targets
🔵 Day Trading
Timeframes: 15m–1h
Quality ≥ 50
Balanced targets
🟣 Swing Trading
Timeframes: 4h–Daily
Quality ≥ 40
Strict channel
Aggressive targets
🟠 Cryptocurrencies
Strict convergence
Strict channel
Quality ≥ 65
═════════════════════════════════════════════════════════════
🔔 Alerts
Falling wedge breakout ⇒ Buy
Rising wedge breakout ⇒ Sell
Any wedge breakout
═════════════════════════════════════════════════════════════
⚠️ Disclaimer
This indicator is for educational and analytical purposes only. It does not represent financial, investment, or trading advice. Use it in conjunction with your own strategy and risk management. Neither TradingView nor the developer is responsible for any financial decisions or losses.
═════════════════════════════════════════════════════════════
🔺 Smart Wedge Pattern نموذج الوتد الذكي
Advanced & Intelligent Wedge Detection Engine
ليس مؤشرًا تقليديًا يرسم خطوط وتد فقط ، بل هو محرك (نظام) ذكي متكامل لاكتشاف وتحليل نماذج الوتد (Rising & Falling Wedge) اعتمادًا على الهندسة السعرية ، السياق السوقي ، والجودة الإحصائية للنموذج.
تم تصميم هذا المؤشر لمعالجة أكبر مشكلة في مؤشرات الوتد الشائعة:
❌ كثرة النماذج الوهمية
❌ تجاهل الاتجاه السابق
❌ عدم وجود تقييم حقيقي لجودة النموذج
نظام ذكي متكامل يجمع بين:
خوارزمية تكيفية تُعاير نفسها تلقائياً حسب ظروف السوق
7 طبقات تحقق صارمة تُصفّي الأنماط الضعيفة وتُبقي فقط الأعلى جودة
نظام تسجيل جودة يُقيّم كل نموذج من 0 إلى 100
تصور ثلاثي الأبعاد يجعل الأنماط واضحة بصرياً بشكل استثنائي
أهداف ذكية مبنية على نسب فيبوناتشي مع تتبع التحقق الآني
النتيجة:
➡️ نماذج أقل
➡️ إشارات أنظف أكثر دقة وموثوقية
➡️ جودة أعلى
➡️ استخدام عملي حقيقي
═════════════════════════════════════════════════════════════
🎯 ما هي نماذج الأوتاد؟
1- الوتد الهابط (Falling Wedge) — نموذج انعكاسي صعودي
الوتد الهابط يتشكل عندما يتحرك السعر في قناة هابطة متقاربة — أي أن خط المقاومة العلوي وخط الدعم السفلي كلاهما يهبطان، لكن خط الدعم يهبط بزاوية أقل حدة، مما يُضيّق القناة تدريجياً.
لماذا يحدث الكسر الصعودي؟
القمم الهابطة تُظهر ضغطاً بيعياً مستمراً
لكن القيعان الصاعدة (P2 < P4) تكشف أن المشترين يدخلون عند مستويات أعلى
التقارب يُشير إلى تناقص الزخم الهبوطي
عند نقطة معينة، يتغلب ضغط الشراء ويحدث الكسر
2- الوتد الصاعد (Rising Wedge) — نموذج انعكاسي هبوطي
الوتد الصاعد هو عكس الهابط تماماً — قناة صاعدة متقاربة حيث يصعد كلا الخطين، لكن خط المقاومة يصعد بزاوية أقل حدة.
لماذا يحدث الكسر الهبوطي؟
القيعان الصاعدة تُظهر ضغطاً شرائياً مستمراً
لكن القمم الهابطة (P2 > P4) تكشف أن البائعين يدخلون عند مستويات أدنى
التقارب يُشير إلى تناقص الزخم الصعودي
عند نقطة معينة، يتغلب ضغط البيع ويحدث الكسر
═════════════════════════════════════════════════════════════
🧠 نظام المحاور التكيفي — قلب المؤشر الذكي
المشكلة مع المؤشرات التقليدية
المؤشرات التقليدية تستخدم قيمة ثابتة لاكتشاف المحاور (مثل 5 شموع يسار و5 شموع يمين). هذا يعني:
في الأسواق الهادئة → إشارات كثيرة ومتأخرة
في الأسواق المتقلبة → إشارات قليلة وضائعة
لا تكيف مع طبيعة كل سوق أو إطار زمني
الحل: خوارزمية التكيف الذكي
المؤشر يحسب حساسية المحور المثلى في كل شمعة باستخدام 5 عوامل مرجحة:
النتيجة النهائية = (درجة_التقلب × 0.30) + (درجة_الاتجاه × 0.25) +
(درجة_الاستقرار × 0.20) + (السياق_المئوي × 0.15) +
(درجة_النطاق × 0.10)
العامل الوزن كيف يُحسب لماذا مهم
درجة التقلب 30% ATR(10) / ATR(50) يكشف التغير المفاجئ في التقلب
درجة الاتجاه 25% ADX(14) / 50 الأسواق الاتجاهية تحتاج حساسية مختلفة
درجة الاستقرار 20% StdDev(ATR) / Mean(ATR) يقيس ثبات التقلب
السياق المئوي 15% ATR / Percentile(ATR, 50) يضع التقلب في سياقه التاريخي
درجة النطاق 10% النطاق_الحالي / متوسط_النطاق يكشف الشموع غير العادية
النتيجة: المؤشر يستخدم حساسية منخفضة (محاور أقل، أكثر أهمية) في الأسواق الهادئة، وحساسية عالية (محاور أكثر، استجابة أسرع) في الأسواق المتقلبة (محاور أدق = نماذج هندسية صحيحة).
═════════════════════════════════════════════════════════════
✅ طبقات التحقق السبع — لماذا هذا المؤشر مختلف
كل نموذج مُكتشف يمر عبر 7 اختبارات صارمة قبل عرضه:
1- التحقق من البنية الهندسية
يتحقق من:
P1 يسبق P2 يسبق P3 يسبق P4 زمنياً
المسافة بين كل نقطتين ≥ الحد الأدنى المحدد
عرض النموذج (P1→P4) ضمن النطاق المسموح
ترتيب القمم والقيعان صحيح حسب نوع الوتد
2- فحص التقارب الحقيقي
الوتد الحقيقي يجب أن يُظهر تقارباً:
├── الفجوة عند P4 < الفجوة عند P1
├── نسبة التقارب = الفجوة_النهائية / الفجوة_الابتدائية
└── النسبة يجب أن تكون < عتبة التقارب المحددة (افتراضي 75%)
3- التحقق من الميل
للوتد الهابط:
├── ميل خط المقاومة < 0 (هابط)
├── ميل خط الدعم < 0 (هابط)
└── ميل المقاومة < ميل الدعم (تقارب)
للوتد الصاعد:
├── ميل خط المقاومة > 0 (صاعد)
├── ميل خط الدعم > 0 (صاعد)
└── ميل الدعم > ميل المقاومة (تقارب)
4- فلتر الاتجاه السابق
النماذج الانعكاسية تحتاج اتجاهاً سابقاً لتنعكس منه:
├── يقيس حركة السعر خلال فترة محددة قبل P1
├── يُطبّع الحركة باستخدام ATR لمقارنة عادلة
├── الوتد الهابط يحتاج اتجاهاً هابطاً سابقاً
└── الوتد الصاعد يحتاج اتجاهاً صاعداً سابقاً
5- احترام القناة
وضع عادي (فحص الإغلاق):
└── كل إغلاق بين P1 و P4 يجب أن يكون داخل حدود الوتد
وضع صارم (فحص القمة/القاع):
├── كل قمة يجب أن تكون تحت خط المقاومة (+ نسبة تسامح)
└── كل قاع يجب أن يكون فوق خط الدعم (- نسبة تسامح)
6- التحقق بعد P4
بعد تشكل النقطة الرابعة:
├── للوتد الهابط: السعر لا يكسر خط الدعم أو ينزل تحت P4
└── للوتد الصاعد: السعر لا يكسر خط المقاومة أو يصعد فوق P4
7- نظام تسجيل الجودة
الجودة = (درجة_التقارب × 0.30) + (درجة_الميل × 0.25) +
(درجة_العرض × 0.20) + (درجة_الاتجاه × 0.15) +
(درجة_الارتفاع × 0.10)
├── درجة التقارب: كلما زاد التقارب، زادت الجودة
├── درجة الميل: تناسق ميل الخطين العلوي والسفلي
├── درجة العرض: الأنماط بعرض 40-100 شمعة مثالية
├── درجة الاتجاه: قوة الاتجاه السابق
└── درجة الارتفاع: ارتفاع النموذج نسبة لـ ATR
═════════════════════════════════════════════════════════════
✅ إدارة دورة حياة النموذج (Pattern Lifecycle)
المؤشر لا يرسم ثم يختفي، بل يتابع النموذج كاملًا:
اكتشاف النموذج
مراقبة ما بعد النقطة الرابعة
تأكيد الاختراق
حساب الهدف
تتبع الوصول للهدف
تمييز النجاح أو الإلغاء
❌ يتم إلغاء النموذج تلقائيًا إذا:
فشل في الاختراق
كُسرت القناة عكسيًا
تجاوز مدة الانتظار المحددة
═════════════════════════════════════════════════════════════
✅ أهداف ذكية + Success Level
بعد الاختراق:
يتم حساب الهدف بناءً على ارتفاع النموذج
3 أوضاع للأهداف:
Conservative (0.618)
Balanced (1.0)
Aggressive (1.618)
مستوى Success مستقل لقياس قوة الحركة قبل الهدف
═════════════════════════════════════════════════════════════
🎨 عرض بصري متقدم (3D Visualization)
تمثيل ثلاثي الأبعاد للنموذج
عمق بصري يعكس حجم النموذج
منطقة هدف ثلاثية الأبعاد
ألوان ديناميكية عند تحقق الهدف
🎨 الهدف من 3D ليس الزينة
بل قراءة النموذج بصريًا بسرعة ووضوح
═════════════════════════════════════════════════════════════
⚙️ أهم المميزات
✅ اكتشاف تلقائي للأوتاد
✅ فلترة ذكية تقلل الإشارات الوهمية
✅ تقييم جودة حقيقي لكل نموذج
✅ أهداف واقعية وقابلة للتخصيص
✅ دعم كامل لـ Rising & Falling Wedge
✅ يعمل على جميع الأسواق والفريمات
✅ تصميم احترافي وأداء عالي
═════════════════════════════════════════════════════════════
📊 سيناريوهات الاستخدام
🟢 المضاربة السريعة
أطر: 1–15 دقيقة
جودة ≥ 60
أهداف محافظة
🔵 التداول اليومي
أطر: 15د–1س
جودة ≥ 50
أهداف متوازنة
🟣 التداول المتأرجح
أطر: 4س–يومي
جودة ≥ 40
قناة صارمة
أهداف عدوانية
🟠 العملات الرقمية
تقارب صارم
قناة صارمة
جودة ≥ 65
═════════════════════════════════════════════════════════════
🔔 التنبيهات
كسر وتد هابط ⇒ شراء
كسر وتد صاعد ⇒ بيع
أي كسر وتد
═════════════════════════════════════════════════════════════
⚠️ إخلاء المسؤولية
هذا المؤشر لأغراض تعليمية وتحليلية فقط. لا يُمثل نصيحة مالية أو استثمارية أو تداولية. استخدمه بالتزامن مع استراتيجيتك الخاصة وإدارة المخاطر. لا يتحمل TradingView ولا المطور مسؤولية أي قرارات مالية أو خسائر.

Regression SuperTrend WAIT🔹 DESCRIPTION
Regression SuperTrend + WAIT Panel is a trend-filter and market regime indicator designed to help traders identify the dominant market direction and avoid low-quality trading conditions.
This script combines:
Regression-based SuperTrend to define the primary trend (UP / DOWN)
A WAIT panel to filter tradable conditions
ADX, RSI, and CCI values displayed in a compact panel for quick context
Buy / Sell labels on the chart do not represent entry signals.
They only indicate trend regime changes.
🔹 How to Use
1. Trend Direction
Green line (UP) → Focus on LONG setups only
Red line (DOWN) → Focus on SHORT setups only
2. WAIT Panel
WAIT(L) → Long bias environment, wait for proper entries
WAIT(S) → Short bias environment, wait for proper entries
Low ADX → Weak or ranging market, trading is not recommended
RSI and CCI values are shown for momentum context only.
🔹 Best Practice
This indicator is not a standalone trading system.
It is intended to be used as:
A higher-timeframe bias tool
A trend and regime filter for lower-timeframe strategies or oscillators
Example:
Regression UP + WAIT(L) → Only look for long setups on lower timeframes
🔹 Who Is This For?
Trend-based traders
ICT / market structure traders
Traders who want to clearly identify when NOT to trade
⚠️ Disclaimer
This script is for educational purposes only.
It is not financial advice.
All trading decisions and risk management are the user’s responsibility.

EMTIA_MASTER_LIBLibrary "EMTIA_MASTER_LIB"
trendUp(emaFast, emaSlow)
Parameters:
emaFast (float)
emaSlow (float)
rsiHealthy(rsi)
Parameters:
rsi (float)
adxStrong(adx, diPlus, diMinus)
Parameters:
adx (float)
diPlus (float)
diMinus (float)
macroSlope(emaFast, emaSlow)
Parameters:
emaFast (float)
emaSlow (float)
structureBull(hh, hl)
Parameters:
hh (bool)
hl (bool)
calcScore(weeklyTrend, dailyTrend, adxOk, rsiOk, structureOk, macroOk)
Parameters:
weeklyTrend (bool)
dailyTrend (bool)
adxOk (bool)
rsiOk (bool)
structureOk (bool)
macroOk (bool)

VIOP Scalping - ATR SNIPERVIOP Scalping – ATR SNIPER is a momentum-based scalping strategy designed to capture short, high-probability moves while keeping risk strictly defined using ATR-based stop-loss and fixed risk/reward targets. The strategy trades only when trend direction, momentum, and strength are aligned.
This script is provided for educational and testing purposes only. It does not guarantee profitability and must be used with proper risk management.
Core Idea
Trade in the direction of the dominant trend, confirm momentum acceleration, and manage risk using ATR-based dynamic stops and targets.
How the Strategy Works
The main trend is defined using a Weighted Moving Average (WMA).
Momentum is measured by the distance and direction between a fast EMA and a slow EMA.
Trend strength is confirmed using ADX.
RSI is used as a filter to avoid weak or overextended market conditions.
Entries are blocked during a predefined no-trade time window to avoid high-noise periods.
Long Entry Conditions
Fast EMA is above Slow EMA and the EMA difference is greater than the minimum threshold.
EMA momentum is increasing compared to the previous bar.
RSI is within the user-defined long range.
Current close is higher than the previous close.
ADX is above the minimum strength threshold.
Price is above the WMA trend line.
The current bar is not inside the no-trade session.
Short Entry Conditions
Fast EMA is below Slow EMA and the EMA difference is below the negative threshold.
Bearish EMA momentum is increasing.
RSI is within the user-defined short range.
Current close is lower than the previous close.
ADX is above the minimum strength threshold.
Price is below the WMA trend line.
The current bar is not inside the no-trade session.
Risk Management – ATR Sniper Logic
Stop-loss distance is calculated as ATR multiplied by the ATR Multiplier.
Take-profit distance is calculated using the defined Risk/Reward ratio.
Stop-loss and take-profit levels are dynamically calculated per trade.
Only one position can be open at any given time.
What You See on the Chart
Weighted Moving Average (WMA) trend line.
Fast EMA and Slow EMA lines.
Dynamic stop-loss line during active trades.
Dynamic take-profit line during active trades.
Recommended Use
Intraday scalping on VİOP instruments.
Momentum-based short-term trading.
Traders who prefer rule-based systems with strict risk control.
Always backtest and forward-test on your own instruments and timeframes before using this strategy in live markets.

Evil's Two Legged IndicatorA pullback strategy indicator designed for scalping. This attempts to Identify classic 2-leg pullback patterns and filters out signals during choppy market conditions for better signals.
How It Works:
The indicator detects when price forms two pullback legs (swing lows in an uptrend or swing highs in a downtrend) near key support/resistance zones, then signals when reversal confirmation occurs. Equal-level pullbacks (double bottoms/tops) are marked as stronger signals.
Features:
Channel Options: Donchian (default), Linear Regression, or ATR Bands
Configurable EMA: For trend confirmation (default 21)
Adjustable Leg Detection: Swing lookback period for different timeframes
Equal Level Detection: Highlights stronger setups where both legs terminate at similar prices
Three Chop Filters (can be combined):
ADX Filter — suppresses signals when ADX is below threshold (default 25)
EMA Slope Filter — suppresses signals when EMA is flat
Chop Index Filter — suppresses signals when Chop Index indicates ranging conditions
Signal Types:
Standard signals: 2-leg pullback detected with trend confirmation
Strong signals (highlighted): 2-leg pullback with equal highs/lows — higher probability setup
Recommended Use:
Best suited for scalping on 1-5 minute chart. Designed for 1.5:1 risk/reward setups.
Settings Guide:
Increase "Swing Lookback" for fewer, higher-quality signals
Adjust "Equal Level Threshold" to fine-tune what counts as a double bottom/top
Enable/disable chop filters based on your market and timeframe
Use "Show Strong Signals Only" to filter for highest conviction setups

Apex Adaptive TrailApex Adaptive Trail: Adaptive Volatility Trend System
This custom trend-following indicator improves on standard SuperTrend implementations by addressing two key weaknesses: excessive whipsaws during high volatility and false signals in ranging markets.
Core Logic:
- Synthetic Heikin Ashi values are calculated internally (without changing chart candles) to provide smoother source data for trend detection.
- ATR-based trailing stop with adaptive multiplier: dynamically adjusts between 0.8x and 1.5x the base factor based on current volatility (ATR / 50-period SMA of ATR). Widens in volatile conditions, tightens in quiet markets.
- Weighted Confluence Score (0-100%): Combines four independent filters, each contributing 25%:
• Price position relative to 21-period EMA (trend alignment)
• ADX > 20 (momentum strength)
• Choppiness Index < 60 (trending vs ranging detection)
• Alignment with Daily EMA(50) trend direction
Signals are only generated when price crosses the adaptive trail AND the confluence score exceeds 75% (standard) or 90% (MAX 🔥 ultra-strong). This combination significantly reduces low-quality entries compared to traditional SuperTrend crossovers.
Key Features:
- Dynamic confidence cloud (opacity based on score)
- Real-time dashboard showing volatility state, active filters, trend bias, and estimated historical win rate
- Optional dynamic/fixed profit targets
- Fully customizable filters and adaptive behavior
Usage: Best on 15m to 4H timeframes for trend-following strategies (Crypto, Forex, Indices). Enter on APEX signals, use trail as stop-loss, TP lines for partial exits.
This script integrates established concepts into a unique adaptive framework with volatility-responsive risk management and multi-filter validation.
Disclaimer: For educational and analysis purposes only. Past performance is not indicative of future results. Always use proper risk management.
"This script combines established indicators (ATR trailing, ADX, Choppiness Index, EMA, MTF) into a unique adaptive system with dynamic volatility adjustment and weighted confluence scoring – features not found together in standard SuperTrend variations."

Chainbey Ai - HTF Trend Matrix (Clean)Chainbey Ai – HTF Trend Matrix is a professional, higher-timeframe trend detection indicator designed to give traders a clean, reliable market bias, regardless of the chart timeframe they are trading on.
This indicator automatically analyzes multiple higher timeframes (HTFs) and combines:
EMA trend direction
Trend strength (ADX)
Market structure (trend vs range)
Trend disagreement across HTFs
Reversal probability estimation
All results are displayed in a compact table at the bottom-right, making it perfect for scalpers, day traders, and swing traders who need fast, decision-ready information.
🧠 What This Indicator Solves
❌ No more guessing the higher-timeframe trend
❌ No more trading against the main market bias
❌ No more confusion between trend vs range
✅ Clear BULLISH / BEARISH / RANGE bias
✅ Strength score to avoid weak trends
✅ Reversal probability to manage risk
📊 How to Read the Table (User Manual)
🔹 FINAL Row
Example:
FINAL | BEARISH TREND | -46
Text (BEARISH / BULLISH / RANGE) → Overall market bias
Number (-46) → Trend Strength Score
Trend Score Guide:
Score Meaning
0 to ±20 No trend / Choppy
±20 to ±40 Weak trend
±40 to ±70 Healthy trend
±70+ Very strong / extended trend
📌 Negative = Bearish
📌 Positive = Bullish
🔹 REVERSAL – Possibility (%)
Example:
REVERSAL | Possibility | 45%
This shows the chance of trend exhaustion or reversal.
Reversal % Meaning
0–30% Strong trend continuation
30–50% Normal pullback risk
50%+ High reversal probability
70%+ Dangerous to chase trades
📌 Use this to avoid late entries.
🔹 HTF Rows (60 / 240 / D)
Each row shows:
DIR / STRUCT
Direction from EMA trend
Market structure (TREND / RANGE)
ADX
Trend strength
STRONG / MEDIUM / CHOP
📌 If multiple HTFs agree → higher confidence
📌 If HTFs conflict → reduce position size or wait
🛠 Recommended Trading Usage
✅ Best Practices
Trade in the direction of FINAL trend
Enter on pullbacks, not breakouts
Use lower timeframes only for entries
❌ Avoid
Trading against FINAL bias
Chasing trades when reversal % is high
Over-leveraging in CHOP conditions
🎯 Ideal For
Crypto traders (Spot & Futures)
Forex traders
Gold / Commodity traders
Scalping, Intraday & Swing trading
⚠️ Disclaimer
This indicator is a decision-support tool, not financial advice. Always combine it with proper risk management, confirmations, and your trading plan.
