BUY & SELL Probability (M5..D1) - MTFMTF Probability Indicator (M5 to D1)
Indicator — Dual Histogram with Buy/Sell Labels
This indicator is designed to provide a probabilistic bias for bullish or bearish conditions by combining three different analytical components across multiple timeframes. The goal is to reduce noise from single-indicator signals and instead highlight confluence where trend, momentum, and strength agree.
Why this combination is useful
- EMA(200) Trend Filter: Identifies whether price is trading above or below a widely used long-term moving average.
- MACD Momentum: Detects short-term directional momentum through line crossovers.
- ADX Strength: Measures how strong the trend is, preventing signals in weak or flat markets.
By combining these, the indicator avoids situations where one tool signals a trade but others do not, helping to filter out low-probability setups.
How it works
- Each timeframe (M5, M15, H1, H4, D1) generates its own trend, momentum, and strength score.
- Scores are weighted according to user-defined importance and then aggregated into a single probability.
- Proximity to recent support and resistance levels can adjust the final score, accounting for nearby barriers.
- The final probability is displayed as:
- Histogram (subwindow): Green bars for bullish probability >50%, red bars for bearish <50%.
- On-chart labels: Showing exact buy/sell percentages on the last bar for quick reference.
Inputs
- EMA length (default 200), MACD settings, ADX period.
- Weights for each timeframe and component (trend, momentum, strength).
- Optional boost for the chart’s current timeframe.
- Smoothing length for probability values.
- Lookback period for support/resistance adjustment.
How to use it
- A green histogram above zero indicates bullish probability >50%.
- A red histogram below zero indicates bearish probability >50%.
- Neutral readings near 50% show low confluence and may be best avoided.
- Users can adjust weights to emphasize higher or lower timeframes, depending on their trading style.
Notes
- This script does not guarantee profitable trades.
- Best used together with price action, volume, or additional confirmation tools.
- Signals are calculated only on closed bars to avoid repainting.
- For testing and learning purposes — not financial advice.
Cerca negli script per "adx"

Cyclic Reversal Engine [AlgoPoint]Overview
Most indicators focus on price and momentum, but they often ignore a critical third dimension: time. Markets move in rhythmic cycles of expansion and contraction, but these cycles are not fixed; they speed up in trending markets and slow down in choppy conditions.
The Cyclic Reversal Engine is an advanced analytical tool designed to decode this rhythm. Instead of relying on static, lagging formulas, this indicator learns from past market behavior to anticipate when the current trend is statistically likely to reach its exhaustion point, providing high-probability reversal signals.
It achieves this by combining a sophisticated time analysis with a robust price-action confirmation.
How It Works: The Core Logic
The indicator operates on a multi-stage process to identify potential turning points in the market.
1. Market Regime Analysis (The Brain): Before analyzing any cycles, the indicator first diagnoses the current "personality" of the market. Using a combination of the ADX, Choppiness Index, and RSI, it classifies the market into one of three primary regimes:
- Trending: Strong, directional movement.
- Ranging: Sideways, non-directional chop.
- Reversal: An over-extended state (overbought/oversold) where a turn is imminent.
2. Adaptive Cycle Learning (The "Machine Learning" Aspect): This is the indicator's smartest feature. It constantly analyzes past cycles by measuring the bar-count between significant swing highs and swing lows. Crucially, it learns the average cycle duration for each specific market regime. For example, it learns that "in a strong trending market, a new swing low tends to occur every 35 bars," while "in a ranging market, this extends to 60 bars."
3. The Countdown & Timing Signal: The indicator identifies the last major swing high or low and starts a bar-by-bar countdown. Based on the current market regime, it selects the appropriate learned cycle length from its memory. When the bar count approaches this adaptive target, the indicator determines that a reversal is "due" from a timing perspective.
4. Price Confirmation (The Trigger): A signal is never generated based on timing alone. Once the timing condition is met (the cycle is "due"), the indicator waits for a final price-action confirmation. The default confirmation is the RSI entering an extreme overbought or oversold zone, signaling momentum exhaustion. The signal is only triggered when Time + Price Confirmation align.
How to Use This Indicator
- The Dashboard: The panel in the bottom-right corner is your command center.
- Market Regime: Shows the current market personality analyzed by the engine.
- Adaptive Cycle / Bar Count: This is the core of the indicator. It shows the target cycle length for the current regime (e.g., 50) and the current bar count since the last swing point (e.g., 45). The background turns orange when the bar count enters the "due zone," indicating that you should be on high alert for a reversal.
- BUY/SELL Signals: A label appears on the chart only when the two primary conditions are met:
The timing is right (Bar Count has reached the Adaptive Cycle target).
The price confirms exhaustion (RSI is in an extreme zone).
A BUY signal suggests a downtrend cycle is likely complete, and a SELL signal suggests an uptrend cycle is likely complete.
Key Settings
- Pivot Lookback: Controls the sensitivity of the swing point detection. Higher values will identify more significant, longer-term cycles.
- Market Regime Engine: The ADX, Choppiness, and RSI settings can be fine-tuned to adjust how the indicator classifies the market's personality.
- Require Price Confirmation: You can toggle the RSI confirmation on or off. It is highly recommended to keep it enabled for higher-quality signals.

ABO LANA-𝑀1. إشارات التداول الرئيسية:
إشارة شراء (BUY):
تظهر عند تحول اتجاه السوق من هابط إلى صاعد، مع إغلاق السعر فوق المتوسط المتحرك (EMA 9).
إشارة بيع (SELL):
تظهر عند تحول الاتجاه من صاعد إلى هابط، مع إغلاق السعر تحت المتوسط المتحرك.
2. مناطق العرض والطلب (Supply/Demand):
مناطق العرض (Supply):
تمثل مستويات مقاومة رئيسية (لون أحمر) تُرسم عند القمم السعرية.
مناطق الطلب (Demand):
تمثل مستويات دعم رئيسية (لون أخضر) تُرسم عند القيعان السعرية.
تحديث تلقائي بناءً على حركة السعر وأطر زمنية متعددة.
3. إدارة المخاطر والأرباح:
وقف الخسارة (SL):
يُحسب باستخدام مضاعف ATR (المدى الحقيقي).
مستويات الأرباح (TP1, TP2, TP3):
مستويات ثلاثية للأرباح مع مضاعفات قابلة للتخصيص.
تنبيهات صوتية عند تحقيق كل هدف.
4. لوحة المعلومات (Dashboard):
اتجاه السوق: صاعد/هابط عبر 6 أطر زمنية (من 1 دقيقة إلى يومي).
مؤشر الزخم (Momentum):
اتجاه حركة السعر خلال 10 شمعات.
RSI مخصص:
يجمع بين RSI قصير المدى (2) ومتوسط متحرك (7).
حجم التداول: صاعد/هابط مقارنة بالمتوسط.
قوة الترند (ADX): قوي/ضعيف.
5. ميزات إضافية:
خطوط اتجاه ديناميكية:
تُرسم تلقائياً بين القمم والقيعان.
مستويات دعم/مقاومة:
مستخرجة من 7 أطر زمنية (H4, H1, M30, ...).
نطاق متوسط (Middle Band):
خط برتقالي يعكس متوسط حركة السعر.
تحليل السيولة:
يعتمد على شموع هايكين أشي وحجم التداول.
Brief Explanation of ABO LANA-M (English):
1. Core Trading Signals:
BUY Signal:
Triggers when market trend shifts from bearish to bullish, with price closing above EMA 9.
SELL Signal:
Activates when trend reverses from bullish to bearish, with price closing below EMA 9.
2. Supply/Demand Zones:
Supply Zones (Red):
Key resistance levels plotted at swing highs.
Demand Zones (Green):
Key support levels plotted at swing lows.
Auto-updated based on price action across multiple timeframes.
3. Risk & Profit Management:
Stop Loss (SL):
Calculated using ATR multiplier.
Take Profit Targets (TP1, TP2, TP3):
Three customizable profit levels.
Audio alerts when each target is hit.
4. Smart Dashboard:
Market Trend: Bullish/Bearish across 6 timeframes (1m to Daily).
Momentum Indicator:
Price movement direction over 10 candles.
Custom RSI:
Combines RSI(2) with SMA(7) for smoother readings.
Volume Analysis:
Compares current volume to 20-period average.
Trend Strength (ADX): Strong/Weak.
5. Advanced Features:
Dynamic Trendlines:
Automatically drawn between swing highs/lows.
Support/Resistance Levels:
Extracted from 7 timeframes (H4, H1, M30, etc.).
Middle Band:
Orange line showing price equilibrium.
Liquidity Analysis:
Based on Heikin Ashi candles and volume confirmation.
Mutanabby_AI | Fresh Algo V24Mutanabby_AI | Fresh Algo V24: Advanced Multi-Mode Trading System
Overview
The Mutanabby_AI Fresh Algo V24 represents a sophisticated evolution of multi-component trading systems that adapts to various market conditions through advanced operational configurations and enhanced analytical capabilities. This comprehensive indicator provides traders with multiple signal generation approaches, specialized assistant functions, and dynamic risk management tools designed for professional market analysis across diverse trading environments.
Primary Signal Generation Framework
The Fresh Algo V24 operates through two fundamental signal generation approaches that accommodate different market perspectives and trading philosophies. The Trending Signals Mode serves as the primary trend-following mechanism, combining Wave Trend Oscillator analysis with Supertrend directional signals and Squeeze Momentum breakout detection. This mode incorporates ADX filtering that requires values exceeding 20 to ensure sufficient trend strength exists before signal activation, making it particularly effective during sustained directional market movements where momentum persistence creates profitable trading opportunities.
The Contrarian Signals Mode provides an alternative approach targeting reversal opportunities through extreme market condition identification. This mode activates when the Wave Trend Oscillator reaches critical threshold levels, specifically when readings surpass 65 indicating potential bearish reversal conditions or drop below 35 suggesting bullish reversal opportunities. This methodology proves valuable during overextended market phases where mean reversion becomes statistically probable.
Advanced Filtering Mechanisms
The system incorporates multiple sophisticated filtering mechanisms designed to enhance signal quality and reduce false positive occurrences. The High Volume Filter requires volume expansion confirmation before signal activation, utilizing exponential moving average calculations to ensure institutional participation accompanies price movements. This filter substantially improves signal reliability by eliminating low-conviction breakouts that lack adequate volume support from professional market participants.
The Strong Filter provides additional trend confirmation through 200-period exponential moving average analysis. Long position signals require price action above this benchmark level, while short position signals necessitate price action below it. This ensures strategic alignment with longer-term trend direction and reduces the probability of trading against major market movements that could invalidate shorter-term signals.
Cloud Filter Configuration System
The Fresh Algo V24 offers four distinct cloud filter configurations, each optimized for specific trading timeframes and market approaches. The Smooth Cloud Filter utilizes the mathematical relationship between 150-period and 250-period exponential moving averages, providing stable trend identification suitable for position trading strategies. This configuration generates signals exclusively when price action aligns with cloud direction, creating a more deliberate but highly reliable signal generation process.
The Swing Cloud Filter employs modified Supertrend calculations with parameters specifically optimized for swing trading timeframes. This filter achieves optimal balance between responsiveness and stability, adapting effectively to medium-term price movements while filtering excessive market noise that typically affects shorter-term analytical systems.
For active intraday traders, the Scalping Cloud Filter utilizes accelerated Supertrend calculations designed to capture rapid trend changes effectively. This configuration provides enhanced signal generation frequency suitable for compressed timeframe strategies. The advanced Scalping+ Cloud Filter incorporates Hull Moving Average confirmation, delivering maximum responsiveness for ultra-short-term trading while maintaining signal quality through additional momentum validation processes.
Specialized Assistant Functionality
The system includes two distinct assistant modes that provide supplementary market analysis capabilities. The Trend Assistant Mode activates advanced cloud analysis overlays that display dynamic support and resistance zones calculated through adaptive volatility algorithms. These levels automatically adjust to current market conditions, providing visual guidance for identifying trend continuation patterns and potential reversal areas with mathematical precision.
The Trend Tracker Mode concentrates on long-term trend identification by displaying major exponential moving averages with color-coded fill areas that clarify directional bias. This mode maintains visual simplicity while providing comprehensive trend context evaluation, enabling traders to quickly assess broader market direction and align shorter-term strategies accordingly.
Dynamic Risk Management System
The integrated risk management system automatically adapts across all operational modes, calculating stop loss and take profit targets using Average True Range multiples that adjust to current market volatility. This approach ensures consistent risk parameters regardless of selected operational mode while maintaining relevance to prevailing market conditions.
Stop loss placement occurs at dynamically calculated distances from entry points, while three progressive take profit targets establish at customizable ATR multiples respectively. The system automatically updates these levels upon trend direction changes, ensuring current market volatility influences all risk calculations and maintains appropriate risk-reward ratios throughout trade management.
Comprehensive Market Analysis Dashboard
The sophisticated dashboard provides real-time market analysis including volatility measurements, institutional activity assessment, and multi-timeframe trend evaluation across five-minute through four-hour periods. This comprehensive market context assists traders in selecting appropriate operational modes based on current market characteristics rather than relying exclusively on historical performance data.
The multi-timeframe analysis ensures mode selection considers broader market context beyond the primary trading timeframe, improving overall strategic alignment and reducing conflicts between different temporal market perspectives. The dashboard displays market state classification, volatility percentages, institutional activity levels, current trading session information, and trend pressure indicators with professional formatting and clear visual hierarchy.
Enhanced Trading Assistants
The Fresh Algo V24 includes specialized trading assistant features that complement the primary signal generation system. The Reversal Dot functionality identifies potential reversal points through Wave Trend Oscillator analysis, displaying visual indicators when crossover conditions occur at extreme levels. These reversal indicators provide early warning signals for potential trend changes before they appear in the primary signal system.
The Dynamic Take Profit Labels feature automatically identifies optimal profit-taking opportunities through RSI threshold analysis, marking potential exit points at multiple levels for long positions and corresponding levels for short positions. This automated profit management system helps traders optimize exit timing without requiring constant manual monitoring of technical indicators.
Advanced Alert System
The comprehensive alert system accommodates all operational modes while providing granular notification control for various signal types and risk management events. Traders can configure separate alerts for normal buy signals, strong buy signals, normal sell signals, strong sell signals, stop loss triggers, and individual take profit target achievements.
Cloud crossover alerts notify traders when trend direction changes occur, providing early indication of potential strategy adjustments. The alert system includes detailed trade setup information, timeframe data, and relevant entry and exit levels, ensuring traders receive complete context for informed decision-making without requiring constant chart monitoring.
Technical Foundation Architecture
The Fresh Algo V24 combines multiple proven technical analysis components including Wave Trend Oscillator for momentum assessment, Supertrend for directional bias determination, Squeeze Momentum for volatility analysis, and various exponential moving averages for trend confirmation. Each component contributes specific market insights while the unified system provides comprehensive market evaluation through their mathematical integration.
The multi-component approach reduces dependency on individual indicator limitations while leveraging the analytical strengths of each technical tool. This creates a robust analytical framework capable of adapting to diverse market conditions through appropriate mode selection and parameter optimization, ensuring consistent performance across varying market environments.
Market State Classification
The indicator incorporates advanced market state classification through ADX analysis, distinguishing between trending, ranging, and transitional market conditions. This classification system automatically adjusts signal sensitivity and filtering parameters based on current market characteristics, optimizing performance for prevailing conditions rather than applying static analytical approaches.
The volatility measurement system calculates current market activity levels as percentages, providing quantitative assessment of market energy and helping traders select appropriate operational modes. Institutional activity detection through volume analysis ensures signal generation aligns with professional market participation patterns.
Implementation Strategy Considerations
Successful implementation requires careful matching of operational modes to prevailing market conditions and individual trading objectives. Trending modes demonstrate optimal performance during directional markets with sustained momentum characteristics, while contrarian modes excel during range-bound or overextended market conditions where reversal probability increases.
The cloud filter configurations provide varying degrees of confirmation strength, with smoother settings reducing false signal occurrence at the expense of some responsiveness to price changes. Traders must balance signal quality against signal frequency based on their risk tolerance and available trading time, utilizing the comprehensive customization options to optimize performance for their specific requirements.
Multi-Timeframe Integration
The system provides seamless multi-timeframe analysis through the integrated dashboard, displaying trend alignment across multiple time horizons from five-minute through four-hour periods. This analysis helps traders understand broader market context and avoid conflicts between different temporal perspectives that could compromise trade outcomes.
Session analysis identifies current trading session characteristics, providing context for expected market behavior patterns and helping traders adjust their approach based on typical session volatility and participation levels. This geographic market awareness enhances strategic decision-making and improves timing for trade execution.
Advanced Visualization Features
The indicator includes sophisticated visualization capabilities through gradient candle coloring based on MACD analysis, providing immediate visual feedback on momentum strength and direction. This enhancement allows rapid market assessment without requiring detailed indicator analysis, improving efficiency for traders managing multiple instruments simultaneously.
The cloud visualization system uses color-coded fill areas to clearly indicate trend direction and strength, with automatic adaptation to selected operational modes. This visual clarity reduces analytical complexity while maintaining comprehensive market information display through professional chart presentation.
Performance Optimization Framework
The Fresh Algo V24 incorporates performance optimization features including signal strength classification, automatic parameter adjustment based on market conditions, and dynamic filtering that adapts to current volatility levels. These optimizations ensure consistent performance across varying market environments while maintaining signal quality standards.
The system automatically adjusts sensitivity levels based on selected operational modes, ensuring appropriate responsiveness for different trading approaches. This adaptive framework reduces the need for manual parameter adjustments while maintaining optimal performance characteristics for each operational configuration.
Conclusion
The Mutanabby_AI Fresh Algo V24 represents a comprehensive solution for professional trading analysis, combining multiple analytical approaches with advanced visualization and risk management capabilities. The system's strength lies in its adaptive multi-mode design and sophisticated filtering mechanisms, providing traders with versatile tools for various market conditions and trading styles.
Success with this system requires understanding the relationship between different operational modes and their optimal application scenarios. The comprehensive dashboard and alert system provide essential market context and trade management support, enabling systematic approach to market analysis while maintaining flexibility for individual trading preferences.
The indicator's sophisticated architecture and extensive customization options make it suitable for traders at all experience levels, from those seeking systematic signal generation to advanced practitioners requiring comprehensive market analysis tools. The multi-timeframe integration and adaptive filtering ensure consistent performance across diverse market conditions while providing clear guidelines for strategic implementation.

Hassi XAUUSD STRATEGY BOTGold (XAUUSD) 15m trend+momentum based signals with EMA(9/21/200), RSI, custom ADX, ATR-based SL/TP & alerts
Works on XAUUSD 15m.
Entry: EMA9/21 cross + price relative to EMA200 + RSI filter + custom ADX trend strength.
Risk: default SL=1.5×ATR, TP=2×ATR (editable).
Notes: No financial advice. Backtest before live use. Avoid high-impact news whipsaws.

Ayman Entry Signal – Ultimate PRO (Scalping Gold Settings)1. Overview
This indicator is a professional gold scalping tool built for TradingView using Pine Script v6.
It combines multiple price action and technical filters to generate high-probability Buy/Sell signals with built-in trade management features (TP1, TP2, SL, Break Even, Partial Close, Stats tracking).
It is optimized for XAUUSD but can be applied to other assets with proper setting adjustments.
2. Key Features
Multi-Condition Trade Signals – EMA trend, Break of Structure, Order Blocks, FVG, Liquidity Sweeps, Pin Bars, Higher Timeframe confirmation, Trend Cloud, SMA Cross, and ADX.
Full Trade Management – Auto-calculates lot size, SL, TP1, TP2, Break Even, Partial Close.
Dynamic Chart Drawing – Entry lines, SL/TP lines, trade boxes, and real-time PnL.
Statistics Panel – Tracks wins, losses, breakeven trades, and total PnL over selected dates.
Customizable Filters – All filters can be turned ON/OFF to match your strategy.
3. Main Inputs & Settings
Account Settings
Capital ($) – Total trading capital.
Risk Percentage (%) – Risk per trade.
TP to SL Ratio – Risk-to-reward ratio.
Value Per Point ($) – Value per pip/point for lot size calculation.
SL Buffer – Extra points added to SL to avoid stop hunts.
Take Profit Settings
TP1 % of Full Target – Fraction of TP1 compared to TP2.
Move SL to Entry after TP1? – Activates Break Even after TP1.
Break Even Buffer – Extra points when moving SL to BE.
Take Partial Close at TP1 – Option to close half at TP1.
Signal Filters
ATR Period – For SL/TP calculation buffer.
EMA Trend – Uses EMA 9/21 crossover for trend.
Break of Structure (BoS) – Requires structure break confirmation.
Order Block (OB) – Validates trades within OB zones.
Fair Value Gap (FVG) – Confirms trades inside FVGs.
Liquidity Sweep – Checks if liquidity zones are swept.
Pin Bar Confirmation – Uses candlestick patterns for extra confirmation.
Pin Bar Body Ratio – Controls strictness of Pin Bar filter.
Higher Timeframe Filters (HTF)
HTF EMA Confirmation – Confirms lower timeframe trades with higher timeframe trend.
HTF BoS – Confirms with higher timeframe structure break.
HTF Timeframe – Selects higher timeframe.
Advanced Filters
SuperTrend Filter – Confirms trades based on SuperTrend.
ADX Filter – Filters out low volatility periods.
SMA Cross Filter – Uses SMA 8/9 cross as filter.
Trend Cloud Filter – Uses EMA 50/200 as a cloud trend filter.
4. How It Works
Buy Signal Conditions
EMA 9 > EMA 21 (trend bullish)
Optional filters (BoS, OB, FVG, Liquidity Sweep, Pin Bar, HTF confirmations, ADX, SMA Cross, Trend Cloud) must pass if enabled.
When all active filters pass → Buy signal triggers.
Sell Signal Conditions
EMA 9 < EMA 21 (trend bearish)
Same filtering process but for bearish conditions.
When all active filters pass → Sell signal triggers.
5. Trade Execution & Management
When a signal triggers:
Lot size is auto-calculated based on risk % and SL distance.
SL is placed beyond recent swing high/low + ATR buffer.
TP1 and TP2 are calculated from the SL using the reward-to-risk ratio.
Break Even: If enabled, SL moves to entry price after TP1 is hit.
Partial Close: If enabled, half of the position closes at TP1.
Trade Exit: Full exit at TP2, SL hit, or partial close at TP1.
6. Chart Display
Entry Line – Shows entry price.
SL Line – Red dashed line at stop loss level.
TP1 Line – Lime dashed line for TP1.
TP2 Line – Green dashed line for TP2.
PnL Labels – Displays real-time profit/loss in $.
Trade Box – Visual area showing trade range.
Pin Bar Shapes – Optional, marks Pin Bars.
7. Statistics Panel
Stats Header – Shows “Stats”.
Total Trades
Wins
Losses
Breakeven Trades
Total PnL
Can be reset or filtered by date.
8. How to Use
Load the Indicator in TradingView.
Select Gold (XAUUSD) on your preferred scalping timeframe (1m, 5m, 15m).
Adjust settings:
Use default gold scalping settings for quick start.
Enable/disable filters according to your style.
Wait for a Buy/Sell alert.
Confirm visually that all desired conditions align.
Place trade with calculated lot size, SL, and TP levels shown on chart.
Let trade run – the indicator manages Break Even & Partial Close if enabled.
9. Recommended Timeframes
Scalping: 1m, 5m, 15m
Day Trading: 15m, 30m, 1H
Swing: 4H, Daily (adjust settings accordingly)

Modular Range-Trading Strategy (V9.2)# 模块化震荡行情策略 (V9.2)
# Modular Range-Trading Strategy (V9.2)
## 策略简介 | Strategy Overview
该策略基于布林带 (Bollinger Bands)、RSI、MACD、ADX 等经典指标的组合,通过多逻辑模块化结构识别震荡区间的价格反转机会,支持多空双向操作,并在相同逻辑下允许智能加仓,适用于震荡市场的回测和研究。
This strategy combines classic indicators such as Bollinger Bands, RSI, MACD, and ADX to identify price reversal opportunities within ranging markets. It features a modular multi-logic structure, allowing both long and short trades with intelligent pyramiding under the same logic. It is designed for backtesting and research in range-bound conditions.
---
## 功能特点 | Key Features
- **多逻辑结构**:支持多套震荡逻辑(动能确认均值回归、布林带极限反转等)。
- **加仓与仓位互斥**:同逻辑下可智能加仓,不同逻辑间自动互斥,避免冲突。
- **回测可调时间范围**:可自定义回测起止时间,精准评估策略表现。
- **指标可视化**:布林带、RSI、MACD 及动态 ATR 止损线实时绘图。
- **K线收盘确认信号**:通过 `barstate.isconfirmed` 控制信号,避免未收盘的虚假信号。
- **Multi-logic structure**: Supports multiple range-trading logics (e.g., momentum-based mean reversion, Bollinger Band reversals).
- **Pyramiding with mutual exclusion**: Allows intelligent pyramiding within the same logic while preventing conflicts between different logics.
- **Adjustable backtesting range**: Customizable start and end dates for accurate performance evaluation.
- **Visual indicators**: Real-time plotting of Bollinger Bands, RSI, MACD, and dynamic ATR stop lines.
- **Close-bar confirmation**: Uses `barstate.isconfirmed` to avoid false signals before bar close.
---
## 使用说明 | Usage
1. 将该脚本添加到 TradingView 图表。
2. 在参数中设置回测时间段和指标参数。
3. 仅用于学习与策略研究,请勿直接用于实盘交易。
1. Add this script to your TradingView chart.
2. Configure backtesting dates and indicator parameters as needed.
3. For educational and research purposes only. **Not for live trading.**
---
## ⚠️ 免责声明 | Disclaimer
本策略仅供学习和研究使用,不构成任何形式的投资建议。
作者不参与任何实盘交易、资金管理或收益分成,也不保证策略盈利能力。
严禁将本脚本用于任何非法集资、私募募资或与虚拟货币相关的金融违法活动。
使用本策略即表示您自行承担所有风险与法律责任。
This strategy is for educational and research purposes only and does not constitute investment advice.
The author does not participate in live trading, asset management, or profit sharing, nor guarantee profitability.
The use of this script in illegal fundraising, private placements, or cryptocurrency-related financial activities is strictly prohibited.
By using this strategy, you accept all risks and legal responsibilities.
---

Info TableOverview
The Info Table V1 is a versatile TradingView indicator tailored for intraday futures traders, particularly those focusing on MESM2 (Micro E-mini S&P 500 futures) on 1-minute charts. It presents essential market insights through two customizable tables: the Main Table for predictive and macro metrics, and the New Metrics Table for momentum and volatility indicators. Designed for high-activity sessions like 9:30 AM–11:00 AM CDT, this tool helps traders assess price alignment, sentiment, and risk in real-time. Metrics update dynamically (except weekly COT data), with optional alerts for key conditions like volatility spikes or momentum shifts.
This indicator builds on foundational concepts like linear regression for predictions and adapts open-source elements for enhanced functionality. Gradient code is adapted from TradingView's Color Library. QQE logic is adapted from LuxAlgo's QQE Weighted Oscillator, licensed under CC BY-NC-SA 4.0. The script is released under the Mozilla Public License 2.0.
Key Features
Two Customizable Tables: Positioned independently (e.g., top-right for Main, bottom-right for New Metrics) with toggle options to show/hide for a clutter-free chart.
Gradient Coloring: User-defined high/low colors (default green/red) for quick visual interpretation of extremes, such as overbought/oversold or high volatility.
Arrows for Directional Bias: In the New Metrics Table, up (↑) or down (↓) arrows appear in value cells based on metric thresholds (top/bottom 25% of range), indicating bullish/high or bearish/low conditions.
Consensus Highlighting: The New Metrics Table's title cells ("Metric" and "Value") turn green if all arrows are ↑ (strong bullish consensus), red if all are ↓ (strong bearish consensus), or gray otherwise.
Predicted Price Plot: Optional line (default blue) overlaying the ML-predicted price for visual comparison with actual price action.
Alerts: Notifications for high/low Frahm Volatility (≥8 or ≤3) and QQE Bias crosses (bullish/bearish momentum shifts).
Main Table Metrics
This table focuses on predictive, positional, and macro insights:
ML-Predicted Price: A linear regression forecast using normalized price, volume, and RSI over a customizable lookback (default 500 bars). Gradient scales from low (red) to high (green) relative to the current price ± threshold (default 100 points).
Deviation %: Percentage difference between current price and predicted price. Gradient highlights extremes (±0.5% default threshold), signaling potential overextensions.
VWAP Deviation %: Percentage difference from Volume Weighted Average Price (VWAP). Gradient indicates if price is above (green) or below (red) fair value (±0.5% default).
FRED UNRATE % Change: Percentage change in U.S. unemployment rate (via FRED data). Cell turns red for increases (economic weakness), green for decreases (strength), gray if zero or disabled.
Open Interest: Total open MESM2 futures contracts. Gradient scales from low (red) to high (green) up to a hardcoded 300,000 threshold, reflecting market participation.
COT Commercial Long/Short: Weekly Commitment of Traders data for commercial positions. Long cell green if longs > shorts (bullish institutional sentiment); Short cell red if shorts > longs (bearish); gray otherwise.
New Metrics Table Metrics
This table emphasizes technical momentum and volatility, with arrows for quick bias assessment:
QQE Bias: Smoothed RSI vs. trailing stop (default length 14, factor 4.236, smooth 5). Green for bullish (RSI > stop, ↑ arrow), red for bearish (RSI < stop, ↓ arrow), gray for neutral.
RSI: Relative Strength Index (default period 14). Gradient from oversold (red, <30 + threshold offset, ↓ arrow if ≤40) to overbought (green, >70 - offset, ↑ arrow if ≥60).
ATR Volatility: Score (1–20) based on Average True Range (default period 14, lookback 50). High scores (green, ↑ if ≥15) signal swings; low (red, ↓ if ≤5) indicate calm.
ADX Trend: Average Directional Index (default period 14). Gradient from weak (red, ↓ if ≤0.25×25 threshold) to strong trends (green, ↑ if ≥0.75×25).
Volume Momentum: Score (1–20) comparing current to historical volume (lookback 50). High (green, ↑ if ≥15) suggests pressure; low (red, ↓ if ≤5) implies weakness.
Frahm Volatility: Score (1–20) from true range over a window (default 24 hours, multiplier 9). Dynamic gradient (green/red/yellow); ↑ if ≥7.5, ↓ if ≤2.5.
Frahm Avg Candle (Ticks): Average candle size in ticks over the window. Blue gradient (or dynamic green/red/yellow); ↑ if ≥0.75 percentile, ↓ if ≤0.25.
Arrows trigger on metric-specific logic (e.g., RSI ≥60 for ↑), providing directional cues without strict color ties.
Customization Options
Adapt the indicator to your strategy:
ML Inputs: Lookback (10–5000 bars) and RSI period (2+) for prediction sensitivity—shorter for volatility, longer for trends.
Timeframes: Individual per metric (e.g., 1H for QQE Bias to match higher frames; blank for chart timeframe).
Thresholds: Adjust gradients and arrows (e.g., Deviation 0.1–5%, ADX 0–100, RSI overbought/oversold).
QQE Settings: Length, factor, and smooth for fine-tuned momentum.
Data Toggles: Enable/disable FRED, Open Interest, COT for focus (e.g., disable macro for pure intraday).
Frahm Options: Window hours (1+), scale multiplier (1–10), dynamic colors for avg candle.
Plot/Table: Line color, positions, gradients, and visibility.
Ideal Use Case
Perfect for MESM2 scalpers and trend traders. Use the Main Table for entry confirmation via predicted deviations and institutional positioning. Leverage the New Metrics Table arrows for short-term signals—enter bullish on green consensus (all ↑), avoid chop on low volatility. Set alerts to catch shifts without constant monitoring.
Why It's Valuable
Info Table V1 consolidates diverse metrics into actionable visuals, answering critical questions: Is price mispriced? Is momentum aligning? Is volatility manageable? With real-time updates, consensus highlights, and extensive customization, it enhances precision in fast markets, reducing guesswork for confident trades.
Note: Optimized for futures; some metrics (OI, COT) unavailable on non-futures symbols. Test on demo accounts. No financial advice—use at your own risk.
The provided script reuses open-source elements from TradingView's Color Library and LuxAlgo's QQE Weighted Oscillator, as noted in the script comments and description. Credits are appropriately given in both the description and code comments, satisfying the requirement for attribution.
Regarding significant improvements and proportion:
The QQE logic comprises approximately 15 lines of code in a script exceeding 400 lines, representing a small proportion (<5%).
Adaptations include integration with multi-timeframe support via request.security, user-customizable inputs for length, factor, and smooth, and application within a broader table-based indicator for momentum bias display (with color gradients, arrows, and alerts). This extends the original QQE beyond standalone oscillator use, incorporating it as one of seven metrics in the New Metrics Table for confluence analysis (e.g., consensus highlighting when all metrics align). These are functional enhancements, not mere stylistic or variable changes.
The Color Library usage is via official import (import TradingView/Color/1 as Color), leveraging built-in gradient functions without copying code, and applied to enhance visual interpretation across multiple metrics.
The script complies with the rules: reused code is minimal, significantly improved through integration and expansion, and properly credited. It qualifies for open-source publication under the Mozilla Public License 2.0, as stated.

Market Matrix ViewThis technical indicator is designed to provide traders with a quick and integrated view of market dynamics by combining several popular indicators into a single tool. It's not a magic bullet, but a practical aid for analyzing buying/selling pressure, trends, volume, and divergences, saving you time in the decision-making process. Built for flexibility, the indicator adapts to various trading styles (scalping, swing, or long-term) and offers customizable settings to suit your needs.
🟡 Multi-Timeframe Trends
➤ This section displays the trend direction (bullish, bearish, or neutral) across 15-minute, 1-hour, 4-hour, and Daily timeframes, providing multi-timeframe market context. Timeframes lower than the one currently selected will show "N/A."
➤It utilizes fast and slow Exponential Moving Averages (EMAs) for each timeframe:
15m: Fast EMA 42, Slow EMA 170
1h: Fast EMA 40, Slow EMA 100
4h: Fast EMA 36, Slow EMA 107
Daily: Fast EMA 20, Slow EMA 60
🟡 Smart Flow & RVOL
➤ This section displays "Buying Pressure" or "Selling Pressure" signals based on indicator confluence, alongside volume activity ("High Activity," "Normal Activity," or "Low Activity").
➤ Smart Flow combines Chaikin Money Flow (CMF) and Money Flow Index (MFI) to detect buying/selling pressure. CMF measures money flow based on price position within the high-low range, while MFI analyzes money flow considering typical price and volume. A signal is generated only when both indicators simultaneously increase/decrease beyond an adjustable threshold ("Buy/Sell Sensitivity") and volume exceeds a Simple Moving Average (SMA) scaled by the "Volume Multiplier."
➤ RVOL (Relative Volume) calculates relative volume separately for bullish and bearish candles, comparing recent volume (fast SMA) with a reference volume (slow SMA). Thresholds are adjusted based on the selected mode.
🟡 ADX & RSI
This section displays trend strength ("Strong," "Moderate," or "Weak"), its direction ("Bullish" or "Bearish"), and the RSI momentum status ("Overbought," "Oversold," "Buy/Sell Momentum," or "Neutral").
➤ ADX (Average Directional Index) measures trend strength (above 40 = "Strong," 20–40 = "Moderate," below 20 = "Weak"). Direction is determined by comparing +DI (upward movement) with -DI (downward movement). Additionally, an arrow indicates whether the trend's strength is decreasing or increasing.
➤RSI (Relative Strength Index) evaluates price momentum. Extreme levels (above 80/85 = "Overbought," below 15/20 = "Oversold") and intermediate zones (47–53 = "Neutral," above 53 = "Buy Momentum," below 47 = "Sell Momentum") are adjusted based on the selected mode.
🟡 When these signals are active for a potential trade setup, the table's background lights up green or red, respectively.
🟡 Volume Spikes
➤This feature highlights bars with significantly higher volume than the recent average, coloring them yellow on the chart to draw attention to intense market activity.
➤It uses the Z-Score method to detect volume anomalies. Current volume is compared to a 10-bar Simple Moving Average (SMA) and the standard deviation of volume over the same period. If the Z-Score exceeds a certain threshold, the bar is marked as a volume spike.
🟡 Divergences (Volume Divergence Detection)
➤ This feature marks divergences between price and technical indicators on the chart, using diamond-shaped labels (green for bullish divergences, red for bearish divergences) to signal potential trend reversals.
➤ It compares price deviations from a Simple Moving Average (SMA) with deviations of three indicators: Chaikin Money Flow (CMF), Money Flow Index (MFI), and On-Balance Volume (OBV). A bullish divergence occurs when price falls below its average, but CMF, MFI, and OBV rise above their averages, indicating hidden accumulation. A bearish divergence occurs when price rises above its average, but CMF, MFI, and OBV fall, suggesting distribution. The length of the moving averages is adjustable (default 13/10/5 bars for Scalping/Balanced/Swing), and detection thresholds are scaled by "Divergence Sensitivity" (default 1.0).
🟡 Adaptive Stop-Loss (ATR)
➤Draws dynamic stop-loss lines (red, dashed) on the chart for buy or sell signals, helping traders manage risk.Uses the Average True Range (ATR) to calculate stop-loss levels, set at low/high ± ATR × multiplier
🟡 Alerts for trend direction changes in the Info Panel:
➤ Triggers notifications when the trend shifts to Bullish (when +DI crosses above -DI) or Bearish (when +DI crosses below -DI), helping you stay informed about key market shifts.
How to use: Set alerts in Trading View for “Trend Changed to Bullish” or “Trend Changed to Bearish” with “Once Per Bar Close” for reliable signals.
🟡 Settings (Inputs)
➤ The indicator offers customizable settings to fit your trading style, but it's already optimized for Scalping (1m–15m), Balanced (16m–3h59m), and Swing (4h–Daily) modes, which automatically adjust based on the selected timeframe. The visible inputs allow you to adjust the following parameters:
Show Info Panel: Enables/disables the information panel (default: enabled).
Show Volume Spikes: Turns on/off coloring for volume spike bars (default: enabled).
Spike Sensitivity: Controls the Z-Score threshold for detecting volume spikes (default: 2.0; lower values increase signal frequency).
Show Divergence: Enables/disables the display of divergence labels (default: enabled).
Divergence Sensitivity: Adjusts the thresholds for divergence detection (default: 1.0; higher values reduce sensitivity).
Divergence Lookback Length: Sets the length of the moving averages used for divergences (default: 5, automatically adjusted to 13/10/5 for Scalping/Balanced/Swing).
RVOL Reference Period: Defines the reference period for relative volume (default: 20, automatically adjusted to 7/15/20).
RSI Length: Sets the RSI length (default: 14, automatically adjusted to 5/10/14).
Buy Sensitivity: Controls the increase threshold for Buying Pressure signals (default: 0.007; higher values reduce frequency).
Sell Sensitivity: Controls the decrease threshold for Selling Pressure signals (default: 0.007; higher values reduce frequency).
Volume Multiplier (B/S Pressure): Adjusts the volume threshold for Smart Flow signals (default: 0.6; higher values require greater volume).
🟡 This indicator is created to simplify market analysis, but I am not a professional in Pine Script or technical indicators. This indicator is not a standalone solution. For optimal results, it must be integrated into a well-defined trading strategy that includes risk management and other confirmations.

Big Mover Catcher BTC 4h🧠 Big Mover Catcher (BTC 4H Strategy) — Educational Tool
⚠️ Disclaimer: I am not a financial advisor. This script is for educational and testing purposes only. Cryptocurrency trading is highly volatile and involves significant risk. You can lose all of your invested capital.
📌 Overview
The Big Mover Catcher strategy is a work-in-progress trading system designed for Bitcoin (BTC) on the 4-hour chart. It aims to identify strong breakout moves by combining multiple technical indicators and conditions, allowing for high customization and filter-based confirmations.
This script is part of a personal project to learn Pine Script and backtesting on TradingView. It is currently in the testing and research phase.
🎯 Strategy Objective
Catch large, high-momentum breakout moves in the BTC market using:
Bollinger Band breakouts for entry signals
Momentum, volatility, and trend filters for trade confirmation
🧰 Features & Filters
The script provides a flexible set of filters that can be turned ON/OFF and adjusted directly from the settings panel:
✅ Entry Conditions
Price must break above or below Bollinger Bands
All selected filters must align before entry
🧪 Available Filters:
Relative Strength Index (RSI) with EMA/SMA smoothing
Average Directional Index (ADX) with EMA/SMA smoothing
Average True Range (ATR) with EMA/SMA smoothing
MACD Signal above or below zero
EMA 350 trend filter
ATR / ADX / RSI Threshold toggles for added control
🔥 Additional Feature:
Force Take Profit: Optionally closes the trade immediately if a candle closes with more than a defined % movement (default: 5%). This can help lock in quick profits during high volatility moves.
⚙️ Customizable Inputs
You can configure:
Stop loss percentage
All indicator lengths
Smoothing types (EMA/SMA)
Threshold activation toggles
Individual filter ON/OFF switches
This makes the strategy highly adaptable for educational exploration and optimization.
📊 Best Used For
Learning Pine Script and strategy structure
Testing filter combinations for BTC on the 4H timeframe
Understanding how different indicators interact in live markets
⚠️ Note: ❌ Short trades are currently disabled by default, as short-side logic is still under development.
❗ Final Reminder
This script is not financial advice. It is an educational tool. Use it to learn and explore trading logic. Trading cryptocurrencies carries high risk — only invest what you can afford to lose.

Institutional Quantum Momentum Impulse [BullByte]## Overview
The Institutional Quantum Momentum Impulse (IQMI) is a sophisticated momentum oscillator designed to detect institutional-level trend strength, volatility conditions, and market regime shifts. It combines multiple advanced technical concepts, including:
- Quantum Momentum Engine (Hilbert Transform + MACD Divergence + Stochastic Energy)
- Fractal Volatility Scoring (GARCH + Keltner-based volatility)
- Dynamic Adaptive Bands (Self-adjusting thresholds based on efficiency)
- Market Phase Detection (Volume + Momentum alignment)
- Liquidity & Cumulative Delta Analysis
The indicator provides a Z-score normalized momentum reading, making it ideal for mean-reversion and trend-following strategies.
---
## Key Features
### 1. Quantum Momentum Core
- Combines Hilbert Transform, MACD divergence, and Stochastic Energy into a single composite momentum score.
- Normalized using a Z-score for statistical significance.
- Smoothed with EMA/WMA/HMA for cleaner signals.
### 2. Dynamic Adaptive Bands
- Upper/Lower bands adjust based on volatility and efficiency ratio .
- Acts as overbought/oversold zones when momentum reaches extremes.
### 3. Market Phase Detection
- Identifies bullish , bearish , or neutral phases using:
- Volume-Weighted MA alignment
- Fractal momentum extremes
### 4. Volatility & Liquidity Filters
- Fractal Volatility Score (0-100 scale) shows market instability.
- Liquidity Check ensures trades are taken in favorable spread conditions.
### 5. Dashboard & Visuals
- Real-time dashboard with key metrics:
- Momentum strength, volatility, efficiency, cumulative delta, and market regime.
- Gradient coloring for intuitive momentum visualization .
---
## Best Trade Setups
### 1. Trend-Following Entries
- Signal :
- QM crosses above zero + Market Phase = Bullish + ADX > 25
- Cumulative Delta rising (buying pressure)
- Confirmation :
- Efficiency > 0.5 (strong momentum quality)
- Liquidity = High (tight spreads)
### 2. Mean-Reversion Entries
- Signal :
- QM touches upper band + Volatility expanding
- Market Regime = Ranging (ADX < 25)
- Confirmation :
- Efficiency < 0.3 (weak momentum follow-through)
- Cumulative Delta divergence (price high but delta declining)
### 3. Breakout Confirmation
- Signal :
- QM holds above zero after a pullback
- Market Phase shifts to Bullish/Bearish
- Confirmation :
- Volatility rising (expansion phase)
- Liquidity remains high
---
## Recommended Timeframes
- Intraday (5M - 1H): Works well for scalping & swing trades.
- Swing Trading (4H - Daily): Best for trend-following setups.
- Position Trading (Weekly+): Useful for macro trend confirmation.
---
## Input Customization
- Resonance Factor (1.0 - 3.618 ): Adjusts MACD divergence sensitivity.
- Entropy Filter (0.382/0.50/0.618) : Controls stochastic damping.
- Smoothing Type (EMA/WMA/HMA) : Changes momentum responsiveness.
- Normalization Period : Adjusts Z-score lookback.
---
The IQMI is a professional-grade momentum indicator that combines institutional-level concepts into a single, easy-to-read oscillator. It works across all markets (stocks, forex, crypto) and is ideal for traders who want:
✅ Early trend detection
✅ Volatility-adjusted signals
✅ Institutional liquidity insights
✅ Clear dashboard for quick analysis
Try it on TradingView and enhance your trading edge! 🚀
Happy Trading!
- BullByte

Multi-Time Frame DMI with Gradient Bar ColoringDisplays a table showing the Directional Movement Index (DMI) sentiment for multiple time frames based on the Average Directional Index (ADX) value for each time frame.
Table Position and Text Size are configurable, with two styles (vertical or horizontal) available.
Time frame labels can be toggled off for color-only table.
Bars are colored based on the ADX value using a color gradient between the bullish and bearish color inputs. The neutral color is independent of the gradient for contrast.

Volume Weighted RSI (VW RSI)The Volume Weighted RSI (VW RSI) is a momentum oscillator designed for TradingView, implemented in Pine Script v6, that enhances the traditional Relative Strength Index (RSI) by incorporating trading volume into its calculation. Unlike the standard RSI, which measures the speed and change of price movements based solely on price data, the VW RSI weights its analysis by volume, emphasizing price movements backed by significant trading activity. This makes the VW RSI particularly effective for identifying bullish or bearish momentum, overbought/oversold conditions, and potential trend reversals in markets where volume plays a critical role, such as stocks, forex, and cryptocurrencies.
Key Features
Volume-Weighted Momentum Calculation:
The VW RSI calculates momentum by comparing the volume associated with upward price movements (up-volume) to the volume associated with downward price movements (down-volume).
Up-volume is the volume on bars where the closing price is higher than the previous close, while down-volume is the volume on bars where the closing price is lower than the previous close.
These volumes are smoothed over a user-defined period (default: 14 bars) using a Running Moving Average (RMA), and the VW RSI is computed using the formula:
\text{VW RSI} = 100 - \frac{100}{1 + \text{VoRS}}
where
\text{VoRS} = \frac{\text{Average Up-Volume}}{\text{Average Down-Volume}}
.
Oscillator Range and Interpretation:
The VW RSI oscillates between 0 and 100, with a centerline at 50.
Above 50: Indicates bullish volume momentum, suggesting that volume on up bars dominates, which may signal buying pressure and a potential uptrend.
Below 50: Indicates bearish volume momentum, suggesting that volume on down bars dominates, which may signal selling pressure and a potential downtrend.
Overbought/Oversold Levels: User-defined thresholds (default: 70 for overbought, 30 for oversold) help identify potential reversal points:
VW RSI > 70: Overbought, indicating a possible pullback or reversal.
VW RSI < 30: Oversold, indicating a possible bounce or reversal.
Visual Elements:
VW RSI Line: Plotted in a separate pane below the price chart, colored dynamically based on its value:
Green when above 50 (bullish momentum).
Red when below 50 (bearish momentum).
Gray when at 50 (neutral).
Centerline: A dashed line at 50, optionally displayed, serving as the neutral threshold between bullish and bearish momentum.
Overbought/Oversold Lines: Dashed lines at the user-defined overbought (default: 70) and oversold (default: 30) levels, optionally displayed, to highlight extreme conditions.
Background Coloring: The background of the VW RSI pane is shaded red when the indicator is in overbought territory and green when in oversold territory, providing a quick visual cue of potential reversal zones.
Alerts:
Built-in alerts for key events:
Bullish Momentum: Triggered when the VW RSI crosses above 50, indicating a shift to bullish volume momentum.
Bearish Momentum: Triggered when the VW RSI crosses below 50, indicating a shift to bearish volume momentum.
Overbought Condition: Triggered when the VW RSI crosses above the overbought threshold (default: 70), signaling a potential pullback.
Oversold Condition: Triggered when the VW RSI crosses below the oversold threshold (default: 30), signaling a potential bounce.
Input Parameters
VW RSI Length (default: 14): The period over which the up-volume and down-volume are smoothed to calculate the VW RSI. A longer period results in smoother signals, while a shorter period increases sensitivity.
Overbought Level (default: 70): The threshold above which the VW RSI is considered overbought, indicating a potential reversal or pullback.
Oversold Level (default: 30): The threshold below which the VW RSI is considered oversold, indicating a potential reversal or bounce.
Show Centerline (default: true): Toggles the display of the 50 centerline, which separates bullish and bearish momentum zones.
Show Overbought/Oversold Lines (default: true): Toggles the display of the overbought and oversold threshold lines.
How It Works
Volume Classification:
For each bar, the indicator determines whether the price movement is upward or downward:
If the current close is higher than the previous close, the bar’s volume is classified as up-volume.
If the current close is lower than the previous close, the bar’s volume is classified as down-volume.
If the close is unchanged, both up-volume and down-volume are set to 0 for that bar.
Smoothing:
The up-volume and down-volume are smoothed using a Running Moving Average (RMA) over the specified period (default: 14 bars) to reduce noise and provide a more stable measure of volume momentum.
VW RSI Calculation:
The Volume Relative Strength (VoRS) is calculated as the ratio of smoothed up-volume to smoothed down-volume.
The VW RSI is then computed using the standard RSI formula, but with volume data instead of price changes, resulting in a value between 0 and 100.
Visualization and Alerts:
The VW RSI is plotted with dynamic coloring to reflect its momentum direction, and optional lines are drawn for the centerline and overbought/oversold levels.
Background coloring highlights overbought and oversold conditions, and alerts notify the trader of significant crossings.
Usage
Timeframe: The VW RSI can be used on any timeframe, but it is particularly effective on intraday charts (e.g., 1-hour, 4-hour) or daily charts where volume data is reliable. Shorter timeframes may require a shorter length for increased sensitivity, while longer timeframes may benefit from a longer length for smoother signals.
Markets: Best suited for markets with significant and reliable volume data, such as stocks, forex, and cryptocurrencies. It may be less effective in markets with low or inconsistent volume, such as certain futures contracts.
Trading Strategies:
Trend Confirmation:
Use the VW RSI to confirm the direction of a trend. For example, in an uptrend, look for the VW RSI to remain above 50, indicating sustained bullish volume momentum, and consider buying on pullbacks when the VW RSI dips but stays above 50.
In a downtrend, look for the VW RSI to remain below 50, indicating sustained bearish volume momentum, and consider selling on rallies when the VW RSI rises but stays below 50.
Overbought/Oversold Conditions:
When the VW RSI crosses above 70, the market may be overbought, suggesting a potential pullback or reversal. Consider taking profits on long positions or preparing for a short entry, but confirm with price action or other indicators.
When the VW RSI crosses below 30, the market may be oversold, suggesting a potential bounce or reversal. Consider entering long positions or covering shorts, but confirm with additional signals.
Divergences:
Look for divergences between the VW RSI and price to spot potential reversals. For example, if the price makes a higher high but the VW RSI makes a lower high, this bearish divergence may signal an impending downtrend.
Conversely, if the price makes a lower low but the VW RSI makes a higher low, this bullish divergence may signal an impending uptrend.
Momentum Shifts:
A crossover above 50 can signal the start of bullish momentum, making it a potential entry point for long trades.
A crossunder below 50 can signal the start of bearish momentum, making it a potential entry point for short trades or an exit for long positions.
Example
On a 4-hour SOLUSDT chart:
During an uptrend, the VW RSI might rise above 50 and stay there, confirming bullish volume momentum. If it approaches 70, it may indicate overbought conditions, as seen near a price peak of 145.08, suggesting a potential pullback.
During a downtrend, the VW RSI might fall below 50, confirming bearish volume momentum. If it drops below 30 near a price low of 141.82, it may indicate oversold conditions, suggesting a potential bounce, as seen in a slight recovery afterward.
A bullish divergence might occur if the price makes a lower low during the downtrend, but the VW RSI makes a higher low, signaling a potential reversal.
Limitations
Lagging Nature: Like the traditional RSI, the VW RSI is a lagging indicator because it relies on smoothed data (RMA). It may not react quickly to sudden price reversals, potentially missing the start of new trends.
False Signals in Ranging Markets: In choppy or ranging markets, the VW RSI may oscillate around 50, generating frequent crossovers that lead to false signals. Combining it with a trend filter (e.g., ADX) can help mitigate this.
Volume Data Dependency: The VW RSI relies on accurate volume data, which may be inconsistent or unavailable in some markets (e.g., certain forex pairs or futures contracts). In such cases, the indicator’s effectiveness may be reduced.
Overbought/Oversold in Strong Trends: During strong trends, the VW RSI can remain in overbought or oversold territory for extended periods, leading to premature exit signals. Use additional confirmation to avoid exiting too early.
Potential Improvements
Smoothing Options: Add options to use different smoothing methods (e.g., EMA, SMA) instead of RMA for the up/down volume calculations, allowing users to adjust the indicator’s responsiveness.
Divergence Detection: Include logic to detect and plot bullish/bearish divergences between the VW RSI and price, providing visual cues for potential reversals.
Customizable Colors: Allow users to customize the colors of the VW RSI line, centerline, overbought/oversold lines, and background shading.
Trend Filter: Integrate a trend strength filter (e.g., ADX > 25) to ensure signals are generated only during strong trends, reducing false signals in ranging markets.
The Volume Weighted RSI (VW RSI) is a powerful tool for traders seeking to incorporate volume into their momentum analysis, offering a unique perspective on market dynamics by emphasizing price movements backed by significant trading activity. It is best used in conjunction with other indicators and price action analysis to confirm signals and improve trading decisions.

Hierarchical + K-Means Clustering Strategy===== USER GUIDE =====
Hierarchical + K-Means Clustering Strategy
OVERVIEW:
This strategy combines hierarchical clustering and K-means algorithms to analyze market volatility patterns
and generate trading signals. It uses a modified SuperTrend indicator with ATR-based volatility clustering
to identify potential trend changes and market conditions.
KEY FEATURES:
- Advanced volatility analysis using hierarchical clustering and K-means algorithms
- Modified SuperTrend indicator for trend identification
- Multiple filter options including moving average and ADX trend strength
- Volume-based exit mechanism to protect profits
- Customizable appearance settings
SETTINGS EXPLANATION:
1. SuperTrend Settings:
- ATR Length: Period for ATR calculation (default: 11)
- SuperTrend Factor: Multiplier for ATR to determine trend bands (default: 3)
2. Hierarchical Clustering Settings:
- Training Data Length: Number of bars used for clustering analysis (default: 200)
3. Appearance Settings:
- Transparency 1 & 2: Control the opacity of trend lines and fills
- Bullish/Bearish Color: Colors for uptrend and downtrend visualization
4. Time Settings:
- Start Year/Month: Define when the strategy should start executing trades
5. Filter Settings:
- Moving Average Filter: Uses SMA to filter trades (only enter when price is on correct side of MA)
- Trend Strength Filter: Uses ADX to ensure trades are taken in strong trend conditions
6. Volume Stop Loss Settings:
- Volume Ratio Threshold: Controls sensitivity of volume-based exits
- Monitoring Delay Bars: Number of bars to wait before monitoring volume for exit signals
HOW TO USE:
1. Apply the indicator to your chart
2. Adjust settings according to your trading preferences and timeframe
3. Long signals appear when price crosses above the SuperTrend line (▲k marker)
4. Short signals appear when price crosses below the SuperTrend line (▼k marker)
5. The strategy automatically manages exits based on volume balance conditions
INTERPRETATION:
- Green line/area: Bullish trend - consider long positions
- Red line/area: Bearish trend - consider short positions
- Yellow line: Moving average for additional trend confirmation
- Volume balance exits occur when buying/selling pressure equalizes
RECOMMENDED TIMEFRAMES:
This strategy works best on 1H, 4H, and daily charts for most markets.
For highly volatile assets, shorter timeframes may also be effective.
RISK MANAGEMENT:
Always use proper position sizing and consider setting additional stop losses
beyond the strategy's built-in exit mechanisms.
===== END OF USER GUIDE =====

Atr Target TP & Protecion Zone [Pinescriptlabs]This indicator provides an adaptive trailing stop system with dynamic price targets and protection zones, ideal for position management.
Main Features:
🚦 ADAPTIVE TRAILING STOP:
Automatically adjusts based on volatility (ATR) and volume
Two modes: "Modified" and "UnModified" for true range calculation
Displayed as a line with colored background (green for longs, red for shorts)
🎯 TARGET ZONES (T1 & T2):
Calculates two target zones (T1 and T2) based on:
Market strength (combination of RSI, volume, MFI, ADX, MACD)
Current volatility (ATR)
Distance from current price
Visualized with blue boxes (T1) and purple boxes (T2)
🛡️ PROTECTION ZONE:
Automatically activates in sideways markets
Provides an additional buffer to the trailing stop
Helps avoid premature exits in volatile markets
📊 INFORMATION PANELS:
Top Right Panel displays:
Current trend direction
Target status (T1 & T2)
Market strength
Current ATR
RSI level
Bottom Right Panel displays:
Trailing status (WIDE/NORMAL)
Volume impact
Directional strength
Protection zone status
Español:
Este indicador proporciona un sistema de trailing stop adaptativo con objetivos de precio dinámicos y zonas de protección, ideal para la gestión de posiciones.
**Características Principales**:
🚦 **TRAILING STOP ADAPTATIVO**:
- Se ajusta automáticamente según la volatilidad (ATR) y el volumen
- Dos modos: "Modified" y "UnModified" para el cálculo del rango verdadero
- Se visualiza como una línea con fondo coloreado (verde para largos, rojo para cortos)
🎯 **ZONAS OBJETIVO (T1 y T2)**:
- Calcula dos zonas objetivo (T1 y T2) basadas en:
- Fuerza del mercado (combinación de RSI, volumen, MFI, ADX, MACD)
- Volatilidad actual (ATR)
- Distancia al precio actual
- Visualización mediante cajas azules (T1) y moradas (T2)
🛡️ **ZONA DE PROTECCIÓN**:
- Se activa automáticamente en mercados laterales
- Proporciona un buffer adicional al trailing stop
- Ayuda a evitar salidas prematuras en mercados volátiles
📊 **PANELES INFORMATIVOS**:
*Panel Superior Derecho* muestra:
- Dirección de la tendencia actual
- Estado de los objetivos (T1 y T2)
- Fuerza del mercado
- ATR actual
- Nivel de RSI
*Panel Inferior Derecho* muestra:
- Estado del trailing (WIDE/NORMAL)
- Impacto del volumen
- Fuerza direccional
- Estado de la zona de protección

[3Commas] Signal BuilderSignal Builder is a tool designed to help traders create custom buy and sell signals by combining multiple technical indicators. Its flexibility allows traders to set conditions based on their specific strategy, whether they’re into scalping, swing trading, or long-term investing. Additionally, its integration with 3Commas bots makes it a powerful choice for those looking to automate their trades, though it’s also ideal for traders who prefer receiving alerts and making manual decisions.
🔵 How does Signal Builder work?
Signal Builder allows users to define custom conditions using popular technical indicators, which, when met, generate clear buy or sell signals. These signals can be used to trigger TradingView alerts, ensuring that you never miss a market opportunity. Additionally, all conditions are evaluated using "AND" logic, meaning signals are only activated when all user-defined conditions are met. This increases precision and helps avoid false signals.
🔵 Available indicators and recommended settings:
Signal Builder provides access to a wide range of technical indicators, each customizable to popular settings that maximize effectiveness:
RSI (Relative Strength Index): An oscillator that measures the relative strength of price over a specific period. Traders typically configure it with 14 periods, using levels of 30 (oversold) and 70 (overbought) to identify potential reversals.
MACD (Moving Average Convergence Divergence): A key indicator tracking the crossover between two moving averages. Common settings include 12 and 26 periods for the moving averages, with a 9-period signal line to detect trend changes.
Ultimate Oscillator: Combines three different time frames to offer a comprehensive view of buying and selling pressure. Popular settings are 7, 14, and 28 periods.
Bollinger Bands %B: Provides insight into where the price is relative to its upper and lower bands. Standard settings include a 20-period moving average and a standard deviation of 2.
ADX (Average Directional Index): Measures the strength of a trend. Values above 25 typically indicate a strong trend, while values below suggest weak or sideways movement.
Stochastic Oscillator: A momentum indicator comparing the closing price to its range over a defined period. Popular configurations include 14 periods for %K and 3 for %D smoothing.
Parabolic SAR: Ideal for identifying trend reversals and entry/exit points. Commonly configured with a 0.02 step and a 0.2 maximum.
Money Flow Index (MFI): Similar to RSI but incorporates volume into the calculation. Standard settings use 14 periods, with levels of 20 and 80 as oversold and overbought thresholds.
Commodity Channel Index (CCI): Measures the deviation of price from its average. Traders often use a 20-period setting with levels of +100 and -100 to identify extreme overbought or oversold conditions.
Heikin Ashi Candles: These candles smooth out price fluctuations to show clearer trends. Commonly used in trend-following strategies to filter market noise.
🔵 How to use Signal Builder:
Configure indicators: Select the indicators that best fit your strategy and adjust their settings as needed. You can combine multiple indicators to define precise entry and exit conditions.
Define custom signals: Create buy or sell conditions that trigger when your selected indicators meet the criteria you’ve set. For example, configure a buy signal when RSI crosses above 30 and MACD confirms with a bullish crossover.
TradingView alerts: Set up alerts in TradingView to receive real-time notifications when the conditions you’ve defined are met, allowing you to react quickly to market opportunities without constantly monitoring charts.
Monitor with the panel: Signal Builder includes a visual panel that shows active conditions for each indicator in real time, helping you keep track of signals without manually checking each indicator.
🔵 3Commas integration:
In addition to being a valuable tool for any trader, Signal Builder is optimized to work seamlessly with 3Commas bots through Webhooks. This allows you to automate your trades based on the signals you’ve configured, ensuring that no opportunity is missed when your defined conditions are met. If you prefer automation, Signal Builder can send buy or sell signals to your 3Commas bots, enhancing your trading process and helping you manage multiple trades more efficiently.
🔵 Example of use:
Imagine you trade in volatile markets and want to trigger a sell signal when:
Stochastic Oscillator indicates overbought conditions with the %K value crossing below 80.
Bollinger Bands %B shows the price has surpassed the upper band, suggesting a potential reversal.
ADX is below 20, indicating that the trend is weak and could be about to change.
With Signal Builder , you can configure these conditions to trigger a sell signal only when all are met simultaneously. Then, you can set up a TradingView alert to notify you as soon as the signal is activated, giving you the opportunity to react quickly and adjust your strategy accordingly.
👨🏻💻💭 If this tool helps your trading strategy, don’t forget to give it a boost! Feel free to share in the comments how you're using it or if you have any questions.
_________________________________________________________________
The information and publications within the 3Commas TradingView account are not meant to be and do not constitute financial, investment, trading, or other types of advice or recommendations supplied or endorsed by 3Commas and any of the parties acting on behalf of 3Commas, including its employees, contractors, ambassadors, etc.

Swiss Knife [MERT]Introduction
The Swiss Knife indicator is a comprehensive trading tool designed to provide a multi-dimensional analysis of the market. By integrating a wide array of technical indicators across multiple timeframes, it offers traders a holistic view of market sentiment, momentum, and potential reversal points. This indicator is particularly useful for traders looking to combine trend analysis, momentum indicators, volume data, and price action into a single, easy-to-read format.
---
Key Features
Multi-Timeframe Analysis : Evaluates indicators on Daily , 4-Hour , 1-Hour , and 15-Minute timeframes.
Comprehensive Indicator Suite : Incorporates MACD , Awesome Oscillator (AO) , Parabolic SAR , SuperTrend , DPO , RSI , Stochastic Oscillator , Bollinger Bands , Ichimoku Cloud , Chande Momentum Oscillator (CMO) , Donchian Channels , ADX , volume-based momentum indicators, Fractals , and divergence detection.
Market Sentiment Scoring : Aggregates signals from multiple indicators to provide an overall sentiment score.
Visual Aids : Displays EMA lines, trendlines, divergence signals, and a sentiment table directly on the chart.
Super Trend Reversal Signals : Identifies potential market reversal points by assessing the momentum of automated trading bots.
---
Explanation of Each Indicator
Moving Average Convergence Divergence (MACD)
- Purpose : Measures the relationship between two moving averages of price.
- Interpretation : A positive histogram suggests bullish momentum; a negative histogram indicates bearish momentum.
Awesome Oscillator (AO)
- Purpose : Gauges market momentum by comparing recent market movements to historic ones.
- Interpretation : Above zero indicates bullish momentum; below zero indicates bearish momentum.
Parabolic SAR (SAR)
- Purpose : Identifies potential reversal points in price direction.
- Interpretation : Dots below price suggest an uptrend; dots above price suggest a downtrend.
SuperTrend
- Purpose : Determines the prevailing market trend.
- Interpretation : Provides buy or sell signals based on price movements relative to the SuperTrend line.
Detrended Price Oscillator (DPO)
- Purpose : Removes trend from price to identify cycles.
- Interpretation : Values above zero suggest price is above the moving average; values below zero indicate it is below.
Relative Strength Index (RSI)
- Purpose : Measures the speed and change of price movements.
- Interpretation : Values above 50 indicate bullish momentum; values below 50 indicate bearish momentum.
Stochastic Oscillator
- Purpose : Compares a particular closing price to a range of its prices over a certain period.
- Interpretation : Values above 50 indicate bullish conditions; values below 50 indicate bearish conditions.
Bollinger Bands (BB)
- Purpose : Measures market volatility and provides relative price levels.
- Interpretation : Price above the middle band suggests bullishness; below the middle band suggests bearishness.
Ichimoku Cloud
- Purpose : Provides support and resistance levels, trend direction, and momentum.
- Interpretation : Bullish signals when price is above the cloud; bearish signals when price is below the cloud.
Chande Momentum Oscillator (CMO)
- Purpose : Measures momentum on both up and down days.
- Interpretation : Values above 50 indicate strong upward momentum; values below -50 indicate strong downward momentum.
Donchian Channels
- Purpose : Identifies volatility and potential breakouts.
- Interpretation : Price above the upper band suggests bullish breakout; below the lower band suggests bearish breakout.
Average Directional Index (ADX)
- Purpose : Measures the strength of a trend.
- Interpretation : DI+ above DI- indicates bullish trend; DI- above DI+ indicates bearish trend.
Volume Momentum Indicators (VolMom, CumVolMom, POCMom)
- Purpose : Analyze volume to assess buying and selling pressure.
- Interpretation : Positive values suggest bullish volume momentum; negative values indicate bearish volume momentum.
Fractals
- Purpose : Identify potential reversal points in the market.
- Interpretation : Up fractals may indicate a future downtrend; down fractals may indicate a future uptrend.
Divergence Detection
- Purpose : Identifies divergences between price and various indicators (RSI, MACD, Stochastic, OBV, MFI, A/D Line).
- Interpretation : Bullish divergences suggest potential upward reversal; bearish divergences suggest potential downward reversal.
- Note : This functionality utilizes the library from Divergence Indicator .
---
Coloring Scheme
Background Color
- Purpose : Reflects the overall market sentiment by combining sentiment scores from all indicators across different timeframes.
- Interpretation :
- Green Shades : Indicate bullish market sentiment.
- Red Shades : Indicate bearish market sentiment.
- Intensity : The strength of the color corresponds to the strength of the sentiment score.
Sentiment Table
- Purpose : Displays the status of each indicator across different timeframes.
- Interpretation :
- Green Cell : The indicator suggests a bullish signal.
- Red Cell : The indicator suggests a bearish signal.
- Percentage Score : Indicates the overall bullish or bearish sentiment on that timeframe.
Exponential Moving Averages (EMAs)
- Purpose : Provide dynamic support and resistance levels.
- Colors :
- EMA 10 : Lime
- EMA 20 : Yellow
- EMA 50 : Orange
- EMA 100 : Red
- EMA 200 : Purple
Trendlines
- Purpose : Visual representation of support and resistance levels based on pivot points.
- Interpretation :
- Upward Trendlines : Colored green , indicating support levels.
- Downward Trendlines : Colored red , indicating resistance levels.
- Note : Trendlines are drawn using the library from Simple Trendlines .
---
Utility of Market Sentiment
The indicator aggregates signals from multiple technical indicators across various timeframes to compute an overall market sentiment score . This comprehensive approach helps traders understand the prevailing market conditions by:
Confirming Trends : Multiple indicators pointing in the same direction can confirm the strength of a trend.
Identifying Reversals : Divergences and fractals can signal potential turning points.
Timeframe Alignment : Aligning signals across different timeframes can enhance the probability of successful trades.
---
Divergences
Divergence occurs when the price of an asset moves in the opposite direction of a technical indicator, suggesting a potential reversal.
- Bullish Divergence : Price makes a lower low, but the indicator makes a higher low.
- Bearish Divergence : Price makes a higher high, but the indicator makes a lower high.
The indicator detects divergences for:
RSI
MACD
Stochastic Oscillator
On-Balance Volume (OBV)
Money Flow Index (MFI)
Accumulation/Distribution Line (A/D Line)
By identifying these divergences, traders can spot early signs of trend reversals and adjust their strategies accordingly.
---
Trendlines
Trendlines are essential tools for identifying support and resistance levels. The indicator automatically draws trendlines based on pivot points:
- Upward Trendlines (Support) : Connect higher lows, indicating an uptrend.
- Downward Trendlines (Resistance) : Connect lower highs, indicating a downtrend.
These trendlines help traders visualize the trend direction and potential breakout or reversal points.
---
Super Trend Reversals (ST Reversal)
The core idea behind the Super Trend Reversals indicator is to assess the momentum of automated trading bots (often referred to as 'Supertrend bots') that enter the market during critical turning points. Specifically, the indicator is tuned to identify when the market is nearing bottoms or peaks, just before it shifts direction based on the triggered Supertrend signals. This approach helps traders:
Engage Early : Enter the market as reversal momentum builds up.
Optimize Entries and Exits : Enter under favorable conditions and exit before momentum wanes.
By capturing these reversal points, traders can enhance their trading performance.
---
Conclusion
The Swiss Knife indicator serves as a versatile tool that combines multiple technical analysis methods into a single, comprehensive indicator. By assessing various aspects of the market—including trend direction, momentum, volume, and price action—it provides traders with valuable insights to make informed trading decisions.
---
Citations
- Divergence Detection Library : Divergence Indicator by DevLucem
- Trendline Drawing Library : Simple Trendlines by HoanGhetti
---
Note : This indicator is intended for informational purposes and should be used in conjunction with other analysis techniques. Always perform due diligence before making trading decisions.
---

Mystic Pulse [CHE]Mystic Pulse - A Non-Lagging Trend Indicator
Introduction
In the world of trading, identifying trends accurately and timely is crucial for successful decision-making. The saying "The Trend is Your Friend" encapsulates this principle, emphasizing the importance of riding the prevailing market trend. The Mystic Pulse indicator is designed to help traders do exactly that—detect trends early and follow them with confidence.
This presentation will walk you through how the Mystic Pulse indicator functions, its advantages, and how it can be a powerful tool in your trading arsenal.
Key Features of Mystic Pulse
Non-Lagging Signals: Unlike traditional indicators that often lag the market, Mystic Pulse generates trend signals in real-time, ensuring you are always in sync with the current market direction.
Adaptive Smoothing: The indicator employs a smoothing factor that dynamically adjusts based on recent price action, reducing noise and focusing on significant market movements.
Directional Movement Analysis: By calculating the directional movement index (DI+ and DI-) with a unique smoothing approach, the indicator identifies whether bulls or bears are in control.
Trend Counting Logic: The indicator counts consecutive positive and negative trend signals, providing a clear visual representation of the market’s direction.
Customizable Candle Colors: For better visual clarity, the indicator allows for customization of candle colors, highlighting neutral, bullish, or bearish candles based on trend strength.
Understanding the Indicator
1. Directional Movement and ADX Calculation
The Mystic Pulse uses a modified ADX calculation known as ZLAG ADX. It assesses true range, directional movement (both positive and negative), and smoothes these values over a specified length. This helps in capturing the essence of market trends without lag:
True Range (TR): Measures market volatility by comparing the high-low range to the previous close.
Directional Movement: Determines whether bulls (DI+) or bears (DI-) are gaining strength.
These components are then smoothed using a custom formula that adapts to recent price movements, ensuring that the signals remain relevant and timely.
2. Trend Counting Mechanism
The heart of Mystic Pulse is its trend counting logic:
Positive Trend Count: Increases when DI+ shows strengthening bullish signals.
Negative Trend Count: Increases when DI- indicates stronger bearish control.
Total Trend Count: Reflects the dominant trend by comparing positive and negative counts.
This counting mechanism ensures that the indicator is always aware of the current market bias, updating in real-time.
3. Visualization and Signal Generation
The indicator provides visual cues through color-coded plots:
Green Plot: Indicates an ongoing uptrend (positive trend count is higher).
Red Plot: Signals a downtrend (negative trend count is higher).
Neutral Candles: Optionally highlighted when neither bulls nor bears dominate, offering a clearer view of indecisive market conditions.
Application and Strategy
The Mystic Pulse indicator is ideal for traders who prefer trend-following strategies. Here's how you can apply it effectively:
Entry Points: Enter trades when the trend count strongly favors one direction, indicated by consecutive green (bullish) or red (bearish) plots.
Exit Points: Consider exiting when the opposite trend starts to gain traction, signaled by a change in the dominant color.
Risk Management: Use the neutral candle display to avoid trades in uncertain market conditions, thereby reducing risk.
Conclusion
The Mystic Pulse indicator is a sophisticated tool that helps traders stay aligned with market trends, offering non-lagging, adaptive signals. Its design reflects the trading philosophy "The Trend is Your Friend," enabling you to follow the market's lead with confidence.
By incorporating this indicator into your trading strategy, you can enhance your ability to identify and capitalize on emerging trends, minimizing lag and maximizing potential returns.
Q&A
If you have any questions or would like to see a live demonstration of the Mystic Pulse in action, feel free to ask.
Disclaimer:
Use with Caution: This indicator is provided for educational and informational purposes only and should not be considered as financial advice. Users should exercise caution and perform their own analysis before making trading decisions based on the indicator's signals.
Not Financial Advice: The information provided by this indicator does not constitute financial advice, and the creator (CHE) shall not be held responsible for any trading losses incurred as a result of using this indicator.
Backtesting Recommended: Traders are encouraged to backtest the indicator thoroughly on historical data before using it in live trading to assess its performance and suitability for their trading strategies.
Risk Management: Trading involves inherent risks, and users should implement proper risk management strategies, including but not limited to stop-loss orders and position sizing, to mitigate potential losses.
No Guarantees: The accuracy and reliability of the indicator's signals cannot be guaranteed, as they are based on historical price data and past performance may not be indicative of future results.
Best regards Chervolino

VWAP 8EMA Crossover Scalping IndicatorWhy?
Everybody, especially in Indian context, from 9:15 AM to 3:30 PM, wants to trade in BankNifty.
And even 15m is Too Big timeframe for The Great Indian Options buyers. Everyone knows how potentially BankNifty (& FinNifty on Tuesday and Sensex on Friday) can show dance within 15m.
So there always been an overarching longing among traders to have something in shorter timeframes. And this 5m timeframe, looks like a universally (sic) accepted Standard Timeframe for Indian Options traders.
So here is this.
What?
The time we are publishing this public indicator Indian market (Nifty) is in ATH at ~22200.
In any such super trending market it's always good to wait for a dip and then in suitable time, enter the trade in the direction of the larger trend. The reversal trading systems, in such a situation, proves to be ineffective.
Of course there are time when market is sideways and keeps on oscillating between +/2 standard deviation of the 20 SMA. In such a situation the reversal play works perfectly. But not so in such a trending market.
So the question comes up - after a dip what's the right point to enter.
Hence comes the importance of such a crossover based trading system.
In this indicator, it's a well-known technique (nothing originally from ours, it's taken from social media, exact one we forgot) to find out the 8EMA and VWAP crossover.
So we learned from social media, practice in our daily trading a bit, actuate it and now publishing it.
A few salient points
It does not make sense to jump into the trade just on the crossover (or crossunder).
So we added some more sugar to it, e.g. we check the color the candle. Also the next candle if crosses and closes above (or below) the breakout candle's high/low.
The polarity (color) of both the alert (breakout/breakdown) and confirmation candle to be same (green for crossover, red from crossunder).
Of course, it does provider BUY and SELL alerts separately.
These all we have found out doing backtesting and forward testing with 1/2 lots and saw this sort of approaches works.
Hence all of these are added to this script.
Nomenclature
Here green line is the 8EMA and the red line is the VWAP.
Also there is a black dotted line. That's 50 EMA. It's to show you the trend.
The recent trade is shown in the top right of the chart as green (for buy) or red (for sell) with SL and 1:1 target.
How to trade using this system?
This is roughly we have found the best possible use of this indicator.
Lets explain with a bullish BUY positive crossover (means 8EMA is crossing over the daily VWAP)
Keep timeframe as 5m
Check the direction/slope of the black dotted line (50 EMA). If it's upwards, only take bullish positions.
Open the chart which has the VWAP. (e.g. FinNifty spot or MidcapNifty spot does not have vwap). So in those cases Future is the way to go.
Wait for a breakout crossover and let the indicator gives a green, triangular UP arrow.
Draw a horizontal line to the close of that candle for next few (say 6 candles i.e. 30m) candles.
Wait for the price first to retest the 8EMA or even better the VWAP (or near to the 8EMA, VWAP)
Let the price moves and closes above the horizontal line drawn in the 4th step.
Take a bullish trade, keeping VWAP as the SL and 1:1 as the target.
Additionally, Options buyer can consult ADX also to see if the ADX is more than 25 and moving up for the bullish trade. (This has to be added seperately in the chart, it's not a part of the indicator).
Mention
The concept we have taken from some social media. Forget exactly where we heard this first time. We just coded it with some additional steps.
Statutory Disclaimer
There is no silver bullet / holy grail in trading. Nothing works 100% time. One has to be careful about the loss (s)he can bear in case of the trade goes against.
We, as the author of this script, is not responsible for any trading or position decision one is taken based on the outcome of this.
It is our sole discretion to change, add, delete the portion or withdraw the whole script without any prior notice or intimation.
In Indian Context: We are not SEBI registered.

DMI Based Consolidation InidcatorDescription:
The Consolidation Indicator (DMI + MA) combines the power of the Directional Movement Index (DMI) and Moving Averages (MA) to help traders identify both trends and consolidation phases in the market. This versatile indicator provides valuable insights into the market's behavior, making it an essential tool for traders seeking to optimize their strategies.
Key Features:
- **Directional Movement Analysis:** Utilizes the DMI to assess the strength of bullish and bearish trends, helping traders identify trend direction and momentum.
- **Moving Average Confirmation:** Integrates Moving Averages to confirm trend signals, enhancing the reliability of trend identification.
- **Trend and Consolidation Recognition:** Displays +DI and -DI trends with color-coded boxes, allowing traders to distinguish between bullish, bearish trends, and consolidation phases.
How to Use:
- **Trend Identification:** +DI Trend box (green) indicates a bullish trend, suggesting potential buying opportunities. -DI Trend box (red) signifies a bearish trend, indicating potential selling opportunities.
- **Consolidation Phase:** When both boxes are white, the market is in a consolidation phase. During consolidation, prices often move within a range. Traders may consider range-bound strategies or wait for a clear trend signal.
Customization:
- **ADX Smoothing:** Adjust the ADX smoothing factor (lensig) to fine-tune the sensitivity of trend signals.
- **DI Length:** Set the length of the Directional Index (DI) to control the responsiveness of the indicator to price changes.
- **Moving Average Length:** Define the length of the Moving Averages for additional confirmation of trend signals.
- **Moving Average Type:** Choose from SMA, EMA, WMA, or VWMA to customize the Moving Averages based on your trading preferences.
Disclaimer:
Trading involves risk, and past performance is not indicative of future results. Always perform your analysis and consider risk management strategies before making trading decisions.

[dharmatech] KBDR Mean ReversionBased on the criteria described in the book "Mean Revision Trading" by Nishant Pant.
Bullish signal criteria:
Bollinger Bands must be outside Keltner Channel
Price near bottom bband
DI+ increasing
DI- decreasing
RSI near bottom and increasing
Bearish signal criteria:
Bollinger Bands must be outside Keltner Channel
Price near upper bband
DI+ decreasing
DI- increasing
RSI near upper and decreasing
A single triangle indicates that all 4 criteria are met.
If letters appear with the triangle, this indicates that there was a partial criteria match.
K : bbands outside Keltner
B : bbands criteria met
D : DI criteria met
R : RSI criteria met
You can use the settings to turn off partial signals. For example:
"Partial 3" means show signals where 3 of the criteria are met.
If you want more insight into the underlying criteria, load these indicators as well:
Bollinger Bands (built-in to TradingView)
Keltner Channels (built-in to TradingView)
RSI (built-in to TradingView)
ADX and DI
Warning:
Not meant to be used as a stand-alone buy/sell signal.
It regularly provides signals which would not be profitable.
It's meant to be used in conjunction with other analysis.
Think of this as a time-saving tool. Instead of manually checking RSI, DI+/DI-, bbands, distance, etc. this does all of that for you on the fly.
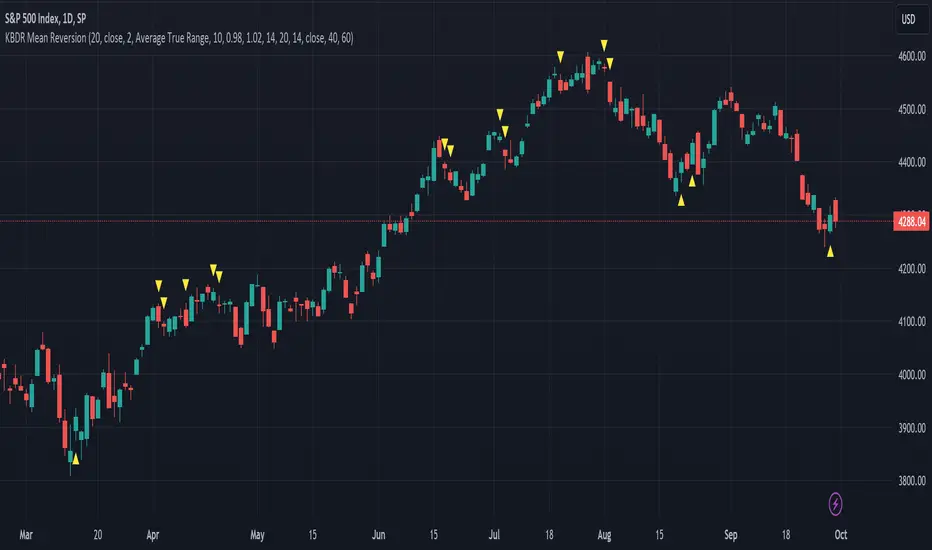
MTF - Zigzag + Tech IndicatorsMTF - Zigzag + Tech Indicators
At high level the indicator can be a useful tool while analyzing the charts. It marks swing points (Zigzag) on 3 different timeframes along with capability to view key technical indicator values at each of the swing point.
Normally Zaizag indicators are useful for identifying primary trend and retracements. Zigzags also help in identifying key support and resistance areas. Traders develop various trading strategies based on Zigzags.
Most of the published Zigzag indicators use single timeframe / chart timeframe to draw the Zigzag lines but, many traders/chart analysts would like to analyze trends on multiple timeframes. Single timeframe Zigzags makes such analysis little difficult.
This indicator is an advanced version of Zigzag which allow users to draw Zigzag lines on multiple timeframes. It allows users to input 2 additional higher timeframes and in total it draws Zigzag on 3 timeframes i.e., on chart timeframe and 2 additional higher timeframes.
Once loaded on the chart, it draws Zigzag lines and plot labels (HH, LL, HL, LH) which denotes swing points. Each of the swing point label has a tooltip attached to it, which provide few additional data point, to view the additional data points, hover the mouse over the label.
Swing label tooltip shows these additional data points:
Tag: Swing type (HH, LL, HL, LH) + Bar time (in dd-mm-yyyy hh:mm format)
Price point: Swing price point
Price change: Price change since previous swing point along with change %
Swing volume: Volume since previous swing point in million
Key technical indicator values:
RSI (close, 14)
Stochastic (close, high, low, 14)
ADX (14, 14)
SMA20
SMA50
SMA100
SMA200
Use cases:
Support resistance: Though most of the swing points of a zigzag are treated as a support or resistance. This indicator allows to add more depth to the analysis. E.g., swing points based on lowest timeframe (chart timeframe) can be treated as weak support/resistance whereas swing points based on higher timeframe can treated as strong support/resistance and prices need to hit it multiple time to cross/break the same.
Trend identification: Trend on lowest timeframe (chart timeframe) can be a immediate term trend, trend on the mid-level higher timeframe can be a short term trend and trend on the highest level timeframe can be a long term trend.
Trade identification, entry, and exit: MTF Zigzag can also be creatively used while trading. Eg. One can identify a trend on highest level timeframe and use mid-level timeframe for trade entry and lowest level timeframe can be used for Take Profit levels (TP1, TP2, ..) and Stop loss. Alternatively, Trend can be identified on highest or mid-level timeframe and trade entry/exit can be based on lowest level timeframe.
Use of information displayed in tooltip: Analysts/traders look for confirmations from other indicators while initiating trades. These additional indicator values become handy/readily available source of information without specifically navigating through different indicators/charts. These indicator values can be creatively used in many ways. Some of the examples are:
Easy comparison of values of moving averages on all 3 timeframes
Better assessment of momentum and overbought/oversold based on value of stochastic and rsi
Use of ADX to determine the strength of the trend
Trade decision based on increasing or decreasing order of moving averages
Trade decision, based order of moving averages combined with overbought/oversold and strength of the trend
Chart examples: TCS on 60m/4h/1D
ITC 4h/1D
Input Parameters:
1. Chart timeframe zigzag setup: to plot zigzag based on chart timeframe
2. Higher timeframe zigzag setup: to plot zigzag based on higher timeframe
3. Higher timeframe zigzag setup 1: to plot zigzag based on another higher timeframe
Each of these have user selectable options:
1. Color/width of the zigzag line
2. plot zigzag line - select/unselect
3. plot HHLL labels - select/unselect
Both (2 and 3) Higher timeframe setups allow to select higher timeframe and offset. Offset can be 0 or 1. This setting normally used to avoid repainting. Select offset as 1 to avoid repainting.
For Pine script developers:
Script elements:
1. Input parameters
2. Type definition (UDT) for ohlc and ph, pl data elements
3. Map definition for visual properties
4. Type instances for chart_tf, higher_tf1, higher_tf2
5. Important variable – for indicator values
6. Methods –
a. get_ph_pl() – get ph, pl data for each of the tf along with indicator values
b. add_ph(), add_pl() – add ph, pl data to timeframe specific udt, plot the zigzag and labels, add tooltip to label
Script structure
1. Input parameters
2. Variable and type definitions
3. Methods and functions
4. For each of timeframe, call functions and methods
a. Check ph, pl (if swing point formed)
b. Plot ph, pl (if applicable) i.e. zigzag line, labels

Any Screener (Multiple)I suppose it's time to publish something relatively useful :). Here's the first try, Any Screener.
This script is an advanced version of the Alphatrend - Screener that I've coded as a humble "thank you" to Kıvanç Özbilgiç (KivancOzbilgic), who always inspired me.
INTRODUCTION
I developed this version with a unique method because I couldn't find an example with the following features:
It presents the valid signal status of multiple indicators for 15 different symbols in the form of a report.
It indicates how many bars have passed after the signal has occurred.
It indicates the signal direction with dynamic colors and chars.
It can also be used for data (just indicator value) that is only intended to be displayed as text. (Default color is grey).
Long and short signals can optionally be ploted on the chart.
It includes advanced configuration settings.
USAGE OF PANEL
The screener panel is simple to use. On the far left, assets are listed. The names of the indicators appear at the top. In the column with the name of each indicator, the signals of that indicator appear as green or red. The green ones represent the long signals (uptrend) and the red ones represent the short signals (down trend). The numbers in square brackets indicate how many bars have passed after the last signal has occurred. (For example: According to the indicator at the top, when the green bullish triangle and 21 appeared on allign of BTCUSDT, Bitcoin switched to buy signal 21 bars ago. A tip : If the signal distance is 0, the signal occurred at the current bar. It is recommended to wait for the bar to close before entering the trade). Signal distance is an essential output for both manual and algorithmic trading. Users often require mentioned data the most during real time trading.
THE SCRIPT
There are two sections in the script; indicators and screener.
SECTION 1 : "INDICATORS"
In the indicator section, you'll find efficient details about switch methods, normalization, avoid pyramyding (in momentum oscillators) etc. On the other hand, I intended to present a "how to example" of a multiple screener, so it has to include more than one indicator.
OTT : Optimized Trend Tracker is developed by dear Anıl Özekşi, known as the "Old Fisherman" :). In my opinion, it is a pretty cool trend-following indicator that offers a mathematical elegance. This indicator aim to detect the current market trend direction, the indicator detect an up-trending market when the support line is superior to the OTT, and a down trending market when the support line is inferior to the OTT. It has three parameters; moving average type, length and percentage. In this version when the percentage parameter is set to 0.0, OTT turns into the selected moving average. And the signals are generated by the crossing of the closing price. It means, this screener is able to compile and present status of moving averages as well. Also VAR (VIDYA) and EVWMA has been re-designed, both moving averages no longer start at zero at the beginning of the chart (That was a big problem for backtests).
PSAR : J. Welles Wilder's Parabolic Stop And Reversal is an important trend following indicator. PSAR detects an up-trending market when below the market price and a down-trend when above. It can work in harmony with OTT according to the parameter combinations.
OSCILLATORS : Also optional three momentum oscillators have been added. MFI (Money Flow Index), RSI (Relative Strength Index) and STOCH (Stochastic %k). All three oscillators are widely used in markets and quite successful in explaining price movements by using different sources. Oscillators generate long and short signals based on oversold and overbought parameters.
VOLATILITY & TREND : There are three optional indicators. ADX (Average Directional Index), BBW-N (Normalized Bollinger Bandwidth) and REG-N (Normalized value of standard error of linear regression). These three indicators don't generate any long or short signals. Instead, they are used to measure the strength of trends and volatility. Therefore, only the numerical results (0-100) are displayed in screener panel and it is grey. (Note : The second length parameter of ADX has the same value with the first one. Bollinger Bandwith's multiplier is 2.0. REG-N is a variable that developed by Paul Kirshenbaum for Kirshenbaum Bands.)
SECTION 2 : "SCREENER"
The second section processes the main idea. This Screener model is based on generating an integer direction variable from boolean signals. The direction value serves multiple purposes: calculating the distance of signal, determining the color based on the direction, and creating "clean" data for the security function. The final step is to present the obtained data as text to the user.
HOW CAN I "SCREEN" MY CONDITIONS?
That's piece a cake, delete the Section 1 in the script :). If you change totally 11 variables according to your own strategy, you can create your new screener! The method is explained at lines 169-171.
SINCERELY THANKS
To allanster for patiently answering my primitive questions,
And to KivancOzbilgic for mind blowing suggestions (especially while we're drinking Raki) :)...
DISCLEIMER
This is just an indicator, nothing more. The script is for informational and educational purposes only. The use of the script does not constitute professional and/or financial advice. The responsibility for risks associated with the use of the script is solely owned by the user. Do not forget to manage your risk. And trade as safely as possible. Good luck!