T3-CCI Alerts [SystemAlpha]This is an alert companion of the T3-CCI Strategy based on FX Sniper's T3-CCI indicator. Instead of using just the normal buy and sell signal, we added an option to use trend filters, trailing stop loss and take profit targets.
The TTM scalper indicator of John Carter’s Scalper Buys and Sells was originally created by HPotter and is a close approximation of the one described in his book Mastering the Trade.
In this study you have a choice of:
Trend Filters:
- Average Directional Index ( ADX ) – buy when price is trend is up and sell when trend is down.
- Moving Average (MA) – buy when price close above the defined moving average and sell when price close below moving average
- Parabolic SAR – buy when SAR is above price is above price and sell when SAR is below price.
- All - Use ADX , MA and SAR as filters
For MA Filter , you can use the “TF MA Type” and "TF MA Period" parameter to select Simple or Exponential Moving Average and length.
Stop Loss:
- Average True Range (ATR) – ATR % stop as trailing stop loss.
- Parabolic SAR ( SAR ) – Parabolic SAR adapted as trailing stop loss.
For ATR , you can use the “ATR Trailing Stop Multiplier” parameter to set an initial offset for trailing stop loss.
Take Profit Target:
- Average True Range (ATR) – ATR % stop as trailing stop loss.
- Standard % – Percent as target profit
For ATR , you can use the “ATR Take Profit Multiplier” parameter to set an initial offset for trailing stop loss.
Additional feature include:
- Show Bar Colors
Alerts:
When creating alerts use “Once Per Bar Close” parameter for Long and Short and “Once Per Bar” for Close, Trailing Stop, and Take Profit.
TradingView Links:
Strategy:
T3-CCI Indicator:
Advance ADX:
How to use:
1. Apply the script by browsing through Indicators --> Invite-Only scripts and select the indicator
2. Once loaded, click the gear (settings) button to select/adjust the parameters based on your preference.
3. Wait for the next BUY or SELL signal to enter the trade!
Disclaimer:
The indicator and signals generated do not constitute investment advice; are provided solely for informational purposes and therefore is not an offer to buy or sell a security; are not warranted to be correct, complete or accurate; and are subject to change without notice.
Cerca negli script per "adx"

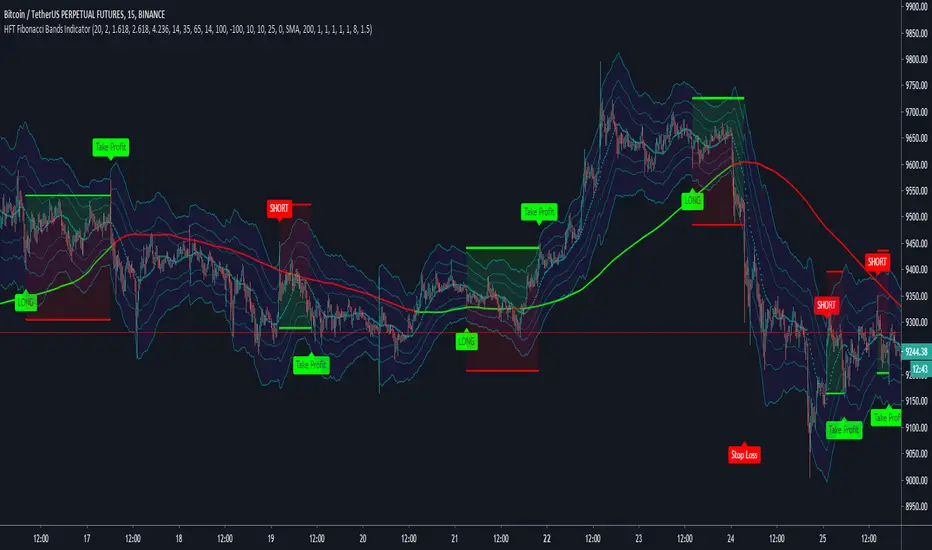
HFT Fibonacci Bands Indicator
Default Settings are meant to be used in XBT/USD chart on 15 min time frame. If you want to use for another asset on another time frame YOU MUST CHANGE THE SETTINGS
This is a Fibonacci bands based trading indicator developed by HFT Research. It is a highly customizable indicator and provided endless opportunities to find profitable trades in the market.
Use Fib BB
This is the main decision maker of the strategy. Tuning the settings of this portion of the strategy will change the outcome the most. We have provided default settings. However, they are only good for 15min chart on Bitcoin. Please adjust accordingly.
Fib BB Length: This setting adjusts the middle line of your Fibonacci Bands. It is the moving average that you take it as base for your Fibonacci bands. Default value is currently 20.
Fib Level to Use for Entry: Here, you adjust which one of the Fibonacci Ratio levels you would like to use for your entry. You can only choose one of the following options.
Fibonacci Ratio 1
This is your Fib ratio level 1 and you can put any number here you would like
Fibonacci Ratio 2
This is your Fib ratio level 2 and you can put any number here you would like
Fibonacci Ratio 3
This is your Fib ratio level 3 and you can put any number here you would like
Please keep in mind that Ratio 1 should be higher than Ratio 2 and Ratio 2 should be higher than Ratio 3.
Use RSI
You can also turn on and off the RSI as well. Alternatively, there is an option to use RSI on a different time frame than you are currently on. For example, if you are looking at the 5min chart to use Bollinger bands but you would like to look at the RSI value on the 15min chart. You can do so by selecting the custom RSI timeframe as well as adjusting the Oversold and Overbought value.
Use CCI
Commodity Channel Index is an indicator developed by Donald Lambert. It is a momentum-based oscillator used to help determine when an investment vehicle is reaching conditions of being overbought or oversold. It also used to asses price trend direction and strength. Default settings are usually the safest and the best fit.
Use VWAP
VWAP stands for volume weighted average price. It is an extremely useful indicator when trading intra-day. It does reset every trading session which is at 00:00 UTC. Instead of looking at x number of candles and providing an average price, it will take into consideration volume that’s traded at a certain price and weigh it accordingly.
Use ADX
ADX stands for average directional index. It is an indicator that measures volatility in the market. Unfortunately, the worst market condition for this strategy is sideways market. ADX becomes a useful tool since it can detect trend. If the volatility is low and there is no real price movement, ADX will pick that up and will not let you get in trades during a sideways market. It will allow you to enter trades only when the market is trending.
Use MA Filters
Lookback: It is an option to look back x number of candles to validate the price crossing. If the market is choppy and the price keeps crossing up and down the moving average you have chosen, it will generate a lot of “noisy” signals. This option allows you to confirm the cross by selecting how many candles the price needs to stay above or below the moving average. Setting it 0 will turn it off.
MA Filter Type: There is a selection of moving averages that is available on TradingView currently. You can choose from 14 different moving average types to detect the trend as accurate as possible.
Filter Length: You can select the length of your moving average. Most commonly used length being 50,100 and 200.
Filter Type: This is our propriety smoothing method in order to make the moving averages lag less and influence the way they are calculated slightly. Type 1 being the normal calculation and type 2 being the secret sauce.
Reverse MA Filter: This option allows you to use the moving average in reverse. For example, the strategy will go long when the price is above the moving average. However, if you use the reserve MA Filter, you will go short when the price is above the moving average. This method works best in sideways market where price usually retraces back to the moving average. So, in an anticipation of price reverting back to the moving average, it is a useful piece of option to use during sideway markets.
If you want to get access to this indicator please DM me or visit our website.
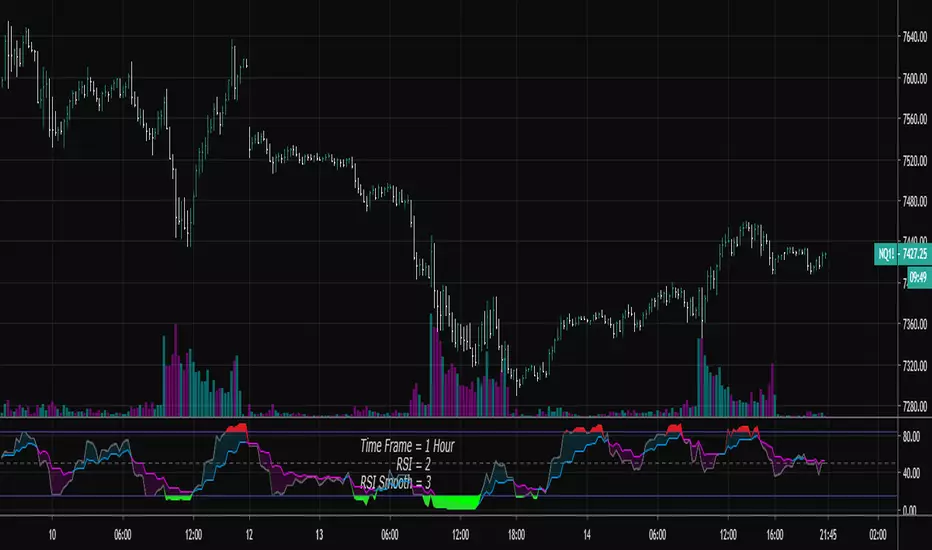
HFT Momentum IndicatorDefault Settings are meant to be used in XBT/USD chart on 1 hour time frame. If you want to use for another asset on another time frame YOU MUST CHANGE THE SETTINGS
This is momentum-based strategy designed by HFT Research in order to take advantage of volatile, trending markets.
Use ADX
ADX stands for average directional index . It is an indicator that measures volatility in the market. Unfortunately, the worst market condition for this strategy is sideways market. ADX becomes a useful tool since it can detect trend. If the volatility is low and there is no real price movement, ADX will pick that up and will not let you get in trades during a sideways market. It will allow you to enter trades only when the market is trending.
Use MA CrossOver
This strategy’s main driver is the moving average cross over however, unlike many other indicators, this strategy has ALL the moving averages that are on trading view. Total of 13 different moving averages all calculated in a different fashion available in a drop-down menu. You are able to choose two different moving averages to cross for your entry as well as being able to adjust the length of each individual moving average.
Use MA Spread % Filter
As an extra protection, we introduced MA spread % filter. We all know that momentum strategy works when there is actually a trend that has momentum. When there is no trend and market side choppy, we get a lot of noisy signals. In order to battle that we have introduced MA spread % filter. Using this piece of setting, you will be able to chose how strong the cross over actually is. If price is moving sideways, the moving averages will cross each other barely. If the price has actually any steam and momentum, MA 1 will cross over MA 2 aggressively because it will be trending market.
First you chose what the minimum % difference there should be between your 2 moving averages. If you keep this too tight, it won’t be as useful and if you keep this too large then the script will not generate any signals. Trust us, there is a fine balance in between! Then you proceed to chose your moving averages that the bot should keep track of.
Check our website for more information.

HFT Scalper IndicatorThis strategy is a scalper strategy developed by HFT Research. Scalper is highly customizable and provides endless opportunities to find profitable setups in the market.
Use Bollinger Bands
This piece of the settings will turn and off Bollinger band’s input in the decision making. BB Length will determine the Moving average you are using to take the standard deviation off of which is named as BB Multiplier. Default settings will use 20 moving average and take standard deviation of 2 to create lower and upper bands. Increasing the Multiplier will give you fewer but safer entries.
Use Bollinger Bands %
This setting will allow the user to determine at what Bollinger band width %, he wants to take start looking to take trades. It is known that when prices are stable and moving sideways, Bollinger bands contract and it becomes more reactive to small moves in the market. Using this setting, you can ignore the signals that would be generated while Bollinger bands are contracted. This setting will allow the user to weed out the noise in the market and really allow them to make the most out of Bollinger bands.
Use RSI
You can also turn on and off the RSI as well. Alternatively, there is an option to use RSI on a different time frame than you are currently on. For example, if you are looking at the 5min chart to use Bollinger bands but you would like to look at the RSI value on the 15min chart. You can do so by selecting the custom RSI timeframe as well as adjusting the Oversold and Overbought value.
Use STOCH
For those who want extra protection on their entry can throw STOCH into their decision making. STOCH acts like RSI but it is more prone to small moves. It will help the users to get a better entry if used correctly. Stoch may not be in the buy zone when RSI is at say 35, however, if price dips a little more and STOCH might be in the buy zone when RSI is at say 20. This way it will help you have better entries than just using RSI. In a way, you can use STOCH to scalp RSI.
Use VWAP
VWAP stands for volume weighted average price. It is an extremely useful indicator when trading intra-day. It does reset every trading session which is at 00:00 UTC. Instead of looking at x number of candles and providing an average price, it will take into consideration volume that’s traded at a certain price and weigh it accordingly.
Use ADX
ADX stands for average directional index. It is an indicator that measures volatility in the market. Unfortunately, the worst market condition for this strategy is sideways market. ADX becomes a useful tool since it can detect trend. If the volatility is low and there is no real price movement, ADX will pick that up and will not let you get in trades during a sideways market. It will allow you to enter trades only when the market is trending.
Use MA Filters
Lookback: It is an option to look back x number of candles to validate the price crossing. If the market is choppy and the price keeps crossing up and down the moving average you have chosen, it will generate a lot of “noisy” signals. This option allows you to confirm the cross by selecting how many candles the price needs to stay above or below the moving average. Setting it 0 will turn it off.
MA Filter Type: There is a selection of moving averages that is available on TradingView currently. You can choose from 14 different moving average types to detect the trend as accurate as possible.
Filter Length: You can select the length of your moving average. Most commonly used length being 50,100 and 200.
Filter Type: This is our propriety smoothing method in order to make the moving averages lag less and influence the way they are calculated slightly. Type 1 being the normal calculation and type 2 being the secret sauce.
Reverse MA Filter: This option allows you to use the moving average in reverse. For example, the strategy will go long when the price is above the moving average. However, if you use the reserve MA Filter, you will go short when the price is above the moving average. This method works best in sideways market where price usually retraces back to the moving average. So in an anticipation of price reverting back to the moving average, it is a useful piece of option to use during sideway markets which is the worst market condition for scalper.
Please visit our website for more information

RSI Shaded - MTF
Non-repainting multiple time frame RSI with shading of overbought and oversold levels.
Includes option for simple moving average smooth of the RSI (Larry Connors)
Includes option to plot the EMA of the RSI
Related to RSI Shaded .
For other multiple time frame indicators see:
Adaptive ATR-ADX Trend
Fisher Transform MTF
ADX-DI MTF
Laguerre RSI MTF
Sniper SuiteSniper Suite is a multi-module trend & momentum toolbox built for disciplined entries.
It combines AlphaTrend, a dynamic MA Resistance line, optional Flow Band / Vegas Tunnel / Guppy Flow, plus ADX + Squeeze + Pinbar veto and a 0–100 Score engine that summarizes conditions into a simple table:
SCORE: strength/quality (0–100)
LIVE: current bar decision (ENTRY / WAIT)
CLOSE: “last confirmed decision” with session-specific logic
What’s inside
AlphaTrend core with optional BUY/SELL markers
MA Resistance (Donchian mid + SMA smoothing)
Optional overlays: Flow Band, Vegas Tunnel, Guppy Flow
Filters:
ADX filter (Soft/Hard/Off, with early-pass option)
Squeeze Momentum (LazyBear-style) influence + penalty
Bear Pinbar Veto (blocks risky long entries)
Score logic (0–100)
The score blends:
AlphaTrend alignment + slope
Price vs MA Resistance + slope/dist
Selected module contribution (Flow/Vegas/Guppy)
Optional Squeeze “power” contribution
Then applies penalties and optional ADX scaling.
Market/session behavior
BIST: after 17:55 (Istanbul time), the CLOSE cell can preview the LIVE decision (visual-only).
Crypto (Gate): uses a 03:00 daily base close for the CLOSE decision and performs a single 07:00 check:
If CLOSE = ENTRY at 03:00 but Score < Gate Threshold at 07:00, it is downgraded to WAIT.
If CLOSE = WAIT at 03:00, it will not upgrade later (by design).
Optional Reclaim can be enabled to require price reclaiming a reference level before keeping ENTRY.
Alerts
Includes an alert condition for confirmed Score threshold cross-up (when LIVE decision becomes ENTRY on bar close).
Disclaimer: This indicator is for informational/educational purposes only and does not constitute financial advice. Always manage risk.

Kinetic Scalper [BULLBYTE]KINETIC SCALPER - ADVANCED MOMENTUM & CONFLUENCE TRADING SYSTEM
A SOPHISTICATED MULTI-FACTOR ANALYSIS INDICATOR FOR PRECISION ENTRIES
The Kinetic Scalper is a comprehensive trading analysis tool that combines volume-weighted momentum calculations, multi-oscillator divergence detection, and a proprietary 15-factor confluence scoring system to identify high-probability reversal setups across all timeframes.
WHAT MAKES THIS INDICATOR ORIGINAL
This is NOT a simple mashup of existing indicators.
The Kinetic Scalper features a completely custom momentum engine called the "Kinetic Pulse" - a volume-weighted momentum oscillator with Fisher Transform normalization that fundamentally differs from standard RSI or other momentum indicators. Every component feeds into a unified algorithmic framework designed specifically for this system.
KEY INNOVATIONS:
KINETIC PULSE ENGINE
Unlike standard RSI which uses simple price changes, the Kinetic Pulse applies:
→ Volume weighting to price movements (high-volume moves carry more weight)
→ EMA smoothing instead of traditional SMA (faster response to changes)
→ Fisher Transform normalization for improved signal clarity
→ Adaptive period adjustment based on current volatility regime
→ Result: A momentum oscillator that responds to conviction, not just price noise
15-FACTOR CONFLUENCE SCORING SYSTEM
Every signal is graded based on the number of confirming factors present:
→ Momentum position (oversold/overbought extremes)
→ Momentum velocity (direction change confirmation)
→ Momentum acceleration (strength of reversal)
→ Multi-oscillator divergence (price vs. 3 oscillators)
→ Volume confirmation (above-average participation)
→ Volume delta analysis (buying vs. selling pressure)
→ Higher timeframe alignment (trend confirmation from larger timeframe)
→ Session timing (major forex session awareness)
→ Structure clearance (clear path to profit targets)
→ Support/resistance proximity (confluence with key levels)
→ Market regime filtering (trending vs. choppy conditions)
Signals are graded A+, A, or B based on how many factors align:
• CONSERVATIVE MODE: A+ requires 12+ factors, A requires 9+, B requires 7+
• BALANCED MODE: A+ requires 10+ factors, A requires 7+, B requires 5+
• AGGRESSIVE MODE: A+ requires 8+ factors, A requires 5+, B requires 3+
TRADE ANALYSIS STATE MACHINE
A sophisticated monitoring system that tracks trade conditions in real-time using:
→ 5-state analysis framework (Factors Aligned / Positive Bias / Mixed Signals / Factors Weakening / Negative Bias)
→ Hysteresis-based transitions (different thresholds to enter vs. exit states)
→ Confidence smoothing with EMA (reduces noise, prevents flip-flopping)
→ Minimum commitment periods before state changes
→ Override logic for significant events (near TP/SL, momentum reversals)
→ Result: Stable, actionable guidance that doesn't change on every bar
INSTRUMENT-AWARE CALIBRATION
Automatically detects what you're trading and applies optimized parameters:
→ Forex Majors: Standard ATR, high session weight
→ Forex Crosses: Tighter stops, moderate session weight
→ Crypto: Wider stops (1.8x multiplier), reduced session weight (24/7 markets)
→ Indices: Moderate-wide stops, high session weight
→ Commodities: Moderate stops, moderate session weight
WHAT THIS INDICATOR DOES
The Kinetic Scalper is designed to identify high-confluence reversal opportunities by analyzing multiple dimensions of market behavior simultaneously.
CORE FUNCTIONS:
1. SIGNAL GENERATION
→ Identifies potential reversal points at oversold/overbought extremes
→ Confirms with multi-oscillator divergence detection
→ Validates with volume, higher timeframe, and structural analysis
→ Filters out low-probability setups automatically
→ Grades signals based on total confluence factors present
2. AUTOMATED TRADE TRACKING
→ Calculates structure-based or ATR-based stop loss levels
→ Projects take profit targets using risk-to-reward ratios
→ Monitors live position status (P/L, distance to targets, R-multiple)
→ Tracks TP1 and TP2 hits automatically
→ Displays outcome markers (TP HIT, PARTIAL WIN, STOPPED)
3. REAL-TIME CONDITION MONITORING
→ Analyzes 6 factor categories during active trades
→ Provides confidence scoring (0-100 scale)
→ Generates actionable guidance based on current market state
→ Alerts when conditions deteriorate or improve
→ Helps with trade management decisions
4. COMPREHENSIVE MARKET ANALYSIS
→ Session detection (Asian, London, New York, Overlap)
→ Volatility regime identification (Low, Normal, High, Extreme)
→ Trend state classification (Trending Up/Down, Ranging, Transitioning)
→ Volume analysis (relative volume and delta approximation)
→ Choppiness filtering (blocks signals in ranging markets)
WHY USE THIS INDICATOR
PROBLEM: Most momentum indicators generate too many false signals at extremes.
SOLUTION: The Kinetic Scalper requires MULTIPLE confirming factors before generating a signal, dramatically reducing noise and focusing on high-confluence setups.
ADVANTAGES:
✓ QUALITY OVER QUANTITY
→ Signal grading ensures you can filter for only the highest-quality setups
→ A+ signals have 10-12+ confirming factors aligned
→ Cooldown periods prevent over-trading the same move
✓ COMPLETE TRADE FRAMEWORK
→ Entry signals with confluence justification
→ Calculated stop loss based on market structure or ATR
→ Two profit targets with clear risk-to-reward ratios
→ Live trade monitoring with factor analysis
→ Outcome tracking and visual markers
✓ ADAPTIVE TO MARKET CONDITIONS
→ Volatility-based period adjustment for momentum calculations
→ Instrument-specific ATR multipliers
→ Session awareness for forex traders
→ Higher timeframe trend filtering
→ Automatic regime detection (trending vs. choppy)
✓ TRANSPARENT METHODOLOGY
→ Every input has detailed tooltips explaining its purpose
→ Signal tooltips show exactly why a signal was generated
→ Dashboard displays all relevant market conditions
→ Factor scores are visible during trades
→ No "black box" mystery calculations
✓ NON-REPAINTING & RELIABLE
→ All signals use barstate.isconfirmed (only on closed bars)
→ Higher timeframe data uses lookahead_off with historical offset
→ No future data access or repainting behavior
→ What you see is what you get - signals don't disappear or move
HOW THE INDICATOR WORKS
SIGNAL GENERATION PROCESS:
STEP 1: MOMENTUM ANALYSIS
The Kinetic Pulse engine calculates volume-weighted momentum:
→ Price changes are weighted by volume ratio vs. 20-bar average
→ High-volume moves have more influence on the oscillator
→ Gains and losses are smoothed using EMA (not SMA like RSI)
→ Fisher Transform is applied for normalization to 0-100 scale
→ Result: Momentum reading that emphasizes conviction, not noise
STEP 2: REVERSAL DETECTION
The indicator looks for potential reversal conditions:
→ Kinetic Pulse reaching oversold zone (below dynamic lower threshold)
→ Momentum velocity turning positive after being negative (for longs)
→ OR bullish divergence detected on multiple oscillators
→ Price making lower lows while oscillators make higher lows = divergence
STEP 3: MULTI-OSCILLATOR DIVERGENCE CONFIRMATION
Divergence is validated across three sources:
→ Kinetic Pulse divergence
→ CCI divergence
→ Stochastic divergence
→ Multiple oscillators confirming divergence increases signal reliability
STEP 4: CONFLUENCE FACTOR SCORING
The system evaluates all 15 possible confirming factors:
→ Momentum position: Is pulse oversold/overbought? (+0 to +2 points)
→ Momentum direction: Is velocity reversing? (+0 to +2 points)
→ Momentum acceleration: Is reversal strengthening? (+0 to +1 point)
→ Divergence count: How many oscillators show divergence? (+0 to +2 points)
→ Volume strength: Is volume above 1.3x average? (+0 to +1 point)
→ Volume delta: Is cumulative delta positive/negative? (+0 to +1 point)
→ HTF alignment: Does higher timeframe support direction? (+0 to +2 points)
→ Session timing: Is it a prime trading session? (+0 to +1 point)
→ Clear air: Is path to targets clear of obstacles? (+0 to +1 point)
→ Structure confluence: Are we near support/resistance? (+0 to +1 point)
→ Market regime: Is market trending, not choppy? (+0 to +1 point)
Total possible score: 15 points
Minimum for signal: 3-12 points depending on sensitivity mode
STEP 5: FILTER VALIDATION
Before generating a signal, additional checks are performed:
→ Volume must be above minimum threshold (if filter enabled)
→ Higher timeframe must not oppose the signal direction (if filter enabled)
→ Target path must be clear of major resistance/support (if filter enabled)
→ Volatility must not be EXTREME (blocks signals in chaos)
→ Risk-to-reward ratio must meet minimum requirement
→ Cooldown period must have elapsed since last signal
STEP 6: SIGNAL GRADING
If all filters pass, the signal is graded based on score:
→ A+ Grade: Highest confluence (8-12+ factors depending on sensitivity)
→ A Grade: High confluence (5-9+ factors)
→ B Grade: Moderate confluence (3-7+ factors)
Only graded signals (A+, A, or B) are displayed.
STEP 7: TRADE LEVEL CALCULATION
Stop loss and targets are calculated automatically:
STOP LOSS METHODS:
• Structure-Based: Uses recent swing low/high with ATR buffer, constrained by min/max ATR limits
• ATR-Based: Pure ATR multiplier with min/max constraints
• Fixed ATR: Simple ATR multiplier, no adjustments
TARGET CALCULATION:
• TP1: Entry ± (Stop Distance × Target 1 R:R)
• TP2: Entry ± (Stop Distance × Target 2 R:R)
• Default: TP1 at 1.0 R:R (1:1), TP2 at 2.0 R:R (1:2)
STEP 8: TRADE MONITORING
Once a signal is taken, the indicator tracks:
→ Current P/L in ticks and R-multiples
→ Distance to each target in ATR units
→ Distance to stop loss in ATR units
→ TP1 hit detection (marks with label, updates lines)
→ TP2 hit detection (closes trade, marks outcome)
→ Stop loss hit detection (closes trade, differentiates partial vs. full loss)
STEP 9: FACTOR ANALYSIS (DURING TRADES)
The Trade Analysis Panel monitors 6 key factor categories:
→ Momentum: Is momentum still aligned with trade direction? (-15 to +15 pts)
→ Position: Current R-multiple position (-12 to +12 pts)
→ Volume: Is volume still supportive? (-6 to +6 pts)
→ HTF Alignment: Does HTF still support trade? (-6 to +8 pts)
→ Target Proximity: How close are we to targets? (0 to +10 pts)
→ Stop Proximity: Are we dangerously close to stop? (-15 to +3 pts)
Raw scores are summed and smoothed using 5-bar EMA to create Confidence Score (0-100).
STEP 10: STATE MACHINE TRANSITIONS
Based on smoothed confidence, the system transitions between 5 states:
→ FACTORS ALIGNED (72+): Everything looks good
→ POSITIVE BIAS (58-72): Conditions favorable
→ MIXED SIGNALS (48-58): Neutral conditions
→ FACTORS WEAKENING (22-48): Concerning signals
→ NEGATIVE BIAS (<22): Poor conditions
Hysteresis prevents rapid flipping between states (different entry/exit thresholds).
RECOMMENDED TIMEFRAMES & INSTRUMENTS
TIMEFRAME VERSATILITY:
Despite the name "Scalper," this indicator works on ALL timeframes:
✓ LOWER TIMEFRAMES (1m - 15m)
→ Ideal for: Scalping and very short-term trades
→ Expect: More signals, faster trades, requires active monitoring
→ Best for: Forex majors, liquid crypto pairs
→ Tip: Use Conservative sensitivity to reduce noise
✓ MID TIMEFRAMES (15m - 1H)
→ Ideal for: Intraday trading and day trading
→ Expect: Moderate signal frequency, 1-4 hour trade duration
→ Best for: Forex, indices, major crypto
→ Tip: Balanced sensitivity works well here
✓ HIGHER TIMEFRAMES (4H - Daily)
→ Ideal for: Swing trading and position trading
→ Expect: Fewer signals, higher-quality setups, multi-day trades
→ Best for: All instruments
→ Tip: Can use Aggressive sensitivity for more opportunities
INSTRUMENT COMPATIBILITY:
✓ FOREX MAJORS (EUR/USD, GBP/USD, USD/JPY, etc.)
→ Auto-detected or manually select "Forex Major"
→ Session filtering is highly valuable here
→ London/NY overlap generates best signals
✓ FOREX CROSSES (EUR/GBP, AUD/NZD, etc.)
→ Auto-detected or manually select "Forex Cross"
→ Slightly tighter stops applied automatically
→ Session weight reduced vs. majors
✓ CRYPTOCURRENCIES (BTC, ETH, SOL, etc.)
→ Auto-detected or manually select "Crypto"
→ Wider stops (1.8x multiplier) due to volatility
→ Session filtering less relevant (24/7 markets)
→ Works well on both spot and perpetual futures
✓ INDICES (S&P 500, NASDAQ, DAX, etc.)
→ Auto-detected or manually select "Index"
→ Session opens (NY, London) are important
→ Moderate stop widths applied
✓ COMMODITIES (Gold, Silver, Oil, etc.)
→ Auto-detected or manually select "Commodity"
→ Moderate stops and session awareness
→ Works well on both spot and futures
VISUAL ELEMENTS EXPLAINED
SIGNAL MARKERS:
The indicator offers 3 display styles (choose in settings):
• PREMIUM STYLE (Default)
→ Signal appears below/above candles with connecting line
→ Background panel with grade badge (LONG , SHORT , etc.)
→ Entry price displayed
→ Direction arrow pointing to entry candle
→ Most informative, best for detailed analysis
• MINIMAL STYLE
→ Simple dot marker with grade text next to it
→ Clean, unobtrusive design
→ Best for mobile devices or cluttered charts
→ Less visual noise
• CLASSIC STYLE
→ Diamond marker with grade badge below/above
→ Traditional indicator aesthetic
→ Good balance between info and simplicity
ALL STYLES INCLUDE:
→ Signal tooltips with complete trade plan details
→ Grade display (A+, A, or B)
→ Color coding (bright colors for A+, standard for A/B)
SIGNAL TOOLTIP CONTENTS:
When you hover over any signal marker, you'll see:
→ Signal direction and grade
→ Confluence score (actual points vs. required)
→ Reason for signal (divergence type, reversal pattern)
→ Complete trade plan (Entry, Stop, TP1, TP2)
→ Risk in ticks
→ Risk-to-reward ratios
→ Market conditions at signal (Pulse value, HTF status, Volume, Session)
TRADE LEVEL LINES:
When Trade Tracking is enabled:
• ENTRY LINE (Yellow/Gold)
→ Solid horizontal line at entry price
→ Shaded zone around entry (±ATR buffer)
→ Label showing entry price
→ Extends 20-25 bars into future
• STOP LOSS LINE (Orange/Red)
→ Dashed line at stop level
→ Label showing stop price and distance in ticks
→ Turns dotted and changes color after TP1 hit (breakeven implied)
→ Deleted when trade closes
• TAKE PROFIT 1 LINE (Blue)
→ Dotted line at TP1 level
→ Label showing price and R:R ratio (e.g., "1:1.0")
→ Turns solid and changes to green when hit
→ Deleted after TP1 hit
• TAKE PROFIT 2 LINE (Blue)
→ Solid line at TP2 level
→ Label showing price and R:R ratio (e.g., "1:2.0")
→ This is the "full win" target
→ Deleted when trade closes
OUTCOME MARKERS:
When trade milestones are reached:
• - Green label appears when first target is touched
• - Green label when second target is touched (trade complete)
• - Red label if stop loss hit before any target
• - Orange label if TP1 hit but then stopped out
PREVIOUS DAY LEVELS:
If enabled (Show Previous Day Levels):
• PDH (Previous Day High) - Solid red/orange line
→ Label shows "PDH: "
→ Useful resistance reference for intraday trading
• PDL (Previous Day Low) - Solid green line
→ Label shows "PDL: "
→ Useful support reference for intraday trading
BACKGROUND TINTS:
Subtle background colors indicate states:
→ Light green tint: Active long position being tracked
→ Light red tint: Active short position being tracked
→ Light orange tint: Extreme volatility warning (signals blocked)
DASHBOARD GUIDE
The indicator features TWO dashboard panels:
━━━━━━━━━━━━━━━━━━━━━━━━━━━━━━━━━━━━━━━━━━━━━━━━━━━━━━━━━━━━━━━━━━━━━━━━━━━━━
MAIN DASHBOARD (Top Right by default)
━━━━━━━━━━━━━━━━━━━━━━━━━━━━━━━━━━━━━━━━━━━━━━━━━━━━━━━━━━━━━━━━━━━━━━━━━━━━━
WHEN NO TRADE IS ACTIVE:
→ Bias: Current market bias (BULLISH, BEARISH, NEUTRAL, LEAN LONG/SHORT)
→ Based on Kinetic Pulse position and velocity
→ Helps you understand overall momentum direction
→ Pulse: Current Kinetic Pulse value (0-100 scale)
→ <30 = Oversold (potential long setups developing)
→ >70 = Overbought (potential short setups developing)
→ 40-60 = Neutral zone
→ Volatility: Current volatility regime (LOW, NORMAL, HIGH, EXTREME)
→ Calculated from ATR ratio vs. 100-period average
→ EXTREME volatility blocks all signals (too chaotic)
→ Trend: Market state classification
→ TREND UP / TREND DOWN: ADX > 25, directional movement clear
→ RANGING: ADX < 20, choppy conditions
→ TRANSITIONING: ADX 20-25, developing conditions
→ VOLATILE: Extreme ATR regime
→ Session: Current forex session
→ ASIAN (00:00-08:00 UTC)
→ LONDON (07:00-16:00 UTC)
→ NEW YORK (13:00-22:00 UTC)
→ LDN/NY (13:00-16:00 UTC) - Overlap period, highest volatility
→ OFF-HOURS: Outside major sessions
→ Volume: Current volume vs. 20-bar average
→ Displayed as multiplier (e.g., "1.45x" = 45% above average)
→ Green if >1.3x (high volume, bullish for signal quality)
→ Red if <0.8x (low volume, bearish for signal quality)
→ HTF: Higher timeframe analysis status
→ BULLISH: HTF momentum supports longs
→ BEARISH: HTF momentum supports shorts
→ NEUTRAL: No clear HTF direction
→ Best Score: Highest confluence score currently available
→ Shows both long and short scores
→ Format: " / "
→ Example: "8/7 " means long score is 8, threshold is 7, long is leading
→ Helps you anticipate which direction might signal next
→ PDH/PDL: Previous day high and low prices
→ Quick reference for intraday support/resistance
WHEN TRADE IS ACTIVE:
→ Trade: Direction and grade (e.g., "LONG ")
→ Entry: Entry price of current trade
→ P/L: Current profit/loss
→ Shown in ticks and R-multiples
→ Format: "+45 | +0.75R" or "-20 | -0.35R"
→ Green when positive, red when negative
→ TP1: First target status
→ Shows price and distance if not hit
→ Shows "HIT" in green if reached
→ TP2: Second target price and distance
→ Stop: Stop loss price and current distance from stop
→ Bars: Number of bars since entry (trade duration)
━━━━━━━━━━━━━━━━━━━━━━━━━━━━━━━━━━━━━━━━━━━━━━━━━━━━━━━━━━━━━━━━━━━━━━━━━━━━━
TRADE ANALYSIS PANEL (Bottom Left by default)
━━━━━━━━━━━━━━━━━━━━━━━━━━━━━━━━━━━━━━━━━━━━━━━━━━━━━━━━━━━━━━━━━━━━━━━━━━━━━
This panel provides algorithmic analysis of market conditions. It does NOT provide investment advice or recommendations.
WHEN NO TRADE IS ACTIVE:
Shows scanning status and signal readiness:
→ Long/Short Readiness Gauges
→ Visual bar showing proximity to signal threshold
→ Score display (e.g., "8/7" means 8 points scored, 7 needed)
→ "RDY" indicator when threshold reached
→ Status Messages
→ "Scanning for setups..." - Normal scanning mode
→ "Long setup ready - cooldown: X bars" - Signal qualified but in cooldown
→ "Oversold conditions - watch for reversal" - Setup developing
→ "Choppy conditions detected" - Warning about market state
→ "Extreme volatility - signals blocked" - Safety filter active
WHEN TRADE IS ACTIVE:
Header shows current analysis state:
→ FACTORS ALIGNED (Green) - Everything looks good, confidence 72+
→ POSITIVE BIAS (Light Green) - Conditions favorable, confidence 58-72
→ MIXED SIGNALS (Blue) - Neutral conditions, confidence 48-58
→ FACTORS WEAKENING (Orange) - Concerning signals, confidence 22-48
→ NEGATIVE BIAS (Red) - Poor conditions, confidence <22
Confidence Score:
→ Displayed as percentage (0-100%)
→ Visual gauge (|||||.....)
→ Trend indicator (Rising, Falling, Stable)
→ Shows momentum of confidence change
Factor Breakdown (if enabled):
Shows 6 factor categories with individual scores:
→ Momentum: Is momentum aligned with trade? (-15 to +15 points)
→ Positive if velocity matches trade direction
→ Negative if momentum opposes trade
→ Position: Current R-multiple analysis (-12 to +12 points)
→ Positive if trade is in profit
→ Negative if underwater
→ Score increases as profit grows
→ Volume: Is volume supportive? (-6 to +6 points)
→ Positive if volume above average
→ Negative if volume weak
→ HTF Align: Higher timeframe status (-6 to +8 points)
→ Positive if HTF still supports trade direction
→ Negative if HTF turned against trade
→ Target: Proximity to profit targets (0 to +10 points)
→ Higher score when approaching targets
→ Bonus if TP1 already hit and near TP2
→ Stop Dist: Distance from stop loss (-15 to +3 points)
→ Negative if dangerously close to stop (<0.3 ATR)
→ Positive if well away from stop (>1.5 ATR)
Each factor shows:
• Score value with +/- indicator
• Trend symbol: + (improving), - (deteriorating), = (stable)
• Visual gauge
Guidance Messages:
→ "TARGET 2 APPROACHING" - TP2 within 0.3 ATR
→ "TARGET 1 APPROACHING" - TP1 within 0.3 ATR
→ "STOP PROXIMITY WARNING" - Stop within 0.3 ATR
→ "Factors aligned - Holding" - Positive state, stay in trade
→ "Conditions favorable" - Still looking good
→ "Conditions mixed - " - Neutral assessment
→ "Factors deteriorating" - Warning of weakening setup
→ "Confluence weakening - secure gains" - Consider exit if profitable
COMPACT MODE (Mobile-Friendly):
→ Reduces panel size by showing only essential info
→ Factor icons instead of full breakdowns
→ Simplified guidance messages
→ Perfect for smaller screens
SETTINGS GUIDE
MASTER SETTINGS:
Instrument Type
→ Purpose: Optimizes ATR multipliers and session weights for your asset
→ Options: Auto-Detect (recommended), Forex Major, Forex Cross, Crypto, Index, Commodity
→ Default: Auto-Detect
→ When to change: If auto-detection is incorrect for your symbol
Signal Sensitivity
→ Purpose: Controls how many factors required before generating signals
→ Options:
• Conservative: Requires 12+ for A+, 9+ for A, 7+ for B (fewer, highest quality)
• Balanced: Requires 10+ for A+, 7+ for A, 5+ for B (recommended)
• Aggressive: Requires 8+ for A+, 5+ for A, 3+ for B (more frequent)
→ Default: Balanced
→ When to change: If you want fewer signals (Conservative) or more opportunities (Aggressive)
Enable Trade Signals
→ Purpose: Master on/off switch for signal generation
→ Default: ON
→ When to disable: If you only want to use the analysis dashboards without signals
Enable Trade Tracking
→ Purpose: Tracks active trades and monitors conditions until TP/SL hit
→ Default: ON
→ When to disable: If you manage trades manually and don't want automatic tracking
Show Entry/Stop/Target Levels
→ Purpose: Displays trade plan lines and labels on chart
→ Default: ON
→ When to disable: If you prefer clean charts or manage levels yourself
DISPLAY SETTINGS:
Color Theme
→ Purpose: Optimizes colors for your chart background
→ Options: Dark (for dark charts), Light (for light charts)
→ Default: Dark
Signal Display Style
→ Purpose: Visual style of signal markers
→ Options:
• Premium: Badge with line and background panel (most detailed)
• Minimal: Simple dot with grade text (cleanest)
• Classic: Diamond marker with badge (traditional)
→ Default: Premium
Signal Distance
→ Purpose: How far signal labels appear from price bars (in ATR units)
→ Range: 0.5 to 10.0
→ Default: 2.0
→ When to adjust: Increase to 3.0-4.0 if signals hide behind candle wicks
TP/SL Label Distance
→ Purpose: Spacing of price labels to prevent overlap
→ Range: 0.5 to 5.0
→ Default: 1.5
Show Previous Day Levels
→ Purpose: Display PDH/PDL reference lines
→ Default: ON
→ Best for: Intraday traders who respect previous day levels
MAIN DASHBOARD:
Show Main Dashboard
→ Purpose: Toggle visibility of market conditions table
→ Default: ON
Main Dashboard Position
→ Options: Top Right, Top Left, Bottom Right, Bottom Left
→ Default: Top Right
→ When to change: To avoid overlap with TradingView's built-in panels
TRADE ANALYSIS PANEL:
Show Trade Analysis Panel
→ Purpose: Toggle factor analysis dashboard
→ Default: ON
Analysis Panel Position
→ Options: Top Right, Top Left, Bottom Right, Bottom Left, Middle Right, Middle Left
→ Default: Bottom Left
→ Recommended: Bottom Right or Middle Right to avoid overlap with Main Dashboard
Compact Mode
→ Purpose: Reduces panel size for mobile or smaller screens
→ Default: OFF
→ When to enable: Mobile trading, small screens, or minimalist preference
Show Factor Details
→ Purpose: Displays individual factor scores vs. overall confidence only
→ Default: ON
→ When to disable: For more compact view showing only state and confidence
RISK MANAGEMENT:
Stop Loss Method
→ Purpose: How stop loss distance is calculated
→ Options:
• Structure-Based: Uses swing highs/lows with ATR buffer (recommended)
• ATR-Based: Pure ATR multiplier with min/max constraints
• Fixed ATR: Simple multiplier, no adjustments
→ Default: Structure-Based
→ Impact: Structure-Based respects market geometry but constrains within safe limits
ATR Stop Multiplier
→ Purpose: Multiplier for ATR-based stop calculation
→ Range: 0.5 to 3.0
→ Default: 1.5
→ When to adjust:
• Increase to 2.0-2.5 for more breathing room (fewer false stops)
• Decrease to 1.0-1.2 for tighter stops (but more stop-outs)
Maximum Stop Distance (ATR)
→ Purpose: Cap on stop width to prevent excessive risk
→ Range: 1.0 to 5.0
→ Default: 2.5
→ Impact: If structure-based stop exceeds this, ATR-based stop is used instead
Minimum Stop Distance (ATR)
→ Purpose: Floor on stop width to avoid noise-induced stops
→ Range: 0.2 to 1.0
→ Default: 0.5
→ Impact: Prevents stops too tight to survive normal volatility
Target 1 Risk/Reward Ratio
→ Purpose: R:R for first profit target
→ Range: 0.5 to 2.0
→ Default: 1.0 (1:1 ratio)
→ Common values: 1.0 for quick profit taking, 1.5 for patient trading
Target 2 Risk/Reward Ratio
→ Purpose: R:R for second profit target (full win)
→ Range: 1.0 to 4.0
→ Default: 2.0 (1:2 ratio)
→ Common values: 2.0-3.0 for balanced risk/reward
Minimum R:R Required
→ Purpose: Filters out signals with poor risk/reward
→ Range: 0.5 to 2.0
→ Default: 1.0
→ Impact: Signals where potential reward doesn't meet this ratio are rejected
→ WARNING: Always ensure your position sizing means a stop loss = no more than 1-2% of your account, regardless of R:R ratio
SIGNAL FILTERS:
Session Awareness
→ Purpose: Weights signals higher during major forex sessions
→ Default: ON
→ Impact: Doesn't block signals, but session quality factors into scoring
→ Best for: Forex traders
Session Timezone
→ Purpose: Timezone for session calculations
→ Options: UTC, America/New_York, Europe/London, Asia/Tokyo, Asia/Hong_Kong
→ Default: UTC
→ When to change: Match your broker's server time
Higher Timeframe Alignment
→ Purpose: Checks HTF momentum before generating signals
→ Default: ON
→ Impact: Filters counter-trend signals, improves quality
→ Recommended: Keep enabled
HTF Timeframe
→ Purpose: Which higher timeframe to check
→ Default: Auto (blank field)
→ Auto selection:
• 1m chart → 5m HTF
• 5m chart → 15m HTF
• 15m chart → 1H HTF
• 1H chart → 4H HTF
• 4H+ chart → Daily HTF
→ Manual override: Enter any timeframe (e.g., "60" for 1-hour)
Volume Confirmation
→ Purpose: Requires above-average volume for signals
→ Default: ON
→ Impact: Filters low-liquidity false signals
→ Recommended: Keep enabled
Minimum Volume Ratio
→ Purpose: Volume threshold vs. 20-bar average
→ Range: 0.3 to 2.0
→ Default: 0.8 (80% of average)
→ When to adjust:
• Increase to 1.2-1.5 for only high-volume signals
• Decrease to 0.5-0.7 for more permissive filtering
Structure Clearance Check
→ Purpose: Ensures clear path to targets (no nearby resistance/support)
→ Default: ON
→ Impact: Prevents trades with immediate obstacles
→ Recommended: Keep enabled
Minimum Bars Between Signals
→ Purpose: Cooldown period after each signal
→ Range: 1 to 10
→ Default: 3
→ Impact: After a signal, this many bars must pass before another in same direction
→ When to adjust:
• Increase to 5-7 to prevent over-trading
• Decrease to 1-2 for faster re-entries
ADVANCED TUNING:
Momentum Period
→ Purpose: Base period for Kinetic Pulse calculation
→ Range: 5 to 30
→ Default: 14
→ When to adjust:
• Lower (8-10): More responsive, noisier
• Higher (18-21): Smoother, slower to react
→ Note: If Adaptive Period enabled, this is adjusted automatically
Adaptive Period
→ Purpose: Auto-adjusts momentum period based on volatility
→ Default: ON
→ Impact: Shortens period in high volatility, lengthens in low volatility
→ Recommended: Keep enabled for automatic optimization
Divergence Lookback
→ Purpose: How far back to search for divergence patterns
→ Range: 10 to 60
→ Default: 30
→ When to adjust:
• Shorter (15-20): Only recent divergences
• Longer (40-50): Catches older divergences (may be less relevant)
Swing Detection Bars
→ Purpose: Bars required on each side to confirm swing high/low
→ Range: 2 to 7
→ Default: 3
→ Impact on stops:
• Lower (2-3): More swing points, potentially tighter stops
• Higher (5-7): Only major swings, wider stops
Choppiness Index Threshold
→ Purpose: Threshold above which market considered choppy
→ Range: 38.2 to 80.0
→ Default: 61.8
→ Impact:
• Lower (50-55): Stricter quality filter (fewer signals in ranging markets)
• Higher (65-70): More permissive (allows signals in choppier conditions)
HOW TO READ SIGNALS
SIGNAL ANATOMY:
When a signal appears, you'll see:
1. DIRECTIONAL MARKER
→ Arrow, dot, or diamond pointing to entry candle (depends on style)
→ Positioned below price for LONG, above price for SHORT
→ Connected to price with line (Premium style)
2. GRADE BADGE
→ Displays signal quality: LONG , SHORT , etc.
→ Color coding:
• Bright green/cyan for A+ longs
• Standard green for A/B longs
• Bright pink/magenta for A+ shorts
• Standard red for A/B shorts
3. ENTRY PRICE (Premium style only)
→ Shows exact entry price at signal generation
4. TOOLTIP (all styles)
→ Hover over signal to see complete trade plan
→ Includes: Entry, Stop, TP1, TP2, Risk, R:R ratios, market conditions, signal reason, confluence score
INTERPRETING GRADES:
→ A+ SIGNALS (Highest Quality)
• 8-12+ confirming factors aligned
• Multiple divergences OR strong momentum reversal
• HTF alignment + volume + session timing + clear structure
• These are your highest-probability setups
• Recommended action: Give these priority, consider larger position size
→ A SIGNALS (High Quality)
• 5-9+ confirming factors aligned
• Good confluence, most key factors present
• Missing 1-2 optimal conditions
• These are still quality trades
• Recommended action: Standard position size, solid setups
→ B SIGNALS (Moderate Quality)
• 3-7+ confirming factors aligned
• Minimum viable confluence
• May be missing HTF alignment, volume, or session timing
• Higher variance outcomes
• Recommended action: Smaller position size or skip if conservative
SIGNAL NARRATIVE:
Each signal tooltip includes a narrative explaining WHY it was generated:
→ "Multi-divergence at oversold extreme"
• Multiple oscillators showing bullish divergence
• Kinetic Pulse in oversold zone
• High-quality reversal setup
→ "Bullish divergence near support"
• Divergence detected
• Price near key support level (swing low or PDL)
• Structure confluence
→ "Momentum reversal with HTF alignment"
• Kinetic Pulse velocity reversing
• Higher timeframe supports direction
• Strong trend-following setup
→ "Oversold momentum reversal"
• Extreme Kinetic Pulse reading reversing
• May not have divergence but strong momentum shift
READING THE TRADE PLAN:
Every signal comes with a complete trade plan:
→ ENTRY: The close price of the signal candle
• This is where the signal triggered
• If using limit orders, you might improve on this price
→ STOP: Calculated stop loss level
• Based on your Stop Loss Method setting
• Distance shown in ticks
• Risk tolerance: Ensure this represents ≤1-2% of your account
→ TP1: First profit target
• Default: 1:1 risk-reward
• This is your partial profit or first exit
• Consider taking 50% off at TP1
→ TP2: Second profit target
• Default: 1:2 risk-reward
• This is your "full win" target
• Hold remaining position for this level
SIGNAL FREQUENCY EXPECTATIONS:
Frequency varies by timeframe, sensitivity, and market conditions:
→ AGGRESSIVE MODE
• Lower timeframes (1m-5m): 5-15 signals per day
• Mid timeframes (15m-1H): 2-5 signals per day
• Higher timeframes (4H-D): 1-3 signals per week
→ BALANCED MODE (Default)
• Lower timeframes: 3-8 signals per day
• Mid timeframes: 1-3 signals per day
• Higher timeframes: 2-5 signals per week
→ CONSERVATIVE MODE
• Lower timeframes: 1-4 signals per day
• Mid timeframes: 0-2 signals per day
• Higher timeframes: 1-3 signals per week
Note: Frequency also depends on market volatility and trending vs. ranging conditions.
Example - Kinetic Scalper Trade Sequence
Here's an example showing the complete trade lifecycle with all dashboard transitions, annotations, and descriptions.
INSTRUMENT & TIMEFRAME DETAILS
Symbol: Nifty 50 Index (NSE)
Date: December 15, 2025
Session: London session (active trading hours)
Instrument Type: Index (auto-detected)
TRADE SEQUENCE BREAKDOWN
SCREENSHOT 1: Pre-Signal Setup Building (Image 1)
Time: ~12:00-14:30 UTC+5:30(approx.)
Price Action: Uptrend showing signs of exhaustion near 26,200
Market State: Price at session highs
Main Dashboard (Top Right):
- Bias: LEAN SHORT
- Pulse: 58.9 (approaching overbought)
- Volatility: NORMAL
- Trend: TRANSITIONING
- Session: LONDON (favorable timing)
- Volume: 0.98x (slightly below average)
- HTF: BULLISH (caution for counter-trend)
- Best Score: 9/5 (Short score building)
- PDH/PDL: 26098.25 / 25938.95
Trade Analysis Panel (Bottom Left):
- Status: NO ACTIVE TRADE
- Long Score: 5/5 (RDY)
- Short Score: 9/5 (RDY)
- Panel Message: "Short pattern developing - score: 9"
Description :
Setup Development Phase: The indicator identifies a potential short opportunity as price reaches the previous day's high. The short confluence score has climbed to 9/15 points, meeting the 'Balanced' sensitivity threshold for a Grade B signal. Notice the 'LEAN SHORT' bias and the Kinetic Pulse reading of 58.9 approaching overbought territory. The Trade Analysis panel shows 'Short pattern developing' with 9/5 factors aligned. Key factors: momentum approaching reversal zone, price at resistance (PDH), and London session providing favorable conditions.
SCREENSHOT 2: Signal Generated & Trade Entered (Image 2)
Time: ~13:00 UTC+5:30 (signal bar)
Entry Price: 26,184.65
Signal Grade: Grade
Main Dashboard (Top Right):
- Trade: SHORT
- Entry: 26184.65
- P/L: 5.95 pts | +0.2R (early positive movement)
- TP1: 26157.00 (33.2 pts away)
- TP2: 26129.35 (60.84 pts away)
- Stop: 26212.30 (22.1 pts away)
- Bars: 1 (just entered)
Trade Analysis Panel (Bottom Left):
- Header: TRADE ANALYSIS
- Status Bar: "Conditions mixed - improving 57%"
- Confidence: 57% RISING
- Factor Breakdown:
- Momentum: -4 (velocity not yet aligned)
- Position: +4 (slight profit)
- Volume: +2 = (volume present)
- HTF Align: +2 = (not strongly aligned)
- Target: +0 - (far from TP)
- Stop Dist: +3 - (good distance)
- Bottom Status: "Conditions mixed - Monitoring"
- Disclaimer: "Analysis only - Not financial advice"
Description:
Signal Activation: A Grade A short signal triggers at 26,184.65 after the short confluence score reached qualifying levels. The indicator places a structure-based stop loss at 26,212.30 (27.65 points risk) with dual targets at 1:1 and 1:2 risk-reward ratios.
The Trade Analysis Panel immediately begins monitoring with an initial confidence score of 57% - classified as 'MIXED SIGNALS' but showing a 'RISING' trend. Factor analysis reveals: momentum not yet aligned (-4 points as price just reversed), position slightly favorable (+4 points already +0.2R), volume adequate (+2), HTF showing weak alignment (+2 as we're counter-trend), stop well-placed (+3), but targets still distant (0 points).
Notice how the Main Dashboard switches from market scanning mode to active trade tracking, now displaying entry price, live P/L in both points (5.95 pts) and R-multiples (+0.2R), and distances to all key levels. The analysis panel provides real-time factor scoring to help monitor trade health.
SCREENSHOT 3: TP1 Hit - Trade Performing Well (Image 3)
Time: ~14:20 UTC+5:30(approx)
Price: ~26,154 (TP1 zone)
Bars in Trade: 29
Main Dashboard (Top Right):
- Trade: SHORT
- Entry: 26184.65
- P/L: 30.85 pts | +1.12R (excellent progress)
- TP1: HIT (displayed in green)
- TP2: 26129.35 (24.44 pts away)
- Stop: 26212.30 (58.5 pts away - well protected)
- Bars: 29
Trade Analysis Panel (Bottom Left):
- Header: TRADE ANALYSIS
- Status Bar: "Multiple factors positive"
- Confidence: 78% RISING
- Factor Breakdown:
- Momentum: +8 = (ALIGNED)
- Position: +8 + (strong profit zone)
- Volume: +2 + (continued support)
- HTF Align: +8 = (now strongly aligned)
- Target: +10 + (TP1 achieved, approaching TP2)
- Stop Dist: +3 + (excellent cushion)
- Bottom Status: "Multiple factors positive"
- Visual State: Green background (FACTORS ALIGNED state)
Description:
Trade Execution Phase - First Target Achieved: After 29 bars , price reaches the first take-profit target at 26,157.00. The ' ' marker confirms partial profit taking. Current P/L shows +30.85 points (+1.12R), exceeding the initial 1:1 risk-reward.
The Trade Analysis Panel shows dramatic improvement - confidence has surged to 78% (FACTORS ALIGNED state) with most factors now positive:
- Momentum factor improved to +8 (velocity aligned with trade direction)
- Position factor at +8 (over +1R profit zone)
- HTF Align jumped to +8 (higher timeframe now confirming the move)
- Target factor maxed at +10 (TP1 achieved, TP2 within reach)
- Stop Distance at +3 (58.5 points cushion providing safety)
Notice the panel status displays 'Multiple factors positive' with a green-tinted background, indicating optimal trade conditions. The confidence trend shows 'RISING' suggesting continued momentum. With TP1 secured and only 24.44 points to TP2, the trade is well-positioned for a full 1:2R win.
SCREENSHOT 4: TP2 Reached - Trade Complete (Image 4)
Time: ~15:00+ UTC+5:30
Final Exit: 26,129.35 (TP2)
Final Result: Full TP2 win
Main Dashboard (Top Right):
- Bias: NEUTRAL (reverted to scanning mode)
- Pulse: 45.2 (returned to neutral zone)
- Volatility: NORMAL
- Trend: TREND DOWN (confirmed the move)
- Session: LONDON
- Volume: 1.26x (increased as move developed)
- HTF: BEARISH (fully aligned post-trade)
- Best Score: 5/5 (neutral after completion)
Trade Analysis Panel (Bottom Left):
- Status: NO ACTIVE TRADE (reverted)
- Long Score: 5/5 (RDY)
- Short Score: 5/5 (RDY)
- Panel Message: "Scanning - prime session active"
- Light blue/cyan background (back to scanning mode)
Description:
Trade Completion - Full Target Achieved: The short trade reaches its second take-profit target at 26,129.35, securing a complete 1:2 risk-reward win. The ' ' marker confirms the exit. Final results:
- Entry: 26,184.65
- Exit: 26,129.35
- Profit: 55.30 points (approximately +2.0R)
- Outcome: Full TP2 success
Post-Trade Analysis: After trade closure, the indicator automatically returns to market scanning mode. The Main Dashboard reverts to showing market conditions rather than trade metrics. Notice how the 'Trend' now displays 'TREND DOWN' - confirming the move we captured. Volume increased to 1.26x during the winning move, validating the signal quality.
The Trade Analysis Panel switches back to 'NO ACTIVE TRADE' status and resumes displaying long/short setup scores. The confidence-based factor monitoring was instrumental throughout the trade:
- Initial entry at 57% confidence (MIXED SIGNALS)
- Peak confidence of 78% at TP1 (FACTORS ALIGNED)
- Real-time factor updates helped confirm trade validity
This example demonstrates the indicator's complete workflow: setup identification → signal generation → entry execution → live trade monitoring → systematic exit at targets.
KEY FEATURES DEMONSTRATED
1. Dual Dashboard System
- Main Dashboard: Market conditions (scanning) → Trade metrics (active position)
- Analysis Panel: Setup scores (scanning) → Factor-based confidence (in-trade)
2. Visual Trade Management
- Color-coded entry zones (yellow)
- Risk levels clearly marked (red dashed stop)
- Profit targets with R:R ratios labeled
- Achievement markers ( , )
3. Real-Time Factor Analysis
- 6-factor scoring system (Momentum, Position, Volume, HTF, Target, Stop Dist)
- Confidence percentage with trend indicators
- State machine (MIXED → FACTORS ALIGNED)
- Hysteresis prevents false state changes
4. Risk Management
- Structure-based stop placement (respects swing highs)
- Multiple take-profit levels (1:1 and 1:2 R:R)
- Live P/L tracking in points and R-multiples
- Distance monitoring to all key levels
This complete example showcases the indicator's progression from setup identification through trade completion, demonstrating how the dual-dashboard system and factor-based analysis provide continuous trade guidance. The structured stop-loss and dual-target approach delivered the planned 1:2 risk-reward ratio with systematic, rule-based execution.
ALERT SYSTEM
The indicator includes 9 built-in alert conditions:
SIGNAL ALERTS:
→ High-Grade Long Signal (A+)
• Triggers only on A+ long signals
• For traders who want only the highest-quality longs
• Message: "KINETIC SCALPER: LONG @ "
→ High-Grade Short Signal (A+)
• Triggers only on A+ short signals
• For traders who want only the highest-quality shorts
• Message: "KINETIC SCALPER: SHORT @ "
→ Long Signal
• Triggers on ANY qualified long signal (A+, A, or B)
• For traders who want all long opportunities
• Message: "KINETIC SCALPER: LONG @ "
→ Short Signal
• Triggers on ANY qualified short signal
• For traders who want all short opportunities
• Message: "KINETIC SCALPER: SHORT @ "
TRADE MANAGEMENT ALERTS:
→ TP1 Hit
• Triggers when first profit target is reached
• Useful for partial profit taking notifications
• Message: "KINETIC SCALPER: TP1 REACHED"
→ TP2 Reached
• Triggers when second profit target is reached
• Trade is complete, full win achieved
• Message: "KINETIC SCALPER: TP2 REACHED"
→ Stop Loss Hit
• Triggers when stop loss is reached
• Important for trade management and risk tracking
• Message: "KINETIC SCALPER: STOP LOSS"
ANALYSIS STATE ALERTS:
→ Analysis State: Negative Bias
• Triggers when factor analysis enters "Negative Bias" state
• Warning that trade conditions are deteriorating
• Consider reducing position or preparing to exit
• Message: "KINETIC SCALPER: Analysis state changed to NEGATIVE BIAS"
→ Analysis State: Factors Weakening
• Triggers when factor analysis enters "Factors Weakening" state
• Caution that confluence is diminishing
• Monitor trade closely
• Message: "KINETIC SCALPER: Analysis state changed to FACTORS WEAKENING"
HOW TO SET UP ALERTS:
1. Click the "Create Alert" button in TradingView
2. Condition: Select "Kinetic Scalper "
3. Choose your desired alert from the dropdown
4. Configure your alert options:
→ Once Per Bar Close (recommended for non-repainting)
→ Frequency: Once Per Bar Close or Only Once
5. Set expiration and notification methods (popup, email, webhook, etc.)
6. Create alert
RECOMMENDED ALERT STRATEGY:
For active traders:
→ Set "Long Signal" and "Short Signal" alerts for all opportunities
→ Set "TP1 Hit", "TP2 Reached", and "Stop Loss Hit" for trade management
→ Consider "Analysis State: Negative Bias" for trade monitoring
For selective traders:
→ Set only "High-Grade Long Signal (A+)" and "High-Grade Short Signal (A+)"
→ Focus on the absolute highest-quality setups
→ Set TP/SL alerts for position management
USAGE TIPS & BEST PRACTICES
SIGNAL SELECTION:
✓ GRADE MATTERS
→ A+ signals have statistically more confluence factors
→ If you're conservative, trade only A+ signals
→ B signals can work but require more discretion
✓ CONFLUENCE WITH YOUR ANALYSIS
→ Use this indicator as CONFIRMATION, not sole decision criteria
→ Combine with your own support/resistance analysis
→ Check for fundamental events (news, economic data)
→ Respect major round numbers and psychological levels
✓ SESSION TIMING (Forex)
→ Best signals often occur during London/NY overlap
→ Avoid signals 10 minutes before major news releases
→ Asian session signals can be valid but lower liquidity
✓ TIMEFRAME CONFLUENCE
→ If you get an A+ signal on 15m, check if 1H chart agrees
→ Higher timeframe confirmation adds conviction
→ Avoid signals that oppose the daily/4H trend
TRADE MANAGEMENT:
✓ POSITION SIZING
→ ALWAYS size positions so stop loss = 1-2% of account
→ Never risk more than you can afford to lose
→ Smaller position on B signals, standard on A, larger on A+ (within limits)
✓ PARTIAL PROFIT TAKING
→ Consider taking 50% off at TP1
→ Move stop to breakeven after TP1 hit
→ Let remaining position run to TP2
✓ TRAILING STOPS
→ The indicator doesn't auto-trail stops (manual decision)
→ After TP1, you might manually move stop to entry (breakeven)
→ Consider ATR-based trailing stop for runners
✓ WATCH THE ANALYSIS PANEL
→ If state changes to "Factors Weakening" while in profit, consider exit
→ "Negative Bias" during a trade is a strong warning
→ "Factors Aligned" confirms your trade thesis is still valid
RISK MANAGEMENT:
✓ NEVER IGNORE STOPS
→ The calculated stop is there for a reason
→ Moving stop further away increases risk exponentially
→ If stopped out, accept it and wait for next setup
✓ AVOID REVENGE TRADING
→ If you get stopped out, resist urge to immediately re-enter
→ Signal cooldown helps with this
→ Wait for next qualified signal
✓ RESPECT VOLATILITY WARNINGS
→ If indicator shows "EXTREME" volatility, signals are blocked for a reason
→ Don't force trades in chaotic conditions
→ Wait for regime to normalize
✓ CORRELATION RISK
→ Be aware of correlation if trading multiple pairs
→ EUR/USD and GBP/USD are highly correlated
→ Don't stack risk on correlated instruments
OPTIMIZATION:
✓ START WITH DEFAULTS
→ Default settings are well-tested
→ Don't over-optimize for recent market behavior
→ Give settings at least 20-30 trades before judging
✓ TIMEFRAME-SPECIFIC ADJUSTMENTS
→ Lower timeframes: Consider increasing Signal Distance to 3.0-4.0
→ Higher timeframes: ATR Stop Multiplier might go to 2.0-2.5
→ Crypto: Ensure Instrument Type is set to "Crypto" for proper stops
✓ SENSITIVITY CALIBRATION
→ Too many signals? Switch to Conservative
→ Missing good setups? Try Balanced or Aggressive
→ Quality > Quantity always
✓ KEEP A JOURNAL
→ Track which signal grades work best for you
→ Note which sessions produce best results
→ Review stopped trades for patterns
THINGS TO AVOID:
✗ DON'T chase signals after several bars have passed
✗ DON'T ignore the stop loss or move it further away
✗ DON'T overtrade by taking every B-grade signal
✗ DON'T trade during major news if you're not experienced
✗ DON'T use this as your only analysis tool
✗ DON'T expect 100% win rate (no indicator has this)
✗ DON'T risk more than 1-2% per trade regardless of signal grade
UNDERSTANDING THE METHODOLOGY
WHY VOLUME WEIGHTING?
Traditional momentum oscillators treat all price moves equally. A 10-point move on low volume is weighted the same as a 10-point move on high volume.
The Kinetic Pulse corrects this by:
→ Calculating volume ratio vs. 20-bar average
→ Applying square root transformation to volume ratio (prevents extreme weights)
→ Multiplying price changes by volume weight
→ Result: High-volume moves influence the oscillator more than low-volume noise
This helps filter false breakouts and emphasizes moves with participation.
WHY FISHER TRANSFORM?
Fisher Transform is a mathematical transformation that:
→ Normalizes probability distributions
→ Creates sharper turning points
→ Amplifies extremes while compressing the middle
→ Makes overbought/oversold levels more distinct
Applied to the Kinetic Pulse, it helps identify genuine extremes vs. noise.
WHY MULTI-OSCILLATOR DIVERGENCE?
Single-source divergence can give false signals. By requiring divergence confirmation across multiple oscillators (Kinetic Pulse, CCI, Stochastic), the system filters out:
→ Divergences caused by calculation quirks in one oscillator
→ Temporary momentum anomalies
→ False divergence on noisy, low-timeframe charts
Multiple sources confirming the same pattern increases reliability.
WHY ADAPTIVE PERIODS?
Fixed periods can be:
→ Too slow during high volatility (miss fast reversals)
→ Too fast during low volatility (generate noise)
The adaptive system:
→ Shortens period when ATR ratio > 1.3 (high volatility = need faster response)
→ Lengthens period when ATR ratio < 0.7 (low volatility = need noise filtering)
→ Keeps period in reasonable range (60% to 140% of base period)
→ Result: Oscillator adjusts to current market pace automatically
WHY HYSTERESIS IN STATE MACHINE?
Without hysteresis, the analysis state would flip-flop on every bar, creating:
→ Confusing, contradictory guidance
→ Analysis paralysis
→ Lack of actionable information
Hysteresis solves this by:
→ Using different thresholds to ENTER vs. EXIT a state
→ Example: Enter "Factors Aligned" at 72+ confidence, but don't exit until <62
→ This creates stable states that persist through minor fluctuations
→ Requires minimum commitment period (3 bars) before state changes
→ Overrides commitment for significant events (near TP/SL)
→ Result: Stable, trustworthy analysis that changes only when truly warranted
WHY CONFIDENCE SMOOTHING?
Raw factor scores fluctuate bar-by-bar based on momentary conditions. Smoothing:
→ Uses 5-period EMA on raw confidence scores
→ Filters out single-bar anomalies
→ Preserves genuine trends in confidence
→ Prevents false state transitions
→ Result: More reliable assessment of actual trade health
WHY INSTRUMENT-SPECIFIC PARAMETERS?
Different instruments have different characteristics:
→ Forex is highly liquid, respects technical levels well, standard ATR works
→ Crypto is extremely volatile, needs wider stops (1.8x) to avoid false stops
→ Indices respect session opens strongly, session weighting is important
→ Commodities fall in between
Auto-detection applies research-based multipliers automatically.
WHY STRUCTURE-BASED STOPS?
ATR-based stops can:
→ Place stop in middle of consolidation (easily hit)
→ Ignore obvious invalidation levels
→ Be too tight during expansion or too wide during contraction
Structure-based stops:
→ Use actual swing highs/lows (where traders actually place stops)
→ Add small ATR buffer to avoid stop hunting
→ Constrain within min/max ATR limits for safety
→ Result: Stops that respect market geometry while managing risk
DISCLAIMER & RISK WARNING
READ THIS CAREFULLY BEFORE USING THIS INDICATOR
This indicator is provided for EDUCATIONAL and INFORMATIONAL purposes only.
❌ NOT FINANCIAL ADVICE
This indicator does NOT constitute financial advice, investment recommendations, or solicitation to buy or sell any financial instrument. All information is for educational purposes only.
❌ NO GUARANTEES
→ Past performance does NOT guarantee future results
→ No indicator can predict future price movements with certainty
→ Signal grades represent confluence, NOT win probability
→ A+ signals can lose, B signals can win - markets are probabilistic
❌ SUBSTANTIAL RISK
Trading financial instruments involves SUBSTANTIAL RISK of loss:
→ You can lose your entire investment
→ Leveraged trading amplifies both gains AND losses
→ Never trade with money you cannot afford to lose
→ Never risk more than 1-2% of your account per trade
❌ YOUR RESPONSIBILITY
→ All trading decisions are YOUR responsibility
→ You must conduct your own analysis before entering trades
→ Consult a licensed financial advisor before trading
→ Understand the risks specific to your jurisdiction and situation
→ Only trade with capital you can afford to lose completely
❌ NO HOLY GRAIL
→ This indicator is a TOOL, not a complete trading system
→ It should be used as part of a broader analysis framework
→ Combine with your own technical analysis, risk management, and judgment
→ No indicator works 100% of the time in all market conditions
❌ ANALYSIS PANEL DISCLAIMER
The "Trade Analysis Panel" provides ALGORITHMIC ANALYSIS of market factors.
→ It does NOT provide investment advice or recommendations
→ Factor scores are mathematical calculations, not predictions
→ Guidance messages are informational, not directives
→ All trading decisions remain your responsibility
❌ BACKTESTING LIMITATIONS
→ This is an indicator, not a strategy, so no backtesting results are provided
→ Any backtesting you perform includes hindsight bias and optimization bias
→ Historical performance does not indicate future performance
→ Slippage, commissions, and real-world execution differ from backtests
❌ MARKET CONDITIONS
→ This indicator performs differently in trending vs. ranging markets
→ Extreme volatility can produce false signals or whipsaws
→ Low liquidity periods increase execution risk
→ Major news events can invalidate technical analysis
BY USING THIS INDICATOR, YOU ACKNOWLEDGE:
→ You have read and understood this disclaimer
→ You accept full responsibility for your trading decisions
→ You understand the substantial risks involved in trading
→ You will not hold the author liable for any losses incurred
→ You are using this tool as part of your own due diligence process
KEY FEATURES SUMMARY
✅ Volume-Weighted Kinetic Pulse Engine (proprietary momentum calculation)
✅ 15-Factor Confluence Scoring System (graded signals: A+, A, B)
✅ Multi-Oscillator Divergence Detection (Pulse + CCI + Stochastic)
✅ Higher Timeframe Trend Alignment Filter
✅ Adaptive Period Adjustment (volatility-responsive)
✅ Instrument-Aware Calibration (Forex, Crypto, Indices, Commodities)
✅ Structure-Based Stop Loss Calculation (respects swing highs/lows)
✅ Automated Trade Tracking (entry, stop, TP1, TP2, P/L)
✅ Real-Time Factor Analysis State Machine (5-state system with hysteresis)
✅ Session Awareness (Asian, London, New York, Overlap)
✅ Volatility Regime Detection (blocks signals in extreme conditions)
✅ Choppiness Filter (reduces signals in ranging markets)
✅ Volume Confirmation (relative volume and delta analysis)
✅ Clean Air Check (validates clear path to targets)
✅ Comprehensive Dashboards (market conditions + trade analysis)
✅ Customizable Display (3 signal styles, color themes, positioning)
✅ 9 Built-In Alert Conditions (signals, TP/SL hits, state changes)
✅ Fully Non-Repainting (barstate.isconfirmed, lookahead_off)
✅ Previous Day Levels (PDH/PDL reference lines)
✅ Mobile-Friendly Compact Mode (for smaller screens)
TECHNICAL SPECIFICATIONS
→ Pine Script Version: v6
→ Indicator Type: Overlay (displays on price chart)
→ License: Mozilla Public License 2.0
→ Copyright: BULLBYTE
→ Object Limits: 300 labels, 100 lines, 50 boxes
→ Memory Management: Automatic cleanup system (FIFO queue)
→ Repainting: Non-repainting (signals confirmed on bar close)
→ Timeframe Support: All timeframes (1s to Monthly)
→ Instrument Support: Forex, Crypto, Indices, Commodities, Stocks
→ HTF Data Handling: lookahead_off with historical offset
VERSION HISTORY
v1.0 - Initial Release
→ Kinetic Pulse engine with volume weighting and Fisher Transform
→ 15-factor confluence scoring system
→ Trade analysis state machine with hysteresis
→ Automated trade tracking and monitoring
→ Dual dashboard system (market conditions + factor analysis)
→ 9 alert conditions
→ 3 signal display styles
→ Instrument-aware calibration
→ Full risk management framework
WHO IS THIS INDICATOR FOR?
IDEAL FOR:
✓ Scalpers and day traders seeking high-confluence reversal entries
✓ Swing traders who want quality over quantity
✓ Traders who appreciate systematic, rules-based analysis
✓ Multi-timeframe traders who value HTF confirmation
✓ Forex traders who respect session timing
✓ Crypto traders needing volatility-adjusted parameters
✓ Traders who want complete trade management (entry, stop, targets)
✓ Analytical traders who want transparency in signal generation
NOT IDEAL FOR:
✗ Traders seeking a "set and forget" holy grail system
✗ Traders who don't want to learn the methodology
✗ Traders unwilling to accept losing trades as part of the process
✗ Traders who need constant signals (this is a quality-focused system)
✗ Traders who ignore risk management
FINAL THOUGHTS
The Kinetic Scalper is the result of extensive research into momentum behavior, volume confirmation, and multi-factor confluence analysis. It's designed to identify high-probability reversal setups while maintaining strict risk management and providing complete transparency.
This is NOT a magic solution. It's a sophisticated TOOL that requires:
→ Understanding of the methodology
→ Proper risk management discipline
→ Patience to wait for quality setups
→ Willingness to accept losses as part of trading
→ Integration with your own analysis and judgment
Used properly as part of a complete trading plan, the Kinetic Scalper can help you identify high-confluence opportunities and manage trades systematically.
Remember: Quality over quantity. Discipline over emotion. Risk management over everything.
Trade smart. Trade safe.
© 2025 BULLBYTE | Kinetic Scalper v1.0 | For Educational Purposes Only

Aamir Sniper Pro Institutional Core MTFConcept & Utility: This script is a comprehensive "Multi-Factor Confluence System" designed to filter out market noise by requiring agreement between Trend, Momentum, Volatility, and Market Structure before generating a signal.
Many traders struggle with false signals generated by single indicators. This script solves that problem by using a Consensus Engine. Instead of relying on just one moving average or oscillator, this script aggregates data from over 20 different technical methods. It then applies strict filters (WAE, ADX, and MTF) to ensure that trades are only suggested during high-probability market conditions.
How the Components Work Together:
1. The Consensus Engine (The Core Logic): At the heart of the script is a voting system. It calculates the slope and direction of:
Fast/Slow EMAs, SMAs, WMAs, and Hull MA.
Ichimoku Cloud (Baseline/Conversion line).
SuperTrend and Parabolic SAR.
Oscillators (RSI, Stochastic, CCI).
Result: It generates a "Consensus Score" (0-100%). A signal is ONLY considered if the Bullish or Bearish score exceeds the user-defined threshold (Default: 70%).
2. The Filtering Layers (Why this is not just a mashup): A high consensus score alone is not enough. The script validates the signal through three mandatory filters:
Volatility Filter (WAE): Uses Waddah Attar Explosion logic to ensure there is enough volume/power to sustain the move.
Regime Filter (ADX): Checks the Average Directional Index. If the market is choppy (ADX < 25), the signal is blocked to prevent whipsaws.
MTF Filter: Checks the trend on a Higher Timeframe (Default: 1 Hour). It forces the user to trade only in the direction of the dominant trend.
3. Structural Context (SR Zones): We have integrated Dynamic Support & Resistance Zones based on Pivot Points.
Purpose: This provides immediate structural context. Even if the Consensus Engine gives a "BUY" signal, the trader can see if price is currently sitting at a "Resistance Box." This visual aid prevents buying into supply or selling into demand.
4. Institutional Volume (PVSRA): Candles are colored based on Volume Spread Analysis (PVSRA) concepts.
Purple/Blue Candles: Indicate "Whale Activity" (Volume > 200% of average). This helps confirm if institutional money is backing the move identified by the Consensus Engine.
5. Momentum Confirmation (QQE): The Qualitative Quantitative Estimation (QQE) is displayed on the dashboard to confirm short-term momentum direction, acting as the final trigger.
Features:
Sniper Mode: Option to wait for a candle retest before entry.
Dashboard: Displays the live Consensus Score, Market Regime, and Trend Status.
Risk Management: Auto-calculates SL/TP based on Swing High/Low or ATR.
Credits & Attribution:
WAE Logic: Adapted from the work of Waddah Attar.
PVSRA: Volume concepts adapted from the Traderathome/PVSRA community.
QQE: Adapted from standard open-source logic.
SR Zones: Logic derived from standard Pivot Point calculations.
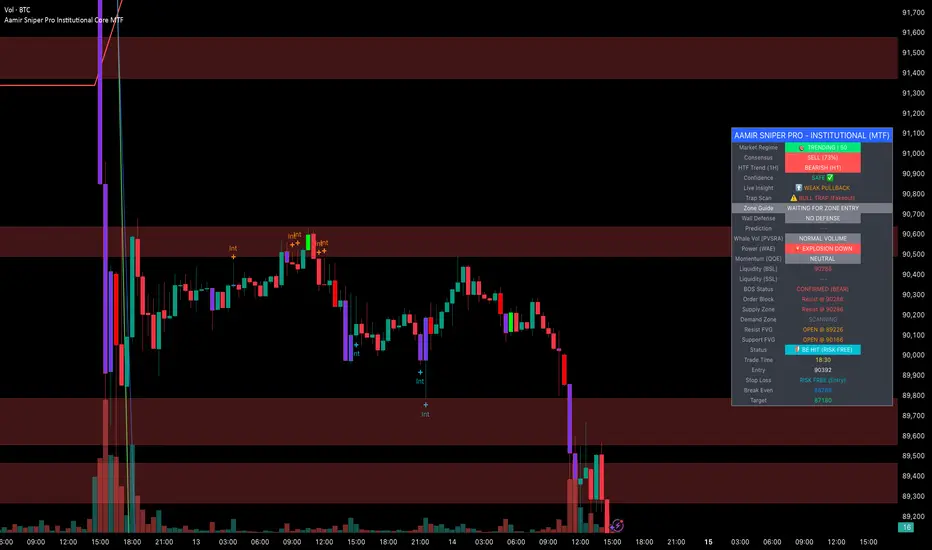
DR.SS.SMART BUY/SMARTSELL SCALPER1️⃣ BEST TIMEFRAME
Use this as a scalper / intraday trend tool
✅ Best
5 min
15 min
⚠️ Avoid
1 min (too noisy)
Daily (signals become late)
2️⃣ FIRST CHECK – MARKET CONDITION (Dashboard)
Before taking any trade, look at the Smart Panel (Dashboard):
✔ Trade ONLY when:
Market State = Trending
Volatility = Active
Trend Pressure = Bullish or Bearish
At least 3–4 MTF boxes are same color
❌ Avoid trades when:
Market State = No trend / Ranging
Purple candles (ADX sideways)
Remember:
T-V-T rule → Trend + Volatility + Timeframe agree
3️⃣ BUY SETUP (LONG TRADE)
✅ Conditions in your code:
Price crosses ABOVE Supertrend
Close ≥ SMA 13
Bar color turns BLUE
Price above EMA 200 → Smart Buy
ADX not sideways (no purple bars)
📍 Chart shows label:
“Buy” → normal buy
“Smart Buy” → high-probability trade (BEST)
🔵 HOW TO ENTER BUY
Enter at candle CLOSE where Buy / Smart Buy appears
Do NOT enter mid-candle
🛑 STOP LOSS (Auto from code)
SL = ATR-based stop
Shown as red SL line
👉 Safe rule:
Never widen SL
🎯 TARGETS (Auto plotted)
TP1 = 1:1
TP2 = 2:1
TP3 = 3:1
📌 Recommended management:
Book 50% at TP1
Move SL to Entry
Hold rest till TP2 / Trail
4️⃣ SELL SETUP (SHORT TRADE)
✅ Conditions:
Price crosses BELOW Supertrend
Close ≤ SMA 13
Bar color turns RED
Price below EMA 200 → Smart Sell
No sideways (ADX > 15)
📍 Label shown:
“Sell”
“Smart Sell” (BEST)
🔴 HOW TO ENTER SELL
Enter at close of signal candle
Follow same SL & TP rules
5️⃣ SUPPLY & DEMAND CONFIRMATION (POWER FILTER)
🔹 Best Buy:
Price near Demand Zone
Then Smart Buy appears
🔹 Best Sell:
Price near Supply Zone
Then Smart Sell appears
👉 These are institutional entries
6️⃣ WHEN NOT TO TRADE ❌
Avoid trades when:
Purple candles (Sideways)
Supertrend flipping repeatedly
MTF dashboard mixed colors
During low-volume sessions
7️⃣ SESSION WISE BEST PERFORMANCE
From your session logic:
✅ Best Scalping:
London
London + New York overlap
⚠️ Avoid:
Mid-Tokyo (low volatility)
8️⃣ PERFECT TRADE CHECKLIST (SAVE THIS)
Before clicking BUY/SELL, ask:
✔ Smart Buy / Smart Sell?
✔ Price above/below EMA 200?
✔ Dashboard trend agrees?
✔ No sideways candles?
✔ Volatility Active?
👉 If 4 out of 5 = YES → TAKE TRADE
9️⃣ SIMPLE ONE-LINE STRATEGY
Trade only Smart Buy/Sell in trending market, book partial at 1:1, trail rest with Smart Trail
✅ BEST TRADING SESSIONS (Use ONLY these)
🥇 LONDON SESSION (BEST & SAFE)
🕒 12:30 PM – 4:30 PM IST
Why best for your script
Clean trends
Good volatility
Less fake signals
Supertrend + EMA200 works perfectly
👉 This should be your PRIMARY session
🥈 LONDON → NEW YORK OVERLAP (MOST POWERFUL)
🕒 6:00 PM – 8:30 PM IST
Why
Institutional money enters
Strong breakouts
Smart Buy / Smart Sell accuracy highest
👉 Use only Smart signals in this session
🥉 NEW YORK SESSION (Early Part Only)
🕒 6:00 PM – 9:00 PM IST
Use when
Market State = Trending
Volatility = Active
MTF mostly same color
⚠️ Stop after 9:00 PM IST
❌ SESSIONS TO AVOID
🚫 TOKYO SESSION
🕒 5:30 AM – 10:30 AM IST
Low volatility
Sideways (purple candles)
Many fake reversals
🚫 SYDNEY SESSION
🕒 2:30 AM – 5:30 AM IST
Very low volume
Not suitable for scalping
🚫 INDIAN MIDDAY
🕒 11:00 AM – 12:15 PM IST
Choppy
Stop-hunting candles
📌 BEST DAILY ROUTINE (Follow This)
Time (IST) Action
9:15 – 10:30 ❌ Avoid (fake moves)
12:30 – 4:30 ✅ TRADE (Best zone)
6:00 – 8:30 ✅ TRADE (High accuracy)
After 9:00 ❌ Avoid
🧠 EASY MEMORY RULE (Your Style)
“LON → NY = MONEY” 💰
“ASIA = NO TRADE” ❌
🎯 FINAL RECOMMENDATION
If you want only ONE session:
👉 Trade ONLY: 12:30 PM – 4:30 PM IST
This will give:
Less stress
Higher win-rate
Cleaner Smart Buy/Sell signals
🇮🇳 BEST TRADING SESSIONS (INDIA – IST)
🥇 LONDON SESSION – BEST FOR INDIAN TRADERS
🕒 12:30 PM – 4:30 PM IST
✅ THIS IS THE BEST SESSION
Strong trend moves
High accuracy Smart Buy / Smart Sell
Less sideways (purple candles reduce)
Works perfectly with Supertrend + EMA 200
👉 Use this as your MAIN session
🥈 LONDON → NEW YORK OVERLAP (POWER SESSION)
🕒 6:00 PM – 8:30 PM IST
✅ Very strong moves
Institutional activity
Best breakouts
High RR trades (2:1 / 3:1)
⚠️ Trade only Smart Buy / Smart Sell
⚠️ Avoid over-trading
🥉 INDIAN MARKET OPEN (LIMITED USE)
🕒 9:20 AM – 10:15 AM IST
✔ Use only if:
Dashboard = Trending
Volatility = Active
Direction same as higher TF
❌ Avoid after 10:30 AM
❌ SESSIONS TO AVOID (INDIA)
Session Time (IST) Reason
Tokyo 5:30 – 10:30 AM Sideways / fake moves
Mid-day Chop 11:00 – 12:15 PM Low volume
Late NY After 9:00 PM Whipsaws
📌 BEST DAILY ROUTINE (INDIA)
Time What to Do
9:15 – 9:20 ❌ No trade
9:20 – 10:15 ⚠️ Only clean Smart signals
12:30 – 4:30 ✅ MAIN TRADING WINDOW
6:00 – 8:30 ✅ HIGH PROBABILITY
After 9:00 ❌ Stop trading
🧠 EASY MEMORY RULE
“INDIA → LONDON → MONEY” 💰
“ASIA MIDDAY → NO TRADE” ❌
🎯 FINAL ANSWER (ONE-LINE)
👉 For India (IST), trade ONLY between
12:30 PM – 4:30 PM and 6:00 PM – 8:30 PM

Affirmify AI — Entry PrecisionAffirmify AI — Entry Precision is a multi-factor directional model with entry-quality filter and ATR-based SL/TP, synced with the Affirmify core engine.
What is Affirmify AI — Entry Precision?
Affirmify AI — Entry Precision is the TradingView front-end of the Affirmify core model.
It combines:
multi-timeframe trend filters
momentum & volatility conditions
an entry-quality check (candle body vs ATR)
ATR-based SL/TP engine
The script is designed to mirror the logic of the Affirmify Python backend used on AffirmifyHub.com.
Core idea
1.Score (core direction):
Built from ADX, EMA trend, RSI zone, MACD histogram, DI+/DI- and ATR volatility penalty.
Score ≥ +2 → BUY bias
Score ≤ −2 → SELL bias
Between −1 and +1 → no clear direction.
2.Higher-timeframe (MTF) confirmation:
Same style of scoring on a higher TF (default 4H).
If MTF direction conflicts with the main timeframe, the script will show “MTF conflict / NO TRADE” and block signals.
3.Entry quality filter:
Checks if the candle body is large enough vs ATR (Min body size (x ATR)).
Output:
CONFIRMED – direction + volatility + body are aligned
WAIT FOR BETTER ENTRY – direction ok, but body is too small
NO QUALITY ENTRY – conditions are not met.
4.ATR-based SL/TP engine:
Internal engine (uses ATR × multiplier or minimal tick distance).
Values are shown on the panel only (no lines drawn on chart), so the chart stays clean.
Panel overview
The panel in the top-right shows:
Action – BUY / SELL / NO TRADE
Status – CONFIRMED / WAIT FOR BETTER ENTRY / NO SIGNAL / MTF conflict
Entry – last confirmed entry price
SL / TP – suggested ATR-based stop-loss and take-profit
Higher TF – higher timeframe filter state (ON/OFF and TF used)
Score – core multi-factor score on the current timeframe
Vol – “Normal volatility” or “Low volatility (ATR penalized)”
Inputs – quick guide
Trend & Filters
EMA Fast / Mid / Slow – EMAs used for trend & bias detection
ADX Length – period for ADX (trend strength)
RSI Length – period for RSI zone filter
ATR Length – ATR used for volatility & body/SL/TP logic
Low ATR threshold (% of price) – defines when the market is considered “low volatility”.
Higher timeframe confirmation
Use higher timeframe filter – enable / disable MTF confirmation
Higher TF – e.g. 240 (4H), 60 (1H), etc.
Entry Precision
Min body size (x ATR) – minimum body vs ATR required for a CONFIRMED entry.
SL / TP
Min SL = ATR x – minimal ATR distance for SL
Min TP = ATR x – minimal ATR distance for TP
Min SL in ticks / Min TP in ticks – hard floor, based on instrument tick size.
Visuals
Show info panel – show / hide the top-right dashboard
Show status badges – textual badges above the last candle
Draw ENTRY/SL/TP (panel only, legacy) – kept for compatibility; does not draw lines in this version.
Alerts
The script provides three alert conditions:
Affirmify: BUY confirmed
Triggered when BUY direction is aligned and entry quality is CONFIRMED (no MTF conflict).
Affirmify: SELL confirmed
Triggered when SELL direction is aligned and entry quality is CONFIRMED (no MTF conflict).
Affirmify: wait for better entry
Direction is valid, but candle body is not yet strong enough – potential setup forming.
You can connect these alerts to your own automation, bots or dashboards.
How to use it (typical workflow)
Select your symbol and timeframe (most users focus on 1H / 4H).
Wait for the panel to show a clear Action (BUY or SELL) with a solid Score (≥ +2 or ≤ −2).
Look for Status = CONFIRMED for actual entries.
Use the panel SL / TP values as a starting point for your own risk management.
Avoid trades when:
Status shows “NO SIGNAL” or “NO CLEAR DIRECTION”
MTF conflict is active
Volatility is extremely low for your style.
Access & subscription
This is an invite-only script connected to the AffirmifyHub ecosystem.
Access is managed via private subscription on AffirmifyHub.com.
After activation you will receive TradingView access to this indicator from the author account.
For questions about access, licensing or private use, please contact the author via TradingView DM or through AffirmifyHub.
Important notice
This tool does not guarantee profits and should never be used as a standalone decision engine.
Always combine it with:
your own price action reading
multi-timeframe context
strict position sizing and risk management.
Markets are risky – never trade money you cannot afford to lose.Multi-factor directional model with entry-quality filter and ATR-based SL/TP levels, synced with the Affirmify core Python engine.

Impulse Reactor RSI-SMA Trend Indicator [ApexLegion]Impulse Reactor RSI-SMA Trend Indicator
Introduction and Theoretical Background
Design Rationale
Standard indicators frequently generate binary 'BUY' or 'SELL' signals without accounting for the broader market context. This often results in erratic "Flip-Flop" behavior, where signals are triggered indiscriminately regardless of the prevailing volatility regime.
Impulse Reactor was engineered to address this limitation by unifying two critical requirements: Quantitative Rigor and Execution Flexibility.
The Solution
Composite Analytical Framework This script is not a simple visual overlay of existing indicators. It is an algorithmic synthesis designed to function as a unified decision-making engine. The primary objective was to implement rigorous quantitative analysis (Volatility Normalization, Structural Filtering) directly within an alert-enabled framework. This architecture is designed to process signals through strict, multi-factor validation protocols before generating real-time notifications, allowing users to focus on structurally validated setups without manual monitoring.
How It Works
This is not a simple visual mashup. It utilizes a cross-validation algorithm where the Trend Structure acts as a gatekeeper for Momentum signals:
Logic over Lag: Unlike simple moving average crossovers, this script uses a 15-layer Gradient Ribbon to detect "Laminar Flow." If the ribbon is knotted (Compression), the system mathematically suppresses all signals.
Volatility Normalization: The core calculation adapts to ATR (Average True Range). This means the indicator automatically expands in volatile markets and contracts in quiet ones, maintaining accuracy without constant manual tweaking.
Adaptive Signal Thresholding: It incorporates an 'Anti-Greed' algorithm (Dynamic Thresholding) that automatically adjusts entry criteria based on trend duration. This logic aims to mitigate the risk of entering positions during periods of statistical trend exhaustion.
Why Use It?
Market State Decoding: The gradient Ribbon visualizes the underlying trend phase in real-time.
◦ Cyan/Blue Flow: Strong Bullish Trend (Laminar Flow).
◦ Magenta/Pink Flow: Strong Bearish Trend.
◦ Compressed/Knotted: When the ribbon lines are tightly squeezed or overlapping, it signals Consolidation. The system filters signals here to avoid chop.
Noise Reduction: The goal is not to catch every pivot, but to isolate high-confidence setups. The logic explicitly filters out minor fluctuations to help maintain position alignment with the broader trend.
⚖️ Chapter 1: System Architecture
Introduction: Composite Analytical Framework
System Overview
Impulse Reactor serves as a comprehensive technical analysis engine designed to synthesize three distinct market dimensions—Momentum, Volatility, and Trend Structure—into a unified decision-making framework. Unlike traditional methods that analyze these metrics in isolation, this system functions as a central processing unit that integrates disparate data streams to construct a coherent model of market behavior.
Operational Objective
The primary objective is to transition from single-dimensional signal generation to a multi-factor assessment model. By fusing data from the Impulse Core (Volatility), Gradient Oscillator (Momentum), and Structural Baseline (Trend), the system aims to filter out stochastic noise and identify high-probability trade setups grounded in quantitative confluence.
Market Microstructure Analysis: Limitations of Conventional Models
Extensive backtesting and quantitative analysis have identified three critical inefficiencies in standard oscillator-based strategies:
• Bounded Oscillator Limitations (The "Oscillation Trap"): Traditional indicators such as RSI or Stochastics are mathematically constrained between fixed values (0 to 100). In strong trending environments, these metrics often saturate in "overbought" or "oversold" zones. Consequently, traders relying on static thresholds frequently exit structurally valid positions prematurely or initiate counter-trend trades against prevailing momentum, resulting in suboptimal performance.
• Quantitative Blindness to Quality: Standard moving averages and trend indicators often fail to distinguish the qualitative nature of price movement. They treat low-volume drift and high-velocity expansion identically. This inability to account for "Volatility Quality" leads to delayed responsiveness during critical market events.
• Fractal Dissonance (Timeframe Disconnect): Financial markets exhibit fractal characteristics where trends on lower timeframes may contradict higher timeframe structures. Manual integration of multi-timeframe analysis increases cognitive load and susceptibility to human error, often resulting in conflicting biases at the point of execution.
Core Design Principles
To mitigate the aforementioned systemic inefficiencies, Impulse Reactor employs a modular architecture governed by three foundational principles:
Principle A:
Volatility Precursor Analysis Market mechanics demonstrate that volatility expansion often functions as a leading indicator for directional price movement. The system is engineered to detect "Volatility Deviation" — specifically, the divergence between short-term and long-term volatility baselines—prior to its manifestation in price action. This allows for entry timing aligned with the expansion phase of market volatility.
Principle B:
Momentum Density Visualization The system replaces singular momentum lines with a "Momentum Density" model utilizing a 15-layer Simple Moving Average (SMA) Ribbon.
• Concept: This visualization represents the aggregate strength and consistency of the trend.
• Application: A fully aligned and expanded ribbon indicates a robust trend structure ("Laminar Flow") capable of withstanding minor counter-trend noise, whereas a compressed ribbon signals consolidation or structural weakness.
Principle C:
Adaptive Confluence Protocols Signal validity is strictly governed by a multi-dimensional confluence logic. The system suppresses signal generation unless there is synchronized confirmation across all three analytical vectors:
1. Volatility: Confirmed expansion via the Impulse Core.
2. Momentum: Directional alignment via the Hybrid Oscillator.
3. Structure: Trend validation via the Baseline. This strict filtering mechanism significantly reduces false positives in non-trending (choppy) environments while maintaining sensitivity to genuine breakouts.
🔍 Chapter 2: Core Modules & Algorithmic Logic
Module A: Impulse Core (Normalized Volatility Deviation)
Operational Logic The Impulse Core functions as a volatility-normalized momentum gauge rather than a standard oscillator. It is designed to identify "Volatility Contraction" (Squeeze) and "Volatility Expansion" phases by quantifying the divergence between short-term and long-term volatility states.
Volatility Z-Score Normalization
The formula implements a custom normalization algorithm. Unlike standard oscillators that rely on absolute price changes, this logic calculates the Z-Score of the Volatility Spread.
◦ Numerator: (atr_f - atr_s) captures the raw momentum of volatility expansion.
◦ Denominator: (std_f + 1e-6) standardizes this value against historical variance.
◦ Result: This allows the indicator scales consistently across assets (e.g., Bitcoin vs. Euro) without manual recalibration.
f_impulse() =>
atr_f = ta.atr(fastLen) // Fast Volatility Baseline
atr_s = ta.atr(slowLen) // Slow Volatility Baseline
std_f = ta.stdev(atr_f, devLen) // Volatility Standard Deviation
(atr_f - atr_s) / (std_f + 1e-6) // Normalized Differential Calculation
Algorithmic Framework
• Differential Calculation: The system computes the spread between a Fast Volatility Baseline (ATR-10) and a Slow Volatility Baseline (ATR-30).
• Normalization Protocol: To standardize consistency across diverse asset classes (e.g., Forex vs. Crypto), the raw differential is divided by the standard deviation of the volatility itself over a 30-period lookback.
• Signal Generation:
◦ Contraction (Squeeze): When the Fast ATR compresses below the Slow ATR, it registers a potential volatility buildup phase.
◦ Expansion (Release): A rapid divergence of the Fast ATR above the Slow ATR signals a confirmed volatility expansion, validating the strength of the move.
Module B: Gradient Oscillator (RSI-SMA Hybrid)
Design Rationale To mitigate the "noise" and "false reversal" signals common in single-line oscillators (like standard RSI), this module utilizes a 15-Layer Gradient Ribbon to visualize momentum density and persistence.
Technical Architecture
• Ribbon Array: The system generates 15 sequential Simple Moving Averages (SMA) applied to a volatility-adjusted RSI source. The length of each layer increases incrementally.
• State Analysis:
Momentum Alignment (Laminar Flow): When all 15 layers are expanded and parallel, it indicates a robust trend where buying/selling pressure is distributed evenly across multiple timeframes. This state helps filter out premature "overbought/oversold" signals.
• Consolidation (Compression): When the distance between the fastest layer (Layer 1) and the slowest layer (Layer 15) approaches zero or the layers intersect, the system identifies a "Non-Tradable Zone," preventing entries during choppy market conditions.
// Laminar Flow Validation
f_validate_trend() =>
// Calculate spread between Ribbon layers
ribbon_spread = ta.stdev(ribbon_array, 15)
// Only allow signals if Ribbon is expanded (Laminar Flow)
is_flowing = ribbon_spread > min_expansion_threshold
// If compressed (Knotted), force signal to false
is_flowing ? signal : na
Module C: Adaptive Signal Filtering (Behavioral Bias Mitigation)
This subsystem, operating as an algorithmic "Anti-Greed" Mechanism, addresses the statistical tendency for signal degradation following prolonged trends.
Dynamic Threshold Adjustment
• Win Streak Detection: The algorithm internally tracks the outcome of closed trade cycles.
• Sensitivity Multiplier: Upon detecting consecutive successful signals in the same direction, a Penalty_Factor is applied to the entry logic.
• Operational Impact: This effectively raises the Required_Slope threshold for subsequent signals. For example, after three consecutive bullish signals, the system requires a 30% steeper trend angle to validate a fourth entry. This enforces stricter discipline during extended trends to reduce the probability of entering at the point of trend exhaustion.
Anti-Greed Logic: Dynamic Threshold Calculation
f_adjust_threshold(base_slope, win_streak) =>
// Adds a 10% penalty to the difficulty for every consecutive win
penalty_factor = 0.10
risk_scaler = 1 + (win_streak * penalty_factor)
// Returns the new, harder-to-reach threshold
base_slope * risk_scaler
Module D: Trend Baseline (Triple-Smoothed Structure)
The Trend Baseline serves as the structural filter for all signals. It employs a Triple-Smoothed Hybrid Algorithm designed to balance lag reduction with noise filtration.
Smoothing Stages
1. Volatility Banding: Utilizes a SuperTrend-based calculation to establish the upper and lower boundaries of price action.
2. Weighted Filter: Applies a Weighted Moving Average (WMA) to prioritize recent price data.
3. Exponential Smoothing: A final Exponential Moving Average (EMA) pass is applied to create a seamless baseline curve.
Functionality
This "Heavy" baseline resists minor intraday volatility spikes while remaining responsive to sustained structural shifts. A signal is only considered valid if the price action maintains structural integrity relative to this baseline
🚦 Chapter 3: Risk Management & Exit Protocols
Quantitative Risk Management (TP/SL & Trailing)
Foundational Architecture: Volatility-Adjusted Geometry Unlike strategies relying on static nominal values, Impulse Reactor establishes dynamic risk boundaries derived from quantitative volatility metrics. This design aligns trade invalidation levels mathematically with the current market regime.
• ATR-Based Dynamic Bracketing:
The protocol calculates Stop-Loss and Take-Profit levels by applying Fibonacci coefficients (Default: 0.786 for SL / 1.618 for TP) to the Average True Range (ATR).
◦ High Volatility Environments: The risk bands automatically expand to accommodate wider variance, preventing premature exits caused by standard market noise.
◦ Low Volatility Environments: The bands contract to tighten risk parameters, thereby dynamically adjusting the Risk-to-Reward (R:R) geometry.
• Close-Validation Protocol ("Soft Stop"):
Institutional algorithms frequently execute liquidity sweeps—driving prices briefly below key support levels to accumulate inventory.
◦ Mechanism: When the "Soft Stop" feature is enabled, the system filters out intraday volatility spikes. The stop-loss is conditional; execution is triggered only if the candle closes beyond the invalidation threshold.
◦ Strategic Advantage: This logic distinguishes between momentary price wicks and genuine structural breakdowns, preserving positions during transient volatility.
• Step-Function Trailing Mechanism:
To protect unrealized PnL while allowing for normal price breathing, a two-phase trailing methodology is employed:
◦ Phase 1 (Activation): The trailing function remains dormant until the price advances by a pre-defined percentage threshold.
◦ Phase 2 (Dynamic Floor): Once armed, the stop level creates a moving floor, adjusting relative to price action while maintaining a volatility-based (ATR) buffer to systematically protect unrealized PnL.
• Algorithmic Exit Protocols (Dynamic Liquidity Analysis)
◦ Rationale: Inefficiencies of Static Targets Static "Take Profit" levels often result in suboptimal exits. They compel traders to close positions based on arbitrary figures rather than evolving market structure, potentially capping upside during significant trends or retaining positions while the underlying trend structure deteriorates.
◦ Solution: Structural Integrity Assessment The system utilizes a Dynamic Liquidity Engine to continuously audit the validity of the position. Instead of targeting a specific price point, the algorithm evaluates whether the trend remains statistically robust.
Multi-Factor Exit Logic (The Tri-Vector System)
The Smart Exit protocol executes only when specific algorithmic invalidation criteria are met:
• 1. Momentum Exhaustion (Confluence Decay): The system monitors a 168-hour rolling average of the Confluence Score. A significant deviation below this historical baseline indicates momentum exhaustion, signaling that the driving force behind the trend has dissipated prior to a price reversal. This enables preemptive exits before a potential drawdown.
• 2. Statistical Over-Extension (Mean Reversion): Utilizing the core volatility logic, the system identifies instances where price deviates beyond 2.0 standard deviations from the mean. While the trend may be technically bullish, this statistical anomaly suggests a high probability of mean reversion (elastic snap-back), triggering a defensive exit to capitalize on peak valuation.
• 3. Oscillator Rejection (Immediate Pivot): To manage sudden V-shaped volatility, the system monitors RSI pivots. If a sharp "Pivot High" or divergence is detected, the protocol triggers an immediate "Peak Exit," bypassing standard trend filters to secure liquidity during high-velocity reversals.
🎨 Chapter 4: Visualization Guide
Gradient Oscillator Ribbon
The 15-layer SMA ribbon visualized via plot(r1...r15) represents the "Momentum Density" of the market.
• Visuals:
◦ Cyan/Blue Ribbon: Indicates Bullish Momentum.
◦ Pink/Magenta Ribbon: Indicates Bearish Momentum.
• Interpretation:
◦ Laminar Flow: When the ribbon expands widely and flows in parallel, it signifies a robust trend where momentum is distributed evenly across timeframes. This is the ideal state for trend-following.
◦ Compression (Consolidation): If the ribbon becomes narrow, twisted, or knotted, it indicates a "Non-Tradable Zone" where the market lacks a unified direction. Traders are advised to wait for clarity.
◦ Over-Extension: If the top layer crosses the Overbought (85) or Oversold (15) lines, it visually warns of potential market overheating.
Trend Baseline
The thick, color-changing line plotted via plot(baseline) represents the Structural Backbone of the market.
• Visuals: Changes color based on the trend direction (Blue for Bullish, Pink for Bearish).
• Interpretation:
Structural Filter: Long positions are statistically favored only when price action sustains above this baseline, while short positions are favored below it.
Dynamic Support/Resistance: The baseline acts as a dynamic support level during uptrends and resistance during downtrends.
Entry Signals & Labels
Text labels ("Long Entry", "Short Entry") appear when the system detects high-probability setups grounded in quantitative confluence.
• Visuals: Labeled signals appear above/below specific candles.
• Interpretation:
These signals represent moments where Volatility (Expansion), Momentum (Alignment), and Structure (Trend) are synchronized.
Smart Exit: Labels such as "Smart Exit" or "Peak Exit" appear when the system detects momentum exhaustion or structural decay, prompting a defensive exit to preserve capital.
Dynamic TP/SL Boxes
The semi-transparent colored zones drawn via fill() represent the risk management geometry.
• Visuals: Colored boxes extending from the entry point to the Take Profit (TP) and Stop Loss (SL) levels.
• Function:
Volatility-Adjusted Geometry: Unlike static price targets, these boxes expand during high volatility (to prevent wicks from stopping you out) and contract during low volatility (to optimize Risk-to-Reward ratios).
SAR + MACD Glow
Small glowing shapes appearing above or below candles.
• Visuals: Triangle or circle glows near the price bars.
• Interpretation:
This visual indicates a secondary confirmation where Parabolic SAR and MACD align with the main trend direction. It serves as an additional confluence factor to increase confidence in the trade setup.
Support/Resistance Table
A small table located at the bottom-right of the chart.
• Function: Automatically identifies and displays recent Pivot Highs (Resistance) and Pivot Lows (Support).
• Interpretation: These levels can be used as potential targets for Take Profit or invalidation points for manual Stop Loss adjustments.
🖥️ Chapter 5: Dashboard & Operational Guide
Integrated Analytics Panel (Dashboard Overview)
To facilitate rapid decision-making without manual calculation, the system aggregates critical market dimensions into a unified "Heads-Up Display" (HUD). This panel monitors real-time metrics across multiple timeframes and analytical vectors.
A. Intermediate Structure (12H Trend)
• Function: Anchors the intraday analysis to the broader market structure using a 12-hour rolling window.
• Interpretation:
◦ Bullish (> +0.5%): Indicates a positive structural bias. Long setups align with the macro flow.
◦ Bearish (< -0.5%): Indicates structural weakness. Short setups are statistically favored.
◦ Neutral: Represents a ranging environment where the Confluence Score becomes the primary weighting factor.
B. Composite Confluence Score (Signal Confidence)
• Definition: A probability metric derived from the synchronization of Volatility (Impulse Core), Momentum (Ribbon), and Trend (Baseline).
• Grading Scale:
Strong Buy/Sell (> 7.0 / < 3.0): Indicates full alignment across all three vectors. Represents a "Prime Setup" eligible for standard position sizing.
Buy/Sell (5.0–7.0 / 3.0–5.0): Indicates a valid trend but with moderate volatility confirmation.
Neutral: Signals conflicting data (e.g., Bullish Momentum vs. Bearish Structure). Trading is not recommended ("No-Trade Zone").
C. Statistical Deviation Status (Mean Reversion)
• Logic: Utilizes Bollinger Band deviation principles to quantify how far price has stretched from the statistical mean (20 SMA).
• Alert States:
Over-Extended (> 2.0 SD): Warning that price is statistically likely to revert to the mean (Elastic Snap-back), even if the trend remains technically valid. New entries are discouraged in this zone.
Normal: Price is within standard distribution limits, suitable for trend-following entries.
D. Volatility Regime Classification
• Metric: Compares current ATR against a 100-period historical baseline to categorize the market state.
• Regimes:
Low Volatility (Lvl < 1.0): Market Compression. Often precedes volatility expansion events.
Mid Volatility (Lvl 1.0 - 1.5): Standard operating environment.
High Volatility (Lvl > 1.5): Elevated market stress. Risk parameters should be adjusted (e.g., reduced position size) to account for increased variance.
E. Performance Telemetry
• Function: Displays the historical reliability of the Trend Baseline for the current asset and timeframe.
• Operational Threshold: If the displayed Win Rate falls below 40%, it suggests the current market behavior is incoherent (choppy) and does not respect trend logic. In such cases, switching assets or timeframes is recommended.
Operational Protocols & Signal Decoding
Visual Interpretation Standards
• Laminar Flow (Trade Confirmation): A valid trend is visually confirmed when the 15-layer SMA Ribbon is fully expanded and parallel. This indicates distributed momentum across timeframes.
• Consolidation (No-Trade): If the ribbon appears twisted, knotted, or compressed, the market lacks a unified directional vector.
• Baseline Interaction: The Triple-Smoothed Baseline acts as a dynamic support/resistance filter. Long positions remain valid only while price sustains above this structure.
System Calibration (Settings)
• Adaptive Signal Filtering (Prev. Anti-Greed): Enabled by default. This logic automatically raises the required trend slope threshold following consecutive wins to mitigate behavioral bias.
• Impulse Sensitivity: Controls the reactivity of the Volatility Core. Higher settings capture faster moves but may introduce more noise.
⚙️ Chapter 6: System Configuration & Alert Guide
This section provides a complete breakdown of every adjustable setting within Impulse Reactor to assist you in tailoring the engine to your specific needs.
🌐 LANGUAGE SETTINGS (Localization)
◦ Select Language (Default: English):
Function: Instantly translates all chart labels, dashboard texts into your preferred language.
Supported: English, Korean, Chinese, Spanish
⚡ IMPULSE CORE SETTINGS (Volatility Engine)
◦ Deviation Lookback (Default: 30): The period used to calculate the standard deviation of volatility.
Role: Sets the baseline for normalizing momentum. Higher values make the core smoother but slower to react.
◦ Fast Pulse Length (Default: 10): The short-term ATR period.
Role: Detects rapid volatility expansion.
◦ Slow Pulse Length (Default: 30): The long-term ATR baseline.
Role: Establishes the background volatility level. The core signal is derived from the divergence between Fast and Slow pulses.
🎯 TP/SL SETTINGS (Risk Management)
◦ SL/TP Fibonacci (Default: 0.786 / 1.618): Selects the Fibonacci ratio used for risk calculation.
◦ SL/TP Multiplier (Default: 1.5 / 2): Applies a multiplier to the ATR-based bands.
Role: Expands or contracts the Take Profit and Stop Loss boxes. Increase these values for higher volatility assets (like Altcoins) to avoid premature stop-outs.
◦ ATR Length (Default: 14): The lookback period for calculating the Average True Range used in risk geometry.
◦ Use Soft Stop (Close Basis):
Role: If enabled, Stop Loss alerts only trigger if a candle closes beyond the invalidation level. This prevents being stopped out by wick manipulations.
🔊 RIBBON SETTINGS (Momentum Visualization)
◦ Show SMA Ribbon: Toggles the visibility of the 15-layer gradient ribbon.
◦ Ribbon Line Count (Default: 15): The number of SMA lines in the ribbon array.
◦ Ribbon Start Length (Default: 2) & Step (Default: 1): Defines the spread of the ribbon.
Role: Controls the "thickness" of the momentum density visualization. A wider step creates a broader ribbon, useful for higher timeframes.
📎 DISPLAY OPTIONS
◦ Show Entry Lines / TP/SL Box / Position Labels / S/R Levels / Dashboard: Toggles individual visual elements on the chart to reduce clutter.
◦ Show SAR+MACD Glow: Enables the secondary confirmation shapes (triangles/circles) above/below candles.
📈 TREND BASELINE (Structural Filter)
◦ Supertrend Factor (Default: 12) & ATR Period (Default: 90): Controls the sensitivity of the underlying Supertrend algorithm used for the baseline calculation.
◦ WMA Length (40) & EMA Length (14): The smoothing periods for the Triple-Smoothed Baseline.
◦ Min Trend Duration (Default: 10): The minimum number of bars the trend must be established before a signal is considered valid.
🧠 SMART EXIT (Dynamic Liquidity)
◦ Use Smart Exit: Enables the momentum exhaustion logic.
◦ Exit Threshold Score (Default: 3): The sensitivity level for triggering a Smart Exit. Lower values trigger earlier exits.
◦ Average Period (168) & Min Hold Bars (5): Defines the rolling window for momentum decay analysis and the minimum duration a trade must be held before Smart Exit logic activates.
🛡️ TRAILING STOP (Step)
◦ Use Trailing Stop: Activates the step-function trailing mechanism.
◦ Step 1 Activation % (0.5) & Offset % (0.5): The price must move 0.5% in your favor to arm the first trail level, which sets a stop 0.5% behind price.
◦ Step 2 Activation % (1) & Offset % (0.2): Once price moves 1%, the trail tightens to 0.2%, securing the position.
🌀 SAR & MACD SETTINGS (Secondary Confirmation)
◦ SAR Start/Increment/Max: Standard Parabolic SAR parameters.
◦ SAR Score Scaling (ATR): Adjusts how much weight the SAR signal has in the overall confluence score.
◦ MACD Fast/Slow/Signal: Standard MACD parameters used for the "Glow" signals.
🔄 ANTI-GREED LOGIC (Behavioral Bias)
◦ Strict Entry after Win: Enables the negative feedback loop.
◦ Strict Multiplier (Default: 1.1): Increases the entry difficulty by 10% after each win.
Role: Prevents overtrading and entering at the top of an extended trend.
🌍 HTF FILTER (Multi-Timeframe)
◦ Use Auto-Adaptive HTF Filter: Automatically selects a higher timeframe (e.g., 1H -> 4H) to filter signals.
◦ Bypass HTF on Steep Trigger: Allows an entry even against the HTF trend if the local momentum slope is exceptionally steep (catch powerful reversals).
📉 RSI PEAK & CHOPPINESS
◦ RSI Peak Exit (Instant): Triggers an immediate exit if a sharp RSI pivot (V-shape) is detected.
◦ Choppiness Filter: Suppresses signals if the Choppiness Index is above the threshold (Default: 60), indicating a flat market.
📐 SLOPE TRIGGER LOGIC
◦ Force Entry on Steep Slope: Overrides other filters if the price angle is extremely vertical (high velocity).
◦ Slope Sensitivity (1.5): The angle required to trigger this override.
⛔ FLAT MARKET FILTER (ADX & ATR)
◦ Use ADX Filter: Blocks signals if ADX is below the threshold (Default: 20), indicating no trend.
◦ Use ATR Flat Filter: Blocks signals if volatility drops below a critical level (dead market).
🔔 Alert Configuration Guide
Impulse Reactor is designed with a comprehensive suite of alert conditions, allowing you to automate your trading or receive real-time notifications for specific market events.
How to Set Up:
Click the "Alert" (Clock) icon in the TradingView toolbar.
Select "Impulse Reactor " from the Condition dropdown.
Choose one of the specific trigger conditions below:
🚀 Entry Signals (Trend Initiation)
Long Entry:
Trigger: Fires when a confirmed Bullish Setup is detected (Momentum + Volatility + Structure align).
Usage: Use this to enter new Long positions.
Short Entry:
Trigger: Fires when a confirmed Bearish Setup is detected.
Usage: Use this to enter new Short positions.
🎯 Profit Taking (Target Levels)
Long TP:
Trigger: Fires when price hits the calculated Take Profit level for a Long trade.
Usage: Automate partial or full profit taking.
Short TP:
Trigger: Fires when price hits the calculated Take Profit level for a Short trade.
Usage: Automate partial or full profit taking.
🛡️ Defensive Exits (Risk Management)
Smart Exit:
Trigger: Fires when the system detects momentum decay or statistical exhaustion (even if the trend hasn't fully reversed).
Usage: Recommended for tightening stops or closing positions early to preserve gains.
Overbought / Oversold:
Trigger: Fires when the ribbon extends into extreme zones.
Usage: Warning signal to prepare for a potential reversal or pullback.
💡 Secondary Confirmation (Confluence)
SAR+MACD Bullish:
Trigger: Fires when Parabolic SAR and MACD align bullishly with the main trend.
Usage: Ideal for Pyramiding (adding to an existing winning position).
SAR+MACD Bearish:
Trigger: Fires when Parabolic SAR and MACD align bearishly.
Usage: Ideal for adding to short positions.
⚠️ Chapter 7: Conclusion & Risk Disclosure
Methodological Synthesis
Impulse Reactor represents a shift from reactive price tracking to proactive energy analysis. By decomposing market activity into its atomic components — Volatility, Momentum, and Structure — and reconstructing them into a coherent decision model, the system aims to provide a quantitative framework for market engagement. It is designed not to predict the future, but to identify high-probability conditions where kinetic energy and trend structure align.
Disclaimer & Risk Warnings
◦ Educational Purpose Only
This indicator, including all associated code, documentation, and visual outputs, is provided strictly for educational and informational purposes. It does not constitute financial advice, investment recommendations, or a solicitation to buy or sell any financial instruments.
◦ No Guarantee of Performance
Past performance is not indicative of future results. All metrics displayed on the dashboard (including "Win Rate" and "P&L") are theoretical calculations based on historical data. These figures do not account for real-world trading factors such as slippage, liquidity gaps, spread costs, or broker commissions.
◦ High-Risk Warning
Trading cryptocurrencies, futures, and leveraged financial products involves a substantial risk of loss. The use of leverage can amplify both gains and losses. Users acknowledge that they are solely responsible for their trading decisions and should conduct independent due diligence before executing any trades.
◦ Software Limitations
The software is provided "as is" without warranty. Users should be aware that market data feeds on analysis platforms may experience latency or outages, which can affect signal generation accuracy.

FCPO MASTER v6 – Sideway + Breakout + OB + FVG (TUPLE SAFE)TL;DR cepat
1. Gunakan M5 untuk entry & OB/FVG confirmation.
2. Gunakan M15 untuk confirm trend/false breakout.
3. Gunakan H1 untuk bias arah (overall market).
4. Entry hanya bila signal + OB/FVG/candle rejection (script buatkan).
5. SL 5–8 tick, TP 10–25 tick ikut setup (sideway vs breakout).
6. Follow checklist setiap trade — jangan lompat.
________________________________________
Setup awal (1–2 min)
1. Pasang script FCPO Sideway MASTER – OB + Imbalance + Confirmation di TradingView.
2. Timeframes: buka M5, M15, H1 (susun 3 chart atau 1 chart multi-timeframe).
3. Input default: ATR14, Breakout Buffer 5 tick, RangeLen 20, ADX14, TP12, SL8. (Kau boleh tweak nanti).
4. Aktifkan alerts pada BUY Confirm / SELL Confirm / Sideway Buy / Sideway Sell.
________________________________________
Step-by-step trading process
1) Mulakan dengan H1 — tentukan bias HTF
• Lihat H1 untuk jawapan: Trend Up / Down / Sideway.
• Rule ringkas:
o ADX H1 > 20 + price above H1 EMA → bias Bull
o ADX H1 > 20 + price below H1 EMA → bias Bear
o ADX H1 < 20 → market HTF sideway (no strong bias)
Kenapa: H1 bagi kau idea “kalau breakout pada M5, patut follow atau tolak”.
________________________________________
2) Pergi ke M15 — confirm trend & valid breakout
• M15 kena setuju dengan idea breakout.
o Untuk strong breakout: M15 kena tunjuk candle close di atas/bawah range + volume naik.
o Kalau M5 breakout tapi M15 tak setuju (M15 masih sideway) → treat as fakeout. Jangan masuk.
________________________________________
3) M5 — cari entry & confirmation (OB/FVG + candle)
• M5 adalah tempat kau buat keputusan masuk.
• Tunggu script keluarkan Sideway Buy/Sell atau Breakout Buy/Sell.
• CONFIRM entry mesti ada sekurang-kurangnya 1 dari:
o Bull/Bear Order Block searah signal (script detect).
o FVG / Imbalance zone dipenuhi & price retest.
o Candle rejection (pinbar / bearish/bullish engulfing) pada zone.
Jika tiada confirmation → no trade.
________________________________________
4) Checklist sebelum tekan Buy/Sell (MUST)
• H1 bias tidak melawan trade (prefer sama arah).
• M15 confirm breakout / trend or neutral.
• Script keluarkan signal (sideway or breakout).
• OB or FVG atau candle rejection ada.
• ATR kenaikan jika breakout (untuk breakout trade).
• Volume spike jika breakout.
• Risk:SL <= 2% akaun (position sizing).
Kalau semua ticked → boleh entry.
________________________________________
5) Setting SL / TP & position sizing
• Sideway (scalp): SL = 5–8 tick, TP = 8–12 tick.
• Breakout (trend): SL = 8–12 tick, TP = 15–25+ tick (trail later).
• Position sizing: Risk per trade 1–2%.
o Lot size = (Account Risk RM × 1 tick value) / (SL ticks × tickValue) — (kalau kau gunakan fixed tick value, adjust ikut lot).
(Script tunjuk SL & TP label — follow itu.)
________________________________________
6) Entry types
• A. Sideway Reversal (M5)
o Signal: Sideway Buy / Sideway Sell
o Confirm: OB/FVG or rejection candle at range bottom/top
o Trade: scalp target 8–12 tick, tight SL 5–8 tick
• B. Breakout (M5 entry, M15 confirm)
o Signal: Breakout Buy/Sell (Strong)
o Confirm: ATR expanding + volume spike + M15 alignment
o Trade: trend follow, TP 15–25 tick, trailing stop active
• C. Retest Entry
o Breakout happens, price returns to retest range / OB / FVG → wait for rejection candle then enter. Safer.
________________________________________
7) Trailing & exit rules
• Jika useTrail = true script plots trailing stop (ATR × multiplier).
• Exit rules:
1. Hit TP → close.
2. Hit SL → close.
3. If trailing stop hit → close.
4. If opposing confirmed signal muncul (e.g., SELL confirm while long) → consider close early.
5. If H1 bias flips strongly vs trade → tighten stop or close.
________________________________________
8) Multiple signals & scaling
• Never add to losing position (no averaging down).
• If want scale-in on confirmed trend: add 1 partial size after price moves +10–12 tick in favor and shows continuation candle + no bearish OB/FVG.
• Keep aggregated risk within your max (2–3%).
________________________________________
9) Example trade walkthrough (concrete)
• RangeHigh = 4065, RangeLow = 4035 (contoh).
• Market sideway M5.
Case A — Sideway Sell:
1. Price touches 4064–4065, script shows sidewaySell.
2. Lihat OB: ada bear OB zone di 4062–4066 → confirm.
3. Candle rejection (bearish pinbar) muncul → enter SELL M5.
4. Set SL = 5 tick above rangeHigh = 4070, TP = 10 tick → 4055.
5. Trail jika price turun > 8 tick: aktifkan trailing.
6. Close at TP or trail/SL.
Case B — Breakout Buy:
1. Price closes above 4065 + 5 tick buffer = 4070 on M5. Script shows trueBreakUp.
2. M15 shows candle close above M15 resistance + volume spike → confirm.
3. Enter BUY, SL = 8 tick below entry, TP initial 20 tick, trail with ATR×1.5.
4. Move stop to breakeven after +10 tick, scale out half at +12 tick, leave rest to trail.
________________________________________
10) Journal & review
• Semua trade: record entry time, TF, reason (which confirmations), SL/TP, result, lesson.
• Weekly review: check which confirmation worked best (OB vs FVG vs candle) and tweak settings.
________________________________________
11) Tweaks / optimisations cepat
• Jika terlalu banyak false sideway signals → kurangkan touchDist ke 2 tick.
• Kalau fakeout breakout banyak → tambah tickBuf ke 6–8.
• Nak lebih konservatif → cuma trade breakout yang juga setuju M15.
________________________________________
12) Alerts & execution (practical)
• Pasang alert pada BUY Confirm / SELL Confirm (script).
• Kalau kau guna broker yang support one-click order, siap sediakan template order (SL/TP default).
• Kalau manual, bila alert masuk: buka M5, cepat confirm OB/FVG & candle rejection → entry.
________________________________________
Quick reference table (handy)
• TF utama entry: M5
• Confirm mid-TF: M15
• Bias HTF: H1
• Sideway SL/TP: SL 5–8, TP 8–12
• Breakout SL/TP: SL 8–12, TP 15–25+
• Mandatory confirmation: (Script signal) + (OB or FVG or candle)

DarkPool FlowDarkPool Flow is a professional-grade technical analysis tool designed to align retail traders with the dominant "smart money" flow. Unlike standard moving average crossovers that often generate false signals during consolidation, this script employs a multi-layered filtering engine to isolate high-probability trends.
The core philosophy of this indicator is that Trends are fractal. A sustainable move on a lower timeframe must be supported by momentum on a higher timeframe. By comparing a "Fast Signal Trend" against a "Slow Anchor Trend" (e.g., Daily vs. Weekly), the script identifies the market bias used by institutional algorithms.
This edition features a Smart Recovery Engine, ensuring that valid trends are not missed simply because momentum started slowly, and a Dynamic Cloud that visually represents the strength of the trend spread.
Key Features
1. Auto-Adaptive Timeframe Logic
The script eliminates the guesswork of Multi-Timeframe (MTF) selection. By enabling "Auto-Adapt," the indicator detects your current chart timeframe and automatically maps it to the mathematically correct institutional pairings:
Scalping (<15m): Uses 15-Minute Trend vs. 1-Hour Anchor.
Day Trading (15m - 1H): Uses 4-Hour Trend vs. Daily Anchor.
Swing Trading (4H - Daily): Uses Daily Trend vs. Weekly Anchor (The classic "Golden" setup).
Investing (Weekly): Uses 21-Week EMA vs. 50-Week SMA (Bull Market Support Band logic).
2. Smart Recovery Signal Engine
Standard crossover scripts often miss major moves if the specific breakout candle has low volume or weak ADX. This script utilizes a state-machine logic that "remembers" the trend direction. If a trend begins during low volatility (gray candles), the script waits. The moment volatility and momentum confirm the move, a Smart Recovery Signal is triggered, allowing you to enter an existing trend safely.
3. Chop Protection (Gray Candles)
Preservation of capital is the priority. The script analyzes the Average Directional Index (ADX) and Volatility (ATR).
Colored Candles (Green/Red): The market is trending with sufficient strength. Trading is permitted.
Gray Candles: The market is in a low-energy chop or consolidation (ADX < 20). Trading is discouraged.
4. Dynamic Trend Cloud
The space between the Fast and Slow trends is filled with a dynamic cloud.
Darker/Opaque Cloud: Indicates a widening spread, suggesting accelerating momentum.
Lighter/Transparent Cloud: Indicates a narrowing spread, suggesting the trend may be weakening or consolidating.
5. Pullback & Retest Signals (+)
While triangles mark the start of a trend, the Plus (+) signs mark low-risk opportunities to add to a position. These appear when price dips into the cloud, finds support at the "Fair Value" zone, and closes back in the direction of the trend with confirmed momentum.
User Guide & Strategy
Setup
Add the indicator to your chart.
For Beginners: Enable "Auto-Adaptive Timeframes" in the settings.
For Advanced Users: Disable Auto-Adapt and manually configure your Fast/Slow pairings (Default is Daily 50 EMA / Weekly 50 EMA).
Signal Mode: Choose "First Breakout Only" for a cleaner chart, or "All Signals" if you wish to see re-entry points during choppy starts.
Long Entry Criteria (Buy)
Trend: The Cloud must be Green (Fast Trend > Slow Trend).
Signal: A Green Triangle appears below the bar.
Confirmation: The signal candle must not be Gray.
Re-Entry: A small Green (+) sign appears, indicating a successful test of the cloud support.
Short Entry Criteria (Sell)
Trend: The Cloud must be Red (Fast Trend < Slow Trend).
Signal: A Red Triangle appears above the bar.
Confirmation: The signal candle must not be Gray.
Re-Entry: A small Red (+) sign appears, indicating a successful test of the cloud resistance.
Stop Loss & Risk Management
Stop Loss: A standard institutional stop loss is placed just beyond the Slow Trend Line (the outer edge of the cloud). If price closes beyond the Slow Trend, the macro thesis is invalid.
Take Profit: Target liquidity pools or use a trailing stop based on the Fast Trend line.
Settings Overview
Mode Selection: Toggle between Auto-Adaptive logic or Manual control.
Manual Configuration: Define the specific Timeframe, Length, and Type (EMA, SMA, WMA) for both Fast and Slow trends.
Signal Logic: Toggle "Show Pullback Signals" on/off. Switch between "First Breakout" or "All Signals."
Quality Filters: Toggle individual filters (ATR, RSI, ADX) to adjust sensitivity. Turning these off makes the script more responsive but increases false signals.
Visual Style: Customize colors for Bullish, Bearish, and Neutral (Gray) states. Adjust cloud transparency.
Disclaimer
Risk Warning: Trading financial markets involves a high degree of risk and is not suitable for all investors. You could lose some or all of your initial investment.
Educational Use Only: This script and the information provided herein are for educational and informational purposes only. They do not constitute financial advice, investment advice, trading advice, or any other recommendation.
No Guarantee: Past performance of any trading system or methodology is not necessarily indicative of future results. The "Institutional Trend" indicator is a tool to assist in technical analysis, not a crystal ball. The creators of this script assume no responsibility or liability for any trading losses or damages incurred as a result of using this tool. Always perform your own due diligence and consult with a qualified financial advisor before making investment decisions.

Market Regime & Bias Assistant [Prototype v1.1]
Market Regime & Bias Assistant
### **Overview**
The **Market Regime & Bias Assistant** is an all-in-one trend filtration and trading system designed to keep traders on the right side of the market. Instead of relying on a single moving average, this indicator combines **ADX (Trend Strength)**, **Multi-Timeframe EMAs**, **RSI**, and **Volume Spread Analysis (VSA)** concepts to generate a quantitative "Confidence Score" for the current market bias.
It automatically adapts its settings based on your timeframe (Intraday vs. Swing) and provides clear visual cues via background shading, candle coloring, and a data panel.
---
### **Key Features**
* **Auto-Adaptive Modes:** Automatically switches between "Intraday" and "Swing" settings based on your timeframe.
* *Intraday:* Uses faster EMAs (Aggressive 9/30 or Conservative 20/50) and VWAP.
* *Swing:* Uses standard 20/50 EMAs with 200/800 long-term context moving averages.
* **Market Regime Detection:** Identifies if the market is in a **Trend (Bull/Bear)** or a **Range (Neutral)** using a combination of ADX thresholds and EMA alignment.
* **Confidence Scoring (0-100):** A proprietary algorithm that scores the quality of the trend based on RSI alignment, Volume confirmation, and Long-term EMA context.
* **Vector Volume Candles:** Color-coded candles to highlight institutional activity (High Volume) vs. Climactic Volume (Exhaustion).
* **Pullback Signals:** "L" and "S" markers indicating high-probability entries after a pullback into the EMA value zone.
* **Data Dashboard:** A bottom-right panel displaying the current Mode, Regime, Bias, and quantitative Confidence Score.
---
### **How to Read the Visuals**
#### **1. Background Colors (The Regime)**
* **Green Background:** Confirmed **Bullish Trend**. Only look for Longs.
* **Red Background:** Confirmed **Bearish Trend**. Only look for Shorts.
* **Gray Background:** **Neutral / Range**. The market is chopping or consolidating. Stand aside or trade strictly mean-reversion.
#### **2. Candle Colors (Vector Volume)**
* **Green/Red Borders:** Normal volume.
* **Blue / Fuchsia:** **High Volume (1.2x Average)**. Indicates institutional interest or a breakout.
* **Lime / Bright Red:** **Climactic Volume (1.8x Average)**. Indicates potential exhaustion or a stopping volume event.
#### **3. The EMAs**
* **Fast/Slow Lines:** Show the immediate trend direction.
* **Gray/White Lines:** The 200 and 800 EMAs. These act as major support/resistance levels and define the "Big Picture" bias.
* **Lime Line (Intraday Only):** The VWAP (Volume Weighted Average Price).
---
### **How to Use This Indicator**
**Step 1: Check the Regime**
Look at the background color and the Dashboard panel. Is the Trend Strength "Strong" or "Very Strong"?
* *Rule:* Do not take trend-following trades if the Regime is "Range/Neutral."
**Step 2: Check the Confidence**
The dashboard calculates a score from 0 to 100.
* **High Confidence (>67):** All systems go. Alignment of RSI, Volume, and Trend.
* **Medium Confidence (34-66):** Caution warranted. Usually implies divergence in RSI or low volume.
* **Low Confidence (<34):** The trend is weak or failing.
**Step 3: Wait for the Setup (The Arrows)**
The indicator looks for pullbacks into the "Value Zone" (the space between the Fast and Slow EMA).
* **Triangle Up (L):** Appears when price pulls back into the zone during a Bull trend, then bounces out with volume confirmation.
* **Triangle Down (S):** Appears when price rallies into the zone during a Bear trend, then rejects lower.
---
### **Settings & Customization**
* **Mode:** Default is "Auto," but you can force "Intraday" or "Swing" manually.
* **Intraday Style:** Choose between "Aggressive" (9 EMA / 30 EMA) for scalping or "Conservative" (20 EMA / 50 EMA) for day trading.
* **ADX Threshold:** Adjusts how strict the trend filter is (Default: 20).
* **Visual Toggles:** Turn off/on the Panel, Background shading, or Vector candles to clean up your chart.
### **Alerts**
This script comes with built-in alert conditions for:
1. **Bullish Regime Start**
2. **Bearish Regime Start**
3. **High-Confidence Setup Detected**

Crypto Grail Crypto Grail — Advanced Multi-Factor Market Intelligence System
Crypto Grail is an institutional-grade multi-factor trading system designed to identify high-probability market conditions through structured trend analysis, volatility modeling, volume diagnostics and candle-level momentum evaluation. The tool operates as an adaptive decision framework that highlights only the most meaningful market alignments while filtering out low-quality noise.
Core Trend Architecture
Crypto Grail builds directional bias using a layered trend framework that integrates:
• EMA21, EMA50 and EMA200 structural mapping
• SuperTrend confirmation
• ADX trend-strength assessment
• EMA-spread evaluation for macro bias
This architecture allows Crypto Grail to distinguish impulsive directional movement from non-directional consolidation phases with high precision.
Quality Scoring Engine
Every potential long or short setup is processed through a quantitative scoring model that evaluates:
• Trend alignment across EMA structure
• SuperTrend directional confirmation
• ADX intensity
• RSI zone positioning
• Candle delta (close-location value)
• Volume deviation relative to baseline
• Volatility state (compressed / normal / explosive)
• Movement percentage vs recent history
• Impulse strength within the current bar
Only setups that satisfy the required quality threshold are eligible for display.
Volatility Regime Modeling
The system dynamically identifies volatility regimes by analyzing:
• ATR-based volatility gradient
• Recent movement amplitude
• Candle impulse relative to volatility envelope
• Expansion and compression cycles
• Chaotic transitions and unstable bursts
This allows the script to identify when the market environment supports sustained follow-through versus when conditions are structurally noisy.
Volume Deviation Framework
Crypto Grail evaluates volume behavior using a rolling baseline to detect:
• Genuine volume expansion
• Volume contraction
• Spike clusters
• Impulse confirmation with volume alignment
Volume states are incorporated directly into the quality-scoring engine, ensuring signals appear only when supported by underlying market participation.
Early & Hybrid Entry Logic
Two optional entry modes expand the system’s capability during dynamic phases:
• Early Mode: identifies strong impulse shifts confirmed by volume + delta
• Hybrid Mode: merges early detection with trend-filtered confirmation
These modes enable more aggressive entries without compromising structural integrity.
Sideways Market Filter
The system includes a consolidation-detection layer that restricts signal generation during:
• Flat ranges
• Low-energy volatility clusters
• ADX-weak trend environments
• EMA compression zones
This significantly increases average signal reliability.
Integrated Trade Simulation Engine
Crypto Grail includes a full visual trade-simulation module featuring:
• ATR-based dynamic stop loss
• Risk-to-reward take profit engine
• Optional ATR trailing stop
• Trade cooldown control
• Complete entry/exit marking
• SL/TP visualization
• Automatic exit-reason tagging
This makes each signal structurally transparent and easy to analyze.
Market Condition Panel
A real-time performance and condition dashboard displays:
• Total trades
• Wins and losses
• Long/short distribution
• Early-entry analytics
• Volume regime
• Volatility regime
• Trend condition
• Current directional bias
This provides ongoing contextual insight during live market conditions.
System Purpose
Crypto Grail is designed as a professional decision-support system that isolates high-probability market structures through multi-layer technical validation. The tool does not guarantee results and should be used with proper risk management.

KLS Ultimate V.1"KLS Ultimate V.1" is a meticulously designed trading indicator. It is built specifically for "Scalpers" (traders who want quick in-and-out profits).
**🚀 How it Works: The 3-Level Logic**
This indicator doesn't just rely on one tool. It gathers several indicators to have a "meeting" and confirm everything before giving you a Buy or Sell signal.
**🎯 Level 1: Core Trend (The Gatekeepers)**
This is the first checkpoint. If the price doesn't pass this stage, no signal gets generated.
- EMA: Is the price standing above the trend line? (Uptrend needs to be above, Downtrend below).
- MACD: Checks momentum and looks at the Histogram to see if real buying/selling volume is coming in.
- ADX: Measures trend strength (it won’t trade in boring, sideways markets).
**🔥 Level 2: Momentum (Finding the Best Entry)**
The second checkpoint to find the perfect spot to jump in.
- RSI: Checks if the price is Oversold (too cheap) or Overbought (too expensive).
- Stochastic: Finds short-term reversal crossovers.
**⭐ Level 3: Signal Boosters (For Strict Mode)**
A special bonus stage for those who want high accuracy (enable this in settings).
- RSI Divergence: Spots conflicts between price and RSI (e.g., Price drops but RSI rises = ready to pump).
- Price Action: Checks for strong candlestick patterns that show a clear winner between buyers and sellers.
------------------------------------------------------------
**🎮 User Guide**
Once you add this code to TradingView, here is what you will see and how to use it:
**A. Entry Signals**
🟢 Green BUY Label: Pops up below the candle.
* Means: Uptrend + Momentum + All filters passed.
🔴 Red SELL Label: Pops up above the candle.
* Means: Downtrend + Selling pressure + All filters passed.
**B. TP/SL Lines (Profit & Loss)**
The system calculates these automatically—no need to measure manually!
- Blue Line: Entry point.
- Light Green (TP1, TP2): Short-term profit targets.
- Dark Green (TP3): Long-term profit target.
- Red Line (SL): Stop Loss point.
**C. Special Mode: Strict Filter**
- Normal (False): Uses only Level 1 + Level 2. You get more signals.
- Strict (True): Needs Level 1 + 2 + 3 to trigger. Fewer signals, but much higher accuracy.
------------------------------------------------------------
**🛠️ Settings & Customization**
Click the gear icon to tweak the settings as you like:
1. Show BUY/SELL Signals: Uncheck if you don't want to see the labels.
2. Use Strict Filter: Check this for high precision (but you'll wait longer for signals).
3. Point Size: **Very Important!** This defines the TP/SL distance.
- For Gold (XAUUSD): Use **0.01**.
- For Forex pairs: Try **0.0001**.
- *Tip: Adjust this number until the TP/SL lines look reasonable on your chart.*
4. TP/SL Points: Set your desired profit/loss distance (e.g., TP1 = 50 points).
------------------------------------------------------------
💡 **Pro Tips**
- Trading Time: This code is smart—it checks sessions (based on GMT+7/Thai Time). It only gives signals during active markets (Sydney, Tokyo, London, NY). It stays quiet during dead hours.
- Recommended Timeframe: Since it's for Scalping, it works best on **M5, M15, or M30**.
- Money Management: Even with SL lines, always calculate your Lot Size properly. Don't overtrade!
------------------------------------------------------------
"KLS Ultimate V.1" เป็นเครื่องมือช่วยเทรด (Indicator) ที่ออกแบบมาอย่างปราณีตและซับซ้อนพอสมควร โดยเน้นไปที่ "สาย Scalping" (เทรดสั้นทำกำไรเร็ว) โดยเฉพาะ
🚀 เจาะลึกการทำงาน: ระบบกรอง 3 ชั้น (The 3-Level Logic)
อินดิเคเตอร์ตัวนี้ไม่ได้ใช้แค่เครื่องมือเดียวตัดสินใจ แต่มันเอาอินดิเคเตอร์หลายตัวมา "คอนเฟิร์ม" กันก่อนจะบอกให้คุณ Buy หรือ Sell ครับ
🎯 Level 1: ตัวคุมเทรนด์หลัก (Core Indicators)
นี่คือด่านแรก ถ้าไม่ผ่านด่านนี้ จะไม่มีสัญญาณเกิดขึ้น
- EMA (เส้นค่าเฉลี่ย): เช็คว่าราคายืนเหนือเส้นเทรนด์ไหม? (ขาขึ้นต้องยืนเหนือ, ขาลงต้องอยู่ใต้)
- MACD (โมเมนตัม): ดูแรงส่งของกราฟ และดู Histogram ว่ามีแรงซื้อ/ขาย เข้ามาจริงไหม
- ADX: วัดความแข็งแรงของเทรนด์ (ถ้าตลาดไซด์เวย์น่าเบื่อๆ ADX ต่ำๆ มันจะไม่เทรด)
🔥 Level 2: จุดกลับตัว (Momentum Indicators) ด่านที่สอง หาจังหวะเข้าที่ได้เปรียบ
- RSI: ดูว่าราคาถูกเกินไป (Oversold) หรือแพงเกินไป (Overbought) หรือยัง
- Stochastic: หาจุดตัดเพื่อยืนยันจุดกลับตัวระยะสั้น
⭐ Level 3: ตัวบูสต์สัญญาณ (Boost Indicators - สำหรับโหมด Strict)
ด่านพิเศษ สำหรับคนที่ต้องการความชัวร์ระดับสูง (เปิดใช้ได้ในตั้งค่า)
- RSI Divergence: หาสัญญาณขัดแย้งระหว่างราคากับ RSI (เช่น ราคาลงแต่ RSI ยกขึ้น = เตรียมพุ่ง)
- Price Action: ดูรูปแบบแท่งเทียนว่ามีแรงซื้อ/ขาย ชนะขาดลอยหรือไม่
------------------------------------------------------------
🎮 คู่มือการใช้งาน (User Guide)
เมื่อคุณแปะโค้ดนี้ลงใน TradingView แล้ว สิ่งที่คุณจะเห็นและการใช้งานมีดังนี้ครับ:
A. สัญญาณเข้าออเดอร์ (Entry Signals)
🟢 ป้าย BUY (สีเขียว): จะโผล่ใต้แท่งเทียน
แปลว่า: เทรนด์เป็นขาขึ้น + โมเมนตัมมา + ผ่านเงื่อนไขกรองต่างๆ แล้ว
🔴 ป้าย SELL (สีแดง): จะโผล่เหนือแท่งเทียน
แปลว่า: เทรนด์เป็นขาลง + แรงขายมา + ผ่านเงื่อนไขกรองต่างๆ แล้ว
B. เส้นเป้าหมายกำไร/ขาดทุน (TP/SL Lines)
ระบบคำนวณให้อัตโนมัติ ไม่ต้องนั่งวัดเอง!
- เส้นสีน้ำเงิน: จุดเข้า (Entry)
- เส้นสีเขียวอ่อน (TP1, TP2): เป้าทำกำไรระยะใกล้
เส้นสีเขียวเข้ม (TP3): เป้าทำกำไรระยะไกล
เส้นสีแดง (SL): จุดยอมแพ้ (Stop Loss)
C. โหมดพิเศษ: Strict Filter (โหมดเข้มงวด)
- ค่าปกติ (False): ใช้แค่ Level 1 + Level 2 ก็เกิดสัญญาณแล้ว (สัญญาณเยอะหน่อย)
- ถ้าเปิดใช้ (True): ต้องผ่าน Level 1 + 2 + 3 ถึงจะเกิดสัญญาณ (สัญญาณน้อย แต่แม่นยำสูงมาก)
------------------------------------------------------------
🛠️ วิธีตั้งค่าและปรับแต่ง (Settings)
ในหน้าตั้งค่า (รูปเฟือง) คุณสามารถปรับจูนได้ตามใจชอบ:
1. Show BUY/SELL Signals: ติ๊กออกถ้าไม่อยากเห็นป้ายสัญญาณ
2. Use Strict Filter: ติ๊กถูกถ้าอยากได้สัญญาณแม่นๆ (แต่รอนานหน่อย)
3. Point Size: สำคัญมาก! ใช้กำหนดระยะ TP/SL
- ถ้าเทรดทอง (XAUUSD) ตั้งค่าพื้นฐาน 0.01 เท่านั้น
- ถ้าเทรดคู่เงิน (Forex) อาจจะปรับเป็น 0.0001
- แนะนำให้ลองปรับจนเส้น TP/SL บนกราฟดูสมเหตุสมผล
4. TP/SL Points: กำหนดระยะจุดกำไรขาดทุนที่ต้องการ (เช่น TP1 = 50 จุด)
------------------------------------------------------------
💡 คำแนะนำเพิ่มเติม (Tips)
- เวลาเทรด: โค้ดนี้ฉลาดมาก มันมีการเช็คเวลา (Session) ให้ด้วย โดยอิงเวลา GMT+7 (เวลาไทย) โดยจะเทรดเฉพาะช่วงที่มีตลาดหลักเปิด (Sydney, Tokyo, London, NY) ช่วงตลาดวายดึกๆ หรือเช้ามืดเงียบๆ มันจะไม่บอกสัญญาณ
- Timeframe ที่แนะนำ: เนื่องจากเขียนมาเพื่อ Scalping แนะนำให้ใช้กับ M5, M15 หรือ M30 จะเห็นผลดีที่สุดครับ
- การบริหารเงิน (MM): แม้ระบบจะมี SL ให้ แต่คุณควรคำนวณ Lot Size ให้เหมาะสม ไม่ควร Overtrade ครับ

Supertrend Filtered SniperSupertrend + QQE MOD + DEMA + VWAP Multi-Confluence Strategy
A professional-grade indicator combining multiple technical confluences for high-probability trade signals
━━━━━━━━━━━━━━━━━━━━━━━━━━━━━━━━━━━━━━━━━━━
📊 OVERVIEW
This indicator combines 4 powerful technical systems into one comprehensive trading tool. It only generates signals when ALL confluences agree, resulting in fewer but higher-quality trade opportunities. Perfect for day traders, scalpers, and prop firm challenges.
✅ Signals only fire when ALL conditions align:
- Both Supertrends bullish/bearish
- Price on correct side of DEMA 200
- QQE MOD confirmation
- Optional: VWAP filter, ADX filter, RSI filter, Session filter
━━━━━━━━━━━━━━━━━━━━━━━━━━━━━━━━━━━━━━━━━━━
🔧 CORE COMPONENTS
1. Dual Supertrend System
- Supertrend #1: Primary trend identification (default: 10 period, 2.0 multiplier)
- Supertrend #2: Fast trend + exit signal (default: 1 period, 2.0 multiplier)
- Both must agree for entry signals
- ST2 flip triggers automatic exit signals
2. DEMA 200 Filter
- Double Exponential Moving Average for major trend direction
- Longs only: Price above DEMA
- Shorts only: Price below DEMA
- Gradient visualization shows trend strength
3. QQE MOD (Quantitative Qualitative Estimation)
- Advanced momentum oscillator with Bollinger Bands
- Identifies strong directional moves
- Filters out weak/choppy conditions
- Based on dual RSI calculations with dynamic thresholds
4. VWAP Filter (Optional)
- Volume Weighted Average Price for institutional flow
- Longs only: Above VWAP
- Shorts only: Below VWAP
- Ensures you trade with institutional momentum
━━━━━━━━━━━━━━━━━━━━━━━━━━━━━━━━━━━━━━━━━━━
⚙️ ADDITIONAL FILTERS
Session Filter
Choose which trading sessions to allow signals:
- Asian: 6PM - 3AM EST (Tokyo hours)
- London: 3AM - 8AM EST (London open)
- New York: 8AM - 4PM EST (US market hours)
- After Hours: 4PM - 6PM EST
- Enable multiple sessions or just one - your choice!
ADX Filter (Optional)
- Only take signals when ADX > threshold (default 18)
- Ensures strong trending conditions
- Filters out ranging/choppy markets
RSI Filter (Optional)
- Avoid overbought longs (>80 RSI)
- Avoid oversold shorts (<20 RSI)
- Prevents counter-trend entries at extremes
━━━━━━━━━━━━━━━━━━━━━━━━━━━━━━━━━━━━━━━━━━━
📈 HOW TO USE
Entry Signals:
- BUY: Green "BUY" label appears when all bullish confluences align
- SELL: Red "SELL" label appears when all bearish confluences align
- Signals only fire once per setup (no repetitive alerts)
Exit Signals:
- EXIT: Orange "X" appears when Supertrend #2 flips direction
- Automatic exit logic built-in
- Can also exit at predetermined R:R targets
Status Table:
- Real-time confluence dashboard
- Shows each indicator's current state
- Green checkmarks = conditions met
- Easy visual confirmation before entering
━━━━━━━━━━━━━━━━━━━━━━━━━━━━━━━━━━━━━━━━━━━
🎨 VISUAL FEATURES
- Gradient Supertrend lines with transparency
- Color-coded candles based on DEMA position
- Automatic highlighting of trend zones
- Clear BUY/SELL/EXIT labels
- Yellow VWAP line (toggleable)
- Professional status table with checkmarks
- Small circles mark Supertrend direction changes
━━━━━━━━━━━━━━━━━━━━━━━━━━━━━━━━━━━━━━━━━━━
🔔 ALERT SYSTEM
Pre-configured alerts for:
- BUY Signal Confirmed
- SELL Signal Confirmed
- EXIT Long Position
- EXIT Short Position
- Any Entry Signal (combined)
- Any Exit Signal (combined)
Set once-per-bar-close alerts for automated trading
━━━━━━━━━━━━━━━━━━━━━━━━━━━━━━━━━━━━━━━━━━━
⚠️ RISK DISCLAIMER
This indicator is a tool for analysis and should not be used as the sole basis for trading decisions. Always:
- Backtest thoroughly before live trading
- Use proper risk management (1% rule)
- Consider market conditions and fundamentals
- Practice on demo accounts first
- Never risk more than you can afford to lose
Past performance does not guarantee future results.
━━━━━━━━━━━━━━━━━━━━━━━━━━━━━━━━━━━━━━━━━━━
📝 CREDITS
Original concept inspired by UNITED's confluence strategy
Enhanced and coded by jaredskii with assistance from ChatGPT
QQE MOD calculations based on standard QQE indicator methodology

Bifurcation Zone - CAEBifurcation Zone — Cognitive Adversarial Engine (BZ-CAE)
Bifurcation Zone — CAE (BZ-CAE) is a next-generation divergence detection system enhanced by a Cognitive Adversarial Engine that evaluates both sides of every potential trade before presenting signals. Unlike traditional divergence indicators that show every price-oscillator disagreement regardless of context, BZ-CAE applies comprehensive market-state intelligence to identify only the divergences that occur in favorable conditions with genuine probability edges.
The system identifies structural bifurcation points — critical junctures where price and momentum disagree, signaling potential reversals or continuations — then validates these opportunities through five interconnected intelligence layers: Trend Conviction Scoring , Directional Momentum Alignment , Multi-Factor Exhaustion Modeling , Adversarial Validation , and Confidence Scoring . The result is a selective, context-aware signal system that filters noise and highlights high-probability setups.
This is not a "buy the arrow" indicator. It's a decision support framework that teaches you how to read market state, evaluate divergence quality, and make informed trading decisions based on quantified intelligence rather than hope.
What Sets BZ-CAE Apart: Technical Architecture
The Problem With Traditional Divergence Indicators
Most divergence indicators operate on a simple rule: if price makes a higher high and RSI makes a lower high, show a bearish signal. If price makes a lower low and RSI makes a higher low, show a bullish signal. This creates several critical problems:
Context Blindness : They show counter-trend signals in powerful trends that rarely reverse, leading to repeated losses as you fade momentum.
Signal Spam : Every minor price-oscillator disagreement generates an alert, overwhelming you with low-quality setups and creating analysis paralysis.
No Quality Ranking : All signals are treated identically. A marginal divergence in choppy conditions receives the same visual treatment as a high-conviction setup at a major exhaustion point.
Single-Sided Evaluation : They ask "Is this a good long?" without checking if the short case is overwhelmingly stronger, leading you into obvious bad trades.
Static Configuration : You manually choose RSI 14 or Stochastic 14 and hope it works, with no systematic way to validate if that's optimal for your instrument.
BZ-CAE's Solution: Cognitive Adversarial Intelligence
BZ-CAE solves these problems through an integrated five-layer intelligence architecture:
1. Trend Conviction Score (TCS) — 0 to 1 Scale
Most indicators check if ADX is above 25 to determine "trending" conditions. This binary approach misses nuance. TCS is a weighted composite metric:
Formula : 0.35 × normalize(ADX, 10, 35) + 0.35 × structural_strength + 0.30 × htf_alignment
Structural Strength : 10-bar SMA of consecutive directional bars. Captures persistence — are bulls or bears consistently winning?
HTF Alignment : Multi-timeframe EMA stacking (20/50/100/200). When all EMAs align in the same direction, you're in institutional trend territory.
Purpose : Quantifies how "locked in" the trend is. When TCS exceeds your threshold (default 0.80), the system knows to avoid counter-trend trades unless other factors override.
Interpretation :
TCS > 0.85: Very strong trend — counter-trading is extremely high risk
TCS 0.70-0.85: Strong trend — favor continuation, require exhaustion for reversals
TCS 0.50-0.70: Moderate trend — context matters, both directions viable
TCS < 0.50: Weak/choppy — reversals more viable, range-bound conditions
2. Directional Momentum Alignment (DMA) — ATR-Normalized
Formula : (EMA21 - EMA55) / ATR14
This isn't just "price above EMA" — it's a regime-aware momentum gauge. The same $100 price movement reads completely differently in high-volatility crypto versus low-volatility forex. By normalizing with ATR, DMA adapts its interpretation to current market conditions.
Purpose : Quantifies the directional "force" behind current price action. Positive = bullish push, negative = bearish push. Magnitude = strength.
Interpretation :
DMA > 0.7: Strong bullish momentum — bearish divergences risky
DMA 0.3 to 0.7: Moderate bullish bias
DMA -0.3 to 0.3: Balanced/choppy conditions
DMA -0.7 to -0.3: Moderate bearish bias
DMA < -0.7: Strong bearish momentum — bullish divergences risky
3. Multi-Factor Exhaustion Modeling — 0 to 1 Probability
Single-metric exhaustion detection (like "RSI > 80") misses complex market states. BZ-CAE aggregates five independent exhaustion signals:
Volume Spikes : Current volume versus 50-bar average
2.5x average: 0.25 weight
2.0x average: 0.15 weight
1.5x average: 0.10 weight
Divergence Present : The fact that a divergence exists contributes 0.30 weight — structural momentum disagreement is itself an exhaustion signal.
RSI Extremes : Captures oscillator climax zones
RSI > 80 or < 20: 0.25 weight
RSI > 75 or < 25: 0.15 weight
Pin Bar Detection : Identifies rejection candles (2:1 wick-to-body ratio, indicating failed breakout attempts): 0.15 weight
Extended Runs : Consecutive bars above/below EMA20 without pullback
30+ bars: 0.15 weight (market hasn't paused to consolidate)
Total exhaustion score is the sum of all applicable weights, capped at 1.0.
Purpose : Detects when strong trends become vulnerable to reversal. High exhaustion can override trend filters, allowing counter-trend trades at genuine turning points that basic indicators would miss.
Interpretation :
Exhaustion > 0.75: High probability of climax — yellow background shading alerts you visually
Exhaustion 0.50-0.75: Moderate overextension — watch for confirmation
Exhaustion < 0.50: Fresh move — trend can continue, counter-trend trades higher risk
4. Adversarial Validation — Game Theory Applied to Trading
This is BZ-CAE's signature innovation. Before approving any signal, the engine quantifies BOTH sides of the trade simultaneously:
For Bullish Divergences , it calculates:
Bull Case Score (0-1+) :
Distance below EMA20 (pullback quality): up to 0.25
Bullish EMA alignment (close > EMA20 > EMA50): 0.25
Oversold RSI (< 40): 0.25
Volume confirmation (> 1.2x average): 0.25
Bear Case Score (0-1+) :
Price below EMA50 (structural weakness): 0.30
Very oversold RSI (< 30, indicating knife-catching): 0.20
Differential = Bull Case - Bear Case
If differential < -0.10 (default threshold), the bear case is dominating — signal is BLOCKED or ANNOTATED.
For Bearish Divergences , the logic inverts (Bear Case vs Bull Case).
Purpose : Prevents trades where you're fighting obvious strength in the opposite direction. This is institutional-grade risk management — don't just evaluate your trade, evaluate the counter-trade simultaneously.
Why This Matters : You might see a bullish divergence at a local low, but if price is deeply below major support EMAs with strong bearish momentum, you're catching a falling knife. The adversarial check catches this and blocks the signal.
5. Confidence Scoring — 0 to 1 Quality Assessment
Every signal that passes initial filters receives a comprehensive quality score:
Formula :
0.30 × normalize(TCS) // Trend context
+ 0.25 × normalize(|DMA|) // Momentum magnitude
+ 0.20 × pullback_quality // Entry distance from EMA20
+ 0.15 × state_quality // ADX + alignment + structure
+ 0.10 × divergence_strength // Slope separation magnitude
+ adversarial_bonus (0-0.30) // Your side's advantage
Purpose : Ranks setup quality for filtering and position sizing decisions. You can set a minimum confidence threshold (default 0.35) to ensure only quality setups reach your chart.
Interpretation :
Confidence > 0.70: Premium setup — consider increased position size
Confidence 0.50-0.70: Good quality — standard size
Confidence 0.35-0.50: Acceptable — reduced size or skip if conservative
Confidence < 0.35: Marginal — blocked in Filtering mode, annotated in Advisory mode
CAE Operating Modes: Learning vs Enforcement
Off : Disables all CAE logic. Raw divergence pipeline only. Use for baseline comparison.
Advisory : Shows ALL signals regardless of CAE evaluation, but annotates signals that WOULD be blocked with specific warnings (e.g., "Bull: strong downtrend (TCS=0.87)" or "Adversarial bearish"). This is your learning mode — see CAE's decision logic in action without missing educational opportunities.
Filtering : Actively blocks low-quality signals. Only setups that pass all enabled gates (Trend Filter, Adversarial Validation, Confidence Gating) reach your chart. This is your live trading mode — trust the system to enforce discipline.
CAE Filter Gates: Three-Layer Protection
When CAE is enabled, signals must pass through three independent gates (each can be toggled on/off):
Gate 1: Strong Trend Filter
If TCS ≥ tcs_threshold (default 0.80)
And signal is counter-trend (bullish in downtrend or bearish in uptrend)
And exhaustion < exhaustion_required (default 0.50)
Then: BLOCK signal
Logic: Don't fade strong trends unless the move is clearly overextended
Gate 2: Adversarial Validation
Calculate both bull case and bear case scores
If opposing case dominates by more than adv_threshold (default 0.10)
Then: BLOCK signal
Logic: Avoid trades where you're fighting obvious strength in the opposite direction
Gate 3: Confidence Gating
Calculate composite confidence score (0-1)
If confidence < min_confidence (default 0.35)
Then: In Filtering mode, BLOCK signal; in Advisory mode, ANNOTATE with warning
Logic: Only take setups with minimum quality threshold
All three gates work together. A signal must pass ALL enabled gates to fire.
Visual Intelligence System
Bifurcation Zones (Supply/Demand Blocks)
When a divergence signal fires, BZ-CAE draws a semi-transparent box extending 15 bars forward from the signal pivot:
Demand Zones (Bullish) : Theme-colored box (cyan in Cyberpunk, blue in Professional, etc.) labeled "Demand" — marks where smart money likely placed buy orders as price diverged at the low.
Supply Zones (Bearish) : Theme-colored box (magenta in Cyberpunk, orange in Professional) labeled "Supply" — marks where smart money likely placed sell orders as price diverged at the high.
Theory : Divergences represent institutional disagreement with the crowd. The crowd pushed price to an extreme (new high or low), but momentum (oscillator) is waning, indicating smart money is taking the opposite side. These zones mark order placement areas that become future support/resistance.
Use Cases :
Exit targets: Take profit when price returns to opposite-side zone
Re-entry levels: If price returns to your entry zone, consider adding
Stop placement: Place stops just beyond your zone (below demand, above supply)
Auto-Cleanup : System keeps the last 20 zones to prevent chart clutter.
Adversarial Bar Coloring — Real-Time Market Debate Heatmap
Each bar is colored based on the Bull Case vs Bear Case differential:
Strong Bull Advantage (diff > 0.3): Full theme bull color (e.g., cyan)
Moderate Bull Advantage (diff > 0.1): 50% transparency bull
Neutral (diff -0.1 to 0.1): Gray/neutral theme
Moderate Bear Advantage (diff < -0.1): 50% transparency bear
Strong Bear Advantage (diff < -0.3): Full theme bear color (e.g., magenta)
This creates a real-time visual heatmap showing which side is "winning" the market debate. When bars flip from cyan to magenta (or vice versa), you're witnessing a shift in adversarial advantage — a leading indicator of potential momentum changes.
Exhaustion Shading
When exhaustion score exceeds 0.75, the chart background displays a semi-transparent yellow highlight. This immediate visual warning alerts you that the current move is at high risk of reversal, even if trend indicators remain strong.
Visual Themes — Six Aesthetic Options
Cyberpunk : Cyan/Magenta/Yellow — High contrast, neon aesthetic, excellent for dark-themed trading environments
Professional : Blue/Orange/Green — Corporate color palette, suitable for presentations and professional documentation
Ocean : Teal/Red/Cyan — Aquatic palette, calming for extended monitoring sessions
Fire : Orange/Red/Coral — Warm aggressive colors, high energy
Matrix : Green/Red/Lime — Code aesthetic, homage to classic hacker visuals
Monochrome : White/Gray — Minimal distraction, maximum focus on price action
All visual elements (signal markers, zones, bar colors, dashboard) adapt to your selected theme.
Divergence Engine — Core Detection System
What Are Divergences?
Divergences occur when price action and momentum indicators disagree, creating structural tension that often resolves in a change of direction:
Regular Divergence (Reversal Signal) :
Bearish Regular : Price makes higher high, oscillator makes lower high → Potential trend reversal down
Bullish Regular : Price makes lower low, oscillator makes higher low → Potential trend reversal up
Hidden Divergence (Continuation Signal) :
Bearish Hidden : Price makes lower high, oscillator makes higher high → Downtrend continuation
Bullish Hidden : Price makes higher low, oscillator makes lower low → Uptrend continuation
Both types can be enabled/disabled independently in settings.
Pivot Detection Methods
BZ-CAE uses symmetric pivot detection with separate lookback and lookforward periods (default 5/5):
Pivot High : Bar where high > all highs within lookback range AND high > all highs within lookforward range
Pivot Low : Bar where low < all lows within lookback range AND low < all lows within lookforward range
This ensures structural validity — the pivot must be a clear local extreme, not just a minor wiggle.
Divergence Validation Requirements
For a divergence to be confirmed, it must satisfy:
Slope Disagreement : Price slope and oscillator slope must move in opposite directions (for regular divs) or same direction with inverted highs/lows (for hidden divs)
Minimum Slope Change : |osc_slope| > min_slope_change / 100 (default 1.0) — filters weak, marginal divergences
Maximum Lookback Range : Pivots must be within max_lookback bars (default 60) — prevents ancient, irrelevant divergences
ATR-Normalized Strength : Divergence strength = min(|price_slope| × |osc_slope| × 10, 1.0) — quantifies the magnitude of disagreement in volatility context
Regular divergences receive 1.0× weight; hidden divergences receive 0.8× weight (slightly less reliable historically).
Oscillator Options — Five Professional Indicators
RSI (Relative Strength Index) : Classic overbought/oversold momentum indicator. Best for: General purpose divergence detection across all instruments.
Stochastic : Range-bound %K momentum comparing close to high-low range. Best for: Mean reversion strategies and range-bound markets.
CCI (Commodity Channel Index) : Measures deviation from statistical mean, auto-normalized to 0-100 scale. Best for: Cyclical instruments and commodities.
MFI (Money Flow Index) : Volume-weighted RSI incorporating money flow. Best for: Volume-driven markets like stocks and crypto.
Williams %R : Inverse stochastic looking back over period, auto-adjusted to 0-100. Best for: Reversal detection at extremes.
Each oscillator has adjustable length (2-200, default 14) and smoothing (1-20, default 1). You also set overbought (50-100, default 70) and oversold (0-50, default 30) thresholds.
Signal Timing Modes — Understanding Repainting
BZ-CAE offers two timing policies with complete transparency about repainting behavior:
Realtime (1-bar, peak-anchored)
How It Works :
Detects peaks 1 bar ago using pattern: high > high AND high > high
Signal prints on the NEXT bar after peak detection (bar_index)
Visual marker anchors to the actual PEAK bar (bar_index - 1, offset -1)
Signal locks in when bar CONFIRMS (closes)
Repainting Behavior :
On the FORMING bar (before close), the peak condition may change as new prices arrive
Once bar CLOSES (barstate.isconfirmed), signal is locked permanently
This is preview/early warning behavior by design
Best For :
Active monitoring and immediate alerts
Learning the system (seeing signals develop in real-time)
Responsive entry if you're watching the chart live
Confirmed (lookforward)
How It Works :
Uses Pine Script's built-in ta.pivothigh() and ta.pivotlow() functions
Requires full pivot validation period (lookback + lookforward bars)
Signal prints pivot_lookforward bars after the actual peak (default 5-bar delay)
Visual marker anchors to the actual peak bar (offset -pivot_lookforward)
No Repainting Behavior
Best For :
Backtesting and historical analysis
Conservative entries requiring full confirmation
Automated trading systems
Swing trading with larger timeframes
Tradeoff :
Delayed entry by pivot_lookforward bars (typically 5 bars)
On a 5-minute chart, this is a 25-minute delay
On a 4-hour chart, this is a 20-hour delay
Recommendation : Use Confirmed for backtesting to verify system performance honestly. Use Realtime for live monitoring only if you're actively watching the chart and understand pre-confirmation repainting behavior.
Signal Spacing System — Anti-Spam Architecture
Even after CAE filtering, raw divergences can cluster. The spacing system enforces separation:
Three Independent Filters
1. Min Bars Between ANY Signals (default 12):
Prevents rapid-fire clustering across both directions
If last signal (bull or bear) was within N bars, block new signal
Ensures breathing room between all setups
2. Min Bars Between SAME-SIDE Signals (default 24, optional enforcement):
Prevents bull-bull or bear-bear spam
Separate tracking for bullish and bearish signal timelines
Toggle enforcement on/off
3. Min ATR Distance From Last Signal (default 0, optional):
Requires price to move N × ATR from last signal location
Ensures meaningful price movement between setups
0 = disabled, 0.5-2.0 = typical range for enabled
All three filters work independently. A signal must pass ALL enabled filters to proceed.
Practical Guidance :
Scalping (1-5m) : Any 6-10, Same-side 12-20, ATR 0-0.5
Day Trading (15m-1H) : Any 12, Same-side 24, ATR 0-1.0
Swing Trading (4H-D) : Any 20-30, Same-side 40-60, ATR 1.0-2.0
Dashboard — Real-Time Control Center
The dashboard (toggleable, four corner positions, three sizes) provides comprehensive system intelligence:
Oscillator Section
Current oscillator type and value
State: OVERBOUGHT / OVERSOLD / NEUTRAL (color-coded)
Length parameter
Cognitive Engine Section
TCS (Trend Conviction Score) :
Current value with emoji state indicator
🔥 = Strong trend (>0.75)
📊 = Moderate trend (0.50-0.75)
〰️ = Weak/choppy (<0.50)
Color: Red if above threshold (trend filter active), yellow if moderate, green if weak
DMA (Directional Momentum Alignment) :
Current value with emoji direction indicator
🐂 = Bullish momentum (>0.5)
⚖️ = Balanced (-0.5 to 0.5)
🐻 = Bearish momentum (<-0.5)
Color: Green if bullish, red if bearish
Exhaustion :
Current value with emoji warning indicator
⚠️ = High exhaustion (>0.75)
🟡 = Moderate (0.50-0.75)
✓ = Low (<0.50)
Color: Red if high, yellow if moderate, green if low
Pullback :
Quality of current distance from EMA20
Values >0.6 are ideal entry zones (not too close, not too far)
Bull Case / Bear Case (if Adversarial enabled):
Current scores for both sides of the market debate
Differential with emoji indicator:
📈 = Bull advantage (>0.2)
➡️ = Balanced (-0.2 to 0.2)
📉 = Bear advantage (<-0.2)
Last Signal Metrics Section (New Feature)
When a signal fires, this section captures and displays:
Signal type (BULL or BEAR)
Bars elapsed since signal
Confidence % at time of signal
TCS value at signal time
DMA value at signal time
Purpose : Provides a historical reference for learning. You can see what the market state looked like when the last signal fired, helping you correlate outcomes with conditions.
Statistics Section
Total Signals : Lifetime count across session
Blocked Signals : Count and percentage (filter effectiveness metric)
Bull Signals : Total bullish divergences
Bear Signals : Total bearish divergences
Purpose : System health monitoring. If blocked % is very high (>60%), filters may be too strict. If very low (<10%), filters may be too loose.
Advisory Annotations
When CAE Mode = Advisory, this section displays warnings for signals that would be blocked in Filtering mode:
Examples:
"Bull spacing: wait 8 bars"
"Bear: strong uptrend (TCS=0.87)"
"Adversarial bearish"
"Low confidence 32%"
Multiple warnings can stack, separated by " | ". This teaches you CAE's decision logic transparently.
How to Use BZ-CAE — Complete Workflow
Phase 1: Initial Setup (First Session)
Apply BZ-CAE to your chart
Select your preferred Visual Theme (Cyberpunk recommended for visibility)
Set Signal Timing to "Confirmed (lookforward)" for learning
Choose your Oscillator Type (RSI recommended for general use, length 14)
Set Overbought/Oversold to 70/30 (standard)
Enable both Regular Divergence and Hidden Divergence
Set Pivot Lookback/Lookforward to 5/5 (balanced structure)
Enable CAE Intelligence
Set CAE Mode to "Advisory" (learning mode)
Enable all three CAE filters: Strong Trend Filter , Adversarial Validation , Confidence Gating
Enable Show Dashboard , position Top Right, size Normal
Enable Draw Bifurcation Zones and Adversarial Bar Coloring
Phase 2: Learning Period (Weeks 1-2)
Goal : Understand how CAE evaluates market state and filters signals.
Activities :
Watch the dashboard during signals :
Note TCS values when counter-trend signals fail — this teaches you the trend strength threshold for your instrument
Observe exhaustion patterns at actual turning points — learn when overextension truly matters
Study adversarial differential at signal times — see when opposing cases dominate
Review blocked signals (orange X-crosses):
In Advisory mode, you see everything — signals that would pass AND signals that would be blocked
Check the advisory annotations to understand why CAE would block
Track outcomes: Were the blocks correct? Did those signals fail?
Use Last Signal Metrics :
After each signal, check the dashboard capture of confidence, TCS, and DMA
Journal these values alongside trade outcomes
Identify patterns: Do confidence >0.70 signals work better? Does your instrument respect TCS >0.85?
Understand your instrument's "personality" :
Trending instruments (indices, major forex) may need TCS threshold 0.85-0.90
Choppy instruments (low-cap stocks, exotic pairs) may work best with TCS 0.70-0.75
High-volatility instruments (crypto) may need wider spacing
Low-volatility instruments may need tighter spacing
Phase 3: Calibration (Weeks 3-4)
Goal : Optimize settings for your specific instrument, timeframe, and style.
Calibration Checklist :
Min Confidence Threshold :
Review confidence distribution in your signal journal
Identify the confidence level below which signals consistently fail
Set min_confidence slightly above that level
Day trading : 0.35-0.45
Swing trading : 0.40-0.55
Scalping : 0.30-0.40
TCS Threshold :
Find the TCS level where counter-trend signals consistently get stopped out
Set tcs_threshold at or slightly below that level
Trending instruments : 0.85-0.90
Mixed instruments : 0.80-0.85
Choppy instruments : 0.75-0.80
Exhaustion Override Level :
Identify exhaustion readings that marked genuine reversals
Set exhaustion_required just below the average
Typical range : 0.45-0.55
Adversarial Threshold :
Default 0.10 works for most instruments
If you find CAE is too conservative (blocking good trades), raise to 0.15-0.20
If signals are still getting caught in opposing momentum, lower to 0.07-0.09
Spacing Parameters :
Count bars between quality signals in your journal
Set min bars ANY to ~60% of that average
Set min bars SAME-SIDE to ~120% of that average
Scalping : Any 6-10, Same 12-20
Day trading : Any 12, Same 24
Swing : Any 20-30, Same 40-60
Oscillator Selection :
Try different oscillators for 1-2 weeks each
Track win rate and average winner/loser by oscillator type
RSI : Best for general use, clear OB/OS
Stochastic : Best for range-bound, mean reversion
MFI : Best for volume-driven markets
CCI : Best for cyclical instruments
Williams %R : Best for reversal detection
Phase 4: Live Deployment
Goal : Disciplined execution with proven, calibrated system.
Settings Changes :
Switch CAE Mode from Advisory to Filtering
System now actively blocks low-quality signals
Only setups passing all gates reach your chart
Keep Signal Timing on Confirmed for conservative entries
OR switch to Realtime if you're actively monitoring and want faster entries (accept pre-confirmation repaint risk)
Use your calibrated thresholds from Phase 3
Enable high-confidence alerts: "⭐ High Confidence Bullish/Bearish" (>0.70)
Trading Discipline Rules :
Respect Blocked Signals :
If CAE blocks a trade you wanted to take, TRUST THE SYSTEM
Don't manually override — if you consistently disagree, return to Phase 2/3 calibration
The block exists because market state failed intelligence checks
Confidence-Based Position Sizing :
Confidence >0.70: Standard or increased size (e.g., 1.5-2.0% risk)
Confidence 0.50-0.70: Standard size (e.g., 1.0% risk)
Confidence 0.35-0.50: Reduced size (e.g., 0.5% risk) or skip if conservative
TCS-Based Management :
High TCS + counter-trend signal: Use tight stops, quick exits (you're fading momentum)
Low TCS + reversal signal: Use wider stops, trail aggressively (genuine reversal potential)
Exhaustion Awareness :
Exhaustion >0.75 (yellow shading): Market is overextended, reversal risk is elevated — consider early exit or tighter trailing stops even on winning trades
Exhaustion <0.30: Continuation bias — hold for larger move, wide trailing stops
Adversarial Context :
Strong differential against you (e.g., bullish signal with bear diff <-0.2): Use very tight stops, consider skipping
Strong differential with you (e.g., bullish signal with bull diff >0.2): Trail aggressively, this is your tailwind
Practical Settings by Timeframe & Style
Scalping (1-5 Minute Charts)
Objective : High frequency, tight stops, quick reversals in fast-moving markets.
Oscillator :
Type: RSI or Stochastic (fast response to quick moves)
Length: 9-11 (more responsive than standard 14)
Smoothing: 1 (no lag)
OB/OS: 65/35 (looser thresholds ensure frequent crossings in fast conditions)
Divergence :
Pivot Lookback/Lookforward: 3/3 (tight structure, catch small swings)
Max Lookback: 40-50 bars (recent structure only)
Min Slope Change: 0.8-1.0 (don't be overly strict)
CAE :
Mode: Advisory first (learn), then Filtering
Min Confidence: 0.30-0.35 (lower bar for speed, accept more signals)
TCS Threshold: 0.70-0.75 (allow more counter-trend opportunities)
Exhaustion Required: 0.45-0.50 (moderate override)
Strong Trend Filter: ON (still respect major intraday trends)
Adversarial: ON (critical for scalping protection — catches bad entries quickly)
Spacing :
Min Bars ANY: 6-10 (fast pace, many setups)
Min Bars SAME-SIDE: 12-20 (prevent clustering)
Min ATR Distance: 0 or 0.5 (loose)
Timing : Realtime (speed over precision, but understand repaint risk)
Visuals :
Signal Size: Tiny (chart clarity in busy conditions)
Show Zones: Optional (can clutter on low timeframes)
Bar Coloring: ON (helps read momentum shifts quickly)
Dashboard: Small size (corner reference, not main focus)
Key Consideration : Scalping generates noise. Even with CAE, expect lower win rate (45-55%) but aim for favorable R:R (2:1 or better). Size conservatively.
Day Trading (15-Minute to 1-Hour Charts)
Objective : Balance quality and frequency. Standard divergence trading approach.
Oscillator :
Type: RSI or MFI (proven reliability, volume confirmation with MFI)
Length: 14 (industry standard, well-studied)
Smoothing: 1-2
OB/OS: 70/30 (classic levels)
Divergence :
Pivot Lookback/Lookforward: 5/5 (balanced structure)
Max Lookback: 60 bars
Min Slope Change: 1.0 (standard strictness)
CAE :
Mode: Filtering (enforce discipline from the start after brief Advisory learning)
Min Confidence: 0.35-0.45 (quality filter without being too restrictive)
TCS Threshold: 0.80-0.85 (respect strong trends)
Exhaustion Required: 0.50 (balanced override threshold)
Strong Trend Filter: ON
Adversarial: ON
Confidence Gating: ON (all three filters active)
Spacing :
Min Bars ANY: 12 (breathing room between all setups)
Min Bars SAME-SIDE: 24 (prevent bull/bear clusters)
Min ATR Distance: 0-1.0 (optional refinement, typically 0.5-1.0)
Timing : Confirmed (1-bar delay for reliability, no repainting)
Visuals :
Signal Size: Tiny or Small
Show Zones: ON (useful reference for exits/re-entries)
Bar Coloring: ON (context awareness)
Dashboard: Normal size (full visibility)
Key Consideration : This is the "sweet spot" timeframe for BZ-CAE. Market structure is clear, CAE has sufficient data, and signal frequency is manageable. Expect 55-65% win rate with proper execution.
Swing Trading (4-Hour to Daily Charts)
Objective : Quality over quantity. High conviction only. Larger stops and targets.
Oscillator :
Type: RSI or CCI (robust on higher timeframes, smooth longer waves)
Length: 14-21 (capture larger momentum swings)
Smoothing: 1-3
OB/OS: 70/30 or 75/25 (strict extremes)
Divergence :
Pivot Lookback/Lookforward: 5/5 or 7/7 (structural purity, major swings only)
Max Lookback: 80-100 bars (broader historical context)
Min Slope Change: 1.2-1.5 (require strong, undeniable divergence)
CAE :
Mode: Filtering (strict enforcement, premium setups only)
Min Confidence: 0.40-0.55 (high bar for entry)
TCS Threshold: 0.85-0.95 (very strong trend protection — don't fade established HTF trends)
Exhaustion Required: 0.50-0.60 (higher bar for override — only extreme exhaustion justifies counter-trend)
Strong Trend Filter: ON (critical on HTF)
Adversarial: ON (avoid obvious bad trades)
Confidence Gating: ON (quality gate essential)
Spacing :
Min Bars ANY: 20-30 (substantial separation)
Min Bars SAME-SIDE: 40-60 (significant breathing room)
Min ATR Distance: 1.0-2.0 (require meaningful price movement)
Timing : Confirmed (purity over speed, zero repaint for swing accuracy)
Visuals :
Signal Size: Small or Normal (clear markers on zoomed-out view)
Show Zones: ON (important HTF levels)
Bar Coloring: ON (long-term trend awareness)
Dashboard: Normal or Large (comprehensive analysis)
Key Consideration : Swing signals are rare but powerful. Expect 2-5 signals per month per instrument. Win rate should be 60-70%+ due to stringent filtering. Position size can be larger given confidence.
Dashboard Interpretation Reference
TCS (Trend Conviction Score) States
0.00-0.50: Weak/Choppy
Emoji: 〰️
Color: Green/cyan
Meaning: No established trend. Range-bound or consolidating. Both reversal and continuation signals viable.
Action: Reversals (regular divs) are safer. Use wider profit targets (market has room to move). Consider mean reversion strategies.
0.50-0.75: Moderate Trend
Emoji: 📊
Color: Yellow/neutral
Meaning: Developing trend but not locked in. Context matters significantly.
Action: Check DMA and exhaustion. If DMA confirms trend and exhaustion is low, favor continuation (hidden divs). If exhaustion is high, reversals are viable.
0.75-0.85: Strong Trend
Emoji: 🔥
Color: Orange/warning
Meaning: Well-established trend with persistence. Counter-trend is high risk.
Action: Require exhaustion >0.50 for counter-trend entries. Favor continuation signals. Use tight stops on counter-trend attempts.
0.85-1.00: Very Strong Trend
Emoji: 🔥🔥
Color: Red/danger (if counter-trading)
Meaning: Locked-in institutional trend. Extremely high risk to fade.
Action: Avoid counter-trend unless exhaustion >0.75 (yellow shading). Focus exclusively on continuation opportunities. Momentum is king here.
DMA (Directional Momentum Alignment) Zones
-2.0 to -1.0: Strong Bearish Momentum
Emoji: 🐻🐻
Color: Dark red
Meaning: Powerful downside force. Sellers are in control.
Action: Bullish divergences are counter-momentum (high risk). Bearish divergences are with-momentum (lower risk). Size down on longs.
-0.5 to 0.5: Neutral/Balanced
Emoji: ⚖️
Color: Gray/neutral
Meaning: No strong directional bias. Choppy or consolidating.
Action: Both directions have similar probability. Focus on confidence score and adversarial differential for edge.
1.0 to 2.0: Strong Bullish Momentum
Emoji: 🐂🐂
Color: Bright green/cyan
Meaning: Powerful upside force. Buyers are in control.
Action: Bearish divergences are counter-momentum (high risk). Bullish divergences are with-momentum (lower risk). Size down on shorts.
Exhaustion States
0.00-0.50: Fresh Move
Emoji: ✓
Color: Green
Meaning: Trend is healthy, not overextended. Room to run.
Action: Counter-trend trades are premature. Favor continuation. Hold winners for larger moves. Avoid early exits.
0.50-0.75: Mature Move
Emoji: 🟡
Color: Yellow
Meaning: Move is aging. Watch for signs of climax.
Action: Tighten trailing stops on winning trades. Be ready for reversals. Don't add to positions aggressively.
0.75-0.85: High Exhaustion
Emoji: ⚠️
Color: Orange
Background: Yellow shading appears
Meaning: Move is overextended. Reversal risk elevated significantly.
Action: Counter-trend reversals are higher probability. Consider early exits on with-trend positions. Size up on reversal divergences (if CAE allows).
0.85-1.00: Critical Exhaustion
Emoji: ⚠️⚠️
Color: Red
Background: Yellow shading intensifies
Meaning: Climax conditions. Reversal imminent or underway.
Action: Aggressive reversal trades justified. Exit all with-trend positions. This is where major turns occur.
Confidence Score Tiers
0.00-0.30: Low Quality
Color: Red
Status: Blocked in Filtering mode
Action: Skip entirely. Setup lacks fundamental quality across multiple factors.
0.30-0.50: Moderate Quality
Color: Yellow/orange
Status: Marginal — passes in Filtering only if >min_confidence
Action: Reduced position size (0.5-0.75% risk). Tight stops. Conservative profit targets. Skip if you're selective.
0.50-0.70: High Quality
Color: Green/cyan
Status: Good setup across most quality factors
Action: Standard position size (1.0-1.5% risk). Normal stops and targets. This is your bread-and-butter trade.
0.70-1.00: Premium Quality
Color: Bright green/gold
Status: Exceptional setup — all factors aligned
Visual: Double confidence ring appears
Action: Consider increased position size (1.5-2.0% risk, maximum). Wider stops. Larger targets. High probability of success. These are rare — capitalize when they appear.
Adversarial Differential Interpretation
Bull Differential > 0.3 :
Visual: Strong cyan/green bar colors
Meaning: Bull case strongly dominates. Buyers have clear advantage.
Action: Bullish divergences favored (with-advantage). Bearish divergences face headwind (reduce size or skip). Momentum is bullish.
Bull Differential 0.1 to 0.3 :
Visual: Moderate cyan/green transparency
Meaning: Moderate bull advantage. Buyers have edge but not overwhelming.
Action: Both directions viable. Slight bias toward longs.
Differential -0.1 to 0.1 :
Visual: Gray/neutral bars
Meaning: Balanced debate. No clear advantage either side.
Action: Rely on other factors (confidence, TCS, exhaustion) for direction. Adversarial is neutral.
Bear Differential -0.3 to -0.1 :
Visual: Moderate red/magenta transparency
Meaning: Moderate bear advantage. Sellers have edge but not overwhelming.
Action: Both directions viable. Slight bias toward shorts.
Bear Differential < -0.3 :
Visual: Strong red/magenta bar colors
Meaning: Bear case strongly dominates. Sellers have clear advantage.
Action: Bearish divergences favored (with-advantage). Bullish divergences face headwind (reduce size or skip). Momentum is bearish.
Last Signal Metrics — Post-Trade Analysis
After a signal fires, dashboard captures:
Type : BULL or BEAR
Bars Ago : How long since signal (updates every bar)
Confidence : What was the quality score at signal time
TCS : What was trend conviction at signal time
DMA : What was momentum alignment at signal time
Use Case : Post-trade journaling and learning.
Example: "BULL signal 12 bars ago. Confidence: 68%, TCS: 0.42, DMA: -0.85"
Analysis : This was a bullish reversal (regular div) with good confidence, weak trend (TCS), but strong bearish momentum (DMA). The bet was that momentum would reverse — a counter-momentum play requiring exhaustion confirmation. Check if exhaustion was high at that time to justify the entry.
Track patterns:
Do your best trades have confidence >0.65?
Do low-TCS signals (<0.50) work better for you?
Are you more successful with-momentum (DMA aligned with signal) or counter-momentum?
Troubleshooting Guide
Problem: No Signals Appearing
Symptoms : Chart loads, dashboard shows metrics, but no divergence signals fire.
Diagnosis Checklist :
Check dashboard oscillator value : Is it crossing OB/OS levels (70/30)? If oscillator stays in 40-60 range constantly, it can't reach extremes needed for divergence detection.
Are pivots forming? : Look for local swing highs/lows on your chart. If price is in tight consolidation, pivots may not meet lookback/lookforward requirements.
Is spacing too tight? : Check "Last Signal" metrics — how many bars since last signal? If <12 and your min_bars_ANY is 12, spacing filter is blocking.
Is CAE blocking everything? : Check dashboard Statistics section — what's the blocked signal count? High blocks indicate overly strict filters.
Solutions :
Loosen OB/OS Temporarily :
Try 65/35 to verify divergence detection works
If signals appear, the issue was threshold strictness
Gradually tighten back to 67/33, then 70/30 as appropriate
Lower Min Confidence :
Try 0.25-0.30 (diagnostic level)
If signals appear, filter was too strict
Raise gradually to find sweet spot (0.35-0.45 typical)
Disable Strong Trend Filter Temporarily :
Turn off in CAE settings
If signals appear, TCS threshold was blocking everything
Re-enable and lower TCS_threshold to 0.70-0.75
Reduce Min Slope Change :
Try 0.7-0.8 (from default 1.0)
Allows weaker divergences through
Helpful on low-volatility instruments
Widen Spacing :
Set min_bars_ANY to 6-8
Set min_bars_SAME_SIDE to 12-16
Reduces time between allowed signals
Check Timing Mode :
If using Confirmed, remember there's a pivot_lookforward delay (5+ bars)
Switch to Realtime temporarily to verify system is working
Realtime has no delay but repaints
Verify Oscillator Settings :
Length 14 is standard but might not fit all instruments
Try length 9-11 for faster response
Try length 18-21 for slower, smoother response
Problem: Too Many Signals (Signal Spam)
Symptoms : Dashboard shows 50+ signals in Statistics, confidence scores mostly <0.40, signals clustering close together.
Solutions :
Raise Min Confidence :
Try 0.40-0.50 (quality filter)
Blocks bottom-tier setups
Targets top 50-60% of divergences only
Tighten OB/OS :
Use 70/30 or 75/25
Requires more extreme oscillator readings
Reduces false divergences in mid-range
Increase Min Slope Change :
Try 1.2-1.5 (from default 1.0)
Requires stronger, more obvious divergences
Filters marginal slope disagreements
Raise TCS Threshold :
Try 0.85-0.90 (from default 0.80)
Stricter trend filter blocks more counter-trend attempts
Favors only strongest trend alignment
Enable ALL CAE Gates :
Turn on Trend Filter + Adversarial + Confidence
Triple-layer protection
Blocks aggressively — expect 20-40% reduction in signals
Widen Spacing :
min_bars_ANY: 15-20 (from 12)
min_bars_SAME_SIDE: 30-40 (from 24)
Creates substantial breathing room
Switch to Confirmed Timing :
Removes realtime preview noise
Ensures full pivot validation
5-bar delay filters many false starts
Problem: Signals in Strong Trends Get Stopped Out
Symptoms : You take a bullish divergence in a downtrend (or bearish in uptrend), and it immediately fails. Dashboard showed high TCS at the time.
Analysis : This is INTENDED behavior — CAE is protecting you from low-probability counter-trend trades.
Understanding :
Check Last Signal Metrics in dashboard — what was TCS when signal fired?
If TCS was >0.85 and signal was counter-trend, CAE correctly identified it as high risk
Strong trends rarely reverse cleanly without major exhaustion
Your losses here are the system working as designed (blocking bad odds)
If You Want to Override (Not Recommended) :
Lower TCS_threshold to 0.70-0.75 (allows more counter-trend)
Lower exhaustion_required to 0.40 (easier override)
Disable Strong Trend Filter entirely (very risky)
Better Approach :
TRUST THE FILTER — it's preventing costly mistakes
Wait for exhaustion >0.75 (yellow shading) before counter-trending strong TCS
Focus on continuation signals (hidden divs) in high-TCS environments
Use Advisory mode to see what CAE is blocking and learn from outcomes
Problem: Adversarial Blocking Seems Wrong
Symptoms : You see a divergence that "looks good" visually, but CAE blocks with "Adversarial bearish/bullish" warning.
Diagnosis :
Check dashboard Bull Case and Bear Case scores at that moment
Look at Differential value
Check adversarial bar colors — was there strong coloring against your intended direction?
Understanding :
Adversarial catches "obvious" opposing momentum that's easy to miss
Example: Bullish divergence at a local low, BUT price is deeply below EMA50, bearish momentum is strong, and RSI shows knife-catching conditions
Bull Case might be 0.20 while Bear Case is 0.55
Differential = -0.35, far beyond threshold
Block is CORRECT — you'd be fighting overwhelming opposing flow
If You Disagree Consistently
Review blocked signals on chart — scroll back and check outcomes
Did those blocked signals actually work, or did they fail as adversarial predicted?
Raise adv_threshold to 0.15-0.20 (more permissive, allows closer battles)
Disable Adversarial Validation temporarily (diagnostic) to isolate its effect
Use Advisory mode to learn adversarial patterns over 50-100 signals
Remember : Adversarial is conservative BY DESIGN. It prevents "obvious" bad trades where you're fighting strong strength the other way.
Problem: Dashboard Not Showing or Incomplete
Solutions :
Toggle "Show Dashboard" to ON in settings
Try different dashboard sizes (Small/Normal/Large)
Try different positions (Top Left/Right, Bottom Left/Right) — might be off-screen
Some sections require CAE Enable = ON (Cognitive Engine section won't appear if CAE is disabled)
Statistics section requires at least 1 lifetime signal to populate
Check that visual theme is set (dashboard colors adapt to theme)
Problem: Performance Lag, Chart Freezing
Symptoms : Chart loading is slow, indicator calculations cause delays, pinch-to-zoom lags.
Diagnosis : Visual features are computationally expensive, especially adversarial bar coloring (recalculates every bar).
Solutions (In Order of Impact) :
Disable Adversarial Bar Coloring (MOST EXPENSIVE):
Turn OFF "Adversarial Bar Coloring" in settings
This is the single biggest performance drain
Immediate improvement
Reduce Vertical Lines :
Lower "Keep last N vertical lines" to 20-30
Or set to 0 to disable entirely
Moderate improvement
Disable Bifurcation Zones :
Turn OFF "Draw Bifurcation Zones"
Reduces box drawing calculations
Moderate improvement
Set Dashboard Size to Small :
Smaller dashboard = fewer cells = less rendering
Minor improvement
Use Shorter Max Lookback :
Reduce max_lookback to 40-50 (from 60+)
Fewer bars to scan for divergences
Minor improvement
Disable Exhaustion Shading :
Turn OFF "Show Market State"
Removes background coloring calculations
Minor improvement
Extreme Performance Mode :
Disable ALL visual enhancements
Keep only triangle markers
Dashboard Small or OFF
Use Minimal theme if available
Problem: Realtime Signals Repainting
Symptoms : You see a signal appear, but on next bar it disappears or moves.
Explanation :
Realtime mode detects peaks 1 bar ago: high > high AND high > high
On the FORMING bar (before close), this condition can change as new prices arrive
Example: At 10:05, high (10:04 bar) was 100, current high is 99 → peak detected
At 10:05:30, new high of 101 arrives → peak condition breaks → signal disappears
At 10:06 (bar close), final high is 101 → no peak at 10:04 anymore → signal gone permanently
This is expected behavior for realtime responsiveness. You get preview/early warning, but it's not locked until bar confirms.
Solutions :
Use Confirmed Timing :
Switch to "Confirmed (lookforward)" mode
ZERO repainting — pivot must be fully validated
5-bar delay (pivot_lookforward)
What you see in history is exactly what would have appeared live
Accept Realtime Repaint as Tradeoff :
Keep Realtime mode for speed and alerts
Understand that pre-confirmation signals may vanish
Only trade signals that CONFIRM at bar close (check barstate.isconfirmed)
Use for live monitoring, NOT for backtesting
Trade Only After Confirmation :
In Realtime mode, wait 1 full bar after signal appears before entering
If signal survives that bar close, it's locked
This adds 1-bar delay but removes repaint risk
Recommendation : Use Confirmed for backtesting and conservative trading. Use Realtime only for active monitoring with full understanding of preview behavior.
Risk Management Integration
BZ-CAE is a signal generation system, not a complete trading strategy. You must integrate proper risk management:
Position Sizing by Confidence
Confidence 0.70-1.00 (Premium) :
Risk: 1.5-2.0% of account (MAXIMUM)
Reasoning: High-quality setup across all factors
Still cap at 2% — even premium setups can fail
Confidence 0.50-0.70 (High Quality) :
Risk: 1.0-1.5% of account
Reasoning: Standard good setup
Your bread-and-butter risk level
Confidence 0.35-0.50 (Moderate Quality) :
Risk: 0.5-1.0% of account
Reasoning: Marginal setup, passes minimum threshold
Reduce size or skip if you're selective
Confidence <0.35 (Low Quality) :
Risk: 0% (blocked in Filtering mode)
Reasoning: Insufficient quality factors
System protects you by not showing these
Stop Placement Strategies
For Reversal Signals (Regular Divergences) :
Place stop beyond the divergence pivot plus buffer
Bullish : Stop below the divergence low - 1.0-1.5 × ATR
Bearish : Stop above the divergence high + 1.0-1.5 × ATR
Reasoning: If price breaks the pivot, divergence structure is invalidated
For Continuation Signals (Hidden Divergences) :
Place stop beyond recent swing in opposite direction
Bullish continuation : Stop below recent swing low (not the divergence pivot itself)
Bearish continuation : Stop above recent swing high
Reasoning: You're trading with trend, allow more breathing room
ATR-Based Stops :
1.5-2.0 × ATR is standard
Scale by timeframe:
Scalping (1-5m): 1.0-1.5 × ATR (tight)
Day trading (15m-1H): 1.5-2.0 × ATR (balanced)
Swing (4H-D): 2.0-3.0 × ATR (wide)
Never Use Fixed Dollar/Pip Stops :
Markets have different volatility
50-pip stop on EUR/USD ≠ 50-pip stop on GBP/JPY
Always normalize by ATR or pivot structure
Profit Targets and Scaling
Primary Target :
2-3 × ATR from entry (minimum 2:1 reward-risk)
Example : Entry at 100, ATR = 2, stop at 97 (1.5 × ATR) → target at 106 (3 × ATR) = 2:1 R:R
Scaling Out Strategy :
Take 50% off at 1.5 × ATR (secure partial profit)
Move stop to breakeven
Trail remaining 50% with 1.0 × ATR trailing stop
Let winners run if trend persists
Targets by Confidence :
High Confidence (>0.70) : Aggressive targets (3-4 × ATR), trail wider (1.5 × ATR)
Standard Confidence (0.50-0.70) : Normal targets (2-3 × ATR), standard trail (1.0 × ATR)
Low Confidence (0.35-0.50) : Conservative targets (1.5-2 × ATR), tight trail (0.75 × ATR)
Use Bifurcation Zones :
If opposite-side zone is visible on chart (from previous signal), use it as target
Example : Bullish signal at 100, prior supply zone at 110 → use 110 as target
Zones mark institutional resistance/support
Exhaustion-Based Exits :
If you're in a trade and exhaustion >0.75 develops (yellow shading), consider early exit
Market is overextended — reversal risk is high
Take profit even if target not reached
Trade Management by TCS
High TCS + Counter-Trend Trade (Risky) :
Use very tight stops (1.0-1.5 × ATR)
Conservative targets (1.5-2 × ATR)
Quick exit if trade doesn't work immediately
You're fading momentum — respect it
Low TCS + Reversal Trade (Safer) :
Use wider stops (2.0-2.5 × ATR)
Aggressive targets (3-4 × ATR)
Trail with patience
Genuine reversal potential in weak trend
High TCS + Continuation Trade (Safest) :
Standard stops (1.5-2.0 × ATR)
Very aggressive targets (4-5 × ATR)
Trail wide (1.5-2.0 × ATR)
You're with institutional momentum — let it run
Educational Value — Learning Machine Intelligence
BZ-CAE is designed as a learning platform, not just a tool:
Advisory Mode as Teacher
Most indicators are binary: signal or no signal. You don't learn WHY certain setups are better.
BZ-CAE's Advisory mode shows you EVERY potential divergence, then annotates the ones that would be blocked in Filtering mode with specific reasons:
"Bull: strong downtrend (TCS=0.87)" teaches you that TCS >0.85 makes counter-trend very risky
"Adversarial bearish" teaches you that the opposing case was dominating
"Low confidence 32%" teaches you that the setup lacked quality across multiple factors
"Bull spacing: wait 8 bars" teaches you that signals need breathing room
After 50-100 signals in Advisory mode, you internalize the CAE's decision logic. You start seeing these factors yourself BEFORE the indicator does.
Dashboard Transparency
Most "intelligent" indicators are black boxes — you don't know how they make decisions.
BZ-CAE shows you ALL metrics in real-time:
TCS tells you trend strength
DMA tells you momentum alignment
Exhaustion tells you overextension
Adversarial shows both sides of the debate
Confidence shows composite quality
You learn to interpret market state holistically, a skill applicable to ANY trading system beyond this indicator.
Divergence Quality Education
Not all divergences are equal. BZ-CAE teaches you which conditions produce high-probability setups:
Quality divergence : Regular bullish div at a low, TCS <0.50 (weak trend), exhaustion >0.75 (overextended), positive adversarial differential, confidence >0.70
Low-quality divergence : Regular bearish div at a high, TCS >0.85 (strong uptrend), exhaustion <0.30 (not overextended), negative adversarial differential, confidence <0.40
After using the system, you can evaluate divergences manually with similar intelligence.
Risk Management Discipline
Confidence-based position sizing teaches you to adjust risk based on setup quality, not emotions:
Beginners often size all trades identically
Or worse, size UP on marginal setups to "make up" for losses
BZ-CAE forces systematic sizing: premium setups get larger size, marginal setups get smaller size
This creates a probabilistic approach where your edge compounds over time.
What This Indicator Is NOT
Complete transparency about limitations and positioning:
Not a Prediction System
BZ-CAE does not predict future prices. It identifies structural divergences (price-momentum disagreements) and assesses current market state (trend, exhaustion, adversarial conditions). It tells you WHEN conditions favor a potential reversal or continuation, not WHAT WILL HAPPEN.
Markets are probabilistic. Even premium-confidence setups fail ~30-40% of the time. The system improves your probability distribution over many trades — it doesn't eliminate risk.
Not Fully Automated
This is a decision support tool, not a trading robot. You must:
Execute trades manually based on signals
Manage positions (stops, targets, trailing)
Apply discretionary judgment (news events, liquidity, context)
Integrate with your broader strategy and risk rules
The confidence scores guide position sizing, but YOU determine final risk allocation based on your account size, risk tolerance, and portfolio context.
Not Beginner-Friendly
BZ-CAE requires understanding of:
Divergence trading concepts (regular vs hidden, reversal vs continuation)
Market state interpretation (trend vs range, momentum, exhaustion)
Basic technical analysis (pivots, support/resistance, EMAs)
Risk management fundamentals (position sizing, stops, R:R)
This is designed for intermediate to advanced traders willing to invest time learning the system. If you want "buy the arrow" simplicity, this isn't the tool.
Not a Holy Grail
There is no perfect indicator. BZ-CAE filters noise and improves signal quality significantly, but:
Losing trades are inevitable (even at 70% win rate, 30% still fail)
Market conditions change rapidly (yesterday's strong trend becomes today's chop)
Black swan events occur (fundamentals override technicals)
Execution matters (slippage, fees, emotional discipline)
The system provides an EDGE, not a guarantee. Your job is to execute that edge consistently with proper risk management over hundreds of trades.
Not Financial Advice
BZ-CAE is an educational and analytical tool. All trading decisions are your responsibility. Past performance (backtested or live) does not guarantee future results. Only risk capital you can afford to lose. Consult a licensed financial advisor for investment advice specific to your situation.
Ideal Market Conditions
Best Performance Characteristics
Liquid Instruments :
Major forex pairs (EUR/USD, GBP/USD, USD/JPY)
Large-cap stocks and index ETFs (SPY, QQQ, AAPL, MSFT)
High-volume crypto (BTC, ETH)
Major commodities (Gold, Oil, Natural Gas)
Reasoning: Clean price structure, clear pivots, meaningful oscillator behavior
Trending with Consolidations :
Markets that trend for 20-40 bars, then consolidate 10-20 bars, repeat
Creates divergences at consolidation boundaries (reversals) and within trends (continuations)
Both regular and hidden divs find opportunities
5-Minute to Daily Timeframes :
Below 5m: too much noise, false pivots, CAE metrics unstable
Above daily: too few signals, edge diminishes (fundamentals dominate)
Sweet spot: 15m to 4H for most traders
Consistent Volume and Participation :
Regular trading sessions (not holidays or thin markets)
Predictable volatility patterns
Avoid instruments with sudden gaps or circuit breakers
Challenging Conditions
Extremely Low Liquidity :
Penny stocks, exotic forex pairs, low-volume crypto
Erratic pivots, unreliable oscillator readings
CAE metrics can't assess market state properly
Very Low Timeframes (1-Minute or Below) :
Dominated by market microstructure noise
Divergences are everywhere but meaningless
CAE filtering helps but still unreliable
Extended Sideways Consolidation :
100+ bars of tight range with no clear pivots
Oscillator hugs midpoint (45-55 range)
No divergences to detect
Fundamentally-Driven Gap Markets :
Earnings releases, economic data, geopolitical events
Price gaps over stops and targets
Technical structure breaks down
Recommendation: Disable trading around known events
Calculation Methodology — Technical Depth
For users who want to understand the math:
Oscillator Computation
Each oscillator type calculates differently, but all normalize to 0-100:
RSI : ta.rsi(close, length) — Standard Relative Strength Index
Stochastic : ta.stoch(high, low, close, length) — %K calculation
CCI : (ta.cci(hlc3, length) + 100) / 2 — Normalized from -100/+100 to 0-100
MFI : ta.mfi(hlc3, length) — Volume-weighted RSI equivalent
Williams %R : ta.wpr(length) + 100 — Inverted stochastic adjusted to 0-100
Smoothing: If smoothing > 1, apply ta.sma(oscillator, smoothing)
Divergence Detection Algorithm
Identify Pivots :
Price high pivot: ta.pivothigh(high, lookback, lookforward)
Price low pivot: ta.pivotlow(low, lookback, lookforward)
Oscillator high pivot: ta.pivothigh(osc, lookback, lookforward)
Oscillator low pivot: ta.pivotlow(osc, lookback, lookforward)
Store Recent Pivots :
Maintain arrays of last 10 pivots with bar indices
When new pivot confirmed, unshift to array, pop oldest if >10
Scan for Slope Disagreements :
Loop through last 5 pivots
For each pair (current pivot, historical pivot):
Check if within max_lookback bars
Calculate slopes: (current - historical) / bars_between
Regular bearish: price_slope > 0, osc_slope < 0, |osc_slope| > min_threshold
Regular bullish: price_slope < 0, osc_slope > 0, |osc_slope| > min_threshold
Hidden bearish: price_slope < 0, osc_slope > 0, osc_slope > min_threshold
Hidden bullish: price_slope > 0, osc_slope < 0, |osc_slope| > min_threshold
Important Disclaimers and Terms
Performance Disclosure
Past performance, whether backtested or live-traded, does not guarantee future results. Markets change. What works today may not work tomorrow. Hypothetical or simulated performance results have inherent limitations and do not represent actual trading.
Risk of Loss
Trading involves substantial risk of loss. Only trade with risk capital you can afford to lose entirely. The high degree of leverage often available in trading can work against you as well as for you. Leveraged trading may result in losses exceeding your initial deposit.
Not Financial Advice
BZ-CAE is an educational and analytical tool for technical analysis. It is not financial advice, investment advice, or a recommendation to buy or sell any security or instrument. All trading decisions are your sole responsibility. Consult a licensed financial advisor for advice specific to your circumstances.
Technical Indicator Limitations
BZ-CAE is a technical analysis tool based on price and volume data. It does not account for:
Fundamental analysis (earnings, economic data, financial health)
Market sentiment and positioning
Geopolitical events and news
Liquidity conditions and market microstructure changes
Regulatory changes or exchange rules
Integrate with broader analysis and strategy. Do not rely solely on technical indicators for trading decisions.
Repainting Acknowledgment
As disclosed throughout this documentation:
Realtime mode may repaint on forming bars before confirmation (by design for preview functionality)
Confirmed mode has zero repainting (fully validated pivots only)
Choose timing mode appropriate for your use case. Understand the tradeoffs.
Testing Recommendation
ALWAYS test on demo/paper accounts before committing real capital. Validate the indicator's behavior on your specific instruments and timeframes. Learn the system thoroughly in Advisory mode before using Filtering mode.
Learning Resources :
In-indicator tooltips (hover over setting names for detailed explanations)
This comprehensive publishing statement (save for reference)
User guide in script comments (top of code)
Final Word — Philosophy of BZ-CAE
BZ-CAE is not designed to replace your judgment — it's designed to enhance it.
The indicator identifies structural inflection points (bifurcations) where price and momentum disagree. The Cognitive Engine evaluates market state to determine if this disagreement is meaningful or noise. The Adversarial model debates both sides of the trade to catch obvious bad setups. The Confidence system ranks quality so you can choose your risk appetite.
But YOU still execute. YOU still manage risk. YOU still learn from outcomes.
This is intelligence amplification, not intelligence replacement.
Use Advisory mode to learn how expert traders evaluate market state. Use Filtering mode to enforce discipline when emotions run high. Use the dashboard to develop a systematic approach to reading markets. Use confidence scores to size positions probabilistically.
The system provides an edge. Your job is to execute that edge with discipline, patience, and proper risk management over hundreds of trades.
Markets are probabilistic. No system wins every trade. But a systematic edge + disciplined execution + proper risk management compounds over time. That's the path to consistent profitability. BZ-CAE gives you the edge. The discipline and risk management are on you.
Taking you to school. — Dskyz, Trade with insight. Trade with anticipation.

CandelaCharts - Trend Concepts 📝 Overview
Trend Concepts is a comprehensive trend analysis toolkit that combines four powerful components to identify market direction, strength, and trading opportunities.
The indicator features Bias Magnet —an adaptive baseline that tracks trend direction with dynamic strength visualization and momentum polarity bars. Flux Trend uses ATR-based bands with gradient-filled zones to mark trend reversals and continuation exits. Surge Waves applies a two-pole filter to detect sustained momentum runs and highlight strong directional moves. Velocity Bands creates dynamic deviation-based support and resistance levels with re-entry and rejection signals for mean reversion and reversal setups.
Each component operates independently, allowing you to build a custom trend analysis system tailored to your trading style. The integrated dashboard provides real-time market context through trend consensus (majority vote from enabled components), ADX strength, volatility analysis, volume trends, and momentum indicators. Trading profiles automatically optimize all component parameters for Scalping, Intraday, Swing, or Investment strategies, while Custom mode gives you full manual control. Multiple color themes and comprehensive alert options make this a complete solution for trend-following traders across all timeframes.
📦 Features
This section highlights the core capabilities you'll rely on most.
Bias Magnet — Adaptive baseline that hugs price without whipsaws, using half-trend style logic. Calculates trend strength (0–100) from slope and momentum, displays dynamic line transparency based on intensity, and provides flip signals (▲/▼) when trend changes. Includes polarity bars (☰) that show MFI-based momentum direction with intensity-based transparency.
Flux Trend — ATR-based trend bands that flip between bullish and bearish regimes. Creates gradient-filled zones between main and secondary bands, marks trend flips with symbols (✦/❖) and connecting lines, and detects exit signals when price leaves the zone after touching it. Ideal for identifying trend reversals and continuation setups.
Surge Waves — Two-pole filter that smooths price action and detects sustained momentum runs. Tracks consecutive rising or falling bars, marks sustained runs (5+ bars) with shapes, and provides confirmation signals when runs begin. The filled tube envelope provides visual context for momentum direction and strength.
Velocity Bands — Dynamic deviation-based bands that adapt to market conditions. Uses outlier-filtered standard deviation to create +1/+2 and -1/-2 bands around a weighted moving average. Detects re-entry signals when price returns from extreme zones and rejection signals when price enters bands but fails to hold. Enhanced gradient fills highlight when price is outside bands.
Trading Profiles — Pre-configured settings that automatically adjust component parameters: Scalping (fast, responsive), Intraday (balanced), Swing (slower, stable), Investment (long-term focus), or Custom (manual control). Profiles optimize Flux Trend length, Surge Waves length, and Velocity Bands deviation period for your trading style.
Dashboard — Real-time market analysis panel showing ticker, timeframe, active profile, trend direction (majority vote from enabled components), ADX strength (0–100), volatility state (High/Normal/Low based on ATR), volume trend (Bullish/Bearish/Neutral), and momentum (RSI-based). Color-coded for quick visual assessment.
Color Themes — Choose from 8 preset themes (Default, Blue-Orange, Green-Orange, Teal-Fuchsia, Aqua-Purple, Black-Green, Black-Aqua, Black-White) or create a custom color scheme. Themes apply consistently across all components for a cohesive visual experience.
Alerts — Individual alert toggles for each component's key signals: Bias Magnet flips (bull/bear), Flux Trend flips (bull/bear), Surge Waves sustained runs (bull/bear), Velocity Bands re-entries (bull/bear), and Velocity Bands rejections (bull/bear). All alerts include the symbol and timeframe in the message.
⚙️ Settings
Use these controls to customize the indicator's appearance, behavior, and component parameters.
Theme — Select a color theme: Default, Blue-Orange, Green-Orange, Teal-Fuchsia, Aqua-Purple, Black-Green, Black-Aqua, Black-White, or Custom. When Custom is selected, use the three color inputs below.
Trading Profile — Select your trading style: Scalping (fast, 30/30/300), Intraday (balanced, 50/50/500), Swing (slower, 80/70/800), Investment (long-term, 100/100/1200), or Custom (use manual component inputs). Profiles automatically adjust Flux Trend length, Surge Waves length, and Velocity Bands deviation period.
Bias Magnet — Enable/disable the adaptive baseline component. Amplitude controls the sensitivity (default: 5, higher = more responsive). Polarity Bars toggles the MFI-based momentum indicators (☰) that appear above/below the baseline.
Flux Trend — Enable/disable the ATR-based trend bands. Length sets the SMA period for the baseline (default: 60, only used in Custom profile). Bands Distance controls the ATR multiplier for band width (default: 3.0, higher = wider bands).
Surge Waves — Enable/disable the two-pole filter component. Length sets the filter period (default: 50, only used in Custom profile). Tube Width controls the ATR multiplier for the filled envelope width (default: 0.14, higher = wider tube).
Velocity Bands — Enable/disable the deviation-based bands. Deviation Length sets the period for standard deviation calculation (default: 500, only used in Custom profile). Higher values create more stable but slower-adapting bands.
Dashboard — Toggle to show/hide the integrated market analysis panel in the middle-right of the chart.
⚡️ Showcase
Bias Magnet
Flux Trend
Surge Waves
Velocity Bands
Dashboard
📒 Usage
Follow these steps to effectively use Trend Concepts for trend analysis and trading decisions.
1) Select your trading profile — Choose the profile that matches your trading style: Scalping for fast intraday trades, Intraday for day trading, Swing for multi-day positions, or Investment for long-term holds. The profile automatically optimizes all component parameters. Use Custom only if you need specific manual settings.
2) Enable components strategically — Start with one or two components to avoid visual clutter. Enable the dashboard to see the overall trend consensus.
3) Interpret Bias Magnet — The adaptive baseline shows trend direction: below price = bullish (acts as support), above price = bearish (acts as resistance). Line transparency indicates trend strength (darker = stronger). Watch for ▲ (bullish flip) and ▼ (bearish flip) signals. Polarity bars (☰) show momentum direction: above baseline = bullish momentum, below = bearish momentum. Intensity of bars reflects momentum strength.
4) Use Flux Trend for reversals — The gradient-filled zones between bands act as support (bullish) or resistance (bearish). Trend flips are marked with ✦ (bull to bear) or ❖ (bear to bull) symbols. Exit signals (✦/❖ outside bands) indicate when price leaves the zone after touching it, suggesting continuation. Trade flips for reversals or exits for continuations.
5) Track Surge Waves momentum — The filled tube shows momentum direction (green = bullish, red = bearish). Sustained runs of 5+ consecutive bars in one direction are marked with shapes (square = rising, diamond = falling). Confirmation signals appear when runs begin. Use these to identify strong momentum moves and potential continuation setups.
6) Trade Velocity Bands extremes — Price beyond +2/-2 bands indicates extreme conditions. Re-entry signals (▼ from above, ▲ from below) suggest mean reversion opportunities. Rejection signals occur when price enters a band but fails to hold, indicating potential reversals. The enhanced gradient fills highlight when price is outside bands, drawing attention to extreme moves.
7) Use dashboard for context — The dashboard provides a quick market snapshot. Trend shows the majority vote from enabled components (useful when multiple components disagree). Strength (ADX) indicates trend quality: < 20 = weak, 20–40 = moderate, ≥ 40 = strong. Volatility, Volume, and Momentum help assess market conditions before entering trades.
8) Combine components for confirmation — When multiple components agree on trend direction, confidence increases. For example, if Bias Magnet flips bullish, Flux Trend is in bull mode, and Surge Waves shows rising momentum, you have strong confirmation. Divergences between components can signal potential reversals or weak trends.
9) Set up alerts strategically — Enable alerts for the components you actively trade. Bias Magnet and Flux Trend alerts catch trend changes early. Surge Waves alerts identify momentum shifts. Velocity Bands alerts catch mean reversion and rejection setups. Use alerts to monitor multiple charts without constant watching.
10) Adjust for your timeframe — Higher timeframes (daily, weekly) provide more reliable signals but fewer opportunities. Lower timeframes (15m, 1h) offer more signals but require faster decisions. Consider using a higher timeframe profile (e.g., Swing) on lower timeframes for more stable signals, or a lower timeframe profile (e.g., Scalping) on higher timeframes for more responsive signals.
🚨 Alerts
Trend Concepts provides comprehensive alert options for each component's key signals. Alerts fire once per bar close to avoid spam.
Bias Magnet Alerts
BM Bull — Triggers when Bias Magnet trend flips to bullish (baseline crosses above price and confirms).
BM Bear — Triggers when Bias Magnet trend flips to bearish (baseline crosses below price and confirms).
Flux Trend Alerts
FT Bull — Triggers when Flux Trend flips from bearish to bullish (price crosses above upper band).
FT Bear — Triggers when Flux Trend flips from bullish to bearish (price crosses below lower band).
Surge Waves Alerts
SW Bull — Triggers when Surge Waves detects a sustained rising run (5+ consecutive bars rising, confirmed on bar close).
SW Bear — Triggers when Surge Waves detects a sustained falling run (5+ consecutive bars falling, confirmed on bar close).
Velocity Bands Alerts
VB Re-entry Bull — Triggers when price re-enters Velocity Bands from below the lower -2 band (bullish mean reversion signal).
VB Re-entry Bear — Triggers when price re-enters Velocity Bands from above the upper +2 band (bearish mean reversion signal).
VB Rejection Bull — Triggers when price enters the lower band but rejects back above it (bullish reversal signal).
VB Rejection Bear — Triggers when price enters the upper band but rejects back below it (bearish reversal signal).
⚠️ Disclaimer
These tools are exclusively available on the TradingView platform.
Our charting tools are intended solely for informational and educational purposes and should not be regarded as financial, investment, or trading advice. They are not designed to predict market movements or offer specific recommendations. Users should be aware that past performance is not indicative of future results and should not rely on these tools for financial decisions. By using these charting tools, the purchaser agrees that the seller and creator hold no responsibility for any decisions made based on information provided by the tools. The purchaser assumes full responsibility and liability for any actions taken and their consequences, including potential financial losses or investment outcomes that may result from the use of these products.
By purchasing, the customer acknowledges and accepts that neither the seller nor the creator is liable for any undesired outcomes stemming from the development, sale, or use of these products. Additionally, the purchaser agrees to indemnify the seller from any liability. If invited through the Friends and Family Program, the purchaser understands that any provided discount code applies only to the initial purchase of Candela's subscription. The purchaser is responsible for canceling or requesting cancellation of their subscription if they choose not to continue at the full retail price. In the event the purchaser no longer wishes to use the products, they must unsubscribe from the membership service, if applicable.
We do not offer reimbursements, refunds, or chargebacks. Once these Terms are accepted at the time of purchase, no reimbursements, refunds, or chargebacks will be issued under any circumstances.
By continuing to use these charting tools, the user confirms their understanding and acceptance of these Terms as outlined in this disclaimer.

Enhanced Multi-Indicator StrategyEnhanced Multi-Indicator Strategy v7 is a trend-following confirmation tool that combines several classic indicators into one clear “voting system.”
Instead of relying on a single signal, this script counts how many indicators agree on a bullish or bearish bias and only fires when the majority lines up and the trend is strong.
It’s designed to help you:
Filter out low-quality signals
Avoid trading against the dominant trend
Get clean, one-time BUY/SELL markers instead of noisy spam signals
How it Works
The indicator evaluates up to 10 components on each bar:
Trend & Structure
Moving Average (MA 50)
EMA Fast (20) vs EMA Slow (50)
Momentum
RSI (14)
MACD (12/26/9)
KDJ
Volatility & Price Location
Bollinger Bands (20, 2)
VWAP
Volume
Volume vs Volume MA (20)
Trend Strength & Direction
ADX + DMI (trend strength and up/down direction)
Optional
Ichimoku Cloud (price vs Senkou A/B)
Each indicator votes bullish or bearish.
The script then:
Counts how many are bullish → bullish_count
Counts how many are bearish → bearish_count
Requires at least Min Indicators for Entry (user-defined) to agree in one direction
Requires ADX above a threshold (default 20) to confirm trend strength
(Optionally) forces entries to follow the DMI trend:
Longs only in uptrends
Shorts only in downtrends
Only when these conditions are met does the script consider a valid long zone or short zone.
Signals: 1x Fire + Cooldown
To keep the chart clean and prevent over-trading:
A BUY arrow is plotted only on the first bar when price enters a new bullish zone.
A SELL arrow is plotted only on the first bar when price enters a new bearish zone.
A cooldown (in bars) can be configured separately for BUY and SELL so the script will not fire again in the same direction too frequently.
Background colors (optional):
Green background = bullish zone (majority indicators bullish + strong trend)
Red background = bearish zone (majority indicators bearish + strong trend)
This makes it easy to see when the “environment” is favorable for longs or shorts, while the arrows highlight the first opportunity in each zone.
Inputs & Tuning
Key inputs:
Min Indicators for Entry – how many indicators must agree (e.g. 5–7 for stricter filtering)
Strict Trend Filter – if enabled, entries must follow DMI trend (recommended for trend-following)
Cooldown BUY / SELL – minimum number of bars before a new signal in the same direction
Toggles to enable/disable each component (MA, EMA, RSI, MACD, KDJ, BB, Volume, VWAP, ADX, Ichimoku)
General ideas:
Increase Min Indicators for Entry and/or cooldown to reduce the number of signals and focus on stronger trends.
Lower values will make the indicator more active, suitable for shorter-term trading or scalping.
Important Note
This is an indicator, not a full trading system:
It does not manage entries/exits, position sizing, or risk by itself.
Always combine it with your own risk management, stop-loss / take-profit rules, and higher-timeframe context.
Use it as a confirmation / regime tool:
Trade only in the direction of the active zone,
Take BUY signals during bullish regimes,
Take SELL signals during bearish regimes.

Breakout Structure SignalsBreakout Structure Signals
Trend-following Donchian breakouts with optional retests, HTF trend filter, volume & ADX gates, and one-signal-per-direction control.
What it does
Prints LONG / SHORT when price breaks the prior Donchian High/Low and/or makes a qualified retest of that level.
Works with trend via EMAs on the chart TF; optional HTF EMA filter confirms higher-timeframe bias.
Optional Volume and ADX filters, plus soft candle-quality checks.
Signals confirm on bar close (no intrabar repaint on your chart TF). Duplicate signals can be suppressed until direction flips.
Core logic
Breakout Long: close > DonchianHigh AND EMAfast > EMAslow AND close > EMAslow .
Breakout Short: close < DonchianLow AND EMAfast < EMAslow AND close < EMAslow .
Retest (optional): after breakout, wait up to maxBarsWait for a pullback within ATR × retestTolATR around the breakout level; price must also align with the fast EMA (above for longs, below for shorts).
Filters (optional): Volume > SMA20 × volMult , ADX > 20 , candle-quality: close position within range ≥ closePosMin and body/range ≥ impulseBodyMin .
HTF trend (optional): Longs require HTF EMAfast > HTF EMAslow ; shorts require the opposite (via request.security on htf_tf ).
Inputs (key)
lengthRange — Donchian N (high/low lookback).
emaFastLen , emaSlowLen — chart-TF trend filter.
useVolumeFilt , volMult — volume gate (turn OFF where volume is unreliable).
useRetest , retestTolATR , maxBarsWait — retest behavior & tolerance.
useADX , adxLen — trend-strength filter.
useHTF , htf_tf , htfEmaFastLen , htfEmaSlowLen — higher-TF confirmation.
useCandleQual , closePosMin , impulseBodyMin — soft candle-quality checks.
confirmOnClose — confirm signals on close.
suppressSameSide — block repeats until reversal.
showBg — background highlight on signal bars.
Visuals
Plots: EMA Fast , EMA Slow , Donchian High/Low .
Markers: triangle LONG below bars, triangle SHORT above bars.
Optional background tint on signal bars.
Alerts
LONG signal — breakout or qualified retest (long).
SHORT signal — breakout or qualified retest (short).
How to use
Start with Donchian 20 , EMA 20/50 ; for LTF trading, consider HTF = 60m/240m.
Retests: try 0.3–0.6 ATR tolerance and 8–12 bars wait for cleaner fills.
Stops: beyond breakout/retest by 1–1.5 ATR or beyond fast EMA; manage with partials and a trailing exit.
Turn Volume filter OFF where volume isn’t informative.
This indicator provides signals only; always combine with risk management.
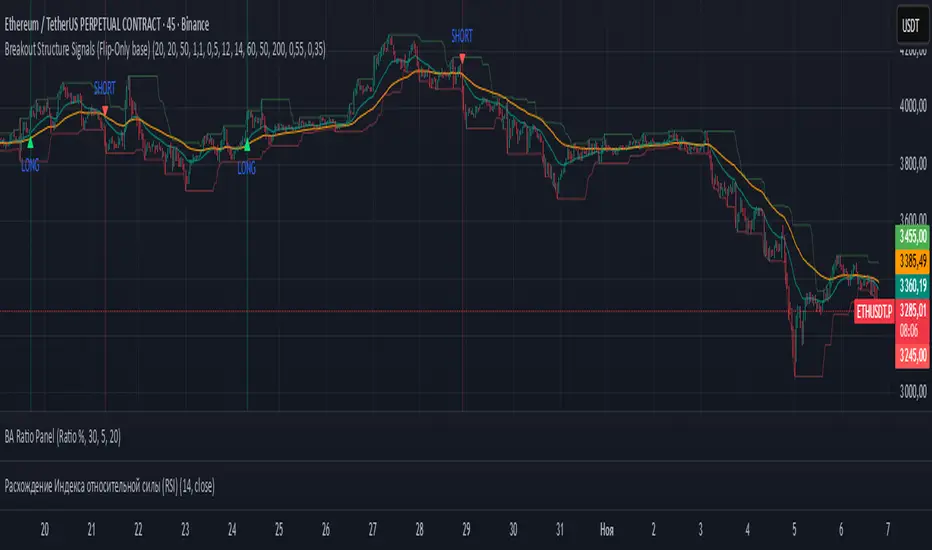
Volume Area 80 Rule Pro - Adaptive RTHSummary in one paragraph
Adaptive value area 80 percent rule for index futures large cap equities liquid crypto and major FX on intraday timeframes. It focuses activity only when multiple context gates align. It is original because the classic prior day value area traverse is fused with a daily regime classifier that remaps the operating parameters in real time.
Scope and intent
• Markets. ES NQ SPY QQQ large cap equities BTC ETH major FX pairs and other liquid RTH instruments
• Timeframes. One minute to one hour with daily regime context
• Default demo used in the publication. ES1 on five minutes
• Purpose. Trade only the balanced days where the 80 percent traverse has edge while standing aside or tightening rules during trend or shock
Originality and usefulness
• Unique fusion. Prior day value area logic plus a rolling daily regime classifier using percentile ranks of realized volatility and ADX. The regime remaps hold time end of window stop buffer and value area coverage on each session
• Failure mode addressed. False starts during strong trend or shock sessions and weak traverses during quiet grind
• Testability. All gates are visible in Inputs and debug flags can be plotted so users can verify why a suggestion appears
• Portable yardstick. The regime uses ATR divided by close and ADX percent ranks which behave consistently across symbols
Method overview in plain language
The script builds the prior session profile during regular trading hours. At the first regular bar it freezes yesterday value area low value area high and point of control. It then evaluates the current session open location the first thirty minute volume rank the open gap rank and an opening drive test. In parallel a daily series classifies context into Calm Balance Trend or Shock from rolling percentile ranks of realized volatility and ADX. The classifier scales the rules. Calm uses longer holds and a slightly wider value area. Trend and Shock shorten the window reduce holds and enlarge stop buffers.
Base measures
• Range basis. True Range smoothed over a configurable length on both the daily and intraday series
• Return basis. Not required. ATR over close is the unit for regime strength
Components
• Prior Value Area Engine. Builds yesterday value area low value area high and point of control from a binned volume profile with automatic TPO fallback and minimum integrity guards
• Opening Location. Detects whether the session opens above the prior value area or below it
• Inside Hold Counter. Counts consecutive bars that hold inside the value area after a re entry
• Volume Gate. Percentile of the first thirty minutes volume over a rolling sample
• Gap Gate. Percentile rank of the regular session open gap over a rolling sample
• Drive Gate. Opening drive check using a multiple of intraday ATR
• Regime Classifier. Percentile ranks of daily ATR over close and daily ADX classify Calm Balance Trend Shock and remap parameters
• Session windows optional. Windows follow the chart exchange time
Fusion rule
Minimum satisfied gates approach. A re entry must hold inside the value area for a regime scaled number of bars while the volume gap and drive gates allow the setup. The regime simultaneously scales value area coverage end minute time stop and stop buffer.
Signal rule
• Long suggestion appears when price opens below yesterday value area then re enters and holds for the required bars while all gates allow the setup
• Short suggestion appears when price opens above yesterday value area then re enters and holds for the required bars while all gates allow the setup
• WAIT shows implicitly when any required gate is missing
• Exit labels mark target touch stop touch or a time based close
Inputs with guidance
Setup
• Signal timeframe. Uses the chart by default
• Session windows optional. Start and end minutes inside regular trading hours
• Invert direction is not used. The logic is symmetric
Logic
• Hold bars inside value area. Typical range 3 to 12. Raising it reduces trades and favors better traverses. Lowering it increases frequency and risk of false starts
• Earliest minute since RTH open and Latest minute since RTH open. Typical range 0 to 390. Reducing the latest minute cuts late session trades
• Time stop bars after entry. Typical range 6 to 30. Larger values give setups more room
Filters
• Value area coverage. Typical range 0.70 to 0.85. Higher coverage narrows the traverse but accepts fewer days
• Bin size in ticks. Typical range 1 to 8. Larger bins stabilize noisy profiles
• Stop buffer ticks beyond edge. Typical range 2 to 20. Larger buffers survive noise
• First thirty minute volume percentile. Typical range 0.30 to 0.70. Higher values require more active opens
• Gap filter percentile. Typical range 0.70 to 0.95. Lower values block more gap days
• Opening drive multiple and bars. Higher multiple or longer bars block strong directional opens
Adaptivity
• Lookback days for regime ranks. Typical 150 to 500
• Calm RV percentile. Typical 25 to 45
• Trend ADX percentile. Typical 55 to 75
• Shock RV percentile. Typical 75 to 90
• End minute ratio in Trend and Shock. Typical 0.5 to 0.8
• Hold and Time stop scales per regime. Use values near one to keep behavior close to static settings
Realism and responsible publication
• No performance claims. Past results never guarantee future outcomes
• Shapes can move while a bar forms and settle on close
• Sessions use the chart exchange time
Honest limitations and failure modes
• Economic releases and thin liquidity can break the balance premise
• Gap heavy symbols may work better with stronger gap filters and a True Range focus
• Very quiet regimes reduce signal contrast. Consider longer windows or higher thresholds
Legal
Education and research only. Not investment advice. Test in simulation before any live use.

量价策略信号+K线pinbar+波动率出场+市场结构【梦喂马】v3Part 1: Indicator Module Explained (Code Analysis and Function Description)
Module 1: Master Switches
This is your "dashboard master control." Due to the numerous indicator functions, charts can appear cluttered. Here, you can easily turn each major function module on or off, allowing you to focus on the information you need most.
- Suggested Usage: When using it for the first time, you can start by only turning on the Vegas Channel and Core Entry Signals to familiarize yourself with the system's main trend judgment and entry logic. Then gradually turn on other modules to experience how they work together.
Module 2: Core Entry Signals (Long/Short Signals)
This is the "engine" of the entire system, responsible for generating the highest quality trend-following trading signals. The appearance of a "long" or "short" signal represents the resonance of multiple indicators, satisfying extremely stringent filtering conditions:
- 1. Vegas Channel Filtering:
- When going long, the price must be above the slow channel (576/676 EMA) and the fast channel (21/55 EMA).
- When shorting, the price must break below both the slow and fast channels.
- Interpretation: This ensures your trading direction is perfectly aligned with the medium- to long-term macro trend.
- 2. Alligator Line Confirmation:
- When going long, the price must be above the alligator lines (lips, teeth, jaws), and the alligator lines must be in a bullish alignment (opening upwards).
- When shorting, the opposite applies.
- Interpretation: This confirms that short-term momentum aligns with the long-term trend, avoiding hasty entry at the start or end of a trend.
- 3. OBV (On-Balance Volume) Filter:
- When going long, the OBV value must be above its own moving average (default 34 periods).
- When shorting, the OBV value must be below its moving average.
- Interpretation: OBV is a key indicator measuring fund inflows and outflows. This condition ensures that trading volume (funds) is supporting your trading direction.
- 4. ADX Trend Strength Filter:
- Whether going long or short, the ADX value must be greater than the set threshold (default 20).
- Interpretation: This is a crucial "insurance" layer. It helps filter out volatile market conditions with no clear direction, prone to repeated "misjudgments." We only act in markets with clear and strong trends.
Core Usage: Once a "long"/"short" signal appears, it represents a high-certainty trend-following trading opportunity. Due to the very strict nature of the signals, they appear infrequently, but each one deserves your close attention.
Module Three: Vegas Channel & Alligator Line (Trend Judgment Tool)
- Vegas Channel: Composed of two sets of EMAs.
- Slow Channel (576/676): Your "bull/bear dividing line." Above this line, only consider going long; below this line, only consider going short. It is your strategic compass.
- Fast Channel (21/55): Your "short-term momentum line." In an uptrend, price pullbacks to the vicinity of the fast channel are potential areas for adding to positions or entering.
- Alligator Line:
- Widening divergence: Indicates that a trend is underway.
- Convergence/Entanglement: Indicates the market is dormant or consolidating.
- Interpretation: Alligator lines allow you to visually see whether the market is in a "trending" or "consolidating" state. We primarily trade when the alligator lines widen.
Module Four: R/C Volume-Price Signals (Refined Entry/Warning Signals)
This is the system's "special forces," specifically designed to identify abnormal volume and price movements on key candlesticks. It is divided into the R series (Reversal) and the C series (Continuation).
- Prerequisites: All signals are based on trading volume. A signal's appearance must be accompanied by a significantly higher-than-average trading volume (increased volume). This indicates large capital participation at that price level, making the signal more reliable.
- R Series - Trend Reversal Signals (Warning/Opportunity):
- R1 (Core Reversal): In a downtrend, a sudden increase in volume on a bullish candlestick; or in an uptrend, an increase in volume on a bearish candlestick.
- Interpretation: This is the most basic reversal warning signal. It tells you that counter-trend forces are emerging, but it doesn't mean the trend will immediately reverse. Confirmation needs to be combined with other signals.
- R2 (Pattern Confirmation): In addition to R1, this candlestick must also be a well-defined Pin Bar (a bullish Pin Bar with a long lower shadow, or a bearish Pin Bar with a long upper shadow).
- Interpretation: This is a more reliable reversal signal. The Pin Bar pattern represents a strong rejection of the price after an attempt to break through; combined with increased volume, this indicates strong reversal momentum.
- R3 (Top Momentum): In addition to R2, the trading volume reaches a "massive" level (default is more than 4 times the average volume).
- Interpretation: This is the highest level reversal signal. It usually appears at the end of a trend, representing the extreme struggle and conversion of bullish and bearish forces, and is a potential sign of a "V-shaped reversal" or a deep V-bottom/top.
- C Series - Trend Continuation/Termination Signals:
- C0 (Trend Continuation): In a clear uptrend, a bearish Pin Bar (long upper shadow) with increased volume appears during a price pullback; or in a downtrend, a bullish Pin Bar (long lower shadow) with increased volume appears during a rebound.
- Interpretation: This is a classic "buy on pullback/sell on rebound" signal. It indicates that the pullback/rebound attempt to counterattack is quickly suppressed by the strong main trend, making it an excellent entry point for adding to positions or following the trend.
- CX (Exhaustion Signal): A C-series signal that appears when the price has moved far away from the slow Vegas Channel (default more than 5 times the ATR distance).
- Interpretation: This is an advanced use of the C-series. After a trend has run for a long time, market sentiment may be overly enthusiastic. The high-volume PinBar appearing at this time, while trend-following in form, is more likely to represent the exhaustion or "final frenzy" of the trend. This is an alert that the trend may be running out of momentum, and you should consider taking profits in batches rather than adding to your position.
Signal Priority: This indicator has been internally optimized: CX/R3 > R2 > C0 > R1. Higher-level signals will override lower-level signals, ensuring you see the most important information at the moment.
Module 5: Chandelier Exit - Dynamic Risk Management
This is a dynamic stop-loss system based on ATR (Average True Range).
- How it works:
- In an uptrend, it subtracts N times the ATR from the recent high, forming a stepped upward stop-loss line.
- In a downtrend, it adds N times the ATR from the recent low, forming a stepped downward stop-loss line.
- Core advantages: It automatically adjusts the stop-loss distance based on market volatility. During periods of high market volatility, the stop-loss widens, giving you more room; during periods of market stability, the stop-loss tightens, locking in profits more quickly.
- Usage:
- As an initial stop-loss: After entering a position, the stop-loss can be set outside the Chandelier line.
- As a trailing stop: The position is held as long as the price does not fall below (uptrend) or rise above (downtrend) the Chandelier line. This is a powerful tool for "letting profits run."
- As an auxiliary trend indicator: The direction of the chandelier line (upward/downward) also provides a concise short-term trend perspective.
Module Six: Candlestick Coloring
This feature is very intuitive; it colors candlesticks based on volume:
- High Volume (Orange): Volume exceeds twice the average volume.
- Huge Volume (Red): Volume exceeds four times the average volume.
- Usage: Helps you identify key candlesticks indicating significant market events at a glance, typically the start, acceleration, reversal, or exhaustion points of a trend.
Module Seven: ICT Market Structure
This is an advanced price behavior analysis tool based on ICT (Inner Circle Trader) theory, helping you understand the market's "skeleton."
- Core Concepts:
- Swing High/Low: Local tops and bottoms in market prices.
- BOS (Break of Structure): In an uptrend, the price creates a higher high than the previous swing high; in a downtrend, it creates a lower low.
- Interpretation: BOS (Bullish Oscillator) is a confirmation signal of trend continuation. Consecutive upward BOS indicate a healthy bullish trend, and vice versa.
- MSS (Market Structure Shift, also often called CHOCH): In an uptrend, the price fails to make a new high and instead falls below the previous valid swing low.
- Interpretation: MSS is the first and most important signal of a potential trend reversal. It indicates that market forces are shifting from bullish to bearish (or vice versa).
- Period Settings (Short/Intermediate/Long Term):
- Short Term: Based on the most minute 3-bar swing points, very sensitive, suitable for short-term traders to observe subtle changes.
- Intermediate Term (Recommended): Based on higher-level swing points formed from short-term swing points, filtering out some noise, suitable for day and swing traders.
- Long Term: Based on swing points formed from intermediate-term swing points, reflecting a longer-term structure, suitable for swing and long-term traders.
- Usage: Combine market structure with your trading signals. For example, in an uptrend (price above the Vegas Channel), each upward BOS confirms the health of the trend. If a C0 pullback signal appears at this point, it would be an excellent entry point. Conversely, if an MSS appears, even with a strong buy signal, caution is advised, as the trend may be reversing.
Module Eight: Information Panel
This is your "cockpit dashboard," consolidating all key information in one place, giving you a clear overview of the current market state:
- Main Trend Direction: The final trend judgment given by multiple indicators.
- Alligator Line Pattern: Shows whether the current trend is trending or consolidating.
- OBV Status: Whether funds are flowing in or out.
- ADX Status: Whether the trend is strong or weak.
- Chandelier Stop-Loss Direction: Short-term trend direction.
