Cerca negli script per "adx"

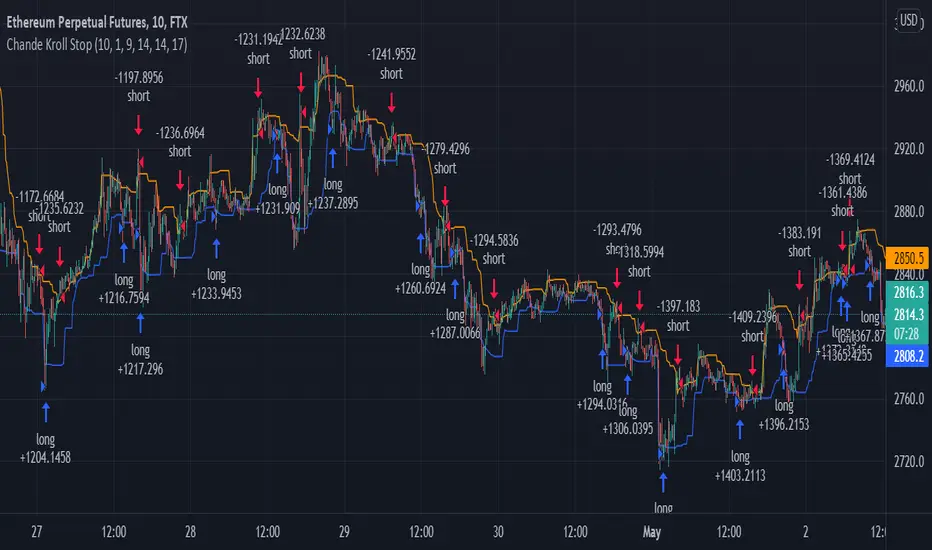
Chande Kroll Stop + ADX filter strategyDear TV''ers,
Hereby a script where i created a simple strategy using the underappreciated chande kroll stop indicator. Short signal is when the close crosses under the orange line and a long signal is generated upon a crossover of a close candle of the blue line.
Additionally you have the option to filter using ADX the minimize getting rekt in a choppy market.
good luck trading!
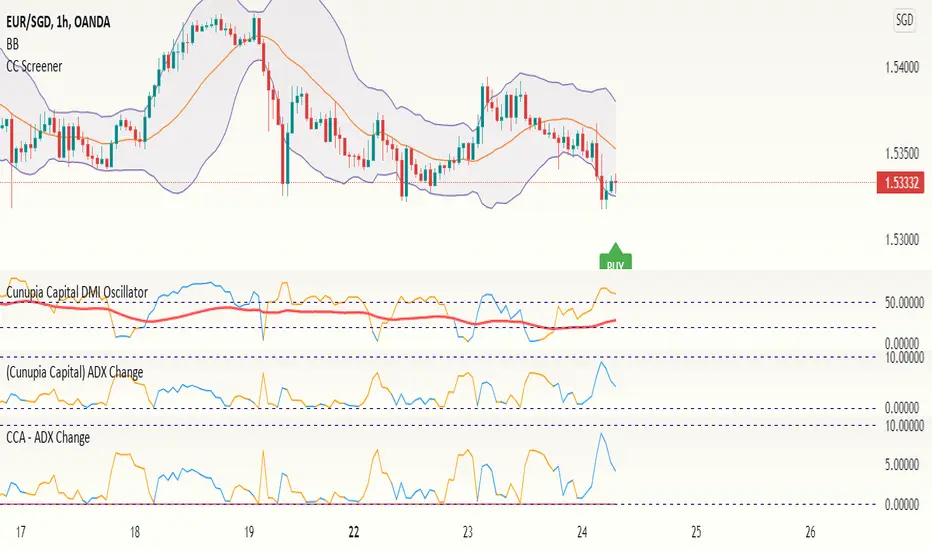
CCA - ADX ChangeThis shows the velocity in which the ADX value is moving. If the velocity is decreasing, the value will go to 0, if it's negative, the line will change to orange. Very useful to tell when the momentum is changing in a particular direction.
DMI + ADX + OBVThis trend following indicator is made up of 3 parts.
A normalized (OBV) On Balance Volume (the gray line) which ranges between -100 and 100 and has a 55 period SMA overlayed (the orange line) to give an indication of the overall trend as far as volume goes.
- If the volume decreases without a drop in price, it might indicate a move down.
- If volume increases without a rise rise in the price, it might indicate a move up.
The (DMI) Directional Movement Indicator which shows the strength of the bulls versus the bears.
- The red line measures how strongly price moves downwards.
- The green line measures how strongly price moves upwards.
One way to trade this is on crossovers e.g.when the green line crosses the red; although it's best to combine this with another indicator or pattern for confirmation.
Another useful feature of the DMI is the ability to see strength of buyers and sellers pressure at the same time, acting as a confirmation before entering a trade.
The third way to use the DMI is when price makes a new high but the green line does not. (Or the price makes a new low and the red line doesn't) This is known as divergence and should act as a warning to tighten your stops or take profits because it signals a possible change of direction.
The last part of the indicator is the (ADX) Average Directional Index
This is the blue line and shows the strength of the trend regardless of direction. This can act as a confirmation for the DMI or other indicators in your trading system.
When the blue line is:
- above the green shaded area there is an extreme trend.
- in the green shaded area there is a very strong trend.
- in the yellow shaded area there is a strong trend.
- below the yellow shaded area there is no trend.

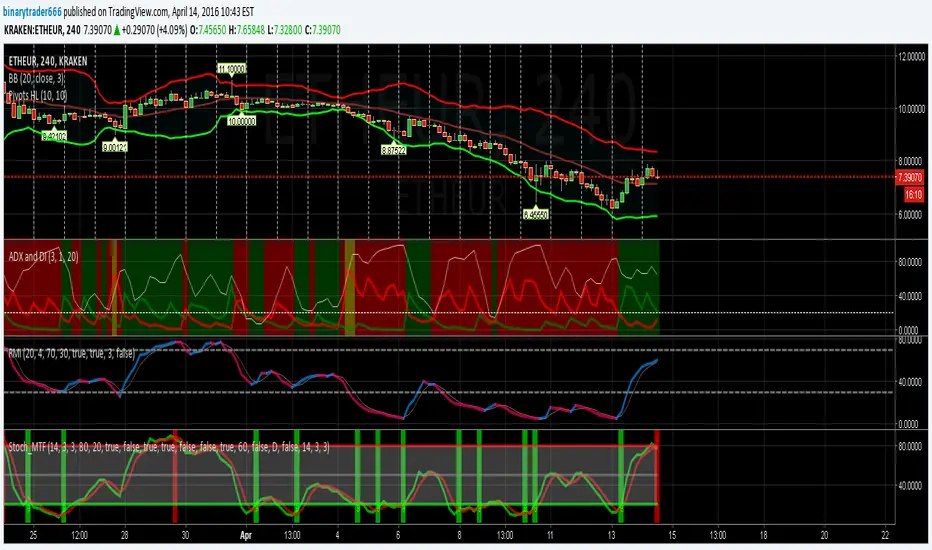
Stochastic RSI 3in1 & Volatility peaks + ADX by AGUDescription:
3 Lines are Stochastic RSI's, strongest move is when all crosses and moves to one direction (from top or bottom).
Orange is original Stochastic of the timeline. (Live movement of price).
Green is original Stoch x 6. (Short term movement).
Red is original Stoch x27 (Long term price movement).
Transparent columns are ADX signal.
Higher the mountain, stronger the signal. When the mountain tops, trend usually change.
And finally the volatility peaks. Green peak HIGHEST volatility , RED peak LOWEST volatility .
I use it on 1 min BTC chart. But it works on all.
TIPS >> 3HCQ41cRpxcq2MJdRUSYoq9N1RnEy98xD2

BO ADX Binary Option strategy based on ADX/DI cross, Put or Call at the beginning of the next candle, expire 5m for 5m candle.


[FT] ADX-Multi-TF by FractalTraderAverage Directional Index is a way to determine trend strength (and whether there is a trend). One of the caveats is when you have trendless conditions on a higher timeframe. You can get whipsaw conditions on the current timeframe in that case.
The purpose of this script is to put ADX into the context of a higher degree trend on a single indicator.


ADX with Customisable LevelsADX with Customisable Levels.
25 for strong trend
50 for Very strong trend
75 for unsustainable strong trend.

ADX Combined Strategy IPadx Mmmentume in index options trading.aaaaaaaaaaaaaaaaaaaaaaaaaaaaaaaaaaaaaaaaaaaaaaaaaaaaaaaaaaaaaaaaaaaaaaaaaaaaaaaaaaaaaaaaaaaaaaaaaaaaaaaaaaaaaaaaaaaaaaaaaaaaaaaaaaaaaaaaaaaaaaaaaaaaaaaaaaaaaaaa


ADX&DIThis is an enhanced version of the classic ADX and Directional Movement Index (DMI). It is designed to filter out ranging markets and visually highlight trend strength.
Key Features:
Dual Threshold System:
Level 1 (Default 20): Signals the start of a trend. The background fill appears with high transparency.
Level 2 (Default 25): Signals a strong trend. The background fill becomes more opaque/solid to indicate momentum.
Visual Clarity: The area between DI+ and DI- is only filled when the ADX is above your defined thresholds. This helps you ignore noise in low-volatility environments.
Clean Settings: The logic is optimized so you can easily adjust colors and transparency directly in the "Style" tab without cluttered input menus.

ADX Curvature SuiteADX² Curvature Suite: Beyond Trend Strength
Detect Trend Ignition Before the Crowd by Analyzing the Second Derivative of Momentum.
█ OVERVIEW: A PARADIGM SHIFT IN TREND ANALYSIS
This is not another ADX indicator. This is a complete paradigm shift in how we perceive and trade trends.
The standard Average Directional Index (ADX) is a powerful but fundamentally flawed tool for the modern trader. It is a lagging indicator. It tells you that a trend existed . It confirms what has already happened. The ADX² Curvature Suite was engineered to solve this problem by asking a more profound question: not "Is there a trend?" but " Is a trend being born right now? " and " Is this established trend about to die? "
To achieve this, we go beyond the first dimension of trend strength and venture into the second and third dimensions: Velocity and Acceleration . We don't just measure the ADX value; we measure its rate of change, and the rate of change of its rate of change. This is Curvature Analysis . It allows us to see the subtle, invisible forces building beneath the surface of the market—the coiling spring of momentum right before a trend explodes, and the critical loss of thrust right before it collapses.
This suite is a fusion of three professional-grade analytical engines working in perfect concert:
The Curvature Engine: A sophisticated calculus-based system that computes the 1st and 2nd derivatives of the ADX to quantify its momentum.
The Phase Detection System: A proprietary model that classifies the market into one of six distinct phases in a trend's lifecycle, from Dormancy to Exhaustion.
The Quantum Vortex Bands™: A visually stunning, adaptive volatility and momentum channel for the ADX itself, providing context to its every move.
Together, they form a comprehensive decision-support system designed to give you an almost unfair advantage in identifying trend ignition and exhaustion points before the rest of the market has even registered a change.
█ THE SCIENCE: THE THREE PILLARS OF ADX²
The genius of this suite lies in its multi-layered mathematical foundation. It's a symphony of classical theory and modern statistical analysis.
Pillar 1: The Core ADX Engine (The "What")
At its base, the suite uses the classic ADX calculation developed by J. Welles Wilder Jr. It measures the strength of a trend, irrespective of its direction, on a scale of 0-100. The Directional Movement Indicators (+DI and -DI) provide the directional bias. This is our foundation—the raw data from which we extract a higher-dimensional truth.
Pillar 2: Curvature Analysis (The "When")
This is the revolutionary core of ADX². We apply the principles of differential calculus to the ADX line itself.
Velocity (1st Derivative): Calculated as ADX - ADX . This is the speed of the ADX. A positive velocity means trend strength is increasing. A negative velocity means it's decreasing. This is a leading indicator compared to the ADX value alone.
Acceleration (2nd Derivative): Calculated as Velocity - Velocity or ADX - 2*ADX + ADX . This is the change in speed of the ADX. It's the "force" being applied to the trend.
Positive Acceleration is like pressing the gas pedal on a car. It signifies a trend is not just strengthening, but strengthening at an increasing rate. This is the mathematical signature of Ignition .
Negative Acceleration is like hitting the brakes. It signifies a trend is losing thrust, even if its speed (ADX value) is still high. This is the mathematical signature of Exhaustion .
By analyzing these derivatives, we can identify critical inflection points in trend momentum that are completely invisible to anyone looking at the standard ADX alone.
Pillar 3: Z-Score Normalization (The "How")
Raw acceleration values are meaningless when comparing different assets or timeframes. An acceleration spike on NQ is vastly different from one on EURUSD. To solve this, we employ a powerful statistical tool: the Z-Score .
The Z-Score formula is: Z = (Value - Mean) / Standard_Deviation
We apply this to our calculated acceleration values. The result is a normalized score that tells us how many standard deviations away from the "normal" behavior the current acceleration is. A Z-Score of +2.0 means the current acceleration is a 2-sigma event—statistically significant and rare. This makes our signals universal and adaptive . A +2.0 sigma Ignition signal has the same statistical weight on a 1-minute chart of a volatile crypto as it does on a daily chart of a stable stock. This is what allows the suite to work out-of-the-box on virtually any market, automatically adapting to its unique volatility and character.
█ THE SIX PHASES OF A TREND: A MARKET LIFECYCLE
The ADX² engine uses its curvature and Z-Score data to classify the market into one of six distinct phases, providing a clear, color-coded narrative of the trend's lifecycle.
💤 DORMANT: ADX is low and flat. The market is consolidating. There is no trend. This is the time to stand aside and wait.
⚡ IGNITION: ADX is low, but a powerful spike in positive acceleration has been detected. The engine of a new trend is firing up. This is your earliest entry signal.
🚀 ACCELERATION: ADX is rising with positive velocity. The trend has left the station and is gaining momentum. This is the main "trend following" phase.
🏔 MATURE: ADX is high and its velocity is flattening. The trend is well-established and powerful, but no longer accelerating. This is a time to be cautious and manage positions.
🔥 EXHAUSTION: ADX is high, but a significant negative acceleration event has occurred. The trend has hit the brakes hard. A reversal or deep pullback is highly probable. This is your primary exit signal.
📉 DECLINE: ADX is falling with negative velocity. The trend's strength is actively fading, and the market is returning to a dormant state.
█ THE ARSENAL: MASTERING THE VISUALS
Every visual element is a data-rich component designed for rapid interpretation.
The Main Chart: Signals & Trade Management
Signal Shapes: Every signal appears as a shape on the main chart.
Triangles (▲▼): These are the highest conviction signals— Ignition and
Exhaustion . Their color indicates the specific event type.
X-Crosses (◇): These mark Divergences between price and ADX—powerful reversal warnings.
Kill Zone Labels: These are dynamic, floating labels that appear in real-time when high-probability conditions are met.
⚡ IGNITION ZONE: Appears below price when the market is dormant but curvature is building. It's a "prepare to engage" warning.
🔥 EXHAUSTION ZONE: Appears above price when the trend is mature but rapidly decelerating. It's a "prepare to exit" warning.
The Signal Line System: When a signal fires, a full trade management overlay can be drawn.
Entry Line: A colored line (Solid, Dashed, or Dotted) at the signal price.
SL/TP Lines: Dotted lines showing ATR-based Stop Loss (Red) and up to 3 Take Profit levels (Green).
Live Tracking: The lines track progress, dimming when a TP is hit and self-deleting upon completion, leaving a ✓ for a win or an ✗ for a loss. It's a visual backtester on your live chart.
The Lower Pane: The Engine Room
The ADX Line: The line itself is color-coded. A dull color indicates low ADX, a neutral color for a building trend, and a bright, vibrant color for a high, mature trend.
Signal Dots: Colored circles and crosses are plotted directly on the ADX line, allowing you to instantly correlate the signal with the exact ADX level and phase.
The Quantum Vortex Bands™: This is not a Bollinger Band. This is a dynamic, six-layered channel for the ADX itself.
Adaptive Width: The bands expand and contract based on both ADX volatility and its current acceleration (curvature). High acceleration forces the bands wider, anticipating a larger move.
Phase-Adaptive Colors: The fill color of the bands changes dynamically to match the currently detected market phase, giving you an at-a-glance understanding of the trend's health.
Interpretation: When ADX pushes to the outer bands, it's in an extreme state. An Ignition signal when ADX is at the lower band is a high-conviction entry. An Exhaustion signal when ADX is at the upper band is a high-conviction exit.
The Dashboard (HUD): Your All-In-One Command Center
This professional Heads-Up Display provides a comprehensive, real-time summary of every critical metric.
MARKET Section: Shows the raw ADX value, its strength classification (e.g., "STRONG"), and the current directional bias (Bulls vs. Bears) with the spread between +DI and -DI.
MOMENTUM Section: This is the curvature readout. It displays the numerical Velocity (VEL), the Z-Score of the Curvature (CURV), and the RSI of the ADX (RSI²) for a meta-momentum perspective.
PHASE Section: Your at-a-glance trend lifecycle status. It shows the current confirmed phase icon and name (e.g., "⚡ IGNITION"), a counter for how many bars the phase has been active, and the type/strength of any active signal.
STATUS Section: A quick check on secondary systems. It confirms if you are in a Kill Zone, if a Divergence is active, and the count of active Signal Lines on your chart.
OPTIMIZER Section: When enabled, this section displays the results of the built-in backtester, including Win Rate, Profit Factor, and a proprietary Stability Rating ( ROBUST, STABLE, FRAGILE, OVERFIT ) to help you validate your settings.
█ THE COMMAND CENTER: MASTERING THE INPUTS
Every parameter of the ADX² engine is exposed for your control. This allows for unparalleled fine-tuning to any market, timeframe, or trading style.
Core ADX & Curvature Settings
ADX/DI Length & Smoothing: Standard ADX parameters. How to use: Shorter lengths (e.g., 10) for scalping; longer lengths (e.g., 21) for swing trading. Stick to "RMA" smoothing for the classic feel.
Curvature Smoothing: This is the "secret sauce." It smooths the velocity and acceleration calculations. How to use: Use a low value (2-3) for volatile markets or low timeframes to remain responsive. Use a higher value (4-5) for smoother signals on higher timeframes.
Z-Score Lookback & Threshold: Controls the normalization engine. How to use: The Lookback (default 50) sets the "memory" for what is "normal." The Threshold is for the generic curvature spike signals (circles). A higher value (e.g., 2.5σ) will only show extreme events.
Signal Detection Settings
Ignition/Exhaustion Thresholds: The Z-Score level required to trigger the primary phase-change signals. How to use: A lower threshold (e.g., 1.0σ) will give earlier, more frequent signals with more false positives. A higher threshold (e.g., 2.0σ) will give later, less frequent, but higher-conviction signals.
Low/High ADX Levels: These define the boundaries for the phases. Low ADX (default 20) is the ceiling for the Dormant phase. High ADX (default 40) is the floor for the Mature phase. How to use: For choppy markets, you might raise the Low ADX to 22 to avoid false ignitions. For strongly trending markets, you might lower the High ADX to 35 to get earlier exhaustion warnings.
Min Bars Between Signals: A crucial spam filter. It enforces a "cooldown period" after a signal fires, preventing over-trading in choppy conditions.
Signal Lines & Trade Management
SL/TP Multipliers (xATR): Fully customize the risk-to-reward profile of the visual trade overlays. The system uses the Average True Range (ATR) for volatility-adaptive targets. How to use: For day trading, a 1.5 ATR Stop Loss and 1.0, 2.0, 3.0 ATR Take Profits is a balanced approach. For swing trading, you might use a wider 2.5 ATR stop and more ambitious targets.
Quantum Vortex Bands™
Band Mode: Choose from four distinct geometric configurations ( Triple Layer, Fractal Cloud, Momentum Tunnel, Phase Spectrum ) to visually optimize the bands for your specific market type—from high-volatility crypto to tight-ranging indices.
Band Width Multiplier: The master control for the overall width of the bands, allowing you to tune them to be tighter or wider based on your instrument's character.
The Optimizer Engine
Toggle the built-in backtester to rapidly test your settings. Adjust the optTP and optSL to find the most ROBUST configuration for your chart's visible data before committing to a strategy.
█ DEVELOPMENT PHILOSOPHY
The ADX² Curvature Suite was born from a deep dissatisfaction with the static, lagging nature of conventional technical analysis. We believe the future of trading lies not in measuring where the market has been, but in quantifying the forces that will determine where it is going next. By applying calculus and adaptive statistics to a classic indicator, we've created a tool that doesn't just show you the trend; it reveals its DNA. It is complex by necessity, because the market is complex. My mission is to translate that complexity into actionable clarity.
This suite is my attempt to provide the ultimate tool for "sizing up the entire market," giving you the ability to see the very inception and conclusion of those main movements where the real money is made.
█ DISCLAIMER AND BEST PRACTICES
THIS IS NOT A STANDALONE SYSTEM: The ADX² Suite is an advanced decision-support tool. It should be used in conjunction with your own analysis of price action, support/resistance, and market structure.
RISK MANAGEMENT IS PARAMOUNT: All trading involves risk. The visual SL/TP lines are for guidance only. Always use proper position sizing and risk management protocols. This indicator does not guarantee profits.
BACKTEST AND OPTIMIZE: Use the built-in Optimizer Engine and TradingView's Strategy Tester to find the settings that are most robust for your chosen instrument and timeframe before trading live.
HIGH-CONVICTION SETUPS: The highest probability signals occur when multiple factors align: An Ignition signal fires from a low ADX level, near the bottom of the Vortex Bands, in a confirmed Kill Zone, and in the direction of the higher timeframe bias.
"The big money is not in the individual fluctuations, but in the main movements – that is, not in reading the tape, but in sizing up the entire market and its trend."
— Jesse Livermore
Taking you to school. - Dskyz, Trade with probability. Trade with anticipation. Trade with ADX².

ADX / Connectable [Azullian]
Streamline your strategy with the ADX indicator. Precisely analyze market strength and direction, integrating these insights for more adaptable trading decisions.
This connectable ADX indicator is part of an indicator system designed to help test, visualize and build strategy configurations without coding. Like all connectable indicators , it interacts through the TradingView input source, which serves as a signal connector to link indicators to each other. All connectable indicators send signal weight to the next node in the system until it reaches either a connectable signal monitor, signal filter and/or strategy.
█ UNIFORM SETTINGS AND A WAY OF WORK
Although connectable indicators may have specific weight scoring conditions, they all aim to follow a standardized general approach to weight scoring settings, as outlined below.
■ Connectable indicators - Settings
• 🗲 Energy: Energy applies an ATR multiplier to the plotted shapes on the chart. A higher value plots shapes farther away from the candle, enhancing visibility.
• ☼ Brightness: Brightness determines the opacity of the shape plotted on the chart, aiding visibility. Indicator weight also influences opacity.
• → Input: Use the input setting to specify a data source for the indicator. Here you can connect the indicator to other indicators.
• ⌥ Flow: Determine where you want to receive signals from:
○ Both: Weights from this indicator and the connected indicator will apply
○ Indicator only: Only weights from this indicator will apply
○ Input only: Only weights from the connected indicator will apply
• ⥅ Weight multiplier: Multiply all weights in the entire indicator by a given factor, useful for quickly testing different indicators in a granular setup.
• ⥇ Threshold: Set a threshold to indicate the minimum amount of weight it should receive to pass it through to the next indicator.
• ⥱ Limiter: Set a hard limit to the maximum amount of weight that can be fed through the indicator.
■ Connectable indicators - Weight scoring settings
▢ Weight scoring conditions
• SM – Signal mode: Enable specific conditions for weight scoring
○ All: All signals will be scored.
○ Entries only: Only entries will score
○ Exits only: Only exits will score.
○ Entries & exits: Both entries and exits will score.
○ Zone: Continuous scoring for each candle within the zone.
• SP – Signal period: Defines a range of candles within which a signal can score.
• SC - Signal count: Specifies the number of bars to retrospectively examine and score.
○ Single: Score for a single occurrence
○ All occurrences: Score for all occurrences
○ Single + Threshold: Score for single occurrences within the signal period (SP)
○ Every + Threshold: Score for all occurrences within the signal period (SP)
▢ Weight scoring direction
• ES: Enter Short weight
• XL: Exit long weight
• EL: Enter Long weight
• XS: Exit Short weight
▢ Weight scoring values
• Weights can hold either positive or negative scores. Positive weights enhance a particular trading direction, while negative weights diminish it.
█ ADX - INDICATOR SETTINGS
■ Main settings
• Enable/Disable Indicator: Toggle the entire indicator on or off.
• S - Source: Choose an alternative data source for the ADX calculation.
• T - Timeframe: Select an alternative timeframe for the ADX calculation.
• SM - Smoothing: Smooth the length averages.
• LE - DI Length: Determine the DI: Directional indicator length.
• TH - Trend threshold: Specify the level the ADX has to cross
• EM - Entry signal mode: Determine entry mode
○ DI: Use only DI+ and DI- crossings
○ DI + ADX: Use DI with increasing ADX
○ DI + ADX + Invert: Use DI with increasing ADX and DI with decreasing ADX
• XM - Exit signal mode: Determine exit mode
○ DI: Use DI crossing to exit
○ ADX: Use decreasing ADX to signal exit
■ Scoring functionality
• The ADX scores long entries when the ADX crosses the TH: Trend threshold and +DM is greater than -DM
• The ADX scores long exits when the ADX falls back below the TH: Trend threshold and +DM is greater than -DM
• The ADX scores long zones the entire time the ADX is above the TH: Trend threshold and +DM is greater than -DM
• The ADX scores short entries when the ADX crosses the TH: Trend threshold and +DM is smaller than -DM
• The ADX scores short exits when the ADX falls back below the TH: Trend threshold and +DM is smaller than -DM
• The ADX scores short zones the entire time the ADX is above the TH: Trend threshold and +DM is smaller than -DM
█ PLOTTING
• Standard: Symbols (EL, XS, ES, XL) appear relative to candles based on set conditions. Their opacity and position vary with weight.
• Conditional Settings: A larger icon appears if global conditions are met. For instance, with a Threshold(⥇) of 12, Signal Period (SP) of 3, and Scoring Condition (SC) set to "EVERY", an ADX signaling over two times in 3 candles (scoring 6 each) triggers a larger icon.
█ USAGE OF CONNECTABLE INDICATORS
■ Connectable chaining mechanism
Connectable indicators can be connected directly to the signal monitor, signal filter or strategy , or they can be daisy chained to each other while the last indicator in the chain connects to the signal monitor, signal filter or strategy. When using a signal filter you can chain the filter to the strategy input to make your chain complete.
• Direct chaining: Connect an indicator directly to the signal monitor, signal filter or strategy through the provided inputs (→).
• Daisy chaining: Connect indicators using the indicator input (→). The first in a daisy chain should have a flow (⌥) set to 'Indicator only'. Subsequent indicators use 'Both' to pass the previous weight. The final indicator connects to the signal monitor, signal filter and/or strategy.
■ Set up this indicator with a signal filter and strategy
The indicator provides visual cues based on signal conditions. However, its weight system is best utilized when paired with a connectable signal filter, signal monitor, and/or strategy .
Let's connect the ADX to a connectable signal filter and a strategy :
1. Load all relevant indicators
• Load ADX / Connectable
• Load Signal filter / Connectable
• Load Strategy / Connectable
2. Signal Filter: Connect the ADX to the Signal Filter
• Open the signal filter settings
• Choose one of the three input dropdowns (1→, 2→, 3→) and choose : ADX / Connectable: Signal Connector
• Toggle the enable box before the connected input to enable the incoming signal
3. Signal Filter: Update the filter signals settings if needed
• The default settings of the filter enable EL (Enter Long), XL (Exit Long), ES (Enter Short) and XS (Exit Short).
4. Signal Filter: Update the weight threshold settings if needed
• All connectable indicators load by default with a score of 6 for each direction (EL, XL, ES, XS)
• By default, weight threshold (TH) is set at 5. This allows each occurrence to score, as the default score in each connectable indicator is 1 point above the threshold. Adjust to your liking.
5. Strategy: Connect the strategy to the signal filter in the strategy settings
• Select a strategy input → and select the Signal filter: Signal connector
6. Strategy: Enable filter compatible directions
• Set the signal mode of the strategy to a compatible direction with the signal filter.
Now that everything is connected, you'll notice green spikes in the signal filter representing long signals, and red spikes indicating short signals. Trades will also appear on the chart, complemented by a performance overview. Your journey is just beginning: delve into different scoring mechanisms, merge diverse connectable indicators, and craft unique chains. Instantly test your results and discover the potential of your configurations. Dive deep and enjoy the process!
█ BENEFITS
• Adaptable Modular Design: Arrange indicators in diverse structures via direct or daisy chaining, allowing tailored configurations to align with your analysis approach.
• Streamlined Backtesting: Simplify the iterative process of testing and adjusting combinations, facilitating a smoother exploration of potential setups.
• Intuitive Interface: Navigate TradingView with added ease. Integrate desired indicators, adjust settings, and establish alerts without delving into complex code.
• Signal Weight Precision: Leverage granular weight allocation among signals, offering a deeper layer of customization in strategy formulation.
• Signal Filtering: Define entry and exit conditions with more clarity, granting an added layer of strategy precision.
• Clear Visual Feedback: Distinct visual signals and cues enhance the readability of charts, promoting informed decision-making.
• Standardized Defaults: Indicators are equipped with universally recognized preset settings, ensuring consistency in initial setups across different types like momentum or volatility.
• Reliability: Our indicators are meticulously developed to prevent repainting. We strictly adhere to TradingView's coding conventions, ensuring our code is both performant and clean.
█ COMPATIBLE INDICATORS
Each indicator that incorporates our open-source 'azLibConnector' library and adheres to our conventions can be effortlessly integrated and used as detailed above.
For clarity and recognition within the TradingView platform, we append the suffix ' / Connectable' to every compatible indicator.
█ COMMON MISTAKES, CLARIFICATIONS AND TIPS
• Removing an indicator from a chain: Deleting a linked indicator and confirming the "remove study tree" alert will also remove all underlying indicators in the object tree. Before removing one, disconnect the adjacent indicators and move it to the object stack's bottom.
• Point systems: The azLibConnector provides 500 points for each direction (EL: Enter long, XL: Exit long, ES: Enter short, XS: Exit short) Remember this cap when devising a point structure.
• Flow misconfiguration: In daisy chains the first indicator should always have a flow (⌥) setting of 'indicator only' while other indicator should have a flow (⌥) setting of 'both'.
• Hide attributes: As connectable indicators send through quite some information you'll notice all the arguments are taking up some screenwidth and cause some visual clutter. You can disable arguments in Chart Settings / Status line.
• Layout and abbreviations: To maintain a consistent structure, we use abbreviations for each input. While this may initially seem complex, you'll quickly become familiar with them. Each abbreviation is also explained in the inline tooltips.
• Inputs: Connecting a connectable indicator directly to the strategy delivers the raw signal without a weight threshold, meaning every signal will trigger a trade.
█ A NOTE OF GRATITUDE
Through years of exploring TradingView and Pine Script, we've drawn immense inspiration from the community's knowledge and innovation. Thank you for being a constant source of motivation and insight.
█ RISK DISCLAIMER
Azullian's content, tools, scripts, articles, and educational offerings are presented purely for educational and informational uses. Please be aware that past performance should not be considered a predictor of future results.

Directional Movement IndexADX is an oscillating indicator, displayed as a single line, ranging from 0 to 100, it only indicates the strength of the trend and does not indicate its direction. In other words, the ADX is non-directional, meaning that it measures the strength of a trend, but doesn’t distinguish between uptrend and downtrends. So, during a strong uptrend, the ADX rises and during a strong downtrend, the ADX also rises.
Here is how you correctly read what ADX is saying about the market. Here are 5 aspects regarding the interpretation of the ADX:
1- When ADX is above 25, trend strength is strong. Usually, once the ADX gets above 25 this signals the beginning of a trend. Big moves (upwards or downwards) tend to happen when ADX is right around this number. You can experiment with this number, some traders that want faster signals, tend to use a 20 threshold when trading with the ADX.
2- When ADX is below 25, traders must avoid trend trading strategies as the market is in accumulation or distribution phase. So, when we see the ADX line below 20 or 25 level, we forget about trend following strategies and we apply strategies suitable for a ranging market.
3- When ADX is above 25 and Positive Directional Movement Indicator (+DMI) is above the Negative Directional Movement Indicator (-DMI). ADX measures the strength of an uptrend. The crossover between the 2 Directional Movement Indicator, as the ADX line is well above 25 can result in an excellent bullish move.
4- The Positive Directional Movement Indicator (+DMI) should be above the Negative Directional Movement and the ADX should be above 25 signals for a strong upward trend for long opportunities. When ADX is above 25 and Positive Directional Movement Indicator is below the Negative Directional Movement Indicator, ADX measures the strength of a downtrend and short opportunities.
5- Values over 50 of the ADX indicate a very strong trend
There are pros and cons of ADX.
So, why is the ADX useful for traders: First, is excellent at quantifying trend strength. Also, it allows traders to see the strength of bulls and bears at the same time. It is good at filtering out trades, during accumulation periods and is good at identifying trending conditions.
But the ADX also has its limitations. The most important disadvantage is the fact that ADX is a lagging indicator that follows the price, so we must be very careful when we apply this indicator, because we might miss the inception of the trend and join it when it’s nearly over.
Also, it offers many false signals when used on shorter time frames, so it’s advisable to trade it on higher time frames Also, the ADX does not contain all of the data necessary a for proper analysis of price action, so it must be used in combination with other tools or indicators.
Now that we fully covered the good and the bad regarding ADX, let’s see how it is used in a trading strategy.
The trading strategy involves a DMI crossover, confirmed by ADX above consolidation threshold. If +DMI crossover, we take long position and if -DMI crosses over, we take a short position.
Candles are re-colored for easy demonstration of uptrend, downtrend and consolidation periods.
Green candles – ADX > Consolidation Threshold and +DMI > -DMI
Red candles – ADX > Consolidation Threshold and +DMI < -DMI
Black candles – ADX < Consolidation Threshold
Repaint – This is a non-repainting strategy - All the signals are generated at candle closing. All the calculations are made on previous candle’s open, high, low, close. No request security function is used. No data is being used from higher time frame. Trade exit uses close function instead of exit to avoid limit orders. Only one long trade at a time (no pyramiding) is allowed.
Strategy Time frame – D (To filter out false signals, higher time frame is recommended)
Strategy For – Swing Traders
Assets – Cryptocurrencies + Stocks

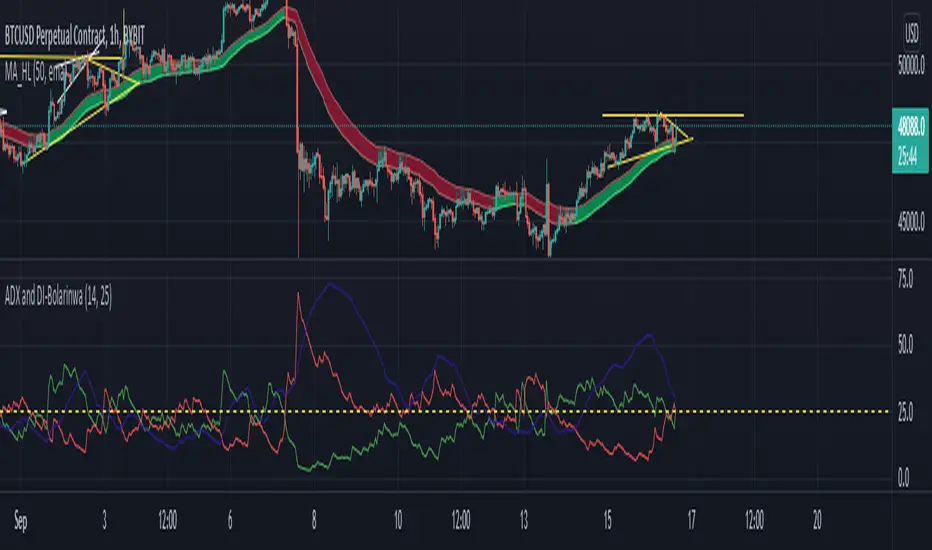
ADX and DI-BolarinwaThe Average Directional Movement Index (ADX) is a technical indicator that measures the strength of a trend. While the indicator itself doesn’t give an insight into the direction of the trend, the Directional Movement lines can be used to determine if the market moves up or down.
The ADX can return a value between 0 and 100. The usual threshold for a market to be considered as trending by the ADX is a value of 25 or above. Values between 25 and 50 signal a trending market, between 50 and 75 very strong trends and between 75 and 100 extremely strong trends.
The ADX Crossover Trading Strategy
A popular trading strategy to trade on the ADX is based on a crossover of the directional movement lines (+DI and -DI) which was developed directly by the indicator’s creator Mr. Wilder.
The trading strategy states that the first condition for a trade setup is that the ADX has a value of 25 or above, which indicates a trending market.
A buy order is triggered when +DI crosses above -DI, i.e. the underlying trend is an uptrend, while a sell signal is triggered when -DI crosses above +DI, i.e. the underlying trend is a downtrend.
Stop-losses are placed at the low of the current trading day, and the trade setup remains valid even if the directional movement lines cross again after the trade signal. Only a break of the current trading day’s low would lead to the trade setup becoming invalid.
If the ADX remains above 25 or rises even higher, indicating that the strength of the underlying trend increases, then traders can put a trailing stop on the trade.
The following chart shows an example of the ADX crossover strategy on the daily EUR/USD pair.
ADX Crossover Strategy
The first cross of -DI above +DI didn’t send a sell signal because the ADX was below 25. The sell signal came with ADX crossing above 25, while the -DI was still above +DI. On the chart, the SL was put just above the day’s high.
The second signal was a buy signal, with the cross of +DI above -DI and the ADX above 25, signaling a strong trend. The stop-loss is placed just below the day’s low, indicated by the dotted line on the chart.
Finally, the third sell signal came with the cross of -DI above -DI and the ADX above 25. Again, the stop-loss is placed just above the day’s high.
While the ADX crossover strategy can also be applied to lower timeframes, you need to be aware that the increased market noise may create more false signals than on the higher timeframes. The following chart is a 5-minute chart with buy and sell signals based on the crossover strategy. Notice that we placed the stop-losses slightly different than in the previous example. In this case, stop-losses have been placed at the recent highs and lows of the price.
ADX Trading Graph
The first buy signal came with +DI crossing above -DI and ADX above 25. In the middle of the chart, you can notice the crosses of the directional movement lines (+DI and -DI) while the ADX was below 25. As ADX needs to be above 25, those crosses are not used as entry triggers based on the ADX crossover strategy.
After that we received a sell signal with -DI crossing above +DI and ADX above 25, which is followed by a buy signal when +DI crossed above -DI.
Using ADX for Trade Confirmations
Beside the ADX crossover strategy which is based on the crosses of +DI and -DI, traders can also use the ADX indicator to supplement other trading strategies. For example, you might want to use a trend-following strategy when ADX shows a strong trend (value above 25), or a trading strategy that is more suited for ranging markets in times when the ADX shows an absence of trends (value below 25).
Before You Trade
The Average Directional Movement Index is a versatile technical indicator that can be used as a stand-alone trading strategy, or in combination with other trading strategies. The ADX crossover strategy is based on the crossover of the directional movement lines (+DI and -DI) and an ADX reading of above 25. While it can be used across all timeframes, it usually returns the best results on higher ones.
As the ADX measures the strength of the underlying trend, trend-following traders can use it to filter flat and ranging markets and avoid trading during those times.
ADX Color Change by BehemothI find this tool to be the most valuable and accurate entry point indicator along with moving averages and the VWAP.
ADX Color Indicator - Controls & Intraday Trading Benefits
Indicator Controls:
1. ADX Length (default: 14)
- Controls the calculation period for ADX
- Lower values (7-10) = more sensitive, faster signals (better for scalping)
- Higher values (14-20) = smoother, fewer false signals (better for swing trades)
- *Intraday tip:* Try 10-14 for most intraday timeframes
2. Show Threshold Levels (default: On)
- Displays the 20 and 25 horizontal lines
- Helps you quickly identify when ADX crosses key strength levels
3. Use Custom Timeframe (default: Off)
- Allows viewing higher timeframe ADX on lower timeframe charts
- *Example:* Trade on 5-min chart but see 15-min or 1-hour ADX
4. Custom Timeframe
- Select any timeframe: 1m, 5m, 15m, 30m, 1H, 4H, D, etc.
- *Intraday tip:* Use 15m or 1H ADX on 5m charts for better trend context
5. Show +DI and -DI (default: Off)
- Shows directional movement indicators
- Green line (+DI) > Red line (-DI) = bullish trend
- Red line (-DI) > Green line (+DI) = bearish trend
6. Show Background Zon es (default: Off)
- Visual background colors for quick trend strength identification
- Green = strong trend (ADX > 25)
- Yellow = moderate trend (ADX 20-25)
Intraday Trading Benefits:
1. Avoid Choppy Markets
- When ADX < 20 (no background color), market is ranging
- Reduces false breakout trades and whipsaws
- Save time and capital by stepping aside during low-quality setups
2. Identify High-Probability Trend Trades
- **Green line + Green zone** = strong trend building, look for pullback entries
- Yellow line crossing above 20 = early trend formation signal
- Catch trends early when ADX starts rising from below 20
3. Multi-Timeframe Analysis
- Use custom timeframe to align with higher timeframe trends
- *Example:* If 1H ADX shows green (strong trend), take breakout trades on 5m chart in same direction
- Increases win rate by trading with the bigger picture
4. Exit Signals
- When ADX turns red (falling), trend is weakening
- Consider tightening stops or taking profits
- Avoid entering new positions when ADX is declining
5. Quick Visual Confirmation
- Color coding eliminates need to analyze numbers
- Instant recognition: Green = go, Yellow = caution, Red = trend dying
- Faster decision-making during fast market moves
6. Scalping Strategy
- Set ADX length to 7-10 for sensitive signals
- Only scalp when ADX is rising (blue, yellow, or green)
- Exit when ADX turns red
7. Breakout Confirmation
- Wait for ADX to rise above 20 after a breakout
- Filters false breakouts in ranging markets
- Yellow or green color confirms momentum behind the move
Optimal Intraday Settings:
- Day Trading (5-15 min charts):** ADX Length = 10-14
- Scalping (1-5 min charts):** ADX Length = 7-10, watch custom 15m timeframe
- Swing Intraday (30min-1H charts):** ADX Length = 14-20
Simple Trading Rules:
✅ Trade: ADX rising + above 20 (yellow or green)
⚠️ Caution: ADX flat or just crossed 20
❌ Avoid:*ADX falling (red) or below 20
The key advantage is staying out of low-quality, choppy price action which is where most intraday traders lose money!

ADX & DI with dynamic threshold indicator
ADX and DI with Dynamic Threshold
This Pine Script indicator, "ADX & DI with Dynamic Threshold," helps traders detect trends, trend reversals, and trend strength using the Average Directional Index (ADX) and the Directional Indexes (DI+ and DI-). It incorporates a dynamic threshold calculated using the average ADX over a user-defined period, along with a fixed minimum threshold, making trend detection more flexible and adaptable.
ADX and Directional Indexes (DI+ and DI-)
ADX measures the strength of a trend, while DI+ and DI- measure the direction of the trend. High DI+ signals upward price strength, and high DI- signals downward price strength.
Dynamic Threshold
A threshold based on the average ADX over a certain number of periods, ensuring the indicator adapts to market conditions. The threshold is compared to DI+ and DI- to generate trend signals.
Fixed Minimum Threshold
A user-defined minimum threshold ensures that signals are only generated in markets with a certain level of trend strength, preventing false signals in low-trending markets.
Visual Highlights
The background color highlights:
Green for potential uptrend,
Red for potential downtrend, and
Orange when directional movement is strong but trend strength is weak, helping traders avoid false signals in sideways markets.
Customization
Several input parameters allow for complete customization of the indicator, ensuring it can adapt to different timeframes and assets.
How to Use
Length (len)
This is the smoothing period used to calculate the ADX and DI+/- values. Range: 5 to 50 (default: 14).
Threshold Period (th_period)
Determines the number of periods over which the dynamic ADX threshold is calculated. Range: 5 to 200 (default: 50).
Fixed Minimum Threshold (fixed_th)
The minimum ADX value that must be exceeded for the indicator to trigger signals. Range: 10 to 40 (default: 20).
Smoothing Method
Choose between SMA (Simple Moving Average) or EMA (Exponential Moving Average) for smoothing the true range and directional movement calculations.
DI+ (Green)
Indicates the strength of upward price movements.
DI- (Red)
Indicates the strength of downward price movements.
ADX (Navy)
Indicates the overall strength of the trend, regardless of direction.
Dynamic Threshold (Gray)
The dynamic threshold used for comparing ADX values.
Fixed Threshold Line
A dotted black line showing the user-defined minimum threshold for ADX.
Green Background
Indicates a potential uptrend when DI+ > DI- and ADX is above the threshold.
Red Background
Indicates a potential downtrend when DI- > DI+ and ADX is above the threshold.
Orange Background
Indicates that DI+ or DI- are strong, but ADX is weak, suggesting a lack of trend strength despite directional movement, which could lead to false signals.
Adjust the length (len) based on the volatility of the asset. A lower len (e.g., 10) may be suitable for faster timeframes (like 5-min charts), while a higher value (e.g., 20-30) may work better on longer timeframes.
Use the threshold period (th_period) to fine-tune the dynamic ADX threshold. A higher value smooths the dynamic threshold over a longer period, making it more resistant to sudden volatility.
Fixed Threshold (fixed_th) should be set based on the strength of trends you want to capture. A higher value (e.g., 30-40) is more conservative and will only trigger signals in very strong trends.
Example Usage
This indicator can be used to:
Identify trends: When the ADX crosses the threshold and DI+ or DI- is dominant, indicating an uptrend or downtrend.
Spot trend reversals: When DI+ and DI- cross each other with a strong ADX reading.
Avoid false signals: By recognizing when DI+ or DI- are strong, but the ADX is below the threshold (highlighted in orange).
Conclusion
The ADX and DI with Dynamic Threshold indicator is a versatile tool for trend-following strategies. It adapts to market conditions using dynamic and fixed thresholds and provides clear visual signals to help traders make informed decisions about market direction and trend strength.
By adjusting the various input parameters, this indicator can be tailored to any asset class or timeframe, making it suitable for all types of traders, from scalpers to swing traders.
Feel free to experiment with different settings and incorporate this indicator into your trading strategy for enhanced market analysis.
