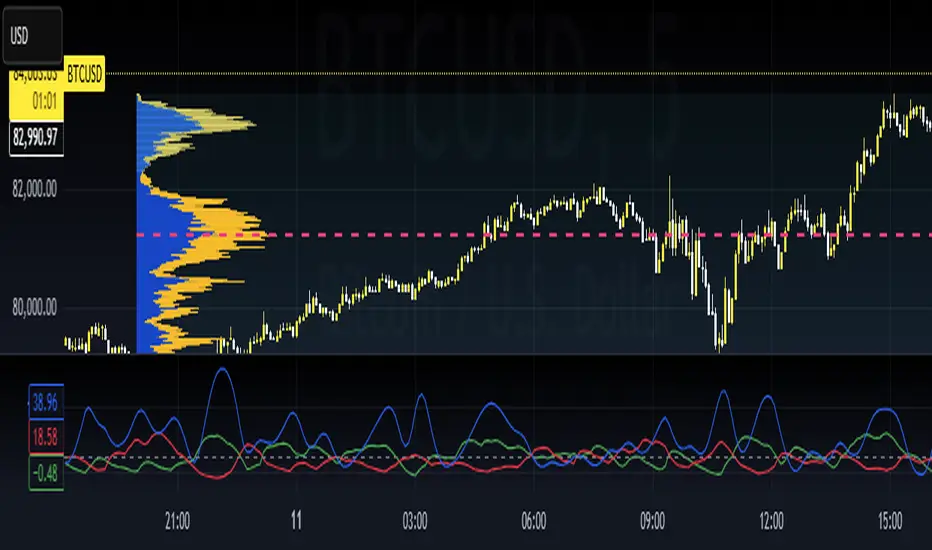
ADX DMI SqueezeThis is my version of the ADX/DMI with added some added features.
J. Welles Wilder Jr. is the creator and originator of the Average Directional Movement Index (ADX) and the Directional Movement Index (DMI) so I encourage you to learn more about this indicator.
I like to scalp the NASDQ and I like taking breakouts above/blow the Bollinger Band (std def one) and or the BB 20 sma . I also use VWAP.
On the chart is my indicator VWAP BB MA which has Vwap and BB if your wanting a combination.
I like taking longs when price is above VWAP, shorts when below VWAP, doing this keeps you on the right side of the market.
You will need to work the settings of the ADX Squeeze to get the best of it for your style of trading. This indicator is just that, It indicates what price has done so, like all indicators it lags however, look at price first then the indicators might support your ideas.
As time evolves I’ll be maintain and doing updates.
ADX DMI Squeeze – How to Use
Overview
This indicator combines:
ADX / DMI → Measures trend strength and direction
ADX Squeeze Histogram → Shows when the trend is accelerating or “squeezing” for a breakout
Triangles → Highlight potential expansion points
Optional DI+ / DI− lines → Show bullish/bearish dominance
ADX Threshold Lines (15 / 20) → Help filter weak trends
Early ADX Acceleration Dots → Provide an early heads-up before a squeeze fires
It can be used standalone or alongside other trend tools like VWAP for better entry timing.
Entry Guidelines
Long Trades (Buy):
Histogram above 0
Green triangle appears
ADX rising or above threshold (15/20 recommended)
Optional: DI+ > DI− confirms bullish strength
Short Trades (Sell):
Histogram above 0
Red triangle appears
ADX rising or above threshold (15/20 recommended)
Optional: DI− > DI+ confirms bearish strength
Avoid trades if:
Histogram negative
Triangles appear but ADX below threshold or trend not confirmed by DI linesOptional Filters
Require ADX acceleration: Only shows signals when ADX is increasing → avoids late or false entries
Require VWAP slope: Only triggers signals in line with VWAP trend → improves confluence
Tips
Best on 30-min or higher timeframes for swing/short-term trend trades
Can be combined with VWAP, support/resistance, or Bollinger Bands
Use DI lines toggle if you want extra visual trend confirmation
Adjust DMI length (sensitivity) and ADX smoothing for your preferred timeframe
Interpretation
Histogram turning green above 0 + triangle → strong bullish move forming
Histogram turning red above 0 + triangle → strong bearish move forming
ADX above 20 → strong trend, more reliable
ADX below 15 → weak trend, signals less reliable
In short:
Long = Green bars above 0 + Green triangle
Short = Red bars above 0 + Red triangle
Confirm with ADX above threshold and optionally DI lines
Cerca negli script per "adx"

ADX with Alerts for Strong Trending ConditionsMad Props to Chat GPT. Basically, this thing lets you set alerts on the ADX being Above 20 AND the Positive or Negative Directional Movement Line being Above the ADX. Useful for being alerted when a strong trend is in place to look for the pullback.
Description
The ADX with Custom Alerts indicator is designed to assist traders in identifying trends and potential trading opportunities based on the Average Directional Index (ADX) and Directional Indicators (DI+ and DI-). This tool provides a clear visual representation of market strength and directional movement, enhancing decision-making in trading.
Features
ADX Calculation:
The ADX measures the strength of a trend, regardless of its direction. The indicator calculates the ADX using a configurable length and a smoothing parameter, allowing traders to customize it based on their trading preferences.
Directional Indicators:
DI+: Represents bullish momentum.
DI-: Represents bearish momentum.
The indicator plots both DI+ and DI- alongside the ADX to give a complete picture of market direction.
Alert Conditions:
The indicator includes custom alert conditions that notify traders when:
Condition 1: The ADX rises above the defined threshold (default set at 20) and DI+ is above the ADX, indicating potential bullish momentum.
Condition 2: The ADX rises above the defined threshold and DI- is above the ADX, indicating potential bearish momentum.
Visual Representation:
The ADX line is plotted in blue, with the DI+ line in green and the DI- line in red.
A dotted horizontal line represents the ADX threshold, providing a clear visual cue for trend strength.
Background Highlighting:
The indicator uses background coloring to enhance visual analysis:
Green shading indicates when DI+ is above the ADX, suggesting bullish conditions.
Red shading indicates when DI- is above the ADX, suggesting bearish conditions.
Customizable Parameters:
Traders can adjust the length of the ADX calculation, the smoothing factor, and the threshold level to suit their trading strategies and timeframes.
Usage
This indicator is particularly useful for traders looking to:
Identify strong trends and potential entry points based on trend strength.
Make informed decisions using alerts that signal important market conditions.
Enhance their trading strategies with clear visual cues and customizable parameters.

ADX with Donchian Channels
The "ADX with Donchian Channels" indicator combines the Average Directional Index (ADX) with Donchian Channels to provide traders with a powerful tool for identifying trends and potential breakouts.
Features:
Average Directional Index (ADX):
The ADX is used to quantify the strength of a trend. It helps traders determine whether a market is trending or ranging.
Adjustable parameters for ADX smoothing and DI length allow traders to fine-tune the sensitivity of the trend strength measurement.
Donchian Channels on ADX:
Donchian Channels are applied directly to the ADX values to highlight the highest high and lowest low of the ADX over a specified period.
The upper and lower Donchian Channels can signal potential trend breakouts when the ADX value moves outside these bounds.
The middle Donchian Channel provides a reference for the average trend strength.
Visualization:
The indicator plots the ADX line in red to clearly display the trend strength.
The upper and lower Donchian Channels are plotted in blue, with a green middle line to represent the average.
The area between the upper and lower Donchian Channels is filled with a blue shade to visually emphasize the range of ADX values.
Default Settings for Scalping:
Donchian Channel Length: 10
Standard Deviation Multiplier: 1.58
ADX Length: 2
ADX Smoothing Length: 2
These default settings are optimized for scalping, offering a quick response to changes in trend strength and potential breakout signals. However, traders can adjust these settings to suit different trading styles and market conditions.
How to Use:
Trend Strength Identification: Use the ADX line to identify the strength of the current trend. Higher ADX values indicate stronger trends.
Breakout Signals: Monitor the ADX value in relation to the Donchian Channels. A breakout above the upper channel or below the lower channel can signal a potential trend continuation or reversal.
Range Identification: The filled area between the Donchian Channels provides a visual representation of the ADX range, helping traders identify when the market is ranging or trending.
This indicator is designed to enhance your trading strategy by combining trend strength measurement with breakout signals, making it a versatile tool for various market conditions.

ADX MTF mura visionOverview
ADX MTF — mura vision measures trend strength and visualizes a higher-timeframe (HTF) ADX on any chart. The current-TF ADX is drawn as a line; the HTF ADX is rendered as “step” segments to reflect closed HTF bars without repainting. Optional soft fills highlight the 20–25 (trend forming) and 40–50 (strong trend) zones.
How it works
ADX (current TF) : Classic Wilder formulation using DI components and RMA smoothing.
HTF ADX : Requested via request.security(..., lookahead_off, gaps_off).
When a new HTF bar opens, the previous value is frozen as a horizontal segment.
The current HTF bar is shown as a live moving segment.
This staircase look is expected on lower timeframes.
Auto timeframe mapping
If “Auto” is selected, the HTF is derived from the chart TF:
<30m → 60m, 30–<240m → 240m, 240m–<1D → 1D, 1D → 1W, 1W/2W → 1M, ≥1M → same.
Inputs
DI Length and ADX Smoothing — core ADX parameters.
Higher Time Frame — Auto or a fixed TF.
Line colors/widths for current ADX and HTF ADX.
Fill zone 20–25 and Fill zone 40–50 — optional light background fills.
Number of HTF ADX Bars — limits stored HTF segments to control chart load.
Reading the indicator
ADX < 20: typically range-bound conditions; trend setups require extra caution.
20–25: trend emergence; breakouts and continuation structures gain validity.
40–50: strong trend; favor continuation and manage with trailing stops.
>60 and turning down: possible trend exhaustion or transition toward range.
Note: ADX measures strength, not direction. Combine with your directional filter (e.g., price vs. MA, +DI/−DI, structure/levels).
Non-repainting behavior
HTF values use lookahead_off; closed HTF bars are never revised.
The only moving piece is the live segment for the current HTF bar.
Best practices
Use HTF ADX as a regime filter; time entries with the current-TF ADX rising through your threshold.
Pair with ATR-based stops and a MA/structure filter for direction.
Consider higher thresholds on highly volatile altcoins.
Performance notes
The script draws line segments for HTF bars. If your chart becomes heavy, reduce “Number of HTF ADX Bars.”
Disclaimer
This script is for educational purposes only and does not constitute financial advice. Trading involves risk.

ADX - Globx Options & Futures 2.0The ADX Globx Options & Futures is a custom-built trend strength indicator designed to replicate and enhance the classic Average Directional Index (ADX) model, commonly used in professional trading platforms such as IQ Option.
This version is optimized for options and futures trading, providing precise directional strength readings through adaptive smoothing and configurable parameters.
Concept and Logic
This indicator measures the strength of the current trend, regardless of its direction (bullish or bearish), by comparing directional movement between price highs and lows over a defined period.
It uses three main components:
+DI (Positive Directional Indicator): represents bullish strength.
–DI (Negative Directional Indicator): represents bearish strength.
ADX (Average Directional Index): measures the intensity of the prevailing trend, independent of direction.
The script follows the original logic proposed by J. Welles Wilder Jr., but introduces enhanced smoothing flexibility.
Users can choose between EMA (Exponential Moving Average) and Wilder’s RMA (Running Moving Average) for both DI and ADX calculations, allowing closer alignment with various platform implementations (IQ Option, MetaTrader, etc.).
How It Works
Directional Movement Calculation
The script computes upward and downward movements (+DM and –DM) by comparing the differences in highs and lows between consecutive candles.
Only positive directional changes that exceed the opposite side are considered.
This ensures each bar contributes only one valid directional movement.
True Range and Smoothing
The True Range (TR) is calculated using ta.tr(true) to include price gaps—replicating how professional derivatives platforms account for volatility jumps.
Both TR and DM values are smoothed using the selected averaging method (EMA or Wilder).
Directional Index and ADX
The smoothed +DI and –DI values are normalized over the True Range to form the Directional Index (DX), which measures the percentage difference between the two.
The ADX is then derived by smoothing the DX values, providing a stable reading of overall market strength.
Visual Representation
The ADX (white line) indicates the overall trend strength.
The +DI (dark blue) and –DI (dark red) lines show which side (bullish or bearish) is currently dominant.
Reference levels at 20 and 25 serve as strength thresholds:
Below 20 → Weak or sideways market.
Above 25 → Strong and directional trend.
Usage and Interpretation
When ADX rises above 25, the market shows a strong trend — use +DI > –DI for bullish confirmation, or the opposite for bearish momentum.
A falling ADX suggests decreasing trend strength and potential consolidation.
The default parameters (ADX Length = 34, DI Length = 34, both smoothed by EMA) match IQ Option’s internal ADX configuration, ensuring consistency between platforms.
Works on any timeframe or asset class, but is especially tuned for futures and options volatility dynamics.
Originality and Improvements
Unlike many open-source ADX indicators, this version:
Recreates IQ Option’s 34-length EMA-based ADX calculation with exact parameter alignment.
Provides selectable smoothing algorithms (EMA or Wilder) to switch between modern and classic formulations.
Uses dark-theme-optimized visuals with fine line weight and subtle contrast for clean visibility.
Maintains constant guide levels (20/25) rendered globally for precision and style compliance in Pine Script v6.
Is fully rewritten for Pine Script v6, ensuring compatibility and optimized execution.
Recommended Use
Combine with trend-following systems or breakout strategies.
Ideal for identifying market strength before engaging in options directionals or futures entries.
Use the ADX to confirm breakout momentum or filter sideways markets.
Disclaimer
This script is for educational and analytical purposes. It does not constitute financial advice or a trading signal. Users are encouraged to validate the indicator within their own trading strategies and risk frameworks.

ADX + DMI (HMA Version)📝 Description (What This Indicator Does)
🚀 ADX + DMI (HMA Version) is a trend strength oscillator that enhances the traditional ADX by using the Hull Moving Average (HMA) instead of EMA.
✅ This results in a much faster and more responsive trend detection while filtering out choppy price action.
🎯 What This Indicator Does:
1️⃣ Measures Trend Strength – ADX shows when a trend is strong or weak.
2️⃣ Identifies Trend Direction – DI+ (Green) shows bullish momentum, DI- (Red) shows bearish momentum.
3️⃣ Uses Hull Moving Average (HMA) for Faster Signals – Removes lag and reacts faster to trend changes.
4️⃣ Reduces False Signals – Traditional ADX lags behind, but this version reacts quickly to reversals.
5️⃣ Good for Scalping & Day Trading – Especially for BTC 5-min and lower timeframes.
⚙ Indicator Inputs (Customization)
Input Name Example Value Purpose
ADX Length 14 Defines the smoothing for the ADX value.
DI Length 14 Defines how DI+ and DI- are calculated.
HMA Length 24 Hull Moving Average smoothing for ADX & DI+.
Trend Threshold 25 The level above which ADX confirms a strong trend.
📌 You can adjust these settings to optimize for different assets and timeframes.
🎯 Trading Rules & How to Use It
✅ How to Identify a Strong Trend:
When ADX (Blue Line) is above 25→ A strong trend is in play.
When ADX is below 25 → The market is choppy or ranging.
✅ How to Use DI+ and DI- for Trend Direction:
If DI+ (Green) is above DI- (Red), the market is in an uptrend.
If DI- (Red) is above DI+ (Green), the market is in a downtrend.
✅ How to Confirm Entries & Exits:
1️⃣ Enter Long when DI+ crosses above DI- while ADX is rising above 25.
2️⃣ Enter Short when DI- crosses above DI+ while ADX is rising above 25.
3️⃣ Avoid trading when ADX is below 25 – the market is in a choppy range.
This should not be used as a stand alone oscillator. Trading takes skill and is risky. Use at your own risk.
This is not advise on how to trade, these are just examples of how I use the oscillator. Trade at your own risk.
You can put this on your chart versus the tradingview adx and you can adjust the settings to see the difference. This was optimized for btc on the 5 min chart. You can adjust for your trading strategy.
ADX and SADX, SDIThe indicator aims to analyze and visualize the Average Directional Index (ADX) and its smoothed versions, along with directional indicators (DI) to help traders identify trend strength and potential buy/sell signals.
Indicator Settings:
The indicator is named "ADX and SADX, SDI" and is set to display prices with a precision of 2 decimal places.
Users can customize the ADX smoothing length, DI length, ADX smoothing period, and DI smoothing period through input variables.
Directional Movement (DM) Calculation:
The function dirmov calculates the positive and negative directional movements (DM) and the smoothed values of the positive directional index (DI+) and negative directional index (DI-).
This is done using the average true range (ATR) to normalize the DM values.
Average Directional Index (ADX) Calculation:
The function adx calculates the ADX, which measures the strength of a trend.
It uses the DI+ and DI- values to compute the ADX value.
Smoothed ADX and DI Calculation:
The ADX values are further smoothed using a simple moving average (SMA).
The DI difference is also smoothed and used to determine the trend direction.
Buy and Sell Signals:
A buy signal is generated when the DI+ crosses above DI- and the smoothed DI difference is increasing.
A sell signal is generated when the DI- crosses above DI+ and the smoothed DI difference is decreasing.
Plotting:
The ADX, smoothed ADX, smoothed DI difference (SPM), DI+, and DI- values are plotted on the chart.
Horizontal lines are drawn to indicate threshold levels (e.g., level 22).
Background and bar colors change based on buy (lime) and sell (maroon) signals to visually indicate these conditions.
Purpose of the Code:
This Pine Script code is used to create a custom indicator on TradingView that helps traders identify the strength and direction of a trend. The Average Directional Index (ADX) is used to measure trend strength, while the Directional Indicators (DI+ and DI-) are used to determine the direction of the trend. The smoothed versions of these indicators (SADX and SDI) provide additional confirmation and smoothing to reduce noise and false signals. Traders can use the buy and sell signals generated by this indicator to make informed trading decisions based on the trend strength and direction.
Important Note:
This script is provided for educational purposes and does not constitute financial advice. Traders and investors should conduct their research and analysis before making any trading decisions.

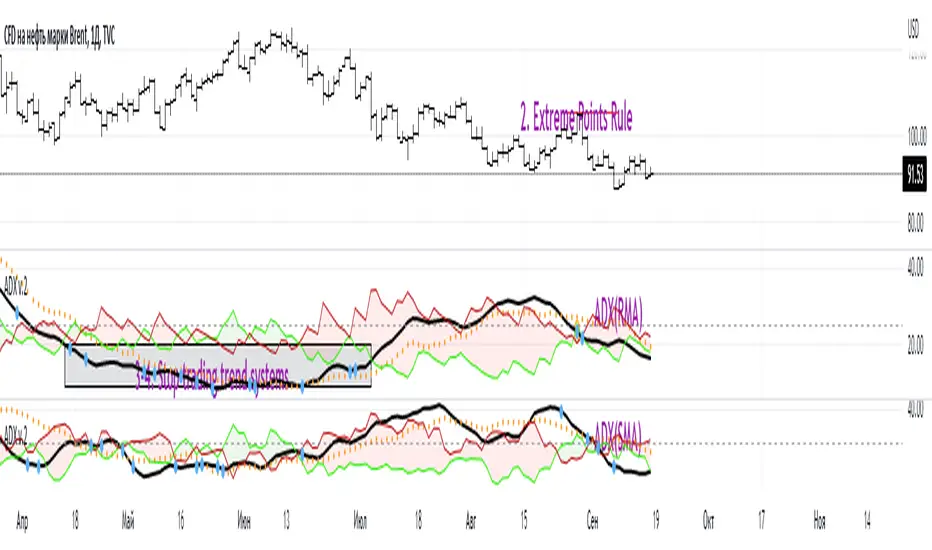
ADX W. Wilders(DI+, DI-, DX, ADXR, Equilibrium Point)The reason for publishing the script was the lack of display of important components in the standard ADX indicator, such as DI+, DI-, DX , ADXR, and the absence of a choice of methods for calculating moving averages in the indicator.
According to the book by the author of the ADX indicator, W. Wilder, the indicator components were calculated using the SMA formula, however, the RMA moving average is used in the code of the built-in indicator in TradingView, which shows excellent results, but this is not a classic calculation method. In addition to SMA and RMA, there are also EMA , HMA , WMA , VWMA moving averages to choose from. Added the ability to display lines ADX , ADXR , DX , DI+, DI- and Equilibrium points (when DI+ and DI- are equal or intersect).
ADX Trading Rules
1. Trade the intersections of DI+ and DI-
2. Extreme Point Rule(EPR). EPR is formed when DI+, DI- (Equilibrium point) crosses, forming a trend reversal point at the extremum of the current bar. In the example on the ADX RMA chart, the DI- line is above DI+. Being in a short position at the reverse intersection of the DI- and DI + lines, it is necessary to take the high price of the crossing bar for the reversal point, upon breakdown of which, turn to long. In this example, the breakdown did not take place and the short position remained active, despite the intersection of the DI+ lines over DI-. This rule is an excellent filter that removes unnecessary transactions in the trading system.
3. DI+ > ADX and DI- > ADX. Stop trading trend-following systems.
4. If ADXR > 25, the trading system will be profitable. With ADXR < 20, trend-following systems need to stop trading. Many mistakenly use ADX values instead of ADXR . The author explicitly pointed to ADXR in his book.
5. Equilibrium Point - balance points. The accumulation of these points on the chart means the presence of a flat in the market. Accumulation often appears on a declining ADX after a top has been established on the ADX indicator. The smaller the distance between the points, the less significant movements occurred in the market.
6. For intraday trading of cryptocurrencies use can the following ADX settings:
DI Length = 100
ADX Smoothing = 14
MA Type = VWMA
Flat Zone = 30
P.S. Fragment from an interview with W. Wilder:
OH: You are probably best known for inventing the Relative Strength Index ( RSI ), Average Directional Index ( ADX ) and Average True Range (ATR). Which of these is the most powerful tool for a trader?
WW: The ADX .
OH: Is it the indicator you are most proud of?
WW: I guess so.
ADX Momentum cross + MacD + HH LL + Buy/Sell Signals and alerts Hello, This is the first indicator I have made and would like to contribute to the community.
This strategy came from trying to replicate a previous ADX Cross Indicator that I loved on MT4 which I used successfully on EUR/USD on high and low time frames. Through the process of trying to replicate it I failed, I decided to take what I had written so far and create my own ADX cross strategy using the combination of 3 ADX's, their lag. Then also using Higher highs and lower lows with the MacD to further filter the signals.
There are two buy and two sell conditions , the difference between these are just the order in which the ADX crossing determines the entry. The MacD and higher highs and lower lows are the same for filtering the signal.
You can change the look back for HH and LL look back range, along with the DI Length & ADX Smoothing for all ADX's. The lag used for either the buy or sell strategy with the Lag_Buy/Lag_Sell inputs. Lag_mid setting will affect all 4 conditions.
From testing and based on the ADX cross logic you should follow this structure when changing the inputs for:
DI Length: Lowest DI value (I.E. 1)
DI Lengtha: Middle DI value (I.E. 2)
DI Lengthb: Highest DI value (I.E. 3)
ADX Smoothing: Lowest Smoothing value (I.E. 1)
ADX Smoothinga: Middle Smoothing value (I.E. 2)
ADX Smoothingb: Highest Smoothing value (I.E. 3)
I tested this on the EUR/USD, but mainly I have been using it on BTC/USDT(binance) and BTC/USDT Perpetual futures(binance) with the 5 minute chart. I suggest playing around with the settings depending on the Symbol and timeframe you use because the default settings are what I last found to be optimal for my self on the 5min BTC/USDT Perpetual futures(binance) chart.
A good starting point I found when using the indicator on other charts is to use the below values:
DI Length: 7
DI Lengtha: 14
DI Lengthb: 21
ADX Smoothing: 7
ADX Smoothinga: 14
ADX Smoothingb: 21
If you have any questions, suggestions, or requests for this indicator feel free contact me. You can either comment on here or Message me
If you like this indicator please like and comment where you found it useful.

ADX with Shaded ZoneThe ADX with Shaded Zone indicator is a momentum-based tool that visualizes trend strength using the Average Directional Index (ADX) along with the +DI and -DI lines. This indicator enhances the traditional ADX setup by adding a shaded zone between ADX levels 20 and 25, helping traders easily identify the transition area between non-trending and trending market conditions.
It plots:
+DI (Green): Positive Directional Indicator
−DI (Red): Negative Directional Indicator
ADX (Blue): Measures the strength of the trend
Shaded Zone: Highlights the indecisive range where ADX is below 25 (gray background between levels 20 and 25)
⚙️ How to Use:
✅ Trend Identification:
ADX < 20: Weak or no trend. Avoid trend-following strategies.
ADX 20–25 (Shaded Zone): Transition zone. Potential trend forming — stay cautious.
ADX > 25: Stronger trend. Favor trend-following strategies.
✅ Direction Confirmation:
If +DI > -DI and ADX > 25 → Uptrend confirmation.
If -DI > +DI and ADX > 25 → Downtrend confirmation.
Crossovers between +DI and -DI can be used as early signals.
✅ Shaded Zone Use:
The gray shaded area helps visually filter out low-trend strength conditions.
Useful for trend traders to wait before entering until ADX breaks above 25.

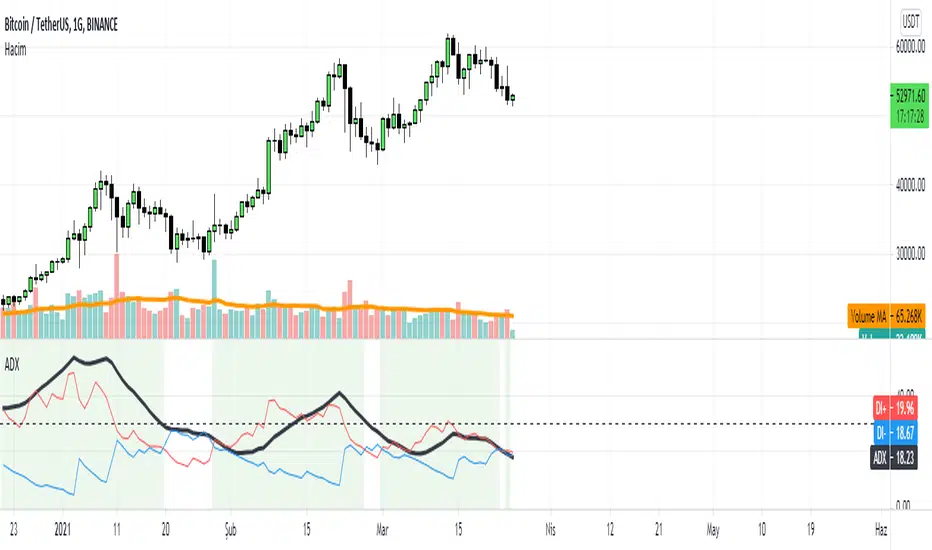
ADX with SignalsThis indicator basicly usind ADX ( Average Directional Index )
ADX can show us how trend is strong
ADX below 20: the market is currently not trending
ADX crosses above 20: signifies that a new trend is emerging. Traders may start placing sell or buy orders in the direction of the price movement.
ADX between 20 and 40: When the ADX is growing between 20 and 40 it is considered as a confirmation of an emerging trend. Traders should use this opportunity to buy or short sell in the trend's direction.
ADX above 40: the trend is very strong.
ADX crosses 50: the trend is extremely strong.
ADX crosses 70: a very rare occasion, which is called a “Power Trend.”
If we use ADX with DI+ and DI+ indactor can tell us to buy.
How can we calculate this all?
Directional Movement (DI) is defined as the largest part of the current period’s price range that lies outside the previous period’s price range. For each period calculate:
+DI = positive or plus DI = High - Previous High
-DI = negative or minus DI = Previous Low - Low
The smaller of the two values is reset to zero, i.e., if +DI > -DI , then -DI = 0. On an inside bar (a lower high and higher low), both +DI and -DI are negative values, so both get reset to zero as there was no directional movement for that period.
The True Range ( TR ) is calculated for each period, where:
TR = Max of ( High - Low ), ( High -PreviousClose ), ( PreviousClose - Low )
The +DI , -DI and TR are each accumulated and smoothed using a custom smoothing method proposed by Wilder. For an n period smoothing, 1/n of each period’s value is added to the total each period, similar to an exponential smoothing:
+DIt = (+DIt-1 - (+DIt-1 / n)) + (+DIt)
-DIt = (-DIt-1 - (-DIt-1 / n)) + (-DIt)
TRt = (TRt-1 - (TRt-1 / n)) + ( TRt )
Compute the positive/negative Directional Indexes, +DI and -DI , as a percentage of the True Range:
+DI = ( +DI / TR ) * 100
-DI = ( -DI / TR ) * 100
Compute the Directional Difference as the absolute value of the differences: DIdiff = | (( +DI ) - ( -DI )) |
Sum the directional indicator values: DIsum = (( +DI ) + ( -DI )) .
Calculate the Directional Movement index: DX = ( DIdiff / DIsum ) * 100 . The DX is always between 0 and 100.
Finally, apply Wilder’s smoothing technique to produce the final ADX value:
ADXt = ( ( ADXt-1 * ( n - 1) ) + DXt ) / n
When indicator tell us to buy?
If when DI+ crosses DI- and ADX is bigger than DI- indicator tell us to buy.
ADX mura visionOverview
The Enhanced ADX with Custom 40/60 Levels is a Pine Script™ v6 open-source indicator that builds on the classic Average Directional Index by adding two critical thresholds at 40 and 60. These extra levels give you early warning of trend exhaustion and precise exit signals when paired with the mura indicator.
Key Features & Originality
Custom Thresholds (40/60): Beyond the standard ADX levels (25/50), levels at 40 and 60 mark advanced trend strength phases and highlight when momentum is beginning to fade.
Trend Weakness Alerts: Configurable alerts trigger when ADX dips below 60 or 40, signaling ideal exit opportunities before a full reversal.
Color-Coded ADX Line: The ADX line dynamically changes color upon crossing 40 and 60, making trend strength transitions instantly visible.
mura Indicator Synergy: Specially designed to complement the mura indicator—when mura signals an exit and ADX falls below your chosen threshold, you get a high-confidence cue to close your position.
How It Works
Advanced Trend Phases: ADX above 25 confirms a trend, above 40 indicates strong momentum, and above 60 signals extreme strength. A drop below 60 or 40 warns of weakening momentum.
Exit Confirmation: Combine a mura exit signal (e.g., dot flip or reversal) with an ADX cross below 40/60 to capture optimal exit points.
Usage & Inputs
ADX Length (default 14): Period for ADX calculation.
Level Inputs: Customize your threshold levels (default: 25, 40, 50, 60).
Alert Toggles: Enable alerts on crosses above or below each level.
Style Settings: Adjust line colors and widths for ADX and threshold lines.
Why This Adds Value
Early Exit Signals: Identify momentum loss before major reversals, protecting profits.
Cleaner Trade Management: Visual cues reduce guesswork when exiting trades.
Modular Design: Use standalone or integrate with mura for robust entry/exit workflows.
Pine Script™ Version: v6
Open-Source License: MPL-2.0

ADX (levels)This Pine Script indicator calculates and displays the Average Directional Index (ADX) along with the DI+ and DI- lines to help identify the strength and direction of a trend. The script is designed for Pine Script v6 and includes customizable settings for a more tailored analysis.
Features:
ADX Calculation:
The ADX measures the strength of a trend without indicating its direction.
It uses a smoothing method for more reliable trend strength detection.
DI+ and DI- Lines (Optional):
The DI+ (Directional Index Plus) and DI- (Directional Index Minus) help determine the direction of the trend:
DI+ indicates upward movement.
DI- indicates downward movement.
These lines are disabled by default but can be enabled via input settings.
Customizable Threshold:
A horizontal line (hline) is plotted at a user-defined threshold level (default: 20) to highlight significant ADX values that indicate a strong trend.
Slope Analysis:
The slope of the ADX is analyzed to classify the trend into:
Strong Trend: Slope is higher than a defined "medium" threshold.
Moderate Trend: Slope falls between "weak" and "medium" thresholds.
Weak Trend: Slope is positive but below the "weak" threshold.
A background color changes dynamically to reflect the strength of the trend:
Green (light or dark) indicates trend strength levels.
Custom Colors:
ADX color is customizable (default: pink #e91e63).
Background colors for trend strength can also be adjusted.
Independent Plot Window:
The indicator is displayed in a separate window below the price chart, making it easier to analyze trend strength without cluttering the main price chart.
Parameters:
ADX Period: Defines the lookback period for calculating the ADX (default: 14).
Threshold (hline): A horizontal line value to differentiate strong trends (default: 20).
Slope Thresholds: Adjustable thresholds for weak, moderate, and strong trend slopes.
Enable DI+ and DI-: Boolean options to display or hide the DI+ and DI- lines.
Colors: Customizable colors for ADX, background gradients, and other elements.
How to Use:
Identify Trend Strength:
Use the ADX value to determine the strength of a trend:
Below 20: Weak trend.
Above 20: Strong trend.
Analyze Trend Direction:
Enable DI+ and DI- to check whether the trend is upward (DI+ > DI-) or downward (DI- > DI+).
Dynamic Slope Detection:
Use the background color as a quick visual cue to assess trend strength changes.
This indicator is ideal for traders who want to measure trend strength and direction dynamically while maintaining a clean and organized chart layout.

ADX and DI Trend meter and status table IndicatorThis ADX (Average Directional Index) and DI (Directional Indicator) indicator helps identify:
Trend Direction & Strength:
LONG: +DI above -DI with ADX > 20
SHORT: -DI above +DI with ADX > 20
RANGE: ADX < 20 indicates choppy/sideways market
Trading Signals:
Bullish: +DI crosses above -DI (green triangle)
Bearish: -DI crosses below +DI (red triangle)
ADX Strength Levels:
Strong: ADX ≥ 50
Moderate: ADX 30-49
Weak: ADX 20-29
No Trend: ADX < 20
Best Uses:
Trend confirmation before entering trades
Identifying ranging vs trending markets
Exit signal when trend weakens
Works well on multiple timeframes
Most effective in combination with other indicators
The table displays current trend direction and ADX strength in real-time
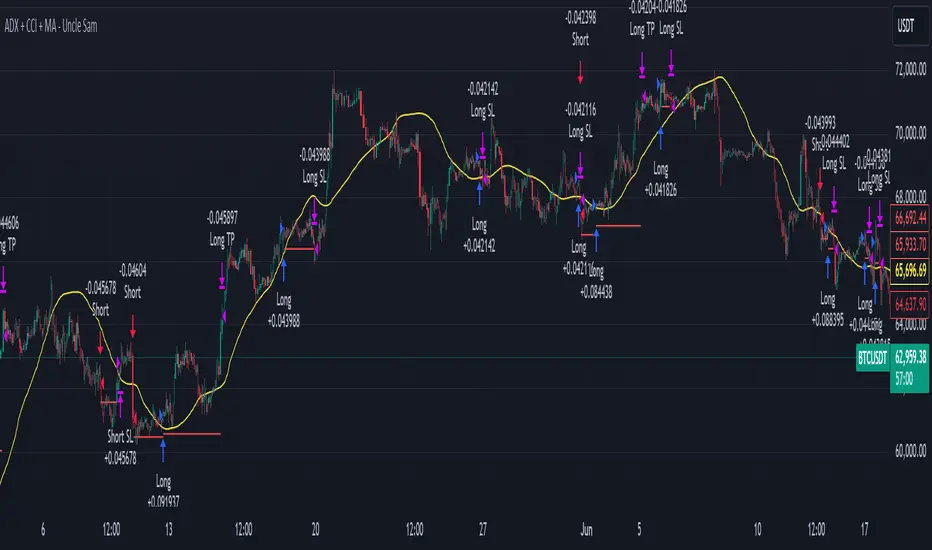
ADX + CCI + MA - Uncle SamStrategy Name: ADX + CCI + MA - Uncle Sam
Overview
This strategy aims to capitalize on trending markets by combining the Average Directional Index (ADX), Commodity Channel Index (CCI), and a customizable Moving Average (MA). It's designed for traders seeking a balanced approach to both long (buy) and short (sell) opportunities. Special thanks to the creators of the ADX and CCI indicators for their invaluable contributions to technical analysis.
Strategy Concept
The core idea is to identify strong trends with the ADX, confirm potential entry points with the CCI, and use the MA to filter trades in the direction of the broader trend. This approach seeks to avoid entering positions during periods of consolidation or when the trend is weak.
Indicator Logic
ADX (Average Directional Index): The ADX measures the strength of a trend, regardless of its direction. A value above the customizable adx_threshold (default 20) signals a strong trend, making it a prime environment for this strategy.
CCI (Commodity Channel Index): The CCI is a momentum oscillator that helps identify overbought (above 100) and oversold (below -100) conditions. We use CCI crossovers to time entries in the direction of the prevailing trend.
MA (Moving Average): The MA acts as a trend filter, ensuring we only enter trades aligned with the overall market direction. You have flexibility in choosing the MA type (SMA, EMA, etc.) and its length to suit your trading style and timeframe.
Entry Conditions
Long (Buy):
ADX is above the adx_threshold.
CCI crosses above 100.
Price is above the chosen Moving Average (if MA trend filtering is enabled).
Short (Sell):
ADX is above the adx_threshold.
CCI crosses below -100.
Price is below the chosen Moving Average (if MA trend filtering is enabled).
Exit Conditions
Stop Loss (SL): Each position has a customizable stop-loss percentage to manage risk. The default setting is 1%.
Take Profit (TP): Each position has a customizable take-profit percentage to secure gains. The default setting is 5%.
MA-Based Risk Management (Optional): This feature allows for early exits if the price closes against the MA trend for a specified number of candles. The default setting is 2 candles.
Default Settings
CCI Period: 15
ADX Length: 10
ADX Threshold: 20
MA Type: HMA
MA Length: 200
MA Source: Close
Commission Fee: $0.0
A commission fee is not added, add your trading/platform commission for realistic trading costs.
Backtest Results
The strategy has been backtested on with the default settings and a starting capital of $1000, with 0.0% commission fee. It shows promising results.
Disclaimer: Backtesting is hypothetical and does not guarantee future performance.
Important Considerations:
Customization: The strategy offers extensive customization to tailor it to your preferences. Experiment with different parameters and settings to find what works best for your trading style.
Risk Management: Always use proper risk management techniques, including position sizing and stop losses, to protect your capital.
ADX+ Oscillator📈 ADX+ Oscillator — Enhanced Trend Strength Indicator
🔹 Description:
A modified oscillator based on the ADX (Average Directional Index), providing both visual and digital interpretation of trend strength and direction. A powerful tool for filtering sideways markets and identifying strong impulses across any timeframe.
🔹 Features:
• ADX line to assess trend strength
• DI+ and DI− lines to determine trend direction
• Colored background zones:
• Gray: ranging market (ADX < 20)
• Orange: transition zone (20 ≤ ADX < 25)
• Green: strong trend (ADX ≥ 25)
• Digital value labels for ADX / DI+ / DI− on the latest candle
• Signal arrows when DI+ crosses DI− and vice versa
🔹 Why use it:
• Signal filtering: avoid trades in flat markets (ADX < 20)
• Trend confirmation: enter only when ADX is rising above 25
• Directional guidance via DI+ and DI− behavior
🔹 Best for:
• Scalping (1m, 5m)
• Intraday trading (15m, 1h)
• Swing trading (4h and above)
• Breakout and pullback strategies
ADX and DI (Colored Candles Open-Source)The "ADX and DI (Colored Candles Open-Source)" indicator is a technical analysis tool used in trading. It utilizes the Average Directional Index (ADX) and the Directional Movement Indicators (+DI and -DI) to assess the strength and direction of a price trend. The ADX is calculated based on a 14-period lookback and is displayed as a histogram.
The color of the ADX histogram varies depending on the ADX value and the relative positions of +DI and -DI. Green and purple colors represent bullish and bearish trends respectively, with variations in shades indicating trend strength. Yellow and red colors indicate potential trend exhaustion for bullish and bearish trends, respectively, when ADX is above 50. Gray color is used when ADX is below 10, indicating a neutral trend.
Additionally, the script plots +DI and -DI lines with a fill between them to visually represent their crossover. Horizontal dotted lines are drawn at key ADX levels (0, 10, 25, 50) for reference. The candles on the chart are also colored to match the ADX histogram, providing a clear visual representation of the market trend.

ADX Color Coded BarI use the Average Directional Index quite a lot in my trading both manual and automatic trading so i thought i would make it a little easier for myself and others to see if the ADX is above or below a certain value and to allow space on the chart for other indicators. This is done by plotting a green and red bar, green when the ADX is above a certain value and red when the ADX is below it.
Trading in the direction of a strong trend reduces risk and increases profit potential. The ADX is used to determine when the price is trending strongly. In many cases, it is the ultimate trend indicator. After all, the trend is your friend. ADX is usually plotted as a single line with values ranging from a low of zero to a high of 100. ADX is non-directional and registers trend strength whether price is trending up or down.
When the value of the ADX is going up above 20 which is the threshold i like to use, it means that there is more likely to be a confident move. So if you get an entry signal when the ADX bar is red the price is more likely to be in an area of consolidation where fakeouts could happen. It might be a good idea to stay away from entering trades here or remember to take some profits early and set the stop loss to break even.
Keep in mind that the ADX is a lagging indicator and not leading.

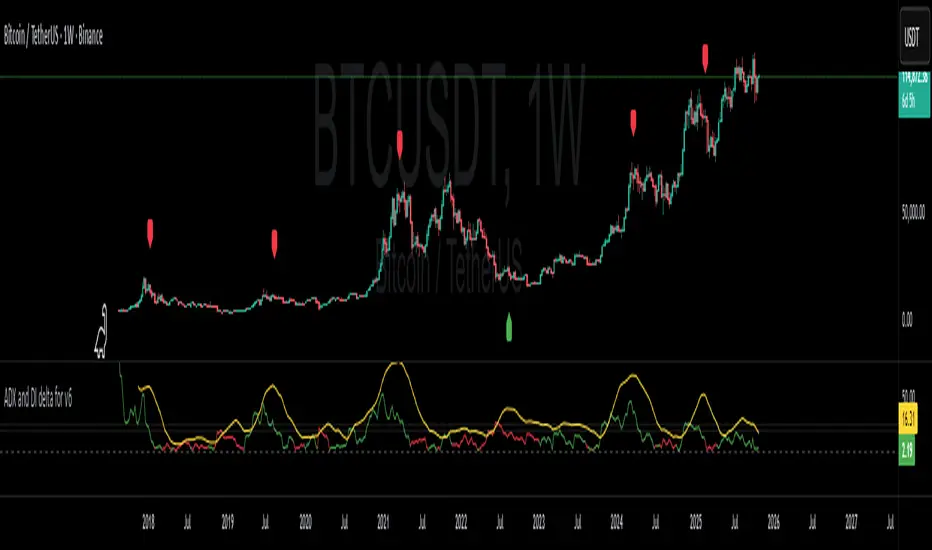
ADX and DI deltaJust a small adjustment to a well known indicator, the ADX with +DI and -DI.
I've always been annoyed of how cluttered this indicator is, specially do to the increasing gap between +DI and -DI, so I changed it up a bit.
ADX line has not been adjusted
+DI and -DI have now merged into deltaDI
deltaDI changes color depending on which value is higher (+DI > -DI = green line, else red line)
Plots a dashed 0 line (not editable)
Plots a two dotted lines at value 20 and 25 (editable)
Plots a label above/below price on the chart if the trend is exhausted and might end. (can be disabled)
Now you only have the ADX line together with a delta line.
The delta line is the gap between +DI and -DI and will change color depending on which one is highest and controlling the trend.
+DI = green line
-DI = red line
I've also added both a 20 and 25 horizontal dotted line.
Normally ADX should be 25 or higher to start a trend, but I do know a lot of people like to be greedy and jump in early in the trend build-up.
A dashed 0 line has been added, just because I felt like it. If either the ADX or delta ever cross below it without you editing the script yourself, just delete the script as it clearly doesn't do its job.
A red label_down will be plotted above the price when the ADX starts curling down and +DI > -DI. This indicates at best a breather for a bullish up trend or a possible reversal.
A red label_down will be plotted above the price if the ADX is above 25 and starts curling down while +DI > -DI. This indicates at best a breather for a bullish up trend or a possible reversal.
A green label_up will be plotted below the price if the ADX is above 25 and starts curling down while -DI > +DI. This indicates at best a breather for a bearish down trend or a possible reversal.
Enjoy my take on the indicator.
ADX Breakout Strategy█ OVERVIEW
The ADX Breakout strategy leverages the Average Directional Index (ADX) to identify and execute breakout trades within specified trading sessions. Designed for the NQ and ES 30-minute charts, this strategy aims to capture significant price movements while managing risk through predefined stop losses and trade limits.
This strategy was taken from a strategy that was posted on YouTube. I would link the video, but I believe is is "against house rules".
█ CONCEPTS
The strategy is built upon the following key concepts:
ADX Indicator: Utilizes the ADX to gauge the strength of a trend. Trades are initiated when the ADX value is below a certain threshold, indicating potential for trend development.
Trade Session Management: Limits trading to specific hours to align with optimal market activity periods.
Risk Management: Implements a fixed dollar stop loss and restricts the number of trades per session to control exposure.
█ FEATURES
Customizable Stop Loss: Set your preferred stop loss amount to manage risk effectively.
Trade Session Configuration: Define the trading hours to focus on the most active market periods.
Entry Conditions: Enter long positions when the price breaks above the highest close in the lookback window and the ADX indicates potential trend strength.
Trade Limits: Restrict the number of trades per session to maintain disciplined trading.
Automated Exit: Automatically closes all positions at the end of the trading session to avoid overnight risk.
█ HOW TO USE
Configure Inputs :
Stop Loss ($): Set the maximum loss per trade.
Trade Session: Define the active trading hours.
Highest Lookback Window: Specify the number of bars to consider for the highest close.
Apply the Strategy :
Add the ADX Breakout strategy to your chart on TradingView.
Ensure you are using a 30-minute timeframe for optimal performance.
█ LIMITATIONS
Market Conditions: The strategy is optimized for trending markets and may underperform in sideways or highly volatile conditions.
Timeframe Specific: Designed specifically for 30-minute charts; performance may vary on different timeframes.
Single Asset Focus: Primarily tested on NQ and ES instruments; effectiveness on other symbols is not guaranteed.
█ DISCLAIMER
This ADX Breakout strategy is provided for educational and informational purposes only. It is not financial advice and should not be construed as such. Trading involves significant risk, and you may incur substantial losses. Always perform your own analysis and consider your financial situation before using this or any other trading strategy. The source material for this strategy is publicly available in the comments at the beginning of the code script. This strategy has been published openly for anyone to review and verify its methodology and performance.

ADX with Color like MACD HistogramThis is a usual ADX Indicator but the colors change when the next bar falls or grows from the previous bar.
I think that the use of ADX can be maximized by seeing whether the movement is lower or higher than the previous like MACD Histogram.
The ADX indicator is very powerful for driving long-term trends and is effectively used for 4-hour or 1-hour Time Frames.
When ADX is above level 20, the color of the Bar will be blue or light blue. The blue bar means that the bar is higher than the previous bar. The light blue bar means the bar is lower than the previous one.
When ADX is below level 20, the color of the bar will be dark gray or light gray. The dark gray bar means that the bar is lower than the previous bar. The light gray bar means the bar is higher than the previous bar.
When the bar turns blue that's when we can add shares to our winning position.
When the price is above level 40, the background of the bars will be red, indicating that the price is in a very strong trend and will run out of its thrust soon. That's when we get ready to take profit, which is when the ADX Bar which is blue turns light blue.
-
FYI, I use ADX just for adding the shares to my winning position and exiting the market. I don't wait for ADX turns blue to enter the market.

ADX CandleCandles colors based on ADX and DI strength.
How to read:
ADX is less then 20 (adjustable value) is SILVER (no trend)
ADX >0 and DI delta (DI plus - DI minus) is >0 color LIME (trend up)
ADX>0 and DI delta <0 color RED (trend down)
ADX cross ADX Index ( adx+adx 14 period back)/2 color is BLACK and means start/end trend

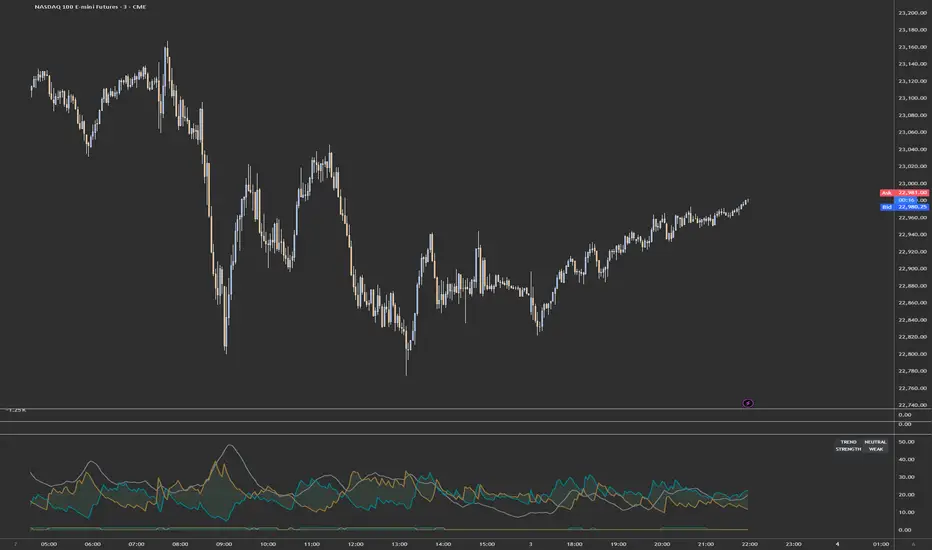
ADX Trend Strength with DashboardA comprehensive ADX (Average Directional Index) indicator featuring an intuitive real-time dashboard that helps traders quickly assess trend strength and direction at a glance.
Key Features:
Visual Analytics:
Standard ADX line with customizable +DI/-DI directional indicators
Color-coded background zones that automatically highlight trend strength (Weak/Ranging, Emerging, Strong, Very Strong, Extreme)
Optional fill between directional indicators for clear visual trend identification
Fully customizable colors and display options
Smart Dashboard:
Real-time ADX value with color-coded strength classification
Instant trend direction indicator (Bullish/Bearish/Neutral)
Trade signal suggestions based on ADX strength and DI crossovers
DI spread analysis showing conviction strength (Strong/Moderate/Weak)
Quick reference checks for key threshold levels
Fully adjustable position, size, and transparency
Customizable Thresholds:
Default levels at 20 (Emerging), 25 (Strong), 40 (Very Strong), and 50 (Extreme)
All threshold levels are adjustable to match your trading strategy
Visual reference lines on chart
Built-in Alerts:
ADX crossing major threshold levels (25, 40, 50)
Bullish/Bearish DI crossovers when ADX confirms strong trend
Set-and-forget notifications for trend changes
Perfect for:
Scalpers and day traders needing quick trend assessment
Swing traders filtering choppy markets from trending conditions
Multi-timeframe analysis with clear visual feedback
Settings: Fully customizable ADX length (default 14), DI length (default 14), and smoothing period (default 14) to adapt to any timeframe or market.
Does this capture everything you wanted, or would you like me to adjust the tone/emphasis on certain features?Claude is AI and can make mistakes. Please double-check responses.
