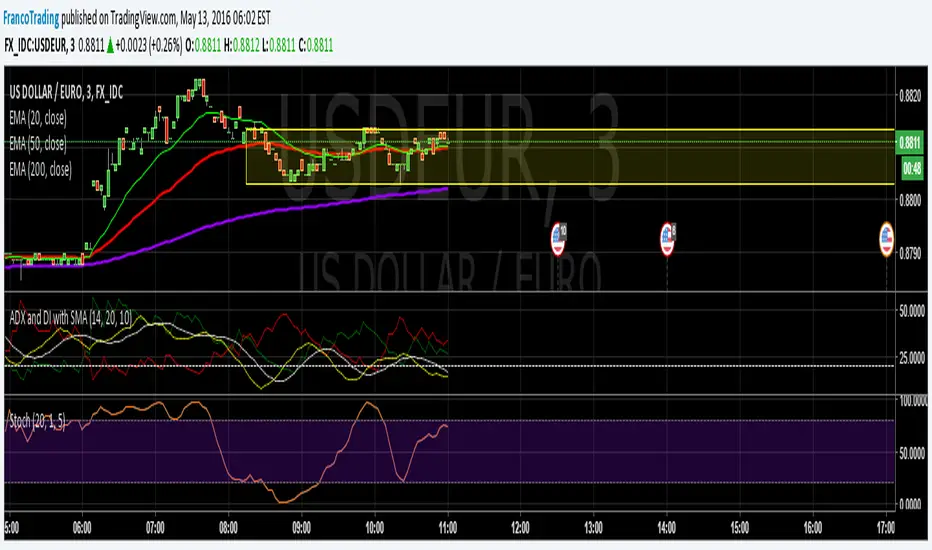
[naoligo] Simple ADXI'm publishing this indicator just for study purposes, because the result is exactly the same as DMI without the smoothing factor. It is exactly the same as ADX Wilder from MT5.
I was looking for the algorithm all over and it was a pain to find the right formula, meaning: one that would match with the built-in ones. After several study and comparison, I still didn't find the algorithm that match with the MT5's built-in simple ADX ...
Enjoy!
Cerca negli script per "adx"

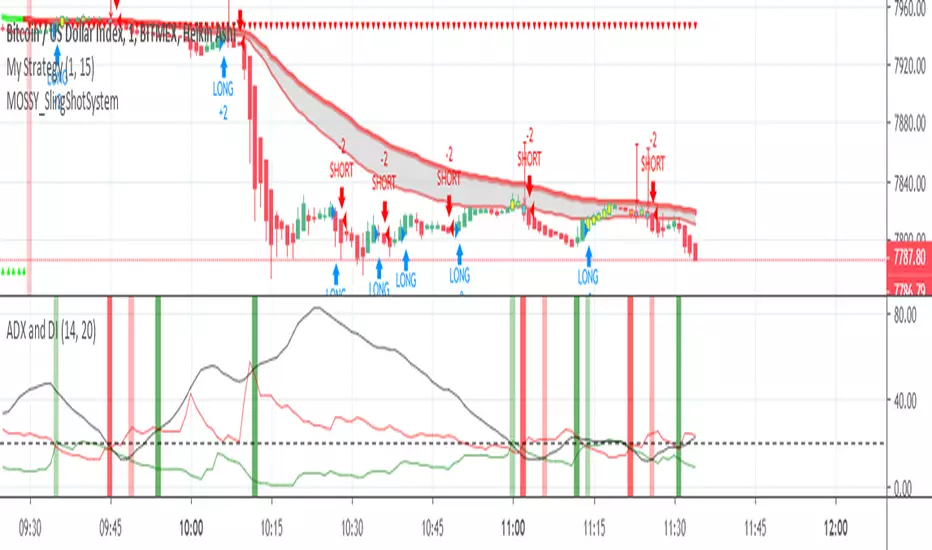
ADX and DI with SMAADX and DI with an additional configurable SMA,
The objective of this indicator is to provide a tool to asses if the price is trending (ADX above SMA) or range bound (ADX below SMA), to decide the type of strategy to apply.
Should be used at a larger time frame than the intended operation time frame.
ADX Indicator with VisualADX Indicator with line and clear number. Identifies when ADX Index is weak, trending, or strong. Depending on timeframe, this indicator can be used to identify early signs of a change in trend.
This is my first time creating an indicator and coding, so please, use it at your own discretion. If anyone has any helpful suggestions, please leave a comment. I can email you the source code so you can revise it. In return, I ask that you share the updated code with me so everyone that uses this indicator can benefit. Thank you! :)


ADX Colored by AO + DI DifferenceADX Colored by AO + DI Difference pepito
he Average Directional Index (ADX) is a technical analysis indicator used in trading to measure the strength of a trend in an asset's price, such as stocks, forex, or cryptocurrencies. Developed by J. Welles Wilder Jr. in 1978, it’s part of the Directional Movement Index (DMI) system.

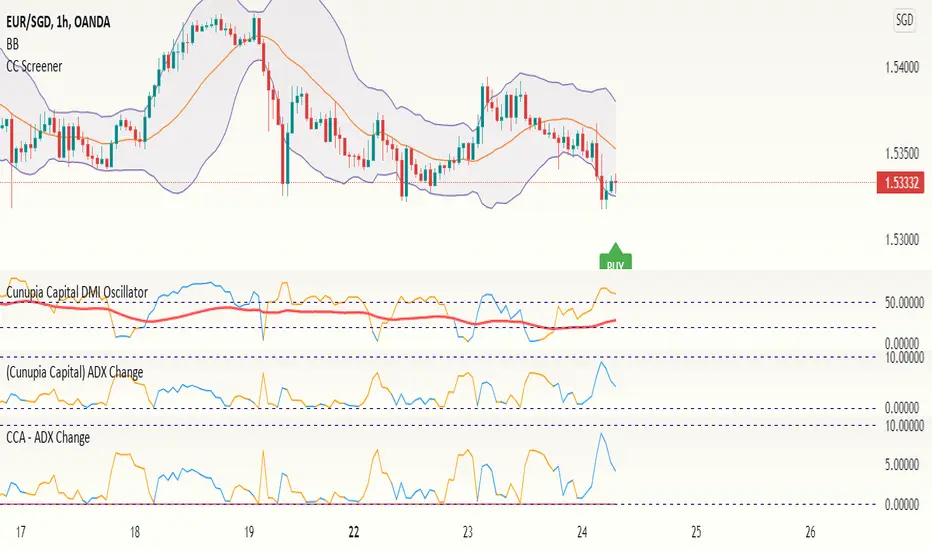
CCA - ADX ChangeThis shows the velocity in which the ADX value is moving. If the velocity is decreasing, the value will go to 0, if it's negative, the line will change to orange. Very useful to tell when the momentum is changing in a particular direction.
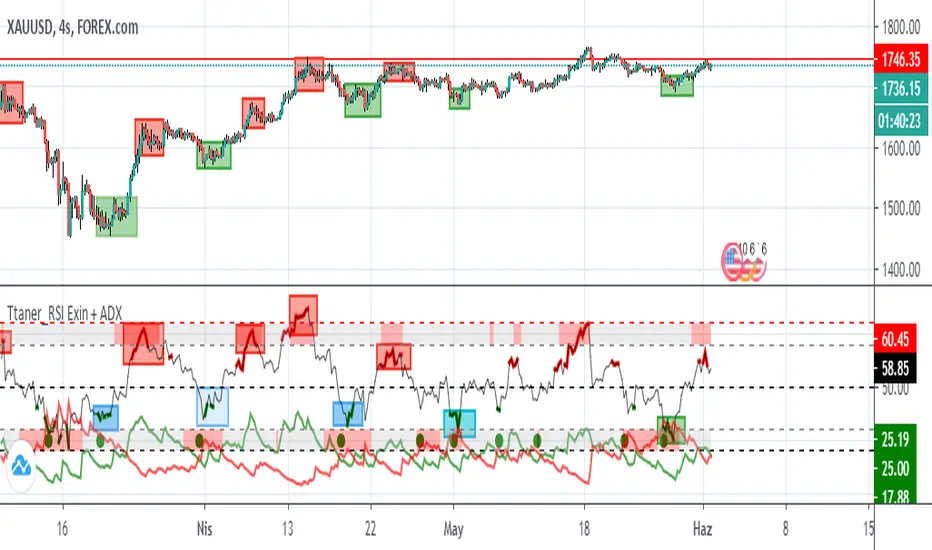
Relative Strength Index Exin + ADX Hello friends, I wish you all the best.
Relative Strength İndex + Adx coding.
I'd like to talk a little bit about how it works
We can say that the ascension action begins when the green line rises above the red line
you can measure the success rate of this indicator from the past.
RSI The green dots at the bottom show reception.
RSI The red dots on the top indicate that sales may come.
RSI means purchase when the bottom is green
When the RSI top line turns red, it means sales
If my sharing has helped you, you can like and support it. Stay tuned to be notified of new analysis and indicators
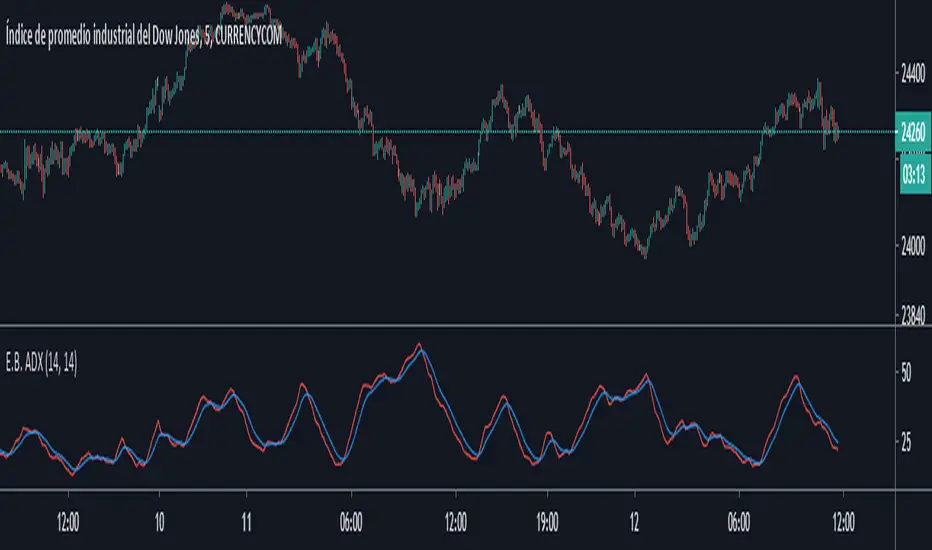
E.B. ADXThis is a simple ADX with an EMA (9) that we use in our Strategy.
When the Red line crosses above the ema, it will start a new "Trend Scenario".
When the red line crosses down the ema, it will start a market without trend.
If you want the indicator just DM me!
DMI + ADX + OBVThis trend following indicator is made up of 3 parts.
A normalized (OBV) On Balance Volume (the gray line) which ranges between -100 and 100 and has a 55 period SMA overlayed (the orange line) to give an indication of the overall trend as far as volume goes.
- If the volume decreases without a drop in price, it might indicate a move down.
- If volume increases without a rise rise in the price, it might indicate a move up.
The (DMI) Directional Movement Indicator which shows the strength of the bulls versus the bears.
- The red line measures how strongly price moves downwards.
- The green line measures how strongly price moves upwards.
One way to trade this is on crossovers e.g.when the green line crosses the red; although it's best to combine this with another indicator or pattern for confirmation.
Another useful feature of the DMI is the ability to see strength of buyers and sellers pressure at the same time, acting as a confirmation before entering a trade.
The third way to use the DMI is when price makes a new high but the green line does not. (Or the price makes a new low and the red line doesn't) This is known as divergence and should act as a warning to tighten your stops or take profits because it signals a possible change of direction.
The last part of the indicator is the (ADX) Average Directional Index
This is the blue line and shows the strength of the trend regardless of direction. This can act as a confirmation for the DMI or other indicators in your trading system.
When the blue line is:
- above the green shaded area there is an extreme trend.
- in the green shaded area there is a very strong trend.
- in the yellow shaded area there is a strong trend.
- below the yellow shaded area there is no trend.

Stochastic RSI 3in1 & Volatility peaks + ADX by AGUDescription:
3 Lines are Stochastic RSI's, strongest move is when all crosses and moves to one direction (from top or bottom).
Orange is original Stochastic of the timeline. (Live movement of price).
Green is original Stoch x 6. (Short term movement).
Red is original Stoch x27 (Long term price movement).
Transparent columns are ADX signal.
Higher the mountain, stronger the signal. When the mountain tops, trend usually change.
And finally the volatility peaks. Green peak HIGHEST volatility , RED peak LOWEST volatility .
I use it on 1 min BTC chart. But it works on all.
TIPS >> 3HCQ41cRpxcq2MJdRUSYoq9N1RnEy98xD2

Hashem DMI/ADXThis indicator will time Breakouts.
DMI+ (DMI Plus) = Blue = Buying Pressure.
DMI- (DMI Minus) = Pink = Selling Pressure.
ADX = Overall strength of a Trend. White = Trend is strong and gaining momentum, Gray = Trend is Weakening.
Can apply same logic for Divergences on DMI+ and DMI- lines.

ATR-ADX Chandelier Exit ComboAcknowledgements: Everget for Chandelier Exit indicator, mortdiggiddy
for the Adaptive ATR-ADX Trend indicator
This indicator is a duct-tape combination of the two aforementioned indicators. I wanted a combination of potential stop options, some dynamic and others not, but both at the same time. It is less intrusive/clunky than the Fib-Pivot-Stop indicator, but not by much - I'm not sure how useful this would be considering the amount of visual real estate it takes on the chart compared to other indicators.
BO ADX Binary Option strategy based on ADX/DI cross, Put or Call at the beginning of the next candle, expire 5m for 5m candle.


Mossy ADX and DIBasic ADX DI with colored bars to show buy and sell signals , made for 1min but shows general signals of strong or weak buy and sell signals.
Dark Red = Heavy Signal
Light Red = weak signal
green = buy signal
Hashharvest - ADX Indicator v1This is an ADX indicator with a kick. Also shows DM+ and DM-. Allows you to turn off these indicators. This also has horizontal indicators that tell with the trend maybe trendless (20), gaining (25), and trending (30). These indicators can change to accommodate your trading.

DMI ADXThis is the combination of ADX and DMI.
It will tell you about the trend strength.
In easy language Green is for bullish , red is for bearish ,and third line which is of blue and yellow will tell you about the trend strength doesn't matter in which direction. Blue will tell you that trend is getting strength and vice versa for yellow.
Keep an eye at crossovers.
New scripts r ready just doing some last testing will be out soon just wait for some more time :)
all the Scripts here will be free and always will be.
For my Indian friends a special surpriszzz is coming soon ;)
Hope you got my point.
Happy trading :)
15min Chart
1Hr chart

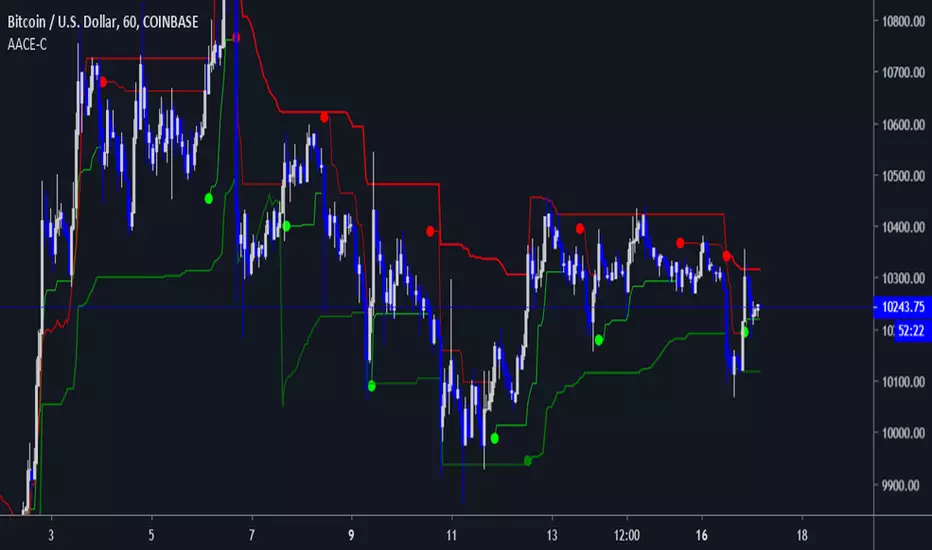
[Long/Short] Range Filter-ADXIt's a useful script for pairs where you can operate long and short.
It's a combination algorithm of the Range filter and the ADX.
The ADX helps to make the decision to enter to open long or short position.
LG --> Long
xL --> Close Long position
ST --> Short
xS --> close Short Position
Enjoy!!!


[FT] ADX-Multi-TF by FractalTraderAverage Directional Index is a way to determine trend strength (and whether there is a trend). One of the caveats is when you have trendless conditions on a higher timeframe. You can get whipsaw conditions on the current timeframe in that case.
The purpose of this script is to put ADX into the context of a higher degree trend on a single indicator.

ADX with Customisable LevelsADX with Customisable Levels.
25 for strong trend
50 for Very strong trend
75 for unsustainable strong trend.
