Cerca negli script per "adx"


ADX / Connectable [Azullian]
Streamline your strategy with the ADX indicator. Precisely analyze market strength and direction, integrating these insights for more adaptable trading decisions.
This connectable ADX indicator is part of an indicator system designed to help test, visualize and build strategy configurations without coding. Like all connectable indicators , it interacts through the TradingView input source, which serves as a signal connector to link indicators to each other. All connectable indicators send signal weight to the next node in the system until it reaches either a connectable signal monitor, signal filter and/or strategy.
█ UNIFORM SETTINGS AND A WAY OF WORK
Although connectable indicators may have specific weight scoring conditions, they all aim to follow a standardized general approach to weight scoring settings, as outlined below.
■ Connectable indicators - Settings
• 🗲 Energy: Energy applies an ATR multiplier to the plotted shapes on the chart. A higher value plots shapes farther away from the candle, enhancing visibility.
• ☼ Brightness: Brightness determines the opacity of the shape plotted on the chart, aiding visibility. Indicator weight also influences opacity.
• → Input: Use the input setting to specify a data source for the indicator. Here you can connect the indicator to other indicators.
• ⌥ Flow: Determine where you want to receive signals from:
○ Both: Weights from this indicator and the connected indicator will apply
○ Indicator only: Only weights from this indicator will apply
○ Input only: Only weights from the connected indicator will apply
• ⥅ Weight multiplier: Multiply all weights in the entire indicator by a given factor, useful for quickly testing different indicators in a granular setup.
• ⥇ Threshold: Set a threshold to indicate the minimum amount of weight it should receive to pass it through to the next indicator.
• ⥱ Limiter: Set a hard limit to the maximum amount of weight that can be fed through the indicator.
■ Connectable indicators - Weight scoring settings
▢ Weight scoring conditions
• SM – Signal mode: Enable specific conditions for weight scoring
○ All: All signals will be scored.
○ Entries only: Only entries will score
○ Exits only: Only exits will score.
○ Entries & exits: Both entries and exits will score.
○ Zone: Continuous scoring for each candle within the zone.
• SP – Signal period: Defines a range of candles within which a signal can score.
• SC - Signal count: Specifies the number of bars to retrospectively examine and score.
○ Single: Score for a single occurrence
○ All occurrences: Score for all occurrences
○ Single + Threshold: Score for single occurrences within the signal period (SP)
○ Every + Threshold: Score for all occurrences within the signal period (SP)
▢ Weight scoring direction
• ES: Enter Short weight
• XL: Exit long weight
• EL: Enter Long weight
• XS: Exit Short weight
▢ Weight scoring values
• Weights can hold either positive or negative scores. Positive weights enhance a particular trading direction, while negative weights diminish it.
█ ADX - INDICATOR SETTINGS
■ Main settings
• Enable/Disable Indicator: Toggle the entire indicator on or off.
• S - Source: Choose an alternative data source for the ADX calculation.
• T - Timeframe: Select an alternative timeframe for the ADX calculation.
• SM - Smoothing: Smooth the length averages.
• LE - DI Length: Determine the DI: Directional indicator length.
• TH - Trend threshold: Specify the level the ADX has to cross
• EM - Entry signal mode: Determine entry mode
○ DI: Use only DI+ and DI- crossings
○ DI + ADX: Use DI with increasing ADX
○ DI + ADX + Invert: Use DI with increasing ADX and DI with decreasing ADX
• XM - Exit signal mode: Determine exit mode
○ DI: Use DI crossing to exit
○ ADX: Use decreasing ADX to signal exit
■ Scoring functionality
• The ADX scores long entries when the ADX crosses the TH: Trend threshold and +DM is greater than -DM
• The ADX scores long exits when the ADX falls back below the TH: Trend threshold and +DM is greater than -DM
• The ADX scores long zones the entire time the ADX is above the TH: Trend threshold and +DM is greater than -DM
• The ADX scores short entries when the ADX crosses the TH: Trend threshold and +DM is smaller than -DM
• The ADX scores short exits when the ADX falls back below the TH: Trend threshold and +DM is smaller than -DM
• The ADX scores short zones the entire time the ADX is above the TH: Trend threshold and +DM is smaller than -DM
█ PLOTTING
• Standard: Symbols (EL, XS, ES, XL) appear relative to candles based on set conditions. Their opacity and position vary with weight.
• Conditional Settings: A larger icon appears if global conditions are met. For instance, with a Threshold(⥇) of 12, Signal Period (SP) of 3, and Scoring Condition (SC) set to "EVERY", an ADX signaling over two times in 3 candles (scoring 6 each) triggers a larger icon.
█ USAGE OF CONNECTABLE INDICATORS
■ Connectable chaining mechanism
Connectable indicators can be connected directly to the signal monitor, signal filter or strategy , or they can be daisy chained to each other while the last indicator in the chain connects to the signal monitor, signal filter or strategy. When using a signal filter you can chain the filter to the strategy input to make your chain complete.
• Direct chaining: Connect an indicator directly to the signal monitor, signal filter or strategy through the provided inputs (→).
• Daisy chaining: Connect indicators using the indicator input (→). The first in a daisy chain should have a flow (⌥) set to 'Indicator only'. Subsequent indicators use 'Both' to pass the previous weight. The final indicator connects to the signal monitor, signal filter and/or strategy.
■ Set up this indicator with a signal filter and strategy
The indicator provides visual cues based on signal conditions. However, its weight system is best utilized when paired with a connectable signal filter, signal monitor, and/or strategy .
Let's connect the ADX to a connectable signal filter and a strategy :
1. Load all relevant indicators
• Load ADX / Connectable
• Load Signal filter / Connectable
• Load Strategy / Connectable
2. Signal Filter: Connect the ADX to the Signal Filter
• Open the signal filter settings
• Choose one of the three input dropdowns (1→, 2→, 3→) and choose : ADX / Connectable: Signal Connector
• Toggle the enable box before the connected input to enable the incoming signal
3. Signal Filter: Update the filter signals settings if needed
• The default settings of the filter enable EL (Enter Long), XL (Exit Long), ES (Enter Short) and XS (Exit Short).
4. Signal Filter: Update the weight threshold settings if needed
• All connectable indicators load by default with a score of 6 for each direction (EL, XL, ES, XS)
• By default, weight threshold (TH) is set at 5. This allows each occurrence to score, as the default score in each connectable indicator is 1 point above the threshold. Adjust to your liking.
5. Strategy: Connect the strategy to the signal filter in the strategy settings
• Select a strategy input → and select the Signal filter: Signal connector
6. Strategy: Enable filter compatible directions
• Set the signal mode of the strategy to a compatible direction with the signal filter.
Now that everything is connected, you'll notice green spikes in the signal filter representing long signals, and red spikes indicating short signals. Trades will also appear on the chart, complemented by a performance overview. Your journey is just beginning: delve into different scoring mechanisms, merge diverse connectable indicators, and craft unique chains. Instantly test your results and discover the potential of your configurations. Dive deep and enjoy the process!
█ BENEFITS
• Adaptable Modular Design: Arrange indicators in diverse structures via direct or daisy chaining, allowing tailored configurations to align with your analysis approach.
• Streamlined Backtesting: Simplify the iterative process of testing and adjusting combinations, facilitating a smoother exploration of potential setups.
• Intuitive Interface: Navigate TradingView with added ease. Integrate desired indicators, adjust settings, and establish alerts without delving into complex code.
• Signal Weight Precision: Leverage granular weight allocation among signals, offering a deeper layer of customization in strategy formulation.
• Signal Filtering: Define entry and exit conditions with more clarity, granting an added layer of strategy precision.
• Clear Visual Feedback: Distinct visual signals and cues enhance the readability of charts, promoting informed decision-making.
• Standardized Defaults: Indicators are equipped with universally recognized preset settings, ensuring consistency in initial setups across different types like momentum or volatility.
• Reliability: Our indicators are meticulously developed to prevent repainting. We strictly adhere to TradingView's coding conventions, ensuring our code is both performant and clean.
█ COMPATIBLE INDICATORS
Each indicator that incorporates our open-source 'azLibConnector' library and adheres to our conventions can be effortlessly integrated and used as detailed above.
For clarity and recognition within the TradingView platform, we append the suffix ' / Connectable' to every compatible indicator.
█ COMMON MISTAKES, CLARIFICATIONS AND TIPS
• Removing an indicator from a chain: Deleting a linked indicator and confirming the "remove study tree" alert will also remove all underlying indicators in the object tree. Before removing one, disconnect the adjacent indicators and move it to the object stack's bottom.
• Point systems: The azLibConnector provides 500 points for each direction (EL: Enter long, XL: Exit long, ES: Enter short, XS: Exit short) Remember this cap when devising a point structure.
• Flow misconfiguration: In daisy chains the first indicator should always have a flow (⌥) setting of 'indicator only' while other indicator should have a flow (⌥) setting of 'both'.
• Hide attributes: As connectable indicators send through quite some information you'll notice all the arguments are taking up some screenwidth and cause some visual clutter. You can disable arguments in Chart Settings / Status line.
• Layout and abbreviations: To maintain a consistent structure, we use abbreviations for each input. While this may initially seem complex, you'll quickly become familiar with them. Each abbreviation is also explained in the inline tooltips.
• Inputs: Connecting a connectable indicator directly to the strategy delivers the raw signal without a weight threshold, meaning every signal will trigger a trade.
█ A NOTE OF GRATITUDE
Through years of exploring TradingView and Pine Script, we've drawn immense inspiration from the community's knowledge and innovation. Thank you for being a constant source of motivation and insight.
█ RISK DISCLAIMER
Azullian's content, tools, scripts, articles, and educational offerings are presented purely for educational and informational uses. Please be aware that past performance should not be considered a predictor of future results.

ADX and DI-BolarinwaThe Average Directional Movement Index (ADX) is a technical indicator that measures the strength of a trend. While the indicator itself doesn’t give an insight into the direction of the trend, the Directional Movement lines can be used to determine if the market moves up or down.
The ADX can return a value between 0 and 100. The usual threshold for a market to be considered as trending by the ADX is a value of 25 or above. Values between 25 and 50 signal a trending market, between 50 and 75 very strong trends and between 75 and 100 extremely strong trends.
The ADX Crossover Trading Strategy
A popular trading strategy to trade on the ADX is based on a crossover of the directional movement lines (+DI and -DI) which was developed directly by the indicator’s creator Mr. Wilder.
The trading strategy states that the first condition for a trade setup is that the ADX has a value of 25 or above, which indicates a trending market.
A buy order is triggered when +DI crosses above -DI, i.e. the underlying trend is an uptrend, while a sell signal is triggered when -DI crosses above +DI, i.e. the underlying trend is a downtrend.
Stop-losses are placed at the low of the current trading day, and the trade setup remains valid even if the directional movement lines cross again after the trade signal. Only a break of the current trading day’s low would lead to the trade setup becoming invalid.
If the ADX remains above 25 or rises even higher, indicating that the strength of the underlying trend increases, then traders can put a trailing stop on the trade.
The following chart shows an example of the ADX crossover strategy on the daily EUR/USD pair.
ADX Crossover Strategy
The first cross of -DI above +DI didn’t send a sell signal because the ADX was below 25. The sell signal came with ADX crossing above 25, while the -DI was still above +DI. On the chart, the SL was put just above the day’s high.
The second signal was a buy signal, with the cross of +DI above -DI and the ADX above 25, signaling a strong trend. The stop-loss is placed just below the day’s low, indicated by the dotted line on the chart.
Finally, the third sell signal came with the cross of -DI above -DI and the ADX above 25. Again, the stop-loss is placed just above the day’s high.
While the ADX crossover strategy can also be applied to lower timeframes, you need to be aware that the increased market noise may create more false signals than on the higher timeframes. The following chart is a 5-minute chart with buy and sell signals based on the crossover strategy. Notice that we placed the stop-losses slightly different than in the previous example. In this case, stop-losses have been placed at the recent highs and lows of the price.
ADX Trading Graph
The first buy signal came with +DI crossing above -DI and ADX above 25. In the middle of the chart, you can notice the crosses of the directional movement lines (+DI and -DI) while the ADX was below 25. As ADX needs to be above 25, those crosses are not used as entry triggers based on the ADX crossover strategy.
After that we received a sell signal with -DI crossing above +DI and ADX above 25, which is followed by a buy signal when +DI crossed above -DI.
Using ADX for Trade Confirmations
Beside the ADX crossover strategy which is based on the crosses of +DI and -DI, traders can also use the ADX indicator to supplement other trading strategies. For example, you might want to use a trend-following strategy when ADX shows a strong trend (value above 25), or a trading strategy that is more suited for ranging markets in times when the ADX shows an absence of trends (value below 25).
Before You Trade
The Average Directional Movement Index is a versatile technical indicator that can be used as a stand-alone trading strategy, or in combination with other trading strategies. The ADX crossover strategy is based on the crossover of the directional movement lines (+DI and -DI) and an ADX reading of above 25. While it can be used across all timeframes, it usually returns the best results on higher ones.
As the ADX measures the strength of the underlying trend, trend-following traders can use it to filter flat and ranging markets and avoid trading during those times.
ADX Color Change by BehemothI find this tool to be the most valuable and accurate entry point indicator along with moving averages and the VWAP.
ADX Color Indicator - Controls & Intraday Trading Benefits
Indicator Controls:
1. ADX Length (default: 14)
- Controls the calculation period for ADX
- Lower values (7-10) = more sensitive, faster signals (better for scalping)
- Higher values (14-20) = smoother, fewer false signals (better for swing trades)
- *Intraday tip:* Try 10-14 for most intraday timeframes
2. Show Threshold Levels (default: On)
- Displays the 20 and 25 horizontal lines
- Helps you quickly identify when ADX crosses key strength levels
3. Use Custom Timeframe (default: Off)
- Allows viewing higher timeframe ADX on lower timeframe charts
- *Example:* Trade on 5-min chart but see 15-min or 1-hour ADX
4. Custom Timeframe
- Select any timeframe: 1m, 5m, 15m, 30m, 1H, 4H, D, etc.
- *Intraday tip:* Use 15m or 1H ADX on 5m charts for better trend context
5. Show +DI and -DI (default: Off)
- Shows directional movement indicators
- Green line (+DI) > Red line (-DI) = bullish trend
- Red line (-DI) > Green line (+DI) = bearish trend
6. Show Background Zon es (default: Off)
- Visual background colors for quick trend strength identification
- Green = strong trend (ADX > 25)
- Yellow = moderate trend (ADX 20-25)
Intraday Trading Benefits:
1. Avoid Choppy Markets
- When ADX < 20 (no background color), market is ranging
- Reduces false breakout trades and whipsaws
- Save time and capital by stepping aside during low-quality setups
2. Identify High-Probability Trend Trades
- **Green line + Green zone** = strong trend building, look for pullback entries
- Yellow line crossing above 20 = early trend formation signal
- Catch trends early when ADX starts rising from below 20
3. Multi-Timeframe Analysis
- Use custom timeframe to align with higher timeframe trends
- *Example:* If 1H ADX shows green (strong trend), take breakout trades on 5m chart in same direction
- Increases win rate by trading with the bigger picture
4. Exit Signals
- When ADX turns red (falling), trend is weakening
- Consider tightening stops or taking profits
- Avoid entering new positions when ADX is declining
5. Quick Visual Confirmation
- Color coding eliminates need to analyze numbers
- Instant recognition: Green = go, Yellow = caution, Red = trend dying
- Faster decision-making during fast market moves
6. Scalping Strategy
- Set ADX length to 7-10 for sensitive signals
- Only scalp when ADX is rising (blue, yellow, or green)
- Exit when ADX turns red
7. Breakout Confirmation
- Wait for ADX to rise above 20 after a breakout
- Filters false breakouts in ranging markets
- Yellow or green color confirms momentum behind the move
Optimal Intraday Settings:
- Day Trading (5-15 min charts):** ADX Length = 10-14
- Scalping (1-5 min charts):** ADX Length = 7-10, watch custom 15m timeframe
- Swing Intraday (30min-1H charts):** ADX Length = 14-20
Simple Trading Rules:
✅ Trade: ADX rising + above 20 (yellow or green)
⚠️ Caution: ADX flat or just crossed 20
❌ Avoid:*ADX falling (red) or below 20
The key advantage is staying out of low-quality, choppy price action which is where most intraday traders lose money!

ADX Trend Strength Analyzer█ OVERVIEW
This script implements the Average Directional Index (ADX), a powerful tool used to measure the strength of market trends. It works alongside the Directional Movement Index (DMI), which breaks down the directional market pressure into bullish (+DI) and bearish (-DI) components. The purpose of the ADX is to indicate when the market is in a strong trend, without specifying the direction. This indicator can be especially useful for identifying market trends early and validating trading strategies based on trend-following systems.
The ADX component in this script is based on two key parameters:
ADX Smoothing Length (adxlen), which determines the degree of smoothing for the trend strength.
DI Length (dilen), which defines the look-back period for calculating the directional index values.
Additionally, a horizontal line is plotted at the 30 level, providing a widely used threshold that signifies when a trend is considered strong (above 30).
█ CONCEPTS
Directional Movement (DM): The core idea behind this indicator is the calculation of price movement in terms of bullish and bearish forces. By evaluating the change in highs and lows, the script distinguishes between bullish movement (+DM) and bearish movement (-DM). These values are normalized by dividing them by the True Range (TR), creating the +DI and -DI values.
True Range (TR): The True Range is calculated using the Average True Range (ATR) formula, and it serves to smooth out volatility, ensuring that short-term fluctuations don't distort the long-term trend signal.
ADX Calculation: The ADX is derived from the absolute difference between the +DI and -DI. By smoothing this difference and normalizing it, the ADX is able to measure the overall strength of the trend without regard to whether the market is moving up or down. A rising ADX indicates increasing trend strength, while a falling ADX signals weakening trends.
█ METHODOLOGY
Directional Movement Calculation: The script first determines the upward and downward price movement by comparing changes in the high and low prices. If the upward movement is greater than the downward movement, it registers a bullish signal and vice versa for bearish movement.
True Range Adjustment: The script then applies a smoothing function to normalize these movements by dividing them by the True Range (ATR). This ensures that the trend signal is based on relative, rather than absolute, price movements.
ADX Signal Generation: The final step is to calculate the ADX by applying the Relative Moving Average (RMA) to the difference between +DI and -DI. This produces the ADX value, which is plotted in red, making it easy to visualize shifts in market momentum.
Threshold Line: A blue horizontal line is plotted at 30, which serves as a key reference point. When the ADX is above this line, it indicates a strong trend, whether bullish or bearish.
█ HOW TO USE
Trend Strength: Traders typically use the 30 level as a critical threshold. When the ADX is above 30, it signifies a strong trend, making it a favorable environment for trend-following strategies. Conversely, ADX values below 30 suggest a weak or non-trending market.
+DI and -DI Relationship: The indicator also provides insight into whether the trend is bullish or bearish. When +DI is greater than -DI, the market is considered bullish. When -DI is greater than +DI, the market is considered bearish. While this script focuses on the ADX value itself, the underlying +DI and -DI help interpret the trend direction.
Market Conditions: This indicator is effective in trending markets, but not ideal for choppy or sideways conditions. Traders can use it to determine the best entry and exit points when trends are strong, or to avoid trading in periods of low volatility.
Combining with Other Indicators: The ADX is commonly used in conjunction with oscillators like RSI or moving averages, to confirm the trend strength and avoid false signals.
█ METHOD VARIANTS
This script applies the standard approach for calculating the ADX, but could be adapted with the following variants:
Different Timeframes: The script could be modified to calculate ADX values across higher or lower timeframes, depending on the trader's strategy.
Custom Thresholds: Instead of using the default 30 threshold, traders could adjust the horizontal line to suit their own risk tolerance or market conditions.

ADX & DI with dynamic threshold indicator
ADX and DI with Dynamic Threshold
This Pine Script indicator, "ADX & DI with Dynamic Threshold," helps traders detect trends, trend reversals, and trend strength using the Average Directional Index (ADX) and the Directional Indexes (DI+ and DI-). It incorporates a dynamic threshold calculated using the average ADX over a user-defined period, along with a fixed minimum threshold, making trend detection more flexible and adaptable.
ADX and Directional Indexes (DI+ and DI-)
ADX measures the strength of a trend, while DI+ and DI- measure the direction of the trend. High DI+ signals upward price strength, and high DI- signals downward price strength.
Dynamic Threshold
A threshold based on the average ADX over a certain number of periods, ensuring the indicator adapts to market conditions. The threshold is compared to DI+ and DI- to generate trend signals.
Fixed Minimum Threshold
A user-defined minimum threshold ensures that signals are only generated in markets with a certain level of trend strength, preventing false signals in low-trending markets.
Visual Highlights
The background color highlights:
Green for potential uptrend,
Red for potential downtrend, and
Orange when directional movement is strong but trend strength is weak, helping traders avoid false signals in sideways markets.
Customization
Several input parameters allow for complete customization of the indicator, ensuring it can adapt to different timeframes and assets.
How to Use
Length (len)
This is the smoothing period used to calculate the ADX and DI+/- values. Range: 5 to 50 (default: 14).
Threshold Period (th_period)
Determines the number of periods over which the dynamic ADX threshold is calculated. Range: 5 to 200 (default: 50).
Fixed Minimum Threshold (fixed_th)
The minimum ADX value that must be exceeded for the indicator to trigger signals. Range: 10 to 40 (default: 20).
Smoothing Method
Choose between SMA (Simple Moving Average) or EMA (Exponential Moving Average) for smoothing the true range and directional movement calculations.
DI+ (Green)
Indicates the strength of upward price movements.
DI- (Red)
Indicates the strength of downward price movements.
ADX (Navy)
Indicates the overall strength of the trend, regardless of direction.
Dynamic Threshold (Gray)
The dynamic threshold used for comparing ADX values.
Fixed Threshold Line
A dotted black line showing the user-defined minimum threshold for ADX.
Green Background
Indicates a potential uptrend when DI+ > DI- and ADX is above the threshold.
Red Background
Indicates a potential downtrend when DI- > DI+ and ADX is above the threshold.
Orange Background
Indicates that DI+ or DI- are strong, but ADX is weak, suggesting a lack of trend strength despite directional movement, which could lead to false signals.
Adjust the length (len) based on the volatility of the asset. A lower len (e.g., 10) may be suitable for faster timeframes (like 5-min charts), while a higher value (e.g., 20-30) may work better on longer timeframes.
Use the threshold period (th_period) to fine-tune the dynamic ADX threshold. A higher value smooths the dynamic threshold over a longer period, making it more resistant to sudden volatility.
Fixed Threshold (fixed_th) should be set based on the strength of trends you want to capture. A higher value (e.g., 30-40) is more conservative and will only trigger signals in very strong trends.
Example Usage
This indicator can be used to:
Identify trends: When the ADX crosses the threshold and DI+ or DI- is dominant, indicating an uptrend or downtrend.
Spot trend reversals: When DI+ and DI- cross each other with a strong ADX reading.
Avoid false signals: By recognizing when DI+ or DI- are strong, but the ADX is below the threshold (highlighted in orange).
Conclusion
The ADX and DI with Dynamic Threshold indicator is a versatile tool for trend-following strategies. It adapts to market conditions using dynamic and fixed thresholds and provides clear visual signals to help traders make informed decisions about market direction and trend strength.
By adjusting the various input parameters, this indicator can be tailored to any asset class or timeframe, making it suitable for all types of traders, from scalpers to swing traders.
Feel free to experiment with different settings and incorporate this indicator into your trading strategy for enhanced market analysis.

ADX with Donchian Channels
The "ADX with Donchian Channels" indicator combines the Average Directional Index (ADX) with Donchian Channels to provide traders with a powerful tool for identifying trends and potential breakouts.
Features:
Average Directional Index (ADX):
The ADX is used to quantify the strength of a trend. It helps traders determine whether a market is trending or ranging.
Adjustable parameters for ADX smoothing and DI length allow traders to fine-tune the sensitivity of the trend strength measurement.
Donchian Channels on ADX:
Donchian Channels are applied directly to the ADX values to highlight the highest high and lowest low of the ADX over a specified period.
The upper and lower Donchian Channels can signal potential trend breakouts when the ADX value moves outside these bounds.
The middle Donchian Channel provides a reference for the average trend strength.
Visualization:
The indicator plots the ADX line in red to clearly display the trend strength.
The upper and lower Donchian Channels are plotted in blue, with a green middle line to represent the average.
The area between the upper and lower Donchian Channels is filled with a blue shade to visually emphasize the range of ADX values.
Default Settings for Scalping:
Donchian Channel Length: 10
Standard Deviation Multiplier: 1.58
ADX Length: 2
ADX Smoothing Length: 2
These default settings are optimized for scalping, offering a quick response to changes in trend strength and potential breakout signals. However, traders can adjust these settings to suit different trading styles and market conditions.
How to Use:
Trend Strength Identification: Use the ADX line to identify the strength of the current trend. Higher ADX values indicate stronger trends.
Breakout Signals: Monitor the ADX value in relation to the Donchian Channels. A breakout above the upper channel or below the lower channel can signal a potential trend continuation or reversal.
Range Identification: The filled area between the Donchian Channels provides a visual representation of the ADX range, helping traders identify when the market is ranging or trending.
This indicator is designed to enhance your trading strategy by combining trend strength measurement with breakout signals, making it a versatile tool for various market conditions.

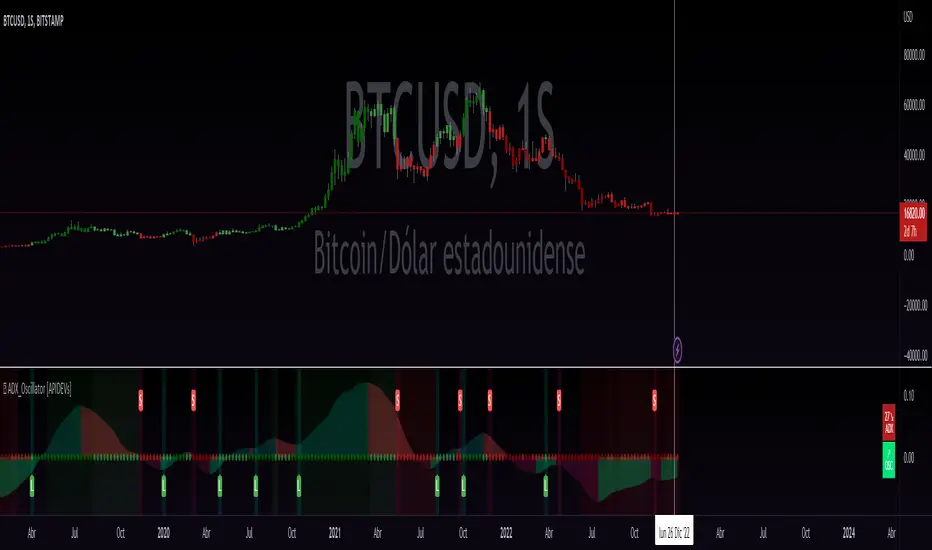
ADX_Oscillator [APIDEVs]ADX (ORIGINAL VERSION)
The ADX Indicator ( Average Directional Index ), is a non-directional oscillator type indicator, that is, it quantifies the strength of a trend regardless of its direction. In its original version, it is made up of 3 lines that represent the direction and strength of the movement:
• A line representing the ADX indicator.
• A green line representing the bullish Direction Index (DI +).
• A red line representing the Bearish Direction Index (DI-).
When the ADX is greater than 35, the market is in a strong trend, when it is between 35 and 20 the market is in trend and when it is less than 20 it indicates that the market is in range.
ADX OSCILLATOR (OUR VERSION)
At APIDEVs we really care about improving the understanding and experience of our users, which is why, in response to multiple requests, we decided to make important modifications to the ADX , which we consider to be the most powerful indicator of strength.
For many traders it was really confusing to understand that the ADX could be bullish or bearish and at the same time have the same numerical values, so in our version of the “ADX PRO +” we added colors and different intensity levels for your better understanding, however. , many needed a more explicit indicator and it is based on this request that we decided to take a leap into the incredible and that is how the “ADX OCILLATOR” was born.
We convert the ADX into a trend oscillator, now simpler and with multiple advantages which we will proceed to list:
1. The ADX was transformed into a directional oscillator whose color is based on the crossing of (DI +) and (DI-). This modification opens the door to the replacement of the Squeeze Momentum Indicator (SQZMOM) as a directional complement to the ADX .
2. A Background was added that is activated exclusively when the market has a strong upward or downward trend, specifying through its colors and intensity the type and direction of the force.
3. The original ADX parameters were adjusted to almost eliminate completely the “no trend” condition. This condition only created confusion for traders.
4. Added a system of signals based on the direction of the oscillator and the strength of the ADX .
• When the oscillator is sloping up and the ADX is green, the LONG (L) signal is activated.
• When the oscillator slopes downward and the ADX is red, the SHORT (S) signal is activated.
5. A side panel has been enabled that visually expresses the numerical value and direction of the ADX , as well as the direction of the oscillator.
6. An alert system was enabled so that traders receive notifications on all their devices:
• It is activated when the ADX changes color.
• It is activated when the Oscillator crosses the 0 point.
• It is activated when any input signal is activated.
ADX Cross 30 & EMA 20 Touch SignalHOLY GRAIL: ADX Cross 30 & EMA 20 Touch Signal
This TradingView script is a powerful tool designed to help traders identify high-probability trend-following opportunities, drawing inspiration from the renowned "HOLY GRAIL" strategy outlined in the Street Smarts book by Linda Bradford Raschke and Laurence A. Connors. It combines the Average Directional Index (ADX) with the Exponential Moving Average (EMA) to generate precise trading signals directly on your chart.
How it Works (Inspired by the "HOLY GRAIL" Strategy):
The script generates a "Buy Signal" when two crucial technical conditions align simultaneously on the same price bar, mirroring the core principles of the "HOLY GRAIL" setup:
ADX Trend Strength Confirmation (ADX Cross Above 30):
The ADX indicator, which measures the strength of a trend (regardless of its direction), crosses above the 30 level.
An ADX reading above 30 typically indicates that a strong and well-defined trend is developing and gaining momentum. This condition filters out choppy or range-bound markets, focusing on clear trending environments, as emphasized in the "HOLY GRAIL" approach.
Price Retest/Interaction with EMA (EMA 20 Touch):
The current price candle (its body or wick) touches or encompasses the 20-period Exponential Moving Average (EMA). This means the low of the candle is at or below the EMA, and the high of the candle is at or above the EMA.
This condition identifies moments within a strong trend where price retraces or consolidates to interact with the EMA, which often acts as a dynamic support or resistance level. This interaction, a key component of the "HOLY GRAIL" strategy, can signal a potential entry point for a continuation of the prevailing trend.
The combination of these two conditions aims to provide a robust signal for trend continuation, ensuring both strong trend presence and a favorable entry point, as per the strategy's design.
Key Features & On-Chart Visuals:
Customizable Parameters:
ADX Length: Easily adjust the lookback period for the ADX calculation (default: 14).
EMA Length: Customize the length of the Exponential Moving Average (default: 20).
20 EMA Plot: The 20-period EMA is clearly plotted on your main price chart as a prominent dark blue line, making it easy to observe price interaction.
Combined Buy Signal: When both the ADX cross above 30 and the EMA touch conditions are met, a green upward-pointing triangle (▲) is displayed directly below the relevant price bar, indicating a confirmed buy signal.
Background Highlight: The background of the chart is subtly highlighted in a soft green color when a combined buy signal is active, drawing your attention to the signal bar for quick identification.
Debugging & Analysis Aids:
To assist traders in understanding the individual components of the signal and for fine-tuning the indicator, the script includes two helpful debugging plots:
"ADX Cross Only" (Orange Circle (●) above bar): This small orange circle appears above the price bar when only the ADX has crossed above 30, but the EMA touch condition was not met. This helps identify periods of strong trend development without an EMA retest.
"EMA Touch Only" (Purple Square (■) above bar): A small purple square is plotted above the price bar when only the price has touched the 20 EMA, but the ADX has not yet crossed above 30. This highlights instances of EMA interaction without strong trend confirmation.
These debugging plots are invaluable for refining your understanding of the script's logic and for optimizing input parameters for different market conditions.
Important Recommendation for Users:
To gain a deeper insight into the ADX and its directional components (+DI and -DI) and to cross-reference the script's signals, it is strongly recommended to:
Navigate to your TradingView chart.
Click on the "Indicators" or "fx" icon.
Search for and add the built-in "ADX / DMI" indicator to a separate pane below your main chart.
Ensure that its "Length" setting is synchronized with the ADX Length input you are using in this custom script (default 14).
This will provide a clear visual representation of the ADX indicator itself, which is crucial for comprehensive analysis and informed decision-making based on the "HOLY GRAIL" principles.
ADX with Alerts for Strong Trending ConditionsMad Props to Chat GPT. Basically, this thing lets you set alerts on the ADX being Above 20 AND the Positive or Negative Directional Movement Line being Above the ADX. Useful for being alerted when a strong trend is in place to look for the pullback.
Description
The ADX with Custom Alerts indicator is designed to assist traders in identifying trends and potential trading opportunities based on the Average Directional Index (ADX) and Directional Indicators (DI+ and DI-). This tool provides a clear visual representation of market strength and directional movement, enhancing decision-making in trading.
Features
ADX Calculation:
The ADX measures the strength of a trend, regardless of its direction. The indicator calculates the ADX using a configurable length and a smoothing parameter, allowing traders to customize it based on their trading preferences.
Directional Indicators:
DI+: Represents bullish momentum.
DI-: Represents bearish momentum.
The indicator plots both DI+ and DI- alongside the ADX to give a complete picture of market direction.
Alert Conditions:
The indicator includes custom alert conditions that notify traders when:
Condition 1: The ADX rises above the defined threshold (default set at 20) and DI+ is above the ADX, indicating potential bullish momentum.
Condition 2: The ADX rises above the defined threshold and DI- is above the ADX, indicating potential bearish momentum.
Visual Representation:
The ADX line is plotted in blue, with the DI+ line in green and the DI- line in red.
A dotted horizontal line represents the ADX threshold, providing a clear visual cue for trend strength.
Background Highlighting:
The indicator uses background coloring to enhance visual analysis:
Green shading indicates when DI+ is above the ADX, suggesting bullish conditions.
Red shading indicates when DI- is above the ADX, suggesting bearish conditions.
Customizable Parameters:
Traders can adjust the length of the ADX calculation, the smoothing factor, and the threshold level to suit their trading strategies and timeframes.
Usage
This indicator is particularly useful for traders looking to:
Identify strong trends and potential entry points based on trend strength.
Make informed decisions using alerts that signal important market conditions.
Enhance their trading strategies with clear visual cues and customizable parameters.

ADX - Globx Options & Futures 2.0The ADX Globx Options & Futures is a custom-built trend strength indicator designed to replicate and enhance the classic Average Directional Index (ADX) model, commonly used in professional trading platforms such as IQ Option.
This version is optimized for options and futures trading, providing precise directional strength readings through adaptive smoothing and configurable parameters.
Concept and Logic
This indicator measures the strength of the current trend, regardless of its direction (bullish or bearish), by comparing directional movement between price highs and lows over a defined period.
It uses three main components:
+DI (Positive Directional Indicator): represents bullish strength.
–DI (Negative Directional Indicator): represents bearish strength.
ADX (Average Directional Index): measures the intensity of the prevailing trend, independent of direction.
The script follows the original logic proposed by J. Welles Wilder Jr., but introduces enhanced smoothing flexibility.
Users can choose between EMA (Exponential Moving Average) and Wilder’s RMA (Running Moving Average) for both DI and ADX calculations, allowing closer alignment with various platform implementations (IQ Option, MetaTrader, etc.).
How It Works
Directional Movement Calculation
The script computes upward and downward movements (+DM and –DM) by comparing the differences in highs and lows between consecutive candles.
Only positive directional changes that exceed the opposite side are considered.
This ensures each bar contributes only one valid directional movement.
True Range and Smoothing
The True Range (TR) is calculated using ta.tr(true) to include price gaps—replicating how professional derivatives platforms account for volatility jumps.
Both TR and DM values are smoothed using the selected averaging method (EMA or Wilder).
Directional Index and ADX
The smoothed +DI and –DI values are normalized over the True Range to form the Directional Index (DX), which measures the percentage difference between the two.
The ADX is then derived by smoothing the DX values, providing a stable reading of overall market strength.
Visual Representation
The ADX (white line) indicates the overall trend strength.
The +DI (dark blue) and –DI (dark red) lines show which side (bullish or bearish) is currently dominant.
Reference levels at 20 and 25 serve as strength thresholds:
Below 20 → Weak or sideways market.
Above 25 → Strong and directional trend.
Usage and Interpretation
When ADX rises above 25, the market shows a strong trend — use +DI > –DI for bullish confirmation, or the opposite for bearish momentum.
A falling ADX suggests decreasing trend strength and potential consolidation.
The default parameters (ADX Length = 34, DI Length = 34, both smoothed by EMA) match IQ Option’s internal ADX configuration, ensuring consistency between platforms.
Works on any timeframe or asset class, but is especially tuned for futures and options volatility dynamics.
Originality and Improvements
Unlike many open-source ADX indicators, this version:
Recreates IQ Option’s 34-length EMA-based ADX calculation with exact parameter alignment.
Provides selectable smoothing algorithms (EMA or Wilder) to switch between modern and classic formulations.
Uses dark-theme-optimized visuals with fine line weight and subtle contrast for clean visibility.
Maintains constant guide levels (20/25) rendered globally for precision and style compliance in Pine Script v6.
Is fully rewritten for Pine Script v6, ensuring compatibility and optimized execution.
Recommended Use
Combine with trend-following systems or breakout strategies.
Ideal for identifying market strength before engaging in options directionals or futures entries.
Use the ADX to confirm breakout momentum or filter sideways markets.
Disclaimer
This script is for educational and analytical purposes. It does not constitute financial advice or a trading signal. Users are encouraged to validate the indicator within their own trading strategies and risk frameworks.

ADX MTF mura visionOverview
ADX MTF — mura vision measures trend strength and visualizes a higher-timeframe (HTF) ADX on any chart. The current-TF ADX is drawn as a line; the HTF ADX is rendered as “step” segments to reflect closed HTF bars without repainting. Optional soft fills highlight the 20–25 (trend forming) and 40–50 (strong trend) zones.
How it works
ADX (current TF) : Classic Wilder formulation using DI components and RMA smoothing.
HTF ADX : Requested via request.security(..., lookahead_off, gaps_off).
When a new HTF bar opens, the previous value is frozen as a horizontal segment.
The current HTF bar is shown as a live moving segment.
This staircase look is expected on lower timeframes.
Auto timeframe mapping
If “Auto” is selected, the HTF is derived from the chart TF:
<30m → 60m, 30–<240m → 240m, 240m–<1D → 1D, 1D → 1W, 1W/2W → 1M, ≥1M → same.
Inputs
DI Length and ADX Smoothing — core ADX parameters.
Higher Time Frame — Auto or a fixed TF.
Line colors/widths for current ADX and HTF ADX.
Fill zone 20–25 and Fill zone 40–50 — optional light background fills.
Number of HTF ADX Bars — limits stored HTF segments to control chart load.
Reading the indicator
ADX < 20: typically range-bound conditions; trend setups require extra caution.
20–25: trend emergence; breakouts and continuation structures gain validity.
40–50: strong trend; favor continuation and manage with trailing stops.
>60 and turning down: possible trend exhaustion or transition toward range.
Note: ADX measures strength, not direction. Combine with your directional filter (e.g., price vs. MA, +DI/−DI, structure/levels).
Non-repainting behavior
HTF values use lookahead_off; closed HTF bars are never revised.
The only moving piece is the live segment for the current HTF bar.
Best practices
Use HTF ADX as a regime filter; time entries with the current-TF ADX rising through your threshold.
Pair with ATR-based stops and a MA/structure filter for direction.
Consider higher thresholds on highly volatile altcoins.
Performance notes
The script draws line segments for HTF bars. If your chart becomes heavy, reduce “Number of HTF ADX Bars.”
Disclaimer
This script is for educational purposes only and does not constitute financial advice. Trading involves risk.

ADX & Angle Strength📌 Indicator Overview – ADX Angle Strength
This script merges the power of the traditional ADX with a visual interpretation of the angular slope of a moving average, offering a highly effective tool to identify real impulses in price action. The goal of the indicator is not only to highlight market strength, but to reveal direction and slope —helping traders spot the end of impulses, consolidation zones, and potential reversal points.
This script does not aim to replace or compete with ADX, but instead highlights a lesser-used metric: the true angular slope of a moving average as a functional and interpretable force component. Rather than relying exclusively on traditional strength tools, it introduces an immediate, intuitive, and quantifiable way to observe trend steepness — reinforced by a robust metric like ADX.
The author considers both perspectives valuable. While ADX remains an integral part of their technical analysis, greater attention is often given to the angles formed by price-tracking moving averages, as they offer faster insight into trend acceleration. This dual-approach — with one reactive and one confirmatory signal — makes ADX & AngleStrength a practical, clear, and flexible tool for analyzing market momentum from two synchronized yet distinct vantage points.
Key user-configurable options:
- Display of ADX lines (DI+, DI−, zero line, lines 20, 25, 50, and 75)
- ADX length and smoothing
- Moving average type (SMA, EMA, WMA, HMA, ALMA)
- Length, source, color, and style of the angle calculation
- Minimum angle threshold to define color changes (slope comparison)
This indicator is highly sensitive and allows users to visualize:
- Range zones via flat angles (yellow)
- Bullish or bearish impulses through positive or negative slopes (green and red)
- Convergences or divergences relative to traditional ADX strength
📘 Single Real-World Example: Step-by-Step Interpretation
In this section, we’ll walk through a single real-world example on a 1-hour chart, divided into five key moments marked by vertical lines labeled A, B, C, D, and E. Each line identifies a specific point in the movement of price and indicator behavior. We’ll move through the chart step-by-step, explaining what happens between each line and how each indicator responds.
Before Line A: The setup
The chart shows a slight upward movement in the price, though not particularly strong. This section doesn’t have any lines marked yet but sets the foundation for what’s coming next.
The ADX is falling, dropping below the 20-level threshold, which usually signals weakening market momentum. However, the angle indicator, which is more sensitive, starts pointing upward, detecting an increase in slope as the price begins climbing.
This early upward tilt is what we call a rising angle, suggesting the market is gaining slope.
🅰 Line A: First peak
As the upward move completes, a peak forms right at Line A. The angle at that moment reaches +44.70°, showing a relatively strong upward slope.
After Line A:
- Price stalls, entering a sideways range — a classic consolidation.
- The angle indicator begins to fall, because price action no longer has a strong slope.
- The ADX, however, keeps rising, continuing even after the angle begins to decline. It reaches a peak at 35.6, then gradually drops to 15.13, reflecting that the trend’s strength has faded.
🅱 Line B: Sharp drop
Following the sideways range after Line A, the price breaks downward with a strong bearish candle.
This is where the second peak happens — but this time it's a negative angle, as price drops quickly. The angle reaches -48.45°, clearly marking the end of this quick bearish impulse.
At the same moment:
- The ADX, recovering from its earlier drop, reaches 21.83 and continues rising after the angle has peaked.
- This shows that while the angle detects the end of the move, the ADX is still registering the momentum that just occurred — a bit delayed, but confirming.
🅲 Line C: Key turning point
After the drop at Line B, price moves sideways again. During this range:
- The angle gradually declines and enters a yellow zone, indicating low slope or momentum.
But at Line C, everything changes. Unlike the other lines, Line C does not mark a peak, but rather the beginning of a stronger downward move.
From here:
- Price breaks through the range and continues falling — this marks the start of a stronger trend.
- The angle indicator shows a sequence of five descending peaks, tracking the steepening drop in price:
1. 26.47°
2. 40.64°
3. 35.87°
4. 38.71°
5. 66.3° (the steepest)
- The ADX starts rising in parallel, confirming the growing strength of the trend.
🅳 Line D: Bottom and reversal
At Line D, price reaches a bottom — a point of exhaustion marked by high volume, sometimes known as a volume climax or stopping volume.
- The angle reaches its steepest reading so far: 66.3° negative.
- The ADX keeps rising for two more candles after this angle peak, then begins to fall — revealing that the angle catches the momentum shift earlier.
🅴 Line E: Bullish reversal and final peak
After the low at Line D, price begins to rise steadily. The angle responds immediately, tilting upward again.
At Line E, we get the final peak, this time positive, as the bullish move reaches its climax. The angle here is +71.64° — the highest reading in the entire example.
Meanwhile:
- The ADX is still falling at this point, having peaked two candles after Line D and never recovering in time to catch this bullish push.
- Once again, the angle proves more responsive to changes in price behavior, especially at the end of impulses.
⚠️ Compatibility and Intended Use
This indicator is specifically designed to be used on Binance charts, as it is intended for the analysis of cryptocurrency markets, and Binance exclusively operates with crypto assets. It has been optimized for the following timeframes:
- 1 minute
- 5 minutes
- 15 minutes
- 30 minutes
- 1 hour
- 4 hours
- 1 day
These intervals were selected based on the internal architecture used for angle computation. As such, the indicator will not display any data outside of these supported timeframes or on non-Binance assets. Attempting to apply it beyond those conditions will produce a blank chart by design.
👤 Author
This indicator was developed as part of a visual technical analysis project focused on capturing true momentum through combined signals.
📄 User guide available in both Spanish and English for clarity and learning.

ADX + DMI (HMA Version)📝 Description (What This Indicator Does)
🚀 ADX + DMI (HMA Version) is a trend strength oscillator that enhances the traditional ADX by using the Hull Moving Average (HMA) instead of EMA.
✅ This results in a much faster and more responsive trend detection while filtering out choppy price action.
🎯 What This Indicator Does:
1️⃣ Measures Trend Strength – ADX shows when a trend is strong or weak.
2️⃣ Identifies Trend Direction – DI+ (Green) shows bullish momentum, DI- (Red) shows bearish momentum.
3️⃣ Uses Hull Moving Average (HMA) for Faster Signals – Removes lag and reacts faster to trend changes.
4️⃣ Reduces False Signals – Traditional ADX lags behind, but this version reacts quickly to reversals.
5️⃣ Good for Scalping & Day Trading – Especially for BTC 5-min and lower timeframes.
⚙ Indicator Inputs (Customization)
Input Name Example Value Purpose
ADX Length 14 Defines the smoothing for the ADX value.
DI Length 14 Defines how DI+ and DI- are calculated.
HMA Length 24 Hull Moving Average smoothing for ADX & DI+.
Trend Threshold 25 The level above which ADX confirms a strong trend.
📌 You can adjust these settings to optimize for different assets and timeframes.
🎯 Trading Rules & How to Use It
✅ How to Identify a Strong Trend:
When ADX (Blue Line) is above 25→ A strong trend is in play.
When ADX is below 25 → The market is choppy or ranging.
✅ How to Use DI+ and DI- for Trend Direction:
If DI+ (Green) is above DI- (Red), the market is in an uptrend.
If DI- (Red) is above DI+ (Green), the market is in a downtrend.
✅ How to Confirm Entries & Exits:
1️⃣ Enter Long when DI+ crosses above DI- while ADX is rising above 25.
2️⃣ Enter Short when DI- crosses above DI+ while ADX is rising above 25.
3️⃣ Avoid trading when ADX is below 25 – the market is in a choppy range.
This should not be used as a stand alone oscillator. Trading takes skill and is risky. Use at your own risk.
This is not advise on how to trade, these are just examples of how I use the oscillator. Trade at your own risk.
You can put this on your chart versus the tradingview adx and you can adjust the settings to see the difference. This was optimized for btc on the 5 min chart. You can adjust for your trading strategy.
ADX & ATR Display (Table) - Percentage ATROverview:
The "ADX & ATR Display (Table)" is a custom Pine Script indicator designed to provide real-time insights into market trend strength and volatility directly on your chart, presented in a clean, non-intrusive table format. It combines two powerful technical analysis tools: the Average Directional Index (ADX) and the Average True Range (ATR), helping traders quickly grasp current market conditions.
Key Features:
Average Directional Index (ADX):
Purpose: ADX quantifies the strength of a trend, regardless of its direction (up or down). It helps identify if a market is trending strongly or if it's in a ranging (sideways) phase.
Calculation: It is derived from positive (+DI) and negative (-DI) directional indicators, which measure the strength of upward and downward price movements respectively. The indicator then smooths the absolute difference between +DI and -DI.
Interpretation:
ADX values below 25 generally suggest a weak or ranging market.
Values between 25 and 50 indicate the presence of a trending market.
Values above 50 signify a strong trend.
A rising ADX line indicates increasing trend strength, while a falling ADX suggests the trend is weakening.
Display: Your indicator displays the ADX value as a direct numerical score (e.g., 56.5).
Average True Range (ATR):
Purpose: ATR measures the volatility of a market, providing a clearer understanding of the typical price fluctuation over a given period.
Calculation: ATR considers the "true range," which is the largest of three measures: the current high minus the current low, the absolute value of the current high minus the previous close, or the absolute value of the current low minus the previous close. This true range is then averaged over a specified period.
Interpretation:
Higher ATR values indicate higher volatility, meaning prices are experiencing more dramatic movements.
Lower ATR values suggest lower volatility, indicating more stable price action.
Display: Your indicator uniquely displays the ATR value as a percentage (%) of the current closing price, making it easy to compare volatility across different assets or price levels (e.g., 3.97%). This normalized view is particularly useful for position sizing and risk management.
Indicator Display:
This indicator presents both the ADX and ATR values in a compact, customizable table located at the top center of your chart. This allows for a quick, at-a-glance overview of the current market's trend strength and volatility without cluttering the main price action with overlay lines or sub-panes.
Usage:
Traders can utilize this indicator to:
Identify strong trending markets (via ADX) suitable for trend-following strategies.
Recognize ranging or consolidating markets (via ADX) where breakout strategies might be more appropriate.
Gauge market volatility (via ATR) to adjust stop-loss and take-profit levels dynamically.
Compare volatility across different instruments by normalizing ATR to a percentage.
Inputs:
ADX Length: (Default: 14) Adjusts the period for the ADX calculation.
ATR Length: (Default: 14) Adjusts the period for the ATR calculation.
