AI Trend Navigator [K-Neighbor]█ Overview
In the evolving landscape of trading and investment, the demand for sophisticated and reliable tools is ever-growing. The AI Trend Navigator is an indicator designed to meet this demand, providing valuable insights into market trends and potential future price movements. The AI Trend Navigator indicator is designed to predict market trends using the k-Nearest Neighbors (KNN) classifier.
By intelligently analyzing recent price actions and emphasizing similar values, it helps traders to navigate complex market conditions with confidence. It provides an advanced way to analyze trends, offering potentially more accurate predictions compared to simpler trend-following methods.
█ Calculations
KNN Moving Average Calculation: The core of the algorithm is a KNN Moving Average that computes the mean of the 'k' closest values to a target within a specified window size. It does this by iterating through the window, calculating the absolute differences between the target and each value, and then finding the mean of the closest values. The target and value are selected based on user preferences (e.g., using the VWAP or Volatility as a target).
KNN Classifier Function: This function applies the k-nearest neighbor algorithm to classify the price action into positive, negative, or neutral trends. It looks at the nearest 'k' bars, calculates the Euclidean distance between them, and categorizes them based on the relative movement. It then returns the prediction based on the highest count of positive, negative, or neutral categories.
█ How to use
Traders can use this indicator to identify potential trend directions in different markets.
Spotting Trends: Traders can use the KNN Moving Average to identify the underlying trend of an asset. By focusing on the k closest values, this component of the indicator offers a clearer view of the trend direction, filtering out market noise.
Trend Confirmation: The KNN Classifier component can confirm existing trends by predicting the future price direction. By aligning predictions with current trends, traders can gain more confidence in their trading decisions.
█ Settings
PriceValue: This determines the type of price input used for distance calculation in the KNN algorithm.
hl2: Uses the average of the high and low prices.
VWAP: Uses the Volume Weighted Average Price.
VWAP: Uses the Volume Weighted Average Price.
Effect: Changing this input will modify the reference values used in the KNN classification, potentially altering the predictions.
TargetValue: This sets the target variable that the KNN classification will attempt to predict.
Price Action: Uses the moving average of the closing price.
VWAP: Uses the Volume Weighted Average Price.
Volatility: Uses the Average True Range (ATR).
Effect: Selecting different targets will affect what the KNN is trying to predict, altering the nature and intent of the predictions.
Number of Closest Values: Defines how many closest values will be considered when calculating the mean for the KNN Moving Average.
Effect: Increasing this value makes the algorithm consider more nearest neighbors, smoothing the indicator and potentially making it less reactive. Decreasing this value may make the indicator more sensitive but possibly more prone to noise.
Neighbors: This sets the number of neighbors that will be considered for the KNN Classifier part of the algorithm.
Effect: Adjusting the number of neighbors affects the sensitivity and smoothness of the KNN classifier.
Smoothing Period: Defines the smoothing period for the moving average used in the KNN classifier.
Effect: Increasing this value would make the KNN Moving Average smoother, potentially reducing noise. Decreasing it would make the indicator more reactive but possibly more prone to false signals.
█ What is K-Nearest Neighbors (K-NN) algorithm?
At its core, the K-NN algorithm recognizes patterns within market data and analyzes the relationships and similarities between data points. By considering the 'K' most similar instances (or neighbors) within a dataset, it predicts future price movements based on historical trends. The K-Nearest Neighbors (K-NN) algorithm is a type of instance-based or non-generalizing learning. While K-NN is considered a relatively simple machine-learning technique, it falls under the AI umbrella.
We can classify the K-Nearest Neighbors (K-NN) algorithm as a form of artificial intelligence (AI), and here's why:
Machine Learning Component: K-NN is a type of machine learning algorithm, and machine learning is a subset of AI. Machine learning is about building algorithms that allow computers to learn from and make predictions or decisions based on data. Since K-NN falls under this category, it is aligned with the principles of AI.
Instance-Based Learning: K-NN is an instance-based learning algorithm. This means that it makes decisions based on the entire training dataset rather than deriving a discriminative function from the dataset. It looks at the 'K' most similar instances (neighbors) when making a prediction, hence adapting to new information if the dataset changes. This adaptability is a hallmark of intelligent systems.
Pattern Recognition: The core of K-NN's functionality is recognizing patterns within data. It identifies relationships and similarities between data points, something akin to human pattern recognition, a key aspect of intelligence.
Classification and Regression: K-NN can be used for both classification and regression tasks, two fundamental problems in machine learning and AI. The indicator code is used for trend classification, a predictive task that aligns with the goals of AI.
Simplicity Doesn't Exclude AI: While K-NN is often considered a simpler algorithm compared to deep learning models, simplicity does not exclude something from being AI. Many AI systems are built on simple rules and can be combined or scaled to create complex behavior.
No Explicit Model Building: Unlike traditional statistical methods, K-NN does not build an explicit model during training. Instead, it waits until a prediction is required and then looks at the 'K' nearest neighbors from the training data to make that prediction. This lazy learning approach is another aspect of machine learning, part of the broader AI field.
-----------------
Disclaimer
The information contained in my Scripts/Indicators/Ideas/Algos/Systems does not constitute financial advice or a solicitation to buy or sell any securities of any type. I will not accept liability for any loss or damage, including without limitation any loss of profit, which may arise directly or indirectly from the use of or reliance on such information.
All investments involve risk, and the past performance of a security, industry, sector, market, financial product, trading strategy, backtest, or individual's trading does not guarantee future results or returns. Investors are fully responsible for any investment decisions they make. Such decisions should be based solely on an evaluation of their financial circumstances, investment objectives, risk tolerance, and liquidity needs.
My Scripts/Indicators/Ideas/Algos/Systems are only for educational purposes!
Cerca negli script per "ai"

AI-Weighted RSI (Zeiierman)█ Overview
AI-Weighted RSI (Zeiierman) is an adaptive oscillator that enhances classic RSI by applying a correlation-weighted prediction layer. Instead of looking only at RSI values directly, this indicator continuously evaluates how other price- and volume-based features (returns, volatility, volume shifts) correlate with RSI, and then weights them accordingly to project the next RSI state.
The result is a smoother, forward-looking RSI framework that adapts to market conditions in real time.
By leveraging feature correlation instead of static formulas, AI-Weighted RSI behaves like a lightweight learning model, adjusting its emphasis depending on which features are most aligned with RSI behavior during the current regime.
█ How It Works
⚪ Feature Extraction
Each bar, the script computes features: log returns, RSI itself, ATR% (volatility), volume, and volume log-change.
⚪ Correlation Screening
Over a rolling learning window, it measures the correlation of each feature against RSI. The strongest relationships are ranked and selected.
⚪ Adaptive Weighting
Features are standardized (z-scored), then combined using their signed correlations as weights, building a rolling, adaptive prediction of RSI.
⚪ Prediction to RSI Weight
The predicted RSI is mapped back into a “weight” scale (±2 by default). Above 0 = bullish bias, below 0 = bearish bias, with color-graded fills to visualize overbought/oversold pressure.
⚪ Signal Line
A smoothing option (signal length) overlays a moving average of the AI-Weighted RSI for clearer trend confirmation.
█ Why AI-Weighted RSI
⚪ Adaptive to Market Regime
Because the model re-evaluates correlations continuously, it naturally shifts which features dominate, sometimes volatility explains RSI best, sometimes volume, sometimes returns.
⚪ Forward-Looking Bias
Instead of simply reflecting RSI, the model provides a projection, helping anticipate shifts in momentum before RSI itself flips.
█ How to Use
⚪ Directional Bias
Read the RSI relative to 0. Above = bullish momentum bias, below = bearish.
⚪ Overbought / Oversold Zones
Shaded fills beyond +0.5 or -0.5 highlight extremes where RSI pressure often exhausts.
⚪ Divergences
When price makes new highs/lows but AI-Weighted RSI fails to confirm, it often signals weakening momentum.
█ Settings
RSI Length: Lookback for the core RSI calculation.
Signal Length: Smoothing applied to the AI-Weighted RSI output.
Learning Window: Bars used for correlation learning and z-scoring.
-----------------
Disclaimer
The content provided in my scripts, indicators, ideas, algorithms, and systems is for educational and informational purposes only. It does not constitute financial advice, investment recommendations, or a solicitation to buy or sell any financial instruments. I will not accept liability for any loss or damage, including without limitation any loss of profit, which may arise directly or indirectly from the use of or reliance on such information.
All investments involve risk, and the past performance of a security, industry, sector, market, financial product, trading strategy, backtest, or individual's trading does not guarantee future results or returns. Investors are fully responsible for any investment decisions they make. Such decisions should be based solely on an evaluation of their financial circumstances, investment objectives, risk tolerance, and liquidity needs.

AI Adaptive Oscillator [PhenLabs]📊 Algorithmic Adaptive Oscillator
Version: PineScript™ v6
📌 Description
The AI Adaptive Oscillator is a sophisticated technical indicator that employs ensemble learning and adaptive weighting techniques to analyze market conditions. This innovative oscillator combines multiple traditional technical indicators through an AI-driven approach that continuously evaluates and adjusts component weights based on historical performance. By integrating statistical modeling with machine learning principles, the indicator adapts to changing market dynamics, providing traders with a responsive and reliable tool for market analysis.
🚀 Points of Innovation:
Ensemble learning framework with adaptive component weighting
Performance-based scoring system using directional accuracy
Dynamic volatility-adjusted smoothing mechanism
Intelligent signal filtering with cooldown and magnitude requirements
Signal confidence levels based on multi-factor analysis
🔧 Core Components
Ensemble Framework : Combines up to five technical indicators with performance-weighted integration
Adaptive Weighting : Continuous performance evaluation with automated weight adjustment
Volatility-Based Smoothing : Adapts sensitivity based on current market volatility
Pattern Recognition : Identifies potential reversal patterns with signal qualification criteria
Dynamic Visualization : Professional color schemes with gradient intensity representation
Signal Confidence : Three-tiered confidence assessment for trading signals
🔥 Key Features
The indicator provides comprehensive market analysis through:
Multi-Component Ensemble : Integrates RSI, CCI, Stochastic, MACD, and Volume-weighted momentum
Performance Scoring : Evaluates each component based on directional prediction accuracy
Adaptive Smoothing : Automatically adjusts based on market volatility
Pattern Detection : Identifies potential reversal patterns in overbought/oversold conditions
Signal Filtering : Prevents excessive signals through cooldown periods and minimum change requirements
Confidence Assessment : Displays signal strength through intuitive confidence indicators (average, above average, excellent)
🎨 Visualization
Gradient-Filled Oscillator : Color intensity reflects strength of market movement
Clear Signal Markers : Distinct bullish and bearish pattern signals with confidence indicators
Range Visualization : Clean representation of oscillator values from -6 to 6
Zero Line : Clear demarcation between bullish and bearish territory
Customizable Colors : Color schemes that can be adjusted to match your chart style
Confidence Symbols : Intuitive display of signal confidence (no symbol, +, or ++) alongside direction markers
📖 Usage Guidelines
⚙️ Settings Guide
Color Settings
Bullish Color
Default: #2b62fa (Blue)
This setting controls the color representation for bullish movements in the oscillator. The color appears when the oscillator value is positive (above zero), with intensity indicating the strength of the bullish momentum. A brighter shade indicates stronger bullish pressure.
Bearish Color
Default: #ce9851 (Amber)
This setting determines the color representation for bearish movements in the oscillator. The color appears when the oscillator value is negative (below zero), with intensity reflecting the strength of the bearish momentum. A more saturated shade indicates stronger bearish pressure.
Signal Settings
Signal Cooldown (bars)
Default: 10
Range: 1-50
This parameter sets the minimum number of bars that must pass before a new signal of the same type can be generated. Higher values reduce signal frequency and help prevent overtrading during choppy market conditions. Lower values increase signal sensitivity but may generate more false positives.
Min Change For New Signal
Default: 1.5
Range: 0.5-3.0
This setting defines the minimum required change in oscillator value between consecutive signals of the same type. It ensures that new signals represent meaningful changes in market conditions rather than minor fluctuations. Higher values produce fewer but potentially higher-quality signals, while lower values increase signal frequency.
AI Core Settings
Base Length
Default: 14
Minimum: 2
This fundamental setting determines the primary calculation period for all technical components in the ensemble (RSI, CCI, Stochastic, etc.). It represents the lookback window for each component’s base calculation. Shorter periods create a more responsive but potentially noisier oscillator, while longer periods produce smoother signals with potential lag.
Adaptive Speed
Default: 0.1
Range: 0.01-0.3
Controls how quickly the oscillator adapts to new market conditions through its volatility-adjusted smoothing mechanism. Higher values make the oscillator more responsive to recent price action but potentially more erratic. Lower values create smoother transitions but may lag during rapid market changes. This parameter directly influences the indicator’s adaptiveness to market volatility.
Learning Lookback Period
Default: 150
Minimum: 10
Determines the historical data range used to evaluate each ensemble component’s performance and calculate adaptive weights. This setting controls how far back the AI “learns” from past performance to optimize current signals. Longer periods provide more stable weight distribution but may be slower to adapt to regime changes. Shorter periods adapt more quickly but may overreact to recent anomalies.
Ensemble Size
Default: 5
Range: 2-5
Specifies how many technical components to include in the ensemble calculation.
Understanding The Interaction Between Settings
Base Length and Learning Lookback : The base length determines the reactivity of individual components, while the lookback period determines how their weights are adjusted. These should be balanced according to your timeframe - shorter timeframes benefit from shorter base lengths, while the lookback should generally be 10-15 times the base length for optimal learning.
Adaptive Speed and Signal Cooldown : These settings control sensitivity from different angles. Increasing adaptive speed makes the oscillator more responsive, while reducing signal cooldown increases signal frequency. For conservative trading, keep adaptive speed low and cooldown high; for aggressive trading, do the opposite.
Ensemble Size and Min Change : Larger ensembles provide more stable signals, allowing for a lower minimum change threshold. Smaller ensembles might benefit from a higher threshold to filter out noise.
Understanding Signal Confidence Levels
The indicator provides three distinct confidence levels for both bullish and bearish signals:
Average Confidence (▲ or ▼) : Basic signal that meets the minimum pattern and filtering criteria. These signals indicate potential reversals but with moderate confidence in the prediction. Consider using these as initial alerts that may require additional confirmation.
Above Average Confidence (▲+ or ▼+) : Higher reliability signal with stronger underlying metrics. These signals demonstrate greater consensus among the ensemble components and/or stronger historical performance. They offer increased probability of successful reversals and can be traded with less additional confirmation.
Excellent Confidence (▲++ or ▼++) : Highest quality signals with exceptional underlying metrics. These signals show strong agreement across oscillator components, excellent historical performance, and optimal signal strength. These represent the indicator’s highest conviction trade opportunities and can be prioritized in your trading decisions.
Confidence assessment is calculated through a multi-factor analysis including:
Historical performance of ensemble components
Degree of agreement between different oscillator components
Relative strength of the signal compared to historical thresholds
✅ Best Use Cases:
Identify potential market reversals through oscillator extremes
Filter trade signals based on AI-evaluated component weights
Monitor changing market conditions through oscillator direction and intensity
Confirm trade signals from other indicators with adaptive ensemble validation
Detect early momentum shifts through pattern recognition
Prioritize trading opportunities based on signal confidence levels
Adjust position sizing according to signal confidence (larger for ++ signals, smaller for standard signals)
⚠️ Limitations
Requires sufficient historical data for accurate performance scoring
Ensemble weights may lag during dramatic market condition changes
Higher ensemble sizes require more computational resources
Performance evaluation quality depends on the learning lookback period length
Even high confidence signals should be considered within broader market context
💡 What Makes This Unique
Adaptive Intelligence : Continuously adjusts component weights based on actual performance
Ensemble Methodology : Combines strength of multiple indicators while minimizing individual weaknesses
Volatility-Adjusted Smoothing : Provides appropriate sensitivity across different market conditions
Performance-Based Learning : Utilizes historical accuracy to improve future predictions
Intelligent Signal Filtering : Reduces noise and false signals through sophisticated filtering criteria
Multi-Level Confidence Assessment : Delivers nuanced signal quality information for optimized trading decisions
🔬 How It Works
The indicator processes market data through five main components:
Ensemble Component Calculation :
Normalizes traditional indicators to consistent scale
Includes RSI, CCI, Stochastic, MACD, and volume components
Adapts based on the selected ensemble size
Performance Evaluation :
Analyzes directional accuracy of each component
Calculates continuous performance scores
Determines adaptive component weights
Oscillator Integration :
Combines weighted components into unified oscillator
Applies volatility-based adaptive smoothing
Scales final values to -6 to 6 range
Signal Generation :
Detects potential reversal patterns
Applies cooldown and magnitude filters
Generates clear visual markers for qualified signals
Confidence Assessment :
Evaluates component agreement, historical accuracy, and signal strength
Classifies signals into three confidence tiers (average, above average, excellent)
Displays intuitive confidence indicators (no symbol, +, ++) alongside direction markers
💡 Note:
The AI Adaptive Oscillator performs optimally when used with appropriate timeframe selection and complementary indicators. Its adaptive nature makes it particularly valuable during changing market conditions, where traditional fixed-weight indicators often lose effectiveness. The ensemble approach provides a more robust analysis by leveraging the collective intelligence of multiple technical methodologies. Pay special attention to the signal confidence indicators to optimize your trading decisions - excellent (++) signals often represent the most reliable trade opportunities.

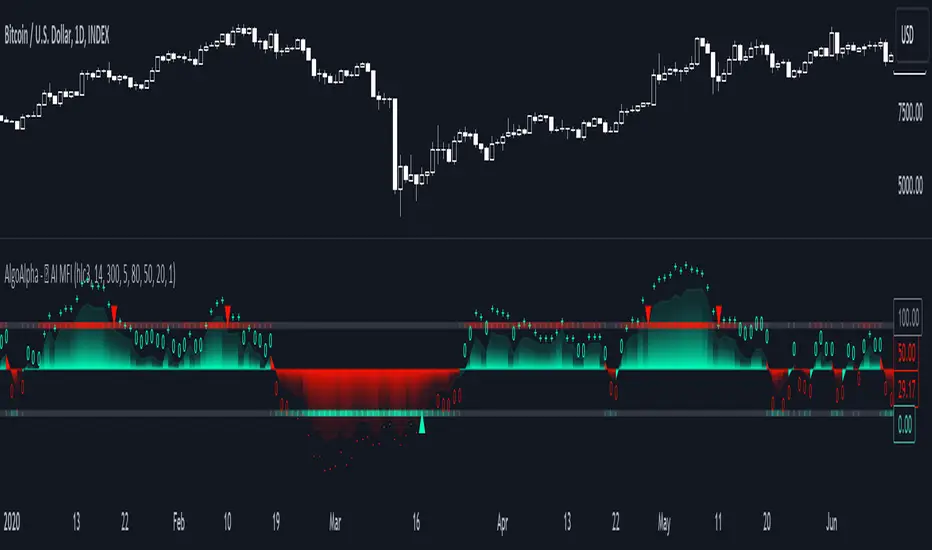
AI Adaptive Money Flow Index (Clustering) [AlgoAlpha]🌟🚀 Dive into the future of trading with our latest innovation: the AI Adaptive Money Flow Index by AlgoAlpha Indicator! 🚀🌟
Developed with the cutting-edge power of Machine Learning, this indicator is designed to revolutionize the way you view market dynamics. 🤖💹 With its unique blend of traditional Money Flow Index (MFI) analysis and advanced k-means clustering, it adapts to market conditions like never before.
Key Features:
📊 Adaptive MFI Analysis: Utilizes the classic MFI formula with a twist, adjusting its parameters based on AI-driven clustering.
🧠 AI-Driven Clustering: Applies k-means clustering to identify and adapt to market states, optimizing the MFI for current conditions.
🎨 Customizable Appearance: Offers adjustable settings for overbought, neutral, and oversold levels, as well as colors for uptrends and downtrends.
🔔 Alerts for Key Market Movements: Set alerts for trend reversals, overbought, and oversold conditions, ensuring you never miss a trading opportunity.
Quick Guide to Using the AI Adaptive MFI (Clustering):
🛠 Customize the Indicator: Customize settings like MFI source, length, and k-means clustering parameters to suit your analysis.
📈 Market Analysis: Monitor the dynamically adjusted overbought, neutral, and oversold levels for insights into market conditions. Watch for classification symbols ("+", "0", "-") for immediate understanding of the current market state. Look out for reversal signals (▲, ▼) to get potential entry points.
🔔 Set Alerts: Utilize the built-in alert conditions for trend changes, overbought, and oversold signals to stay ahead, even when you're not actively monitoring the charts.
How It Works:
The AI Adaptive Money Flow Index employs the k-means clustering machine learning algorithm to refine the traditional Money Flow Index, dynamically adjusting overbought, neutral, and oversold levels based on market conditions. This method analyzes historical MFI values, grouping them into initial clusters using the traditional MFI's overbought, oversold and neutral levels, and then finding the mean of each cluster, which represent the new market states thresholds. This adaptive approach ensures the indicator's sensitivity in real-time, offering a nuanced understanding of market trend and volume analysis.
By recalibrating MFI thresholds for each new data bar, the AI Adaptive MFI intelligently conforms to changing market dynamics. This process, assessing past periods to adjust the indicator's parameters, provides traders with insights finely tuned to recent market behavior. Such innovation enhances decision-making, leveraging the latest data to inform trading strategies. 🌐💥
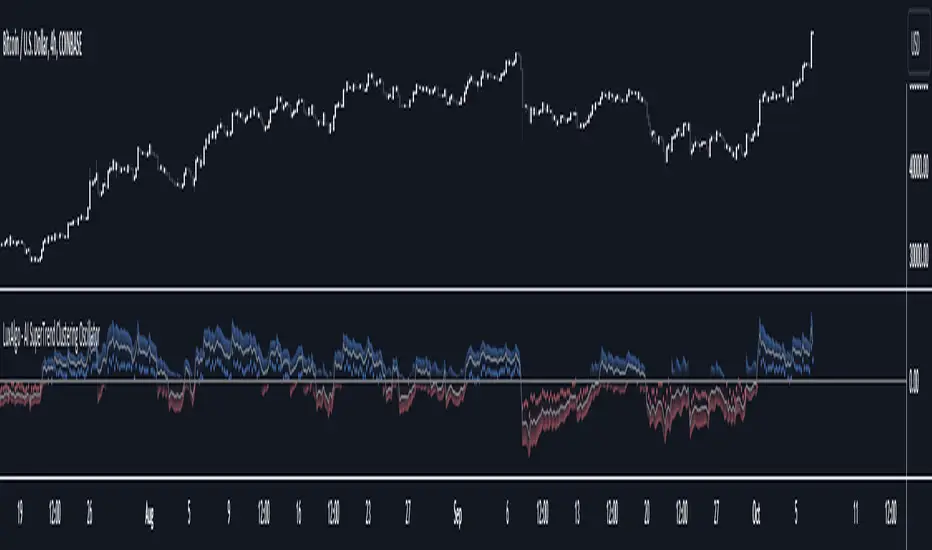
AI SuperTrend Clustering Oscillator [LuxAlgo]The AI SuperTrend Clustering Oscillator is an oscillator returning the most bullish/average/bearish centroids given by multiple instances of the difference between SuperTrend indicators.
This script is an extension of our previously posted SuperTrend AI indicator that makes use of k-means clustering. If you want to learn more about it see:
🔶 USAGE
The AI SuperTrend Clustering Oscillator is made of 3 distinct components, a bullish output (always the highest), a bearish output (always the lowest), and a "consensus" output always within the two others.
The general trend is given by the consensus output, with a value above 0 indicating an uptrend and under 0 indicating a downtrend. Using a higher minimum factor will weigh results toward longer-term trends, while lowering the maximum factor will weigh results toward shorter-term trends.
Strong trends are indicated when the bullish/bearish outputs are indicating an opposite sentiment. A strong bullish trend would for example be indicated when the bearish output is above 0, while a strong bearish trend would be indicated when the bullish output is below 0.
When the consensus output is indicating a specific trend direction, an opposite indication from the bullish/bearish output can highlight a potential reversal or retracement.
🔶 DETAILS
The indicator construction is based on finding three clusters from the difference between the closing price and various SuperTrend using different factors. The centroid of each cluster is then returned. This operation is done over all historical bars.
The highest cluster will be composed of the differences between the price and SuperTrends that are the highest, thus creating a more bullish group. The lowest cluster will be composed of the differences between the price and SuperTrends that are the lowest, thus creating a more bearish group.
The consensus cluster is composed of the differences between the price and SuperTrends that are not significant enough to be part of the other clusters.
🔶 SETTINGS
ATR Length: ATR period used for the calculation of the SuperTrends.
Factor Range: Determine the minimum and maximum factor values for the calculation of the SuperTrends.
Step: Increments of the factor range.
Smooth: Degree of smoothness of each output from the indicator.
🔹 Optimization
This group of settings affects the runtime performances of the script.
Maximum Iteration Steps: Maximum number of iterations allowed for finding centroids. Excessively low values can return a better script load time but poor clustering.
Historical Bars Calculation: Calculation window of the script (in bars).
AI Breakout Bands (Zeiierman)█ Overview
AI Breakout Bands (Zeiierman) is an adaptive trend and breakout detection system that combines Kalman filtering with advanced K-Nearest Neighbor (KNN) smoothing. The result is a smart, self-adjusting band structure that adapts to dynamic market behavior, identifying breakout conditions with precision and visual clarity.
At its core, this indicator estimates price behavior using a two-dimensional Kalman filter (position + velocity), then enhances the smoothing process with a nonlinear, similarity-based KNN filter. This unique blend enables it to handle noisy markets and directional shifts with both speed and stability — providing breakout traders and trend followers a reliable framework to act on.
Whether you're identifying volatility expansions, capturing trend continuations, or spotting early breakout conditions, AI Breakout Bands gives you a mathematically grounded, visually adaptive roadmap of real-time market structure.
█ How It Works
⚪ Kalman Filter Engine
The Kalman filter models price movement as a state system with two components:
Position (price)
Velocity (trend direction)
It recursively updates predictions using real-time price as a noisy observation, balancing responsiveness with smoothness.
Process Noise (Position) controls sensitivity to sudden moves.
Process Noise (Velocity) controls smoothing of directional flow.
Measurement Noise (R) defines how much the filter "trusts" live price data.
This component alone creates a responsive yet stable estimate of the market’s center of gravity.
⚪ Advanced K-Neighbor Smoothing
After the Kalman estimate is computed, the script applies a custom K-Nearest Neighbor (KNN) smoother.
Rather than averaging raw values, this method:
Finds K most similar past Kalman values
Weighs them by similarity (inverse of absolute distance)
Produces a smoother that emphasizes structural similarity
This nonlinear approach gives the indicator an AI feature — reacting fast when needed, yet staying calm in consolidation.
█ How to Use
⚪ Trend Recognition
The line color shifts dynamically based on slope direction and breakout confirmation.
Bullish conditions: price above the mid band with positive slope
Bearish conditions: price below the mid band with negative slope
⚪ Breakout Signals
Price breaking above or below the bands may signal momentum acceleration.
Combine with your own volume or momentum confirmation for stronger entries.
Bands adapt to market noise, helping filter out low-quality whipsaws.
█ Settings
Process Noise (Position): Controls Kalman filter’s sensitivity to price changes.
Process Noise (Velocity): Controls smoothing of directional component.
Measurement Noise (R): Defines how much trust is placed in price data.
K-Neighbor Length: Number of historical Kalman values considered for smoothing.
Slope Calculation Window: Number of bars used to compute trend slope of the smoothed Kalman.
Band Lookback (MAE): Rolling period for average absolute error.
Band Multiplier: Multiplies MAE to determine band width.
-----------------
Disclaimer
The content provided in my scripts, indicators, ideas, algorithms, and systems is for educational and informational purposes only. It does not constitute financial advice, investment recommendations, or a solicitation to buy or sell any financial instruments. I will not accept liability for any loss or damage, including without limitation any loss of profit, which may arise directly or indirectly from the use of or reliance on such information.
All investments involve risk, and the past performance of a security, industry, sector, market, financial product, trading strategy, backtest, or individual's trading does not guarantee future results or returns. Investors are fully responsible for any investment decisions they make. Such decisions should be based solely on an evaluation of their financial circumstances, investment objectives, risk tolerance, and liquidity needs.

AI Volume Breakout for scalpingPurpose of the Indicator
This script is designed for trading, specifically for scalping, which involves making numerous trades within a very short time frame to take advantage of small price movements. The indicator looks for volume breakouts, which are moments when trading volume significantly increases, potentially signaling the start of a new price movement.
Key Components:
Parameters:
Volume Threshold (volumeThreshold): Determines how much volume must increase from one bar to the next for it to be considered significant. Set at 4.0, meaning volume must quadruplicate for a breakout signal.
Price Change Threshold (priceChangeThreshold): Defines the minimum price change required for a breakout signal. Here, it's 1.5% of the bar's opening price.
SMA Length (smaLength): The period for the Simple Moving Average, which helps confirm the trend direction. Here, it's set to 20.
Cooldown Period (cooldownPeriod): Prevents signals from being too close together, set to 10 bars.
ATR Period (atrPeriod): The period for calculating Average True Range (ATR), used to measure market volatility.
Volatility Threshold (volatilityThreshold): If ATR divided by the close price exceeds this, the market is considered too volatile for trading according to this strategy.
Calculations:
SMA (Simple Moving Average): Used for trend confirmation. A bullish signal is more likely if the price is above this average.
ATR (Average True Range): Measures market volatility. Lower volatility (below the threshold) is preferred for this strategy.
Signal Generation:
The indicator checks if:
Volume has increased significantly (volumeDelta > 0 and volume / volume >= volumeThreshold).
There's enough price change (math.abs(priceDelta / open) >= priceChangeThreshold).
The market isn't too volatile (lowVolatility).
The trend supports the direction of the price change (trendUp for bullish, trendDown for bearish).
If all these conditions are met, it predicts:
1 (Bullish) if conditions suggest buying.
0 (Bearish) if conditions suggest selling.
Cooldown Mechanism:
After a signal, the script waits for a number of bars (cooldownPeriod) before considering another signal to avoid over-trading.
Visual Feedback:
Labels are placed on the chart:
Green label for bullish breakouts below the low price.
Red label for bearish breakouts above the high price.
How to Use:
Entry Points: Look for the labels on your chart to decide when to enter trades.
Risk Management: Since this is for scalping, ensure each trade has tight stop-losses to manage risk due to the quick, small movements.
Market Conditions: This strategy might work best in markets with consistent volume and price changes but not extreme volatility.
Caveats:
This isn't real AI; it's a heuristic based on volume and price. Actual AI would involve machine learning algorithms trained on historical data.
Always backtest any strategy, and consider how it behaves in different market conditions, not just the ones it was designed for.

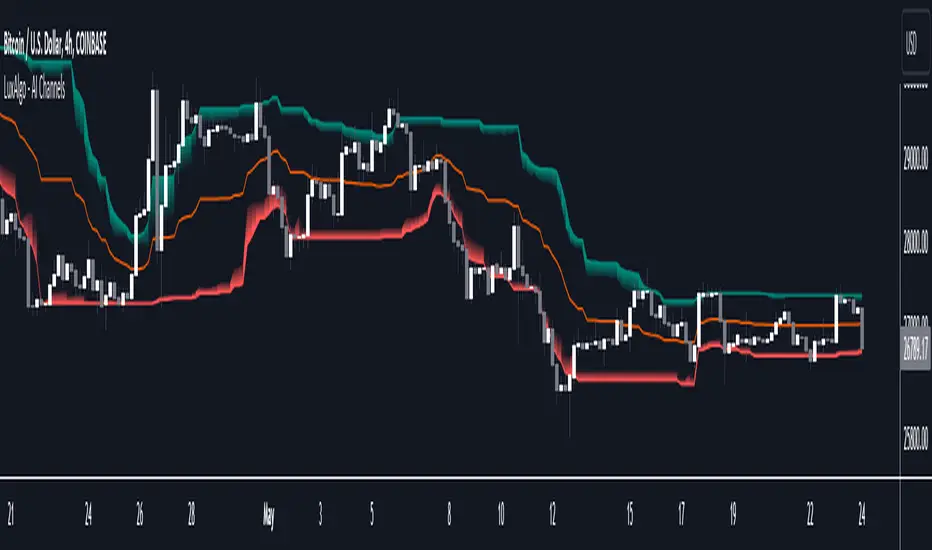
AI Channels (Clustering) [LuxAlgo]The AI Channels indicator is constructed based on rolling K-means clustering, a common machine learning method used for clustering analysis. These channels allow users to determine the direction of the underlying trends in the price.
We also included an option to display the indicator as a trailing stop from within the settings.
🔶 USAGE
Each channel extremity allows users to determine the current trend direction. Price breaking over the upper extremity suggesting an uptrend, and price breaking below the lower extremity suggesting a downtrend. Using a higher Window Size value will return longer-term indications.
The "Clusters" setting allows users to control how easy it is for the price to break an extremity, with higher values returning extremities further away from the price.
The "Denoise Channels" is enabled by default and allows to see less noisy extremities that are more coherent with the detected trend.
Users who wish to have more focus on a detected trend can display the indicator as a trailing stop.
🔹 Centroid Dispersion Areas
Each extremity is made of one area. The width of each area indicates how spread values within a cluster are around their centroids. A wider area would suggest that prices within a cluster are more spread out around their centroid, as such one could say that it is indicative of the volatility of a cluster.
Wider areas around a specific extremity can indicate a larger and more spread-out amount of prices within the associated cluster. In practice price entering an area has a higher chance to break an associated extremity.
🔶 DETAILS
The indicator performs K-means clustering over the most recent Window Size prices, finding a number of user-specified clusters. See here to find more information on cluster detection.
The channel extremities are returned as the centroid of the lowest, average, and highest price clusters.
K-means clustering can be computationally expensive and as such we allow users to determine the maximum number of iterations used to find the centroids as well as the number of most historical bars to perform the indicator calculation. Do note that increasing the calculation window of the indicator as well as the number of clusters will return slower results.
🔶 SETTINGS
Window Size: Amount of most recent prices to use for the calculation of the indicator.
Clusters": Amount of clusters detected for the calculation of the indicator.
Denoise Channels: When enabled, return less noisy channels extremities, disabling this setting will return the exact centroids at each time but will produce less regular extremities.
As Trailing Stop: Display the indicator as a trailing stop.
🔹 Optimization
This group of settings affects the runtime performance of the script.
Maximum Iteration Steps: Maximum number of iterations allowed for finding centroids. Excessively low values can return a better script load time but poor clustering.
Historical Bars Calculation: Calculation window of the script (in bars).
AI Momentum [YinYang]Overview:
AI Momentum is a kernel function based momentum Indicator. It uses Rational Quadratics to help smooth out the Moving Averages, this may give them a more accurate result. This Indicator has 2 main uses, first it displays ‘Zones’ that help you visualize the potential movement areas and when the price is out of bounds (Overvalued or Undervalued). Secondly it creates signals that display the momentum of the current trend.
The Zones are composed of the Highest Highs and Lowest lows turned into a Rational Quadratic over varying lengths. These create our Rational High and Low zones. There is however a second zone. The second zone is composed of the avg of the Inner High and Inner Low zones (yellow line) and the Rational Quadratic of the current Close. This helps to create a second zone that is within the High and Low bounds that may represent momentum changes within these zones. When the Rationalized Close crosses above the High and Low Zone Average it may signify a bullish momentum change and vice versa when it crosses below.
There are 3 different signals created to display momentum:
Bullish and Bearish Momentum. These signals display when there is current bullish or bearish momentum happening within the trend. When the momentum changes there will likely be a lull where there are neither Bullish or Bearish momentum signals. These signals may be useful to help visualize when the momentum has started and stopped for both the bulls and the bears. Bullish Momentum is calculated by checking if the Rational Quadratic Close > Rational Quadratic of the Highest OHLC4 smoothed over a VWMA. The Bearish Momentum is calculated by checking the opposite.
Overly Bullish and Bearish Momentum. These signals occur when the bar has Bullish or Bearish Momentum and also has an Rationalized RSI greater or less than a certain level. Bullish is >= 57 and Bearish is <= 43. There is also the option to ‘Factor Volume’ into these signals. This means, the Overly Bullish and Bearish Signals will only occur when the Rationalized Volume > VWMA Rationalized Volume as well as the previously mentioned factors above. This can be useful for removing ‘clutter’ as volume may dictate when these momentum changes will occur, but it can also remove some of the useful signals and you may miss the swing too if the volume just was low. Overly Bullish and Bearish Momentum may dictate when a momentum change will occur. Remember, they are OVERLY Bullish and Bearish, meaning there is a chance a correction may occur around these signals.
Bull and Bear Crosses. These signals occur when the Rationalized Close crosses the Gaussian Close that is 2 bars back. These signals may show when there is a strong change in momentum, but be careful as more often than not they’re predicting that the momentum may change in the opposite direction.
Tutorial:
As we can see in the example above, generally what happens is we get the regular Bullish or Bearish momentum, followed by the Rationalized Close crossing the Zone average and finally the Overly Bullish or Bearish signals. This is normally the order of operations but isn’t always how it happens as sometimes momentum changes don’t make it that far; also the Rationalized Close and Zone Average don’t follow any of the same math as the Signals which can result in differing appearances. The Bull and Bear Crosses are also quite sporadic in appearance and don’t generally follow any sort of order of operations. However, they may occur as a Predictor between Bullish and Bearish momentum, signifying the beginning of the momentum change.
The Bull and Bear crosses may be a Predictor of momentum change. They generally happen when there is no Bullish or Bearish momentum happening; and this helps to add strength to their prediction. When they occur during momentum (orange circle) there is a less likely chance that it will happen, and may instead signify the exact opposite; it may help predict a large spike in momentum in the direction of the Bullish or Bearish momentum. In the case of the orange circle, there is currently Bearish Momentum and therefore the Bull Cross may help predict a large momentum movement is about to occur in favor of the Bears.
We have disabled signals here to properly display and talk about the zones. As you can see, Rationalizing the Highest Highs and Lowest Lows over 2 different lengths creates inner and outer bounds that help to predict where parabolic movement and momentum may move to. Our Inner and Outer zones are great for seeing potential Support and Resistance locations.
The secondary zone, which can cross over and change from Green to Red is also a very important zone. Let's zoom in and talk about it specifically.
The Middle Zone Crosses may help deduce where parabolic movement and strong momentum changes may occur. Generally what may happen is when the cross occurs, you will see parabolic movement to the High / Low zones. This may be the Inner zone but can sometimes be the outer zone too. The hard part is sometimes it can be a Fakeout, like displayed with the Blue Circle. The Cross doesn’t mean it may move to the opposing side, sometimes it may just be predicting Parabolic movement in a general sense.
When we turn the Momentum Signals back on, we can see where the Fakeout occurred that it not only almost hit the Inner Low Zone but it also exhibited 2 Overly Bearish Signals. Remember, Overly bearish signals mean a momentum change in favor of the Bulls may occur soon and overly Bullish signals mean a momentum change in favor of the Bears may occur soon.
You may be wondering, well what does “may occur soon” mean and how do we tell?
The purpose of the momentum signals is not only to let you know when Momentum has occurred and when it is still prevalent. It also matters A LOT when it has STOPPED!
In this example above, we look at when the Overly Bullish and Bearish Momentum has STOPPED. As you can see, when the Overly Bullish or Bearish Momentum stopped may be a strong predictor of potential momentum change in the opposing direction.
We will conclude our Tutorial here, hopefully this Indicator has been helpful for showing you where momentum is occurring and help predict how far it may move. We have been dabbling with and are planning on releasing a Strategy based on this Indicator shortly.
Settings:
1. Momentum:
Show Signals: Sometimes it can be difficult to visualize the zones with signals enabled.
Factor Volume: Factor Volume only applies to Overly Bullish and Bearish Signals. It's when the Volume is > VWMA Volume over the Smoothing Length.
Zone Inside Length: The Zone Inside is the Inner zone of the High and Low. This is the length used to create it.
Zone Outside Length: The Zone Outside is the Outer zone of the High and Low. This is the length used to create it.
Smoothing length: Smoothing length is the length used to smooth out our Bullish and Bearish signals, along with our Overly Bullish and Overly Bearish Signals.
2. Kernel Settings:
Lookback Window: The number of bars used for the estimation. This is a sliding value that represents the most recent historical bars. Recommended range: 3-50.
Relative Weighting: Relative weighting of time frames. As this value approaches zero, the longer time frames will exert more influence on the estimation. As this value approaches infinity, the behavior of the Rational Quadratic Kernel will become identical to the Gaussian kernel. Recommended range: 0.25-25.
Start Regression at Bar: Bar index on which to start regression. The first bars of a chart are often highly volatile, and omission of these initial bars often leads to a better overall fit. Recommended range: 5-25.
If you have any questions, comments, ideas or concerns please don't hesitate to contact us.
HAPPY TRADING!

AI Gamma Levels - Options Flow Signals v1.1# AI Gamma Levels - Options Flow Signals
## 📊 Overview
An educational indicator that estimates institutional options positioning using price action, volume analysis, and technical indicators. Designed to help traders identify key support and resistance zones based on gamma exposure concepts commonly used by market makers and institutional traders.
## 🎯 Key Features
**Gamma Flip Level (⚡)**
- Neutral zone where market maker hedging behavior changes
- Calculated using VWAP and price action
- Acts as dynamic pivot point for intraday trading
**Call Wall (🔴)**
- Resistance zone from heavy call seller positioning
- Identifies where upward price movement may stall
- Based on recent highs + ATR-adjusted volatility
**Put Support (🟢)**
- Support zone from put seller positioning
- Shows where downward moves may find buyers
- Calculated from recent lows with volatility adjustment
**AI Trade Signals (🔮)**
- Multi-factor confluence detector with confidence scoring
- Only triggers on high-probability setups (70%+ confidence)
- Provides clear entry, stop loss, and target levels
- Combines gamma regime, RSI, volume, and price proximity
**Regime Detection**
- Identifies Positive Gamma (bullish bias) vs Negative Gamma (volatile) environments
- Background coloring shows current market regime
- Helps adapt trading strategy to market conditions
**Trading Zone Visualization**
- Shaded area between Call Wall and Put Support
- Shows expected trading range based on gamma positioning
- Zone width indicates market compression or expansion
## 🧠 How AI Signals Work
The AI signal layer analyzes multiple factors simultaneously:
1. **Gamma Regime Alignment** - Price position relative to Gamma Flip
2. **Level Proximity** - Distance to Put Support or Call Wall
3. **Momentum Extremes** - Fast RSI showing oversold/overbought
4. **Volume Confirmation** - Above-average volume on the setup
5. **Price Action Quality** - Bar range and volatility characteristics
Signals only trigger when ALL conditions align, reducing noise and false signals.
**BUY Signal Requirements:**
- Price above Gamma Flip (positive regime)
- Near Put Support (within 0.5%)
- RSI < 35 (oversold)
- Volume spike (1.4x average)
- Confidence ≥ 70%
**SELL Signal Requirements:**
- Price below Gamma Flip (negative regime)
- Near Call Wall (within 0.5%)
- RSI > 65 (overbought)
- Volume spike (1.4x average)
- Confidence ≥ 70%
## 📈 How to Use
**For Day Trading:**
- Watch for bounces at Put Support in positive gamma regime
- Look for resistance at Call Wall in negative gamma regime
- Use AI signals for high-conviction entries with clear risk levels
**For Swing Trading:**
- Monitor zone width for compression/expansion cycles
- Enter when price returns to zone edges with AI confirmation
- Use Gamma Flip as trailing stop reference
**For Options Traders:**
- Identify where institutional gamma is concentrated
- Anticipate pinning behavior near expiration
- Understand market maker hedging flow impact on price
## ⚙️ Customization
**Display Settings:**
- Toggle individual levels on/off
- Show/hide trading zone shading
- Enable/disable AI signals
**Calculation Parameters:**
- Lookback Period (5-100 bars) - adjusts level sensitivity
- Volatility Multiplier (0.5-3.0) - widens/tightens zones
- AI Confidence Threshold (60-90%) - signal selectivity
**Visual Customization:**
- Custom colors for all levels
- Adjustable transparency for zones
- Label size and positioning
## 📊 Info Table
Real-time dashboard showing:
- Current Gamma Flip price
- Call Wall resistance level
- Put Support level
- Active gamma regime
- Trading zone width (%)
- AI signal status and confidence
## 🔔 Built-in Alerts
Set alerts for:
- Gamma Flip crossovers
- Price approaching Call Wall
- Price approaching Put Support
- AI BUY signal triggered
- AI SELL signal triggered
## 📚 Educational Background
**What is Gamma Exposure?**
Gamma measures how fast market makers must hedge their options positions as price moves. Large gamma concentrations create support/resistance as dealers buy into weakness and sell into strength.
**Positive vs Negative Gamma:**
- **Positive Gamma** (above Gamma Flip): Market makers hedge by stabilizing price
- **Negative Gamma** (below Gamma Flip): Market makers hedge by amplifying moves
**Call Walls & Put Supports:**
Heavy open interest at specific strikes creates "walls" where price tends to gravitate toward or bounce away from, especially near expiration.
## ⚠️ Important Notes
**This indicator uses price and volume approximations**, not real options chain data. It demonstrates gamma exposure concepts for educational purposes.
**For true options flow analysis**, consider using platforms with access to real-time open interest, options volume, and Greeks data.
**Risk Management:** Always use proper position sizing, stop losses, and never risk more than you can afford to lose. This indicator should be one tool in your complete trading strategy.
**Not Financial Advice:** This is an educational tool. Past performance does not guarantee future results. Always do your own research and consider consulting with a qualified financial advisor.
## 💡 Best Practices
1. Combine with your existing strategy - don't trade signals blindly
2. Use on liquid stocks/indices with active options markets
3. Pay attention to regime changes at Gamma Flip crossovers
4. Higher timeframes (15m, 1H, 4H) tend to be more reliable
5. Adjust parameters based on the asset's typical volatility
6. Wait for AI signals with 75%+ confidence for highest quality setups
## 🎓 Who This Is For
- Options traders seeking to understand institutional positioning
- Day traders looking for high-probability support/resistance
- Swing traders identifying key zone boundaries
- Anyone interested in learning about gamma exposure impact on price
- Traders wanting AI-assisted trade signal confirmation
---
**Happy Trading! If you find this indicator helpful, please leave a like and comment with your feedback.**

AI-Enhanced MSS HunterAI-Enhanced MSS Hunter
This indicator is a hybrid trading system that merges Mechanical Price Action (ICT Concepts) with Statistical Machine Learning (K-Nearest Neighbors). It is designed to assist traders in identifying high-probability reversals after liquidity sweeps, as well as trend-continuation entries during specific "Kill Zone" sessions.
How It Works
The script operates on a strict 3-step validation process to filter out false signals during choppy market conditions.
1. Liquidity Sweep (The Trigger) The system automatically plots the Previous Day High (PDH) and Previous Day Low (PDL).
The logic begins only when price "sweeps" (breaks) one of these key levels.
State Persistence: Once a level is swept, the system remembers this event for the remainder of the session (or until a signal fires), waiting for the market to reverse.
2. Market Structure Shift (The Setup) After a sweep, the indicator hunts for a Market Structure Shift (MSS).
It tracks dynamic Swing Highs and Swing Lows.
A signal is prepared only if price breaks a recent structural swing point in the opposite direction of the sweep (e.g., Sweep PDL -> Break Swing High).
3. AI / Machine Learning Filter (The Confirmation) To reduce false positives, the signal must be confirmed by a K-Nearest Neighbors (KNN) algorithm.
The Logic: The script analyzes the current values of RSI (14), CCI (14), and ROC (10).
The Comparison: It looks back at the last ~1,000 bars of history to find similar market conditions (neighbors).
The Prediction: If the majority of those historical "neighbors" resulted in a favorable move, the AI confirms the trade. If historical data suggests chop or reversal, the signal is blocked.
Key Features
🎯 Primary Reversal Signals (Circles)
Green Circle: Price swept PDL + Bullish MSS + AI Confirmation.
Red Circle: Price swept PDH + Bearish MSS + AI Confirmation.
♻️ Golden Zone Re-Entries (Triangles) Once a Primary Signal is active, the script tracks the new trend leg.
It automatically draws a dynamic Golden Zone (0.5 – 0.618 Fibonacci Retracement).
If price pulls back into this zone and forms a new MSS, a Re-Entry Triangle is plotted.
Invalidation: If the pullback breaks the original setup's low/high, the zone is removed to prevent bad trades.
⏰ Kill Zone Time Filters Signals are filtered by time to ensure you are trading during high-volume sessions.
Default AM Session: 08:30 – 10:00 (New York Time)
Default PM Session: 14:00 – 15:00 (New York Time)
Fully customizable in settings.
Settings Guide
Key Levels: Toggle PDH/PDL lines and customize colors.
Kill Zones: Enable/Disable time filtering and highlight background colors.
AI Settings:
K-Nearest Neighbors (k): Number of historical neighbors to compare (Default: 5).
Training Window: How far back the AI looks for patterns (Default: 1000 bars).
Visuals: Turn on/off the Golden Zone fib clouds or text labels.
Disclaimer
This tool is for educational purposes only. The "AI" component is a statistical classification algorithm based on historical momentum and does not guarantee future results. Always manage risk and use this indicator as part of a comprehensive trading plan.

Adaptive AI SuperTrend [AlgoPoint]🚀 Adaptive AI SuperTrend
Adaptive AI SuperTrend is a high-performance trading terminal that redefines trend-following by integrating Machine Learning (ML) principles with advanced market regime detection. Unlike static indicators, this system dynamically recalibrates its internal parameters to match the ever-changing volatility of the financial markets.
Equipped with a custom "Wizard Engine," it filters out market noise during consolidation and identifies high-probability trend continuation points, making it an essential tool for scalpers, day traders, and swing traders alike.
🧠 What Makes it "AI"?
While traditional indicators use fixed rules, Adaptive AI SuperTrend utilizes Algorithmic Intelligence to make real-time decisions:
KNN-Inspired Adaptation: The engine analyzes the last 150 bars of volatility and trend strength to automatically adjust its sensitivity.
Market Regime Intelligence: It distinguishes between "Trending" and "Ranging" states using a sophisticated Squeeze Momentum module, preventing "whipsaws" during low-volume periods.
Self-Backtesting Logic: The indicator continuously calculates its own historical Win-Rate. If the probability of success falls below a certain threshold, it suppresses lower-quality signals.
🛠 Key Features
Dynamic Consolidation Boxes: Automatically identifies and wraps "choppy" price action in professional gray boxes. It waits for 3+ bars of consolidation before marking the zone, helping you spot breakout opportunities early.
Multi-Strategy Aggression:
- Conservative: Filtered signals for long-term trend following.
- Balanced: Optimized for daily volatility.
- Aggressive: High-frequency signals for capturing micro-trends.
Dual-Exit Risk Management:
- ATR TP-SL Mode: Sets mathematical targets based on market volatility with persistent on-screen lines.
- Smart Trailing Mode: Rides the trend to its exhaustion point. Includes intelligent labeling (🎯 TP or 🛑 SL) based on the trade's net profitability.
- RSI Pullback Confirmation: Beyond simple trend flips, it detects "buy the dip" or "sell the rip" opportunities within an existing trend using RSI 50-level crossovers.
📊 Real-Time Analytics Dashboard
The integrated AlgoPoint Dashboard provides a surgical view of the market:
- Market State: Instant "Trending" vs. "Ranging" (Consolidation) detection.
- Trend Strength: ADX-based momentum tracking.
- Strategy Status: Real-time feedback on your active aggression and exit modes.
🎨 Clean Charting & Customization
Built for professional clarity, you have total control over the UI:
Toggle Consolidation Boxes on/off.
Toggle ATR Target Lines and Exit Labels.
Customize background filters and dashboard visibility.

AI-based Price action confluence dashboard# **AI-Based Price Action Confluence Dashboard - Publication Guide**
Here's a comprehensive introduction guide for your TradingView indicator publication:
***
## **📊 TITLE**
**AI-Based Price Action Confluence Dashboard**
***
## **🎯 SHORT DESCRIPTION** (For the summary field)
A sophisticated real-time confluence scoring system that analyzes multiple price action signals across 15-minute timeframes, providing traders with an AI-weighted scoring mechanism (0-6 scale) to identify high-probability trade setups through visual signal panels and intelligent path detection.
***
## **📝 FULL DESCRIPTION**
### **Overview**
The AI-Based Price Action Confluence Dashboard is an advanced technical indicator designed to eliminate guesswork in intraday trading by systematically scoring and displaying multiple price action signals in real-time. Unlike traditional single-indicator approaches, this dashboard employs a confluence methodology that combines multiple independent signals to provide stronger trade confirmations and reduce false signals.
This indicator is specifically optimized for **1-minute chart analysis** while monitoring **15-minute price structure**, making it ideal for day traders and scalpers who need precise entry timing with larger timeframe context.
***
### **🔑 Key Features**
**✅ Real-Time AI Confluence Scoring**
- Dynamic scoring system (0-6 points) for both bullish and bearish setups
- Visual meter display shows signal strength at a glance
- Color-coded backgrounds indicate confluence levels (strong, moderate, mixed)
**✅ Multi-Signal Analysis**
The dashboard tracks 6 distinct signal types:
1. **FTFC (First to Finish Close)** - Base & Bonus signals
2. **Long/Short Grab** - Liquidity sweep patterns (Path A)
3. **High/Low Hold** - Extended momentum confirmation (+2 bonus)
4. **2-Up/2-Down** - Clean breakout patterns (Path B)
5. **Breakaway** - First candle gap strategies
**✅ Intelligent Path Detection**
- Mutually exclusive path logic prevents signal conflicts
- Automatically identifies whether price is following a "sweep path" or "clean path"
- Unavailable paths are clearly marked with gray indicators
**✅ Visual Signal Panels**
- 🟢 Green Light = Bullish signal ACTIVE
- 🔴 Red Light = Bearish signal ACTIVE
- 🟡 Yellow Light = Signal BUILDING (conditions partially met)
- ⚪ White Light = Signal OFF
- ▪️ Gray Square = Path UNAVAILABLE (mutually exclusive)
**✅ Comprehensive Alert System**
- 10 different alert conditions covering all major signals
- Strong confluence alerts (5+ points)
- Individual signal completion alerts
- Customizable alert messages
***
### **📐 How It Works**
#### **The Confluence Methodology**
This indicator implements a sophisticated confluence trading approach where multiple independent price action signals are combined to identify high-probability setups. Each signal type contributes points to either the bullish or bearish score, with a maximum of 6 points per direction.
**Scoring Breakdown:**
**BULLISH SIGNALS:**
- FTFC Base (15m close > previous 15m close) = +1
- FTFC Bonus (price clears 15th candle high) = +1
- **PATH A (Sweep):** Long Grab = +1, High Hold Bonus = +2
- **PATH B (Clean):** 2-Up = +1, 2-Up Bonus = +1
- Breakaway (gap above first candle) = +1
**BEARISH SIGNALS:**
- FTFC Base (15m close < previous 15m close) = +1
- FTFC Bonus (price clears 15th candle low) = +1
- **PATH A (Sweep):** Short Grab = +1, Low Hold Bonus = +2
- **PATH B (Clean):** 2-Down = +1, 2-Down Bonus = +1
- Breakaway (gap below first candle) = +1
#### **Path Detection Logic**
The indicator automatically determines which path the market is following:
**PATH A: SWEEP PATH**
- Activated when previous 15m low (bull) or high (bear) is breached
- Indicates liquidity grab before reversal
- Includes powerful +2 bonus for "Hold" confirmations
- Mutually exclusive with Path B
**PATH B: CLEAN PATH**
- Activated when previous 15m low (bull) or high (bear) holds
- Indicates strong directional momentum without sweep
- Cleaner price action but smaller point potential
- Mutually exclusive with Path A
This mutual exclusivity prevents double-counting and ensures signal accuracy.
***
### **🎨 How to Use**
#### **Installation**
1. Add indicator to your 1-minute chart
2. The dashboard appears as a table overlay (default: top right)
3. No additional indicators required - this is a complete system
#### **Reading the Dashboard**
**Top Section - Confluence Meter:**
- Shows current bull/bear scores with visual dot meters
- Background color changes based on confluence strength:
- **Bright Green/Red** = 5+ points (strong directional bias)
- **Medium Green/Red** = 3+ points (moderate bias)
- **Orange** = 3+ points both sides (conflicting signals)
- **Gray** = Low confluence (choppy conditions)
**Signal Panels Section:**
- Each row shows a signal type with bull/bear lights side-by-side
- Active signals (🟢🔴) contribute to the total score
- Building signals (🟡) indicate potential setups forming
- Unavailable paths (▪️) show which exclusive path is blocked
#### **Trading Strategy**
**High-Probability Long Entries:**
- Bull score ≥ 5 AND bear score ≤ 1
- Multiple green lights active in signal panels
- PATH A or PATH B showing full completion
- Consider entry on pullback to key 15m level
**High-Probability Short Entries:**
- Bear score ≥ 5 AND bull score ≤ 1
- Multiple red lights active in signal panels
- PATH A or PATH B showing full completion
- Consider entry on rally to key 15m level
**Avoid Trading When:**
- Both scores are 3+ (conflicting signals)
- No path is showing active/building status
- Score is below 3 on both sides (low confluence)
#### **Risk Management**
- Use 15m swing high/low for stop placement
- Target opposing 15m level or previous session extremes
- Scale out at partial targets when confluence decreases
- Best results when combined with proper position sizing
***
### **⚙️ Customization**
**Dashboard Settings:**
- **Table Location:** Top Left, Top Right, Bottom Left, Bottom Right
- **Text Size:** Tiny, Small, Normal, Large
**Color Scheme:**
- **Bullish Color:** Customize green for bull signals (default: #00cc66)
- **Bearish Color:** Customize red for bear signals (default: #ff4444)
- **Building Color:** Customize yellow for forming signals (default: #ffaa00)
- **Inactive Color:** Customize gray for off signals (default: #555555)
- **Unavailable Color:** Customize dark gray for blocked paths (default: #333333)
All colors can be adjusted to match your chart theme or visual preferences.
***
### **🎯 Best Practices**
1. **Use on 1-minute charts only** - The indicator is calibrated for this timeframe
2. **Trade during liquid sessions** - Best results during NY/London overlap
3. **Wait for 3+ confluence** - Minimum threshold for trade consideration
4. **Watch path transitions** - Signal strength changes when paths flip
5. **Use alerts strategically** - Set alerts for 5+ confluence to catch strong setups
6. **Combine with volume** - High volume confirms signal validity
7. **Respect 15m structure** - Don't fight the larger timeframe bias
***
### **⚠️ Important Notes**
- This indicator is designed for **intraday trading only**
- Requires active monitoring during trading sessions
- Works best on liquid instruments (major forex pairs, indices, large-cap stocks)
- Not suitable for swing trading or position trading
- Past performance does not guarantee future results
- Always use proper risk management and position sizing
***
### **🏷️ Category**
**Oscillators** or **Volatility** (choose based on TradingView categories)
***
### **🏷️ Suggested Tags**
- confluence
- price action
- day trading
- scalping
- intraday
- signals
- dashboard
- multi-timeframe
- 1-minute
- 15-minute
***
### **📜 Disclaimer**
This indicator is a tool for technical analysis and should not be used as the sole basis for trading decisions. All trading involves risk, and you should never risk more than you can afford to lose. The developer assumes no responsibility for trading losses incurred through the use of this indicator. Always practice proper risk management and consider your own risk tolerance before trading.

AI Adaptive Trend Navigator Echo EditionAI Adaptive Trend Navigator
This is an advanced trend-following system optimized for high-volatility index futures (TX). Built upon the LuxAlgo clustering framework, this version introduces several critical enhancements to meet professional trading standards:
1. State Consistency Iteration Enhanced the underlying logic for dynamic arrays and User-Defined Types (UDTs) to ensure stable "State Persistence." This fix eliminates logic gaps during real-time price fluctuations, ensuring that historical backtests perfectly align with live execution.
2. Adaptive Factor Tuning (K-means) The system simulates dozens of parameter paths in real-time, using K-means clustering to automatically select the optimal factor suited for the current market volatility.
3. Advanced Practical Filters
Dynamic Buffer Strategy: Filters out market noise during consolidation and early session volatility.
Confidence Threshold: Only triggers signals when the AI performance score meets the required quality.
Cooldown Logic: Prevents rapid signal flipping in choppy markets.
🧠 開發理念:將 AI 自適應力帶入台指期實戰 針對台指期(TX)高波動特性開發,透過機器學習演算法動態尋優,解決傳統指標參數固定的滯後性。
✨ Echo 版核心優化點
數據連續性迭代:底層邏輯優化,確保訊號在即時盤勢中穩定不跳斷,回測與實戰高度吻合。
自適應動態尋優:透過 K-means 聚類自動鎖定當前最佳 ATR 因子。
實戰多重濾網:包含空間緩衝區 (Buffer) 與信心門檻,大幅提升訊號品質。
📊 視覺說明
🚀 Rocket: AI confirms trend momentum.
⚡ Lightning: Trend exhaustion or reversal warning.
⚠️ Disclaimer: For educational and technical analysis purposes only.

Mission Control Dashboard (AI, Crypto, Liquidity)Description: Mission Control Dashboard (AI, Liquidity) is a comprehensive macro-liquidity and cycle-analysis dashboard designed to track the "Flow of Funds" across traditional and crypto markets. Instead of looking at price action alone, this script monitors the fundamental "plumbing" of the global economy.
Key Metrics Tracked:
The Debt Wall: Monitors the US 10Y Yield and TLT price. It signals a "Critical" state if yields spike above 5% or TLT drops below $80, indicating high stress in the bond market.
Global Liquidity (MTF Stable): A proprietary calculation summing the balance sheets of the FED, ECB, BoJ, and PBoC, plus Stablecoin market cap. It calculates the Rate of Change (ROC) to see if the world is "printing" or "draining" money.
TGA Hidden Fuel: Tracks the Treasury General Account. A falling TGA is often bullish for risk assets as it injects liquidity into the banking system.
Universal Alt Season: Monitors TOTAL3 (Crypto market cap excluding BTC & ETH) for parabolic moves (>30% ROC).
AI Infra Capex: Real-time tracking of Capital Expenditures from MSFT, GOOG, AMZN, and META to gauge the health of the AI cycle.
How to use:
Green Status across the board: High probability for "Risk-On" environments (Alt season, Tech rallies).
Strategic Beta vs. Tactical Alpha: If Beta is draining but Alpha is accelerating, it suggests a "False Breakout" or a divergence in liquidity.
Uranium Trend: Used as a proxy for the energy transition and long-term industrial cycle strength.

ThinkTech AI SignalsThink Tech AI Strategy
The Think Tech AI Strategy provides a structured approach to trading by integrating liquidity-based entries, ATR volatility thresholds, and dynamic risk management. This strategy generates buy and sell signals while automatically calculating take profit and stop loss levels, boasting a 64% win rate based on historical data.
Usage
The strategy can be used to identify key breakout and retest opportunities. Liquidity-based zones act as potential accumulation and distribution areas and may serve as future support or resistance levels. Buy and sell zones are identified using liquidity zones and ATR-based filters. Risk management is built-in, automatically calculating take profit and stop loss levels using ATR multipliers. Volume and trend filtering options help confirm directional bias using a 50 EMA and RSI filter. The strategy also allows for session-based trading, limiting trades to key market hours for higher probability setups.
Settings
The risk/reward ratio can be adjusted to define the desired stop loss and take profit calculations. The ATR length and threshold determine ATR-based breakout conditions for dynamic entries. Liquidity period settings allow for customized analysis of price structure for support and resistance zones. Additional trend and RSI filters can be enabled to refine trade signals based on moving averages and momentum conditions. A session filter is included to restrict trade signals to specific market hours.
Style
The strategy includes options to display liquidity lines, showing key support and resistance areas. The first 15-minute candle breakout zones can also be visualized to highlight critical market structure points. A win/loss statistics table is included to track trade performance directly on the chart.
This strategy is intended for descriptive analysis and should be used alongside other confluence factors. Optimize your trading process with Think Tech AI today!

SuperTrend AI (Clustering) [LuxAlgo]The SuperTrend AI indicator is a novel take on bridging the gap between the K-means clustering machine learning method & technical indicators. In this case, we apply K-Means clustering to the famous SuperTrend indicator.
🔶 USAGE
Users can interpret the SuperTrend AI trailing stop similarly to the regular SuperTrend indicator. Using higher minimum/maximum factors will return longer-term signals.
The displayed performance metrics displayed on each signal allow for a deeper interpretation of the indicator. Whereas higher values could indicate a higher potential for the market to be heading in the direction of the trend when compared to signals with lower values such as 1 or 0 potentially indicating retracements.
In the image above, we can notice more clear examples of the performance metrics on signals indicating trends, however, these performance metrics cannot perform or predict every signal reliably.
We can see in the image above that the trailing stop and its adaptive moving average can also act as support & resistance. Using higher values of the performance memory setting allows users to obtain a longer-term adaptive moving average of the returned trailing stop.
🔶 DETAILS
🔹 K-Means Clustering
When observing data points within a specific space, we can sometimes observe that some are closer to each other, forming groups, or "Clusters". At first sight, identifying those clusters and finding their associated data points can seem easy but doing so mathematically can be more challenging. This is where cluster analysis comes into play, where we seek to group data points into various clusters such that data points within one cluster are closer to each other. This is a common branch of AI/machine learning.
Various methods exist to find clusters within data, with the one used in this script being K-Means Clustering , a simple iterative unsupervised clustering method that finds a user-set amount of clusters.
A naive form of the K-Means algorithm would perform the following steps in order to find K clusters:
(1) Determine the amount (K) of clusters to detect.
(2) Initiate our K centroids (cluster centers) with random values.
(3) Loop over the data points, and determine which is the closest centroid from each data point, then associate that data point with the centroid.
(4) Update centroids by taking the average of the data points associated with a specific centroid.
Repeat steps 3 to 4 until convergence, that is until the centroids no longer change.
To explain how K-Means works graphically let's take the example of a one-dimensional dataset (which is the dimension used in our script) with two apparent clusters:
This is of course a simple scenario, as K will generally be higher, as well the amount of data points. Do note that this method can be very sensitive to the initialization of the centroids, this is why it is generally run multiple times, keeping the run returning the best centroids.
🔹 Adaptive SuperTrend Factor Using K-Means
The proposed indicator rationale is based on the following hypothesis:
Given multiple instances of an indicator using different settings, the optimal setting choice at time t is given by the best-performing instance with setting s(t) .
Performing the calculation of the indicator using the best setting at time t would return an indicator whose characteristics adapt based on its performance. However, what if the setting of the best-performing instance and second best-performing instance of the indicator have a high degree of disparity without a high difference in performance?
Even though this specific case is rare its however not uncommon to see that performance can be similar for a group of specific settings (this could be observed in a parameter optimization heatmap), then filtering out desirable settings to only use the best-performing one can seem too strict. We can as such reformulate our first hypothesis:
Given multiple instances of an indicator using different settings, an optimal setting choice at time t is given by the average of the best-performing instances with settings s(t) .
Finding this group of best-performing instances could be done using the previously described K-Means clustering method, assuming three groups of interest (K = 3) defined as worst performing, average performing, and best performing.
We first obtain an analog of performance P(t, factor) described as:
P(t, factor) = P(t-1, factor) + α * (∆C(t) × S(t-1, factor) - P(t-1, factor))
where 1 > α > 0, which is the performance memory determining the degree to which older inputs affect the current output. C(t) is the closing price, and S(t, factor) is the SuperTrend signal generating function with multiplicative factor factor .
We run this performance function for multiple factor settings and perform K-Means clustering on the multiple obtained performances to obtain the best-performing cluster. We initiate our centroids using quartiles of the obtained performances for faster centroids convergence.
The average of the factors associated with the best-performing cluster is then used to obtain the final factor setting, which is used to compute the final SuperTrend output.
Do note that we give the liberty for the user to get the final factor from the best, average, or worst cluster for experimental purposes.
🔶 SETTINGS
ATR Length: ATR period used for the calculation of the SuperTrends.
Factor Range: Determine the minimum and maximum factor values for the calculation of the SuperTrends.
Step: Increments of the factor range.
Performance Memory: Determine the degree to which older inputs affect the current output, with higher values returning longer-term performance measurements.
From Cluster: Determine which cluster is used to obtain the final factor.
🔹 Optimization
This group of settings affects the runtime performances of the script.
Maximum Iteration Steps: Maximum number of iterations allowed for finding centroids. Excessively low values can return a better script load time but poor clustering.
Historical Bars Calculation: Calculation window of the script (in bars).

AI Adaptive Trend Navigator Strategy Echo EditionAI Adaptive Trend Navigator Strategy
This is a professional long-only automated strategy optimized for Taiwan Index Futures (TX). Based on the LuxAlgo clustering framework, this version features advanced logic iteration for institutional-grade backtesting and execution.
1. Realistic Cost Modeling To ensure backtest reliability, this strategy is pre-configured with:
Slippage: 2 ticks (Approx. 400 TWD per side).
Commission: 100 TWD per side.
Total Cost: 500 TWD per side. This provides a rigorous stress test for real-world trading environments.
2. State Consistency & Logic Continuity Optimized the underlying array handling to ensure "State Persistence." This eliminates the logic gaps common in real-time script execution, ensuring that historical signals are 100% consistent with live alerts.
3. Adaptive AI Clustering Utilizes K-means clustering to dynamically select the optimal ATR factors based on current market volatility, allowing the strategy to "evolve" as market regimes shift.
🧠 開發理念:追求實戰一致性的量化策略 本策略旨在為台指期(TX)提供一套具備真實參考價值的自動化系統。
✨ Echo 版核心優化點
數據連續性迭代:修正底層邏輯,確保訊號在即時盤勢中穩定不跳斷。
真實交易成本模擬:預設 2 點滑價 與 單邊 100 TWD 手續費,單邊總成本對標 500 TWD,拒絕虛假神單,挑戰最嚴苛的回測環境。
台指期專屬參數調校:融入針對台灣市場波動特性的預設參數與過濾邏輯。
🛡️ 進階實戰過濾
空間緩衝區 (Buffer Strategy):價格需有效突破緩衝區才觸發,精準過濾盤整雜訊。
AI 信心評分系統:只有當動能穩定度達標時才會發進場訊號。
冷卻保護機制:有效抑制訊號在洗盤區間過度頻繁跳動。
⚠️ Disclaimer: Backtest results do not guarantee future performance.

Mission Control Dashboard (AI, Crypto, Liquidity) FASTCONCEPT Price is a lagging indicator. Liquidity is a leading indicator. "Mission Control Dashboard (AI, Crypto, Liquidity) FAST" is a sophisticated macroeconomic dashboard designed to audit the "plumbing" of the financial system in real-time. Unlike standard indicators that rely solely on price action, this tool pulls data from the Federal Reserve (FRED), Treasury Statements, Corporate Financials (10-K/10-Q), and On-Chain Stablecoin metrics to visualize the structural flows driving the market.
THE "UNIFIED FIELD" SOLVER One of the hardest challenges in cross-asset scripting is "Time Dilation"—synchronizing 24/7 Crypto markets (Bitcoin) with Mon-Fri Traditional markets (Stocks/Bonds).
Standard scripts fail on weekends, showing mismatched data.
This engine uses a Weekly Anchor system. It calculates all momentum and liquidity metrics based on "Week-to-Date" or "Month-Ago" anchors. This ensures that a "Liquidity Drain" looks identical whether you are viewing a Bitcoin chart on Saturday or an Apple chart on Monday.
THE CHRONOS LOGIC The dashboard is sorted by Time Sensitivity (Speed of impact), from fast-twitch tactical signals to slow-moving structural fundamentals.
1. TACTICAL (Reacts in 24–48h)
Stablecoin Flight: Measures the immediate flow of capital from Volatile Assets to Stablecoins (USDT/USDC). A spike (>0.5%) indicates fear/sidelining.
Liquidity Alpha: Calculates the efficiency of capital. It subtracts "Friction" (Dollar Strength + Yields) from "Flow" (Liquidity Beta). High Alpha means money is flowing easily into risk assets.
Alt Euphoria: Tracks the overheating of the Altcoin market (TOTAL3). Green indicates sustainable growth; Red (>45%) warns of a "blow-off top."
Retail FOMO: A sentiment gauge comparing Coinbase Stock ( NASDAQ:COIN ) performance vs. Bitcoin ( CRYPTOCAP:BTC ). When Retail outperforms the Asset, local tops often follow.
2. LIQUIDITY & MACRO (Reacts in 1–4 Weeks)
Debt Wall (10Y): The Rate-of-Change of the US 10-Year Treasury Yield. Spiking yields act as gravity on risk assets.
Liquidity Beta: The raw "Quantity of Money." Tracks the 4-week change in Net Liquidity (Fed Balance Sheet - TGA + Stablecoins).
TGA Balance: The Critical Monitor. Tracks the Treasury General Account. When the TGA rises (Red), the government is draining liquidity from the banking system. When it falls (Green), it releases cash.
Note: This script includes an auto-scaler to handle TGA data in both Billions and Millions.
3. STRUCTURAL (Reacts in 3–12 Months)
AI Capex (YoY & QoQ): The "Floor" of the 2025/2026 cycle. Tracks the Capital Expenditure of the Hyperscalers (MSFT, GOOGL, AMZN, META). As long as this remains high (>30%), the infrastructure boom supports the tech narrative.
PMI Manufacturing: Tracks the ISM Manufacturing cycle. Contraction (<50) often forces Fed intervention.
Micron Inventory: A lead indicator for the hardware cycle.
HOW TO USE
Status Colors: The traffic light system helps you assess risk at a glance.
🟢 GREEN (Healthy): Flow is positive, friction is low, fundamentals are strong.
🔴 RED (Danger): Liquidity is draining (TGA spike), yields are shock-rising, or FOMO is excessive.
Zero Configuration: The script auto-detects asset classes and scales units (Billions/Trillions) automatically.
DATA SOURCES
Federal Reserve Economic Data (FRED)
Daily Treasury Statement (DTS)
CryptoCap (TradingView)
Nasdaq/Corporate Financials
Disclaimer: This tool is for informational purposes only and does not constitute financial advice. Macro data feeds are subject to reporting delays.

ai quant oculusAI QUANT OCULUS
Version 1.0 | Pine Script v6
Purpose & Innovation
AI QUANT OCULUS integrates four distinct technical concepts—exponential trend filtering, adaptive smoothing, momentum oscillation, and Gaussian smoothing—into a single, cohesive system that delivers clear, objective buy and sell signals along with automatically plotted stop-loss and three profit-target levels. This mash-up goes beyond a simple EMA crossover or standalone TRIX oscillator by requiring confluence across trend, adaptive moving averages, momentum direction, and smoothed price action, reducing false triggers and focusing on high‐probability turning points.
How It Works & Why Its Components Matter
Trend Filter: EMA vs. Adaptive MA
EMA (20) measures the prevailing trend with fixed sensitivity.
Adaptive MA (also EMA-based, length 10) approximates a faster-responding moving average, standing in for a KAMA-style filter.
Bullish bias requires AMA > EMA; bearish bias requires AMA < EMA. This ensures signals align with both the underlying trend and a more nimble view of recent price action.
Momentum Confirmation: TRIX
Calculates a triple-smoothed EMA of price over TRIX Length (15), then converts it to a percentage rate-of-change oscillator.
Positive TRIX reinforces bullish entries; negative TRIX reinforces bearish entries. Using TRIX helps filter whipsaws by focusing on sustained momentum shifts.
Gaussian Price Smoother
Applies two back-to-back 5-period EMAs to the price (“gaussian” smoothing) to remove short-term noise.
Price above the smoothed line confirms strength for longs; below confirms weakness for shorts. This layer avoids entries on erratic spikes.
Confluence Signals
Buy Signal (isBull) fires only when:
AMA > EMA (trend alignment)
TRIX > 0 (momentum support)
Close > Gaussian (price strength)
Sell Signal (isBear) fires under the inverse conditions.
Requiring all three conditions simultaneously sharply reduces false triggers common to single-indicator systems.
Automatic Risk & Reward Plotting
On each new buy or sell signal (edge detection via not isBull or not isBear ), the script:
Stores entryPrice at the signal bar’s close.
Draws a stop-loss line at entry minus ATR(14) × Stop Multiplier (1.5) by default.
Plots three profit-target lines at entry plus ATR × Target Multiplier (1×, 1.5×, and 2×).
All previous labels and lines are deleted on each new signal, keeping the chart uncluttered and focusing only on the current trade.
Inputs & Customization
Input Description Default
EMA Length Period for the main trend EMA 20
Adaptive MA Length Period for the faster adaptive EM A substitute 10
TRIX Length Period for the triple-smoothed momentum oscillator 15
Dominant Cycle Length (Reserved) 40
Stop Multiplier ATR multiple for stop-loss distance 1.5
Target Multiplier ATR multiple for first profit target 1.5
Show Buy/Sell Signals Toggle on-chart labels for entry signals On
How to Use
Apply to Chart: Best on 15 m–1 h timeframes for swing entries or 5 m for agile scalps.
Wait for Full Confluence:
Look for the AMA to cross above/below the EMA and verify TRIX and Gaussian conditions on the same bar.
A bright “LONG” or “SHORT” label marks your entry.
Manage the Trade:
Place your stop where the red or green SL line appears.
Scale or exit at the three yellow TP1/TP2/TP3 lines, automatically drawn by volatility.
Repeat Cleanly: Each new signal clears prior annotations, ensuring you only track the active setup.
Why This Script Stands Out
Multi-Layer Confluence: Trend, momentum, and noise-reduction must all align, addressing the weaknesses of single-indicator strategies.
Automated Trade Management: No manual plotting—stop and target lines appear seamlessly with each signal.
Transparent & Customizable: All logic is open, adjustable, and clearly documented, allowing traders to tweak lengths and multipliers to suit different instruments.
Disclaimer
No indicator guarantees profit. Always backtest AI QUANT OCULUS extensively, combine its signals with your own analysis and risk controls, and practice sound money management before trading live.

AI Volume SignalsAI Volume Signals
The AI Volume Signals indicator detects significant volume spikes and combines them with trend direction and candle color to generate buy and sell signals. This script utilizes an Exponential Moving Average (EMA) of volume to detect abnormal volume spikes, which could indicate strong market activity. It also filters signals based on the trend direction determined by a 50-period EMA of the price.
Key Features:
Volume Spike Detection: The indicator detects when the current volume exceeds the EMA of volume by a user-defined multiplier, signaling an unusual increase in market activity.
Trend Direction Filter: The 50-period EMA of the price is used to determine the market trend. Buy signals are generated when the price is above the EMA (uptrend), and sell signals occur when the price is below the EMA (downtrend).
Candle Color Filter: The indicator only generates a buy signal when the current candle is bullish (green), and a sell signal when the current candle is bearish (red).
Optional Volume EMA Line: A customizable option allows users to toggle the visibility of the Volume EMA line on the chart. By default, the line is hidden, but can be enabled in the settings.
Signals:
Buy Signal: Generated when a volume spike occurs, the trend is upward, and the current candle is bullish.
Sell Signal: Generated when a volume spike occurs, the trend is downward, and the current candle is bearish.
Alerts:
Buy Alert: Alerts the user when a buy signal is triggered.
Sell Alert: Alerts the user when a sell signal is triggered.
Visualization:
Buy Signal: A green label appears below the bar when the buy conditions are met.
Sell Signal: A red label appears above the bar when the sell conditions are met.
Volume EMA: A line representing the EMA of the volume is plotted on the chart for reference. The visibility of this line can be toggled in the settings.
This indicator can help traders identify potential entry points based on increased volume activity while considering trend direction and candlestick patterns.
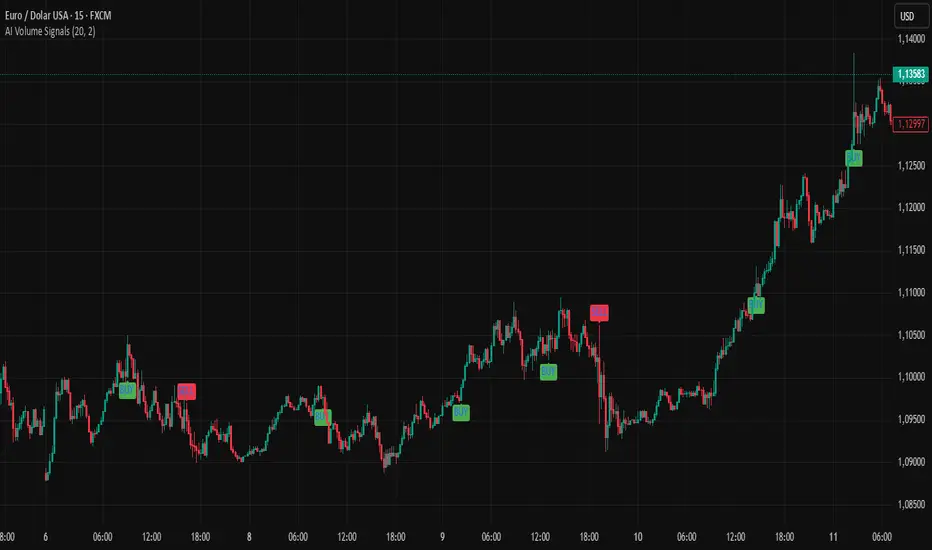
AI Candlestick Pattern Identifier — Arrows & AlertsAI shows you high confidence candlestick patterns so that you can identify them quickly. Buy/Sell arrows will be placed alongside the pattern to alert you of which direction the indicator believes the market will go, as well as showing you the confidence in that indicator.

AI - Williams Alligator Strategy (ATR Stop-Loss) AlertsAI - Williams Alligator Strategy (ATR Stop-Loss) with Alerts
