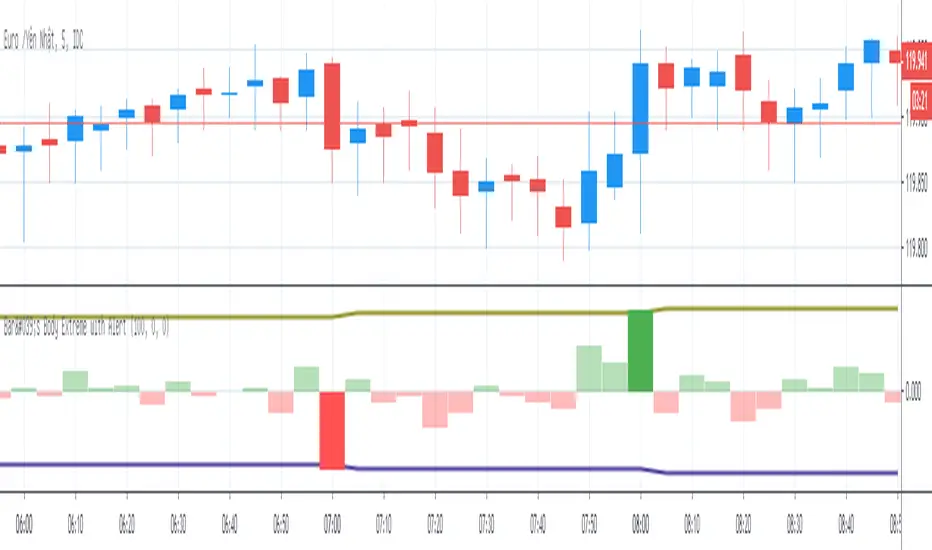
Bar's Body Extreme with AlertBar's Body Extreme with Alert measure volatility of bar's body and caculate extreme level in specified periods or custom level with alert. Detail options below:
1. Default Extreme Level
* Default level is the +/- highest volatility of bar's body in 100 periods
* Periods of bar to calculate default extreme adjustable
2. Custom Extreme
* Default Extreme Top auto disable if Custom Extreme Top >0
* Default Extreme Bottom auto disable if Custom Extreme Bottom <0
3. Alert
* Extreme alert: body's volatility > Extreme top level or body's volatility < Extreme bottom level
* Extreme Top Alert: body's volatility > Extreme top level
* Extreme Bottom Alert: body's volatility < Extreme bottom level
Cerca negli script per "alert"
SB A / A++ ALERT ENGINE (Alerts Only)SB A / A++ Alert Engine
Session-Based Level Rejection Strategy (Automation-Ready)
Overview
The SB A / A++ Alert Engine is a rules-based TradingView indicator designed to identify high-probability institutional-style reversal trades using Stacey Burke–inspired concepts such as previous day levels, session structure, opening ranges, and round numbers.
This tool is alerts-only by design, making it ideal for:
TradingView alerts
Webhook automation
Telegram / Discord signal delivery
External trade execution systems
It does not repaint and evaluates signals on confirmed bar close only.
---
Core Trading Idea
Price frequently reacts at important reference levels during active trading sessions.
This script looks for rejection + confirmation at those levels and grades setups based on confluence and candle quality.
Only A-grade and A++-grade setups are alerted.
---
What the Script Detects
📌 Key Levels (Confluence Engine)
Previous Day High / Low
Initial Balance (Mon–Tue range, active Wed–Fri)
Session Opening Range (first hour of London / NY)
Round Numbers (configurable tick spacing)
Each level touched contributes to confluence — without double-counting the same zone.
---
🕒 Session Control
Signals are only allowed during:
London Session
New York Session
Includes:
Session resets
Max alerts per session
Cooldown between signals
---
🔎 Candle Confirmation
Valid signals require clear rejection behavior, such as:
Bullish / Bearish Engulfing candle
Strong Pin Bar (wick ≥ 2× body)
---
🧠 Trade Grades
A Trade
Valid session
ATR percentile filter passed
≥ 1 level of confluence
Directional rejection
A++ Trade
All A-Trade rules
Strong confirmation candle (engulf or pin)
≥ 2 independent confluence zones
Grades are displayed visually and included in alert payloads.
---
📊 Volatility Filter (ATR Percentile)
Instead of fixed ATR thresholds, the script uses an ATR percentile rank, ensuring trades only trigger when volatility is above normal for that market.
This adapts automatically across:
Forex
Indices
Futures
Crypto
---
Visual Output
▲ Green / Lime triangles → LONG (A / A++)
▼ Orange / Red triangles → SHORT (A / A++)
Color intensity reflects trade grade
Optional session shading (if enabled)
---
Alerts & Automation
All alerts are webhook-ready and structured for automation.
Each alert includes:
Symbol
Timeframe
Direction (LONG / SHORT)
Trade grade (A or A++)
Confluence count
Entry price (close of signal bar)
Designed to integrate with:
Telegram bots
Trade execution bridges
Risk management engines
---
What This Script Is (and Is Not)
✅ IS
A high-quality signal engine
Non-repainting
Automation-friendly
Institutional level-based logic
❌ IS NOT
A scalping indicator
A prediction tool
A “trade every candle” system
This tool favors patience, structure, and quality over frequency.
---
Recommended Usage
Timeframes: M5 – M15
Best markets: FX majors, indices, liquid crypto
Combine with your own execution, risk, and trade management rules
---
⚠️ Disclaimer
This script is for educational and informational purposes only. It does not constitute financial advice. Always test on demo or paper trading before using live capital.

Multi-Condition Alert Builder⚡ Multi-Condition Alert Builder — Modular Alert Framework
The Multi-Condition Alert Builder is a powerful, code-free alert engine for TradingView. It allows traders to build complex multi-condition Buy/Sell alerts using simple dropdown menus — no Pine Script experience required.
Combine up to five separate conditions per side and trigger alerts based on your own custom logic.
🧠 How It Works
Each “Buy” and “Sell” side includes up to five configurable slots, where you can define:
Two data sources (indicators, price, or custom inputs)
A comparison or crossover condition
A static value (optional)
Once your slots are defined, the script combines these individual conditions according to your chosen mode:
Any – triggers when any enabled condition is true
All – same bar – triggers only when all enabled conditions occur on the same bar
All – within bars – allows conditions to complete within a user-defined lookback window
This gives traders fine-grained control to design powerful, adaptive alert logic directly in the chart — no coding required.
⚙️ Key Features
🧩 Up to 5 Buy and 5 Sell Slots – Fully customizable condition slots
🧠 Combine Logic Modes – Any / All / Within Bars flexibility
🔔 Custom Alerts – Generates separate Buy, Sell, or combined alert events
⏱️ Close-Bar Confirmation Option – Avoids premature signals on open candles
💡 Visual Signals – Plots arrows on chart for clear alert visualization
🔄 Indicator-Agnostic – Works with any sources or indicators available in your chart
🧮 Combine Logic Modes Explained
Mode Description
Any Triggers an alert if any active condition is met
All – same bar Requires all active slots to confirm on the same candle
All – within bars Conditions may complete within a set lookback window
🧭 Example Use Cases
Combine RSI, MACD, and MA crossovers for precision entries
Create alert triggers for momentum confluence setups
Build “stacked signal” logic (e.g., RSI < 30 and MACD crossover within 3 bars)
Quickly prototype and test multi-factor alert conditions
🧠 Usage Tip
Once your conditions are set, simply add TradingView alerts tied to:
“BUY↟” for long signals
“SELL↡” for short signals
“ANY ALERT” to trigger on either event
The Alert Builder becomes especially powerful when combined with your favorite custom indicators — enabling smart, automated alerts without extra coding.
⚡ In Short
Build. Combine. Alert.
The Multi-Condition Alert Builder gives you total flexibility to design complex alert logic — visually, intuitively, and efficiently — right on your chart.
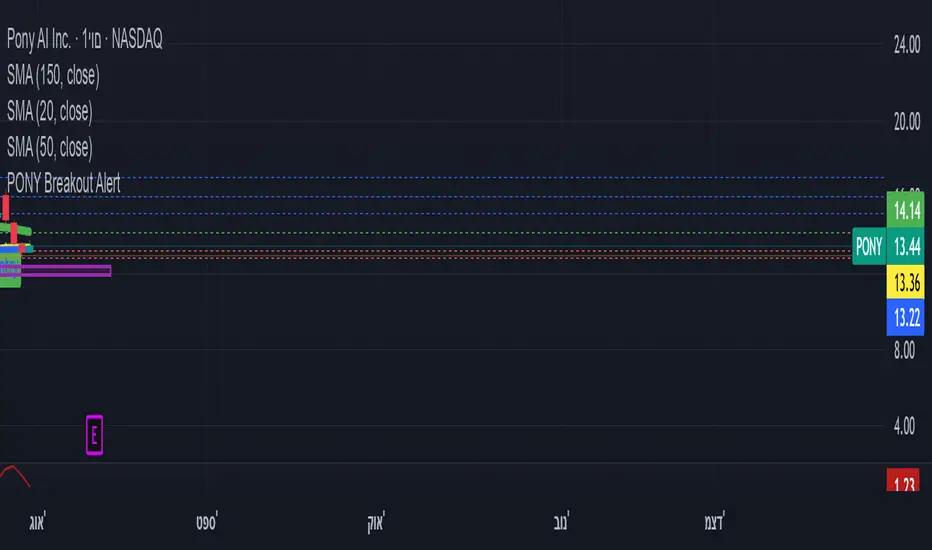
ombs- PONY Breakout Alert
🧠 תקציר הסקריפט: **PONY Breakout Alert 📈
🔍 **מטרה**:
לזהות **פריצה מעלה של רמת 14.15** תוך כדי **מחזור מסחר גבוה מהממוצע**, כדי לאתר **הזדמנות מסחר שורית**.
---
⚙️ רכיבי הסקריפט:
* 📌 **רמת כניסה**:
`entryLevel = 14.15`
* 📊 **תנאי כניסה**:
* סגירת מחיר **מעל 14.15**
* נפח מסחר **גבוה ב־20% מהממוצע ל־20 הימים האחרונים**
* 🔔 **התראה ויזואלית**:
* סמל ירוק "Entry" מופיע מתחת לנר על הגרף
* קווים קבועים לרמות יעד וסטופלוס
* 🎯 **יעדי רווח**:
* Target 1 – 15.15
* Target 2 – 16.00
* Target 3 – 17.00
* 🛑 **סטופלוס**:
* שמרני: 13.20
* אגרסיבי: 12.80
* 🔔 **התראה אוטומטית** (`alertcondition`):
תשלח הודעה:
*"PONY פרצה מעל 14.15 עם מחזור גבוה – שקול כניסה לעסקה."*
---
📝 מתאים עבור:
* סוחרי ניתוח טכני 🧮
* מי שמחפש כניסה מבוססת על פריצה + נפח 📊
* שימוש על גרף יומי בלבד 📅
---
🧠 Script Summary: PONY Breakout Alert 📈
🔍 Objective:
Detect a breakout above the 14.15 level accompanied by high trading volume, in order to identify a bullish trading opportunity.
⚙️ Script Components:
📌 Entry Level:
entryLevel = 14.15
📊 Entry Conditions:
Price closes above 14.15
Volume is 20% higher than the 20-day average
🔔 Visual Alert:
A green "Entry" label appears below the bar on the chart
Static horizontal lines mark targets and stop-loss levels
🎯 Profit Targets:
Target 1 – 15.15
Target 2 – 16.00
Target 3 – 17.00
🛑 Stop Loss:
Conservative: 13.20
Aggressive: 12.80
🔔 Automated Alert (alertcondition):
Sends a message:
"PONY has broken above 14.15 with high volume – consider a long position."
📝 Ideal For:
Technical traders 🧮
Those seeking breakouts confirmed by volume 📊
Daily chart setups only 📅
Stochastic RSI with Alerts# Stochastic RSI with Alerts - User Manual
## 1. Overview
This enhanced Stochastic RSI indicator identifies overbought/oversold conditions with visual signals and customizable alerts. It features:
- Dual-line Stoch RSI (K & D)
- Threshold-based buy/sell signals
- Configurable alert system
- Customizable parameters
## 2. Installation
1. Open TradingView chart
2. Open Pine Editor (📈 icon at bottom)
3. Copy/paste the full code
4. Click "Add to Chart"
## 3. Input Parameters
### 3.1 Core Settings
| Parameter | Default | Description |
|-----------|---------|-------------|
| K | 3 | Smoothing period for %K line |
| D | 3 | Smoothing period for %D line |
| RSI Length | 14 | RSI calculation period |
| Stochastic Length | 14 | Lookback period for Stoch calculation |
| RSI Source | Close | Price source for RSI calculation |
### 3.2 Signal Thresholds
| Parameter | Default | Description |
|-----------|---------|-------------|
| Upper Limit | 80 | Sell signal threshold (overbought) |
| Lower Limit | 20 | Buy signal threshold (oversold) |
### 3.3 Alert Settings
| Parameter | Default | Description |
|-----------|---------|-------------|
| Enable Buy Alerts | True | Toggle buy notifications |
| Enable Sell Alerts | True | Toggle sell notifications |
| Custom Alert Message | Empty | Additional text for alerts |
## 4. Signal Logic
### 4.1 Buy Signal (Green ▲)
Triggers when:
\text{%K crossover %D} \quad AND \quad (\text{%K ≤ Lower Limit} \quad OR \quad \text{%D ≤ Lower Limit})
### 4.2 Sell Signal (Red ▼)
Triggers when:
\text{%K crossunder %D} \quad AND \quad (\text{%K ≥ Upper Limit} \quad OR \quad \text{%D ≥ Upper Limit})
## 5. Alert System
### 5.1 Auto-Generated Alerts
The script automatically creates these alert conditions:
- **Buy Signal Alert**: Triggers on valid buy signals
- **Sell Signal Alert**: Triggers on valid sell signals
Alert messages include:
- Signal type (Buy/Sell)
- Current %K and %D values
- Custom message (if configured)
### 5.2 Alert Configuration
**Method 1: Script-Generated Alerts**
1. Hover over any signal marker
2. Click the 🔔 icon
3. Select trigger conditions:
- "Buy Signal Alert"
- "Sell Signal Alert"
**Method 2: Manual Setup**
1. Open Alert creation window
2. Condition: Select "Stoch RSI Alerts"
3. Choose:
- "Buy Signal Alert" for long entries
- "Sell Signal Alert" for exits/shorts
## 6. Customization Tips
### 6.1 Threshold Adjustment
// For day trading (tighter ranges)
upperLimit = 75
lowerLimit = 25
// For swing trading (wider ranges)
upperLimit = 85
lowerLimit = 15
### 6.2 Visual Modifications
Change signal markers via:
- `style=` : Try `shape.labelup`, `shape.flag`, etc.
- `color=` : Use hex codes (#FF00FF) or named colors
- `size=` : `size.tiny` to `size.huge`
## 7. Recommended Use Cases
1. **Mean Reversion Strategies**: Pair with support/resistance levels
2. **Trend Confirmation**: Filter with 200EMA direction
3. **Divergence Trading**: Compare with price action
## 8. Limitations
- Works best in ranging markets
- Combine with volume analysis for confirmation
- Not recommended as standalone strategy
---
This documentation follows technical writing best practices with:
- Clear parameter tables
- Mathematical signal logic
- Visual hierarchy
- Practical examples
- Usage recommendations

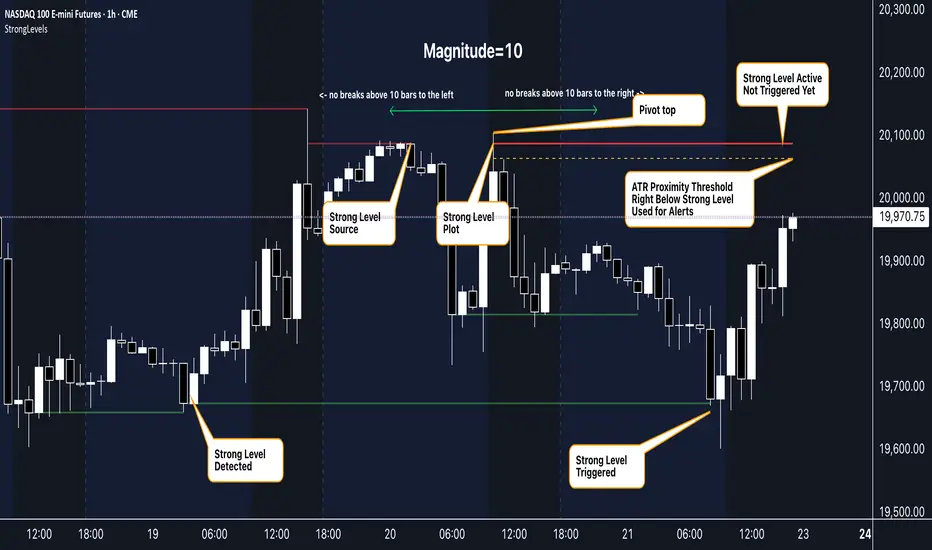
Strong Levels (with Proximity Alerts)█ OVERVIEW
The "Strong Levels (with Proximity Alerts)" indicator offers a fresh approach to identifying support and resistance levels, inspired by the RexDog Trading System (RDTS). It pinpoints significant price reversals using a unique filtering method that reduces noise and enhances reliability. Paired with customizable ATR-based proximity alerts, this indicator empowers traders to track critical price zones with precision.
█ FEATURES
- Rooted in RDTS :
Inspired by the RexDog Trading System (RDTS), it highlights major pivot points where price executed sharp turnarounds, ensuring levels carry true market weight.
- Second-Highest/Lowest Open/Close Method :
Resistance levels use the *second-highest open/close* near pivot highs, while support levels use the *second-lowest open/close* near pivot lows—skipping extreme wicks for cleaner, more dependable lines.
- ATR-Driven Proximity Alerts :
Customizable proximity thresholds, calculated using the Average True Range (ATR), warn traders when price approaches key levels—a standout feature not found in most support/resistance indicators.
- Flexible Customization :
- Magnitude : Tweak pivot sensitivity (default: 10).
- Line Colors : Set resistance (red by default), support (green), and proximity (yellow) lines.
- Line Options : Adjust line origins, transparency for breached levels, and the maximum number of levels shown.
- ATR Settings : Fine-tune proximity sensitivity with ATR length and multiplier.
█ HOW TO USE
1. Add to Chart :
Find "Strong Levels (with Proximity Alerts)" in TradingView’s indicator library and apply it.
2. Read the Lines :
- Red Lines : Resistance, derived from the second-highest open/close near pivot highs.
- Green Lines : Support, based on the second-lowest open/close near pivot lows.
- Yellow Dashed Lines : Proximity thresholds (optional), signaling when price nears a level.
3. Customize :
- Raise `Magnitude` for stronger levels or lower it for more detail.
- Adjust colors, transparency, and max levels to fit your preferences.
- Toggle proximity thresholds on/off based on your trading style.
- Enabling *Plot Line from Actual Pivot Bar* offers a cleaner chart but may mislead as lines plot into the past.
4. Set Alerts :
- Open TradingView’s alert menu (the three dots ... dropdown menu next in indicator list has an option "Add alert on ...") and choose "Approaching Level" or "Level Touched.".
- Don't forget to choose the right Trigger condition, which by default is "Only Once". I usually set it to "Once Per Bar".
- Tailor alert conditions to your needs.
█ LIMITATIONS
- Past-Based Levels :
- Relying on historical pivots, it may not always forecast future moves, especially in rapid markets.
- The 'Plot Line from Actual Pivot Bar' option while visually appealing can imply historical significance that didn’t exist at the time. Be mindful of that.
- Volatility Sensitivity :
High volatility widens ATR-based thresholds, which might trigger alerts too soon.
- Display Management :
A cap on max levels avoids clutter, but tweaking `Max Levels` may be needed across timeframes.
█ ACCOMPANYING CHART
The chart showcases the indicator’s unique edge:
- A pivot high and low are flagged, with nearby bars highlighted.
- Resistance is plotted at the *second-highest open/close* around the pivot high, bypassing the highest wick.
- Support is set at the *second-lowest open/close* near the pivot low, ignoring the deepest wick.
- Yellow dashed proximity lines illustrate how the indicator warns traders as price nears these zones.
- Annotations clarify how skipping extreme wicks creates cleaner, more actionable levels.
█ HOW TO USE
1. Add to Chart :
Locate "Strong Levels (with Proximity Alerts)" in TradingView’s indicator library and apply it to your chart.
2. Read the Lines :
- Red Lines**: Resistance levels, calculated from the second-highest open/close near pivot highs.
- Green Lines : Support levels, derived from the second-lowest open/close near pivot lows.
- Yellow Dashed Lines : Optional proximity thresholds, alerting you when price nears a level.
3. Customize :
- Increase `Magnitude` for stronger, less frequent levels or decrease it for more granularity.
- Modify colors, transparency, or the maximum number of levels to suit your style.
- Enable or disable proximity thresholds as needed.
4. Set Alerts :
- Access TradingView’s alert menu and select "Approaching Level" or "Level Touched."
- Adjust conditions to match your trading preferences.
5. My Personal Approach :
I prefer using this indicator on higher timeframes, like hourly or daily charts. I adjust my `Magnitude`, so it doesn't trigger too often and set my alerts to trigger "Once Per Bar". When price nears a level, I get an alert and I anticipate a reaction but avoid placing limit orders blindly. Instead, I switch to smaller timeframes and combine it with other tools for confirmation before making a trade. This saves me a lot of screen time, and allows me to focus when it matters.
High-Impact News Events with ALERTHigh-Impact News Events with ALERT
This indicator is builds upon the original by adding alert capabilities, allowing traders to receive notifications before and after economic events to manage risk effectively.
This indicator is updated version of the Live Economic Calendar by @toodegrees ( ) which allows user to set alert for the news events.
Key Features
Customizable Alert Selection: Users can choose which impact levels to restrict (High, Medium, Low).
User-Defined Restriction Timing: Set alerts to X minutes before or after the event.
Real-Time Economic Event Detection: Fetches live news data from Forex Factory.
Multi-Event Support: Detects and processes multiple news events dynamically.
Automatic Trading Restriction: user can use this script to stop trades in news events.
Visual Markers:
Vertical dashed lines indicate the start and end of restriction periods.
Background color changes during restricted trading times.
Alerts notify traders during the news events.
How It Works
The user selects which news impact levels should restrict trading.
The script retrieves real-time economic event data from Forex Factory.
Trading can be restricted for X minutes before and after each event.
The script highlights restricted periods with a background color.
Alerts notify traders all time during the news events is active as per the defined time to prevent unexpected volatility exposure.
Customization Options
Choose which news impact levels (High, Medium, Low) should trigger trading restrictions.
Define time limits before and after each news event for restriction.
Enable or disable alerts for restricted trading periods.
How to Use
Apply the indicator to any TradingView chart.
Configure the news event impact levels you want to restrict.
Set the pre- and post-event restriction durations as needed.
The indicator will automatically apply restrictions, plot visual markers, and trigger alerts accordingly.
Limitations
This script relies on Forex Factory data and may have occasional update delays.
TradingView does not support external API connections, so data is updated through internal methods.
The indicator does not execute trades automatically; it only provides visual alerts and restriction signals.
Reference & Credit
This script is based on the Live Economic Calendar by @toodegrees ( ), adding enhanced pre- and post-event alerting capabilities to help traders prepare for market-moving news.
Disclaimer
This script is for informational purposes only and does not constitute financial advice. Users should verify economic data independently and exercise caution when trading around news events. Past performance is not indicative of future results.

PnF Fibonacci Levels with AlertsMy Pine Script indicator, "PnF Fibonacci Levels with Alerts," overlays on a trading chart to generate alerts based on Fibonacci levels in Point and Figure (PnF) charts.
Key Features:
Inputs and Initialization:
It uses a customizable Fibonacci level (set at 0.236) and initializes variables for tracking the high and low of O and X columns.
O Column Logic:
When the current column is identified as an O column (when the close is less than the open), it calculates the Fibonacci level based on the high and low of that column, drawing a line on the chart.
Buy Alert:
If the closing price of the previous bar is above the Fibonacci level of the O column, a buy alert is triggered.
X Column Logic:
If the current column is an X column and the close is above the previous O column's low, it captures the current high and low, calculates the Fibonacci level, and draws it on the chart.
Sell Alert:
A sell alert is triggered if the closing price of the X column is at or below the specified Fibonacci level.
This indicator aids traders by highlighting critical Fibonacci levels and providing timely alerts for potential buy and sell opportunities.

Anchored Auto Fibonacci Retracement with Alerts [ImaWrknMan]SYNOPSIS
Automatically generates a Fibonacci Retracement anchored to the candle of your choosing. As price moves further away from the anchor point, the fib levels automatically adjust to represent the entirety of the move.
BULLISH VS. BEARISH
It automatically detects if the Fibonacci Retracement should be drawn from the low or high of the anchored candle by considering the candles that follow (if they produce new highs, it will use the anchored candle low; if they produce new lows, it will use the anchored candle high).
MITIGATION
If the Fibonacci levels are fully retraced (i.e., price pulls back beyond the originating price), the levels will remain on the chart but it will no longer adjust as new candles form - it will become static.
OPTIONS
The following options are offered:
Extend Retracement Levels
The Fibonacci Retracement levels will extend beyond the last candle into the future. These extensions are visually represented using dashed lines.
Retracement Levels
Twelve levels are supported. The default levels mirror those used by the standard Fibonacci Retracement tool. Select only the levels you want to see on the chart. Line color can also be customized to your liking. You can optionally define an alert condition and alert message for each level (see "Alerts" below).
ALERTS
To receive an alert when price retraces into a level, check the "Alert" box to the right of that level. You can optionally define the text to display in the alert by entering it in the text box to the right of the alert checkbox. Levels with alerts will be marked on the chart with a "bell" symbol. Once you've selected the alerts you want to receive and (optionally) the text for each alert, create an Alert for the indicator.
NOTE: You do NOT need to create a separate Alert for each level.
Limitations
Alerts can only be defined for levels that fall between 0 and 1.
Once an alert is created, its settings are fixed. Any changes to the settings after the Alert is created will have no effect on the existing Alert. In this case, the Alert should be recreated.
Alert notifications will only be generated for visible levels.
Other Alerts
Alert on expansion - Use this alert option if you want to be notified when price moves further from the anchored price, causing the retracement levels to adjust. This is useful if you have Limit orders at current levels and you want to cancel or move them when the levels change.
"Alert on mitigation" - Use this alert option if you want to be notified when the Fibonacci Retracement has been fully retraced.
The code for this indicator was inspired by the Fibonacci Toolkit by LuxAlgo

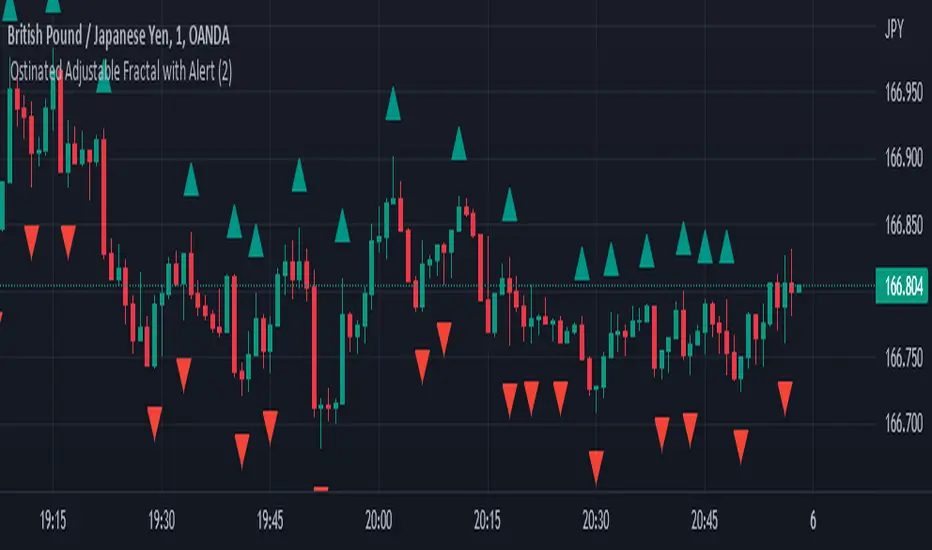
Ostinated Adjustable Fractal with AlertThis indicator (Ostinated Adjustable Fractal with Alert) is like the traditional William Fractals. However, it created to overcome two disadvantages of the William Fractals:
1. Set minimum value to 1. This a big advantage over traditional William Fractal that has a minimum value of 2.
2. Alerts: setting alert with the traditional William Fractal is very difficult. We have created this indicator to simplify setting fractal alerts.
Like and comment.
Enjoy!
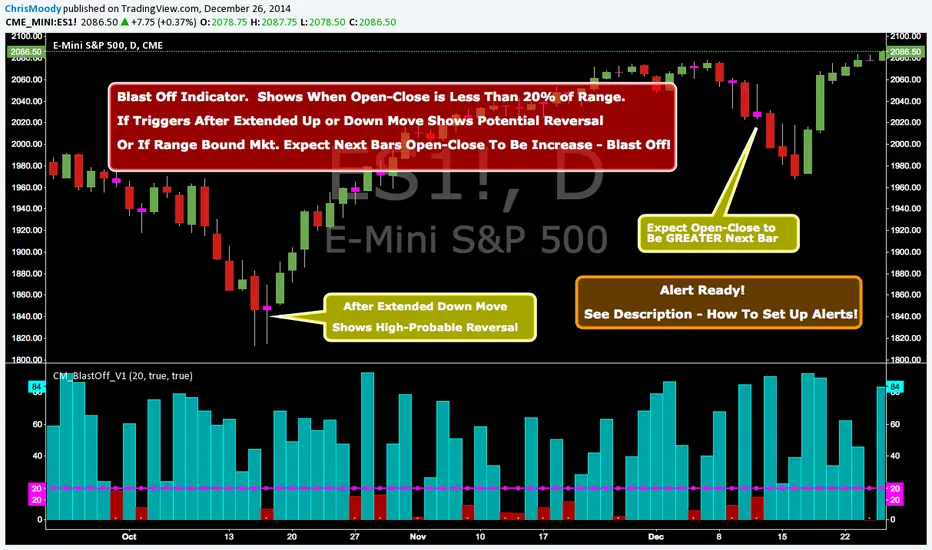
CM_Blast_Off_V1_Alerts ReadyBlast Off Indicator - Alert Ready!!!
Created By Request from @elpuerto936c
Description of Indicator:
***This measures the day's open / close vs then high lows of the day (range)
***When the open /close is less than 20% of the range, then it's likely that the following day will have a big jump.
***The Thought Process is Simply When (Open - Close) is Less Than 20% Of The Range…Shows Indecision and Breakout is Probable.
***Which way? Use whatever indicator you want to figure out if the market is oversold or overbought.
***NOTE: If Indicator Triggers After Extended Up or Down Move…This = High Probability Reversal.
In Inputs Tab:
-Ability to Change The Trigger Value…(This is Percent The (Open-Close) is to the Total RANGE of The Bar).
-Ability to Turn On/Off Highlight Bars via Check Box.
To Set Alert:
-In First Drop Down Box Select Name of Indicator
-In Drop Down to Right Select “Alert Blast Off If Below Trigger”.
-Then Select “Greater Than”.
-Then Select “Value”
-To the Right of Value type in .99
-Select On Bar Close, If not you will get FALSE Alerts.
Support Resistance EMA Crossovers with ORB and AlertsSR EMA ORB combines your Support/Resistance pivot levels + EMA crossover labels/alerts with an optional Opening Range Breakout (ORB) module that can work on higher timeframes using LTF calculation (via request.security).
What it shows
1) Support/Resistance (Pivot based)
Plots pivot Resistance (red) and Support (blue).
Optional break labels:
B for break with volume confirmation (Volume Osc > Threshold)
Bull Wick / Bear Wick wick-based breaks
2) EMA Crossovers (visual + alerts)
Labels:
Up (ST EMA crosses above MT EMA)
Down (ST EMA crosses below MT EMA)
Buy (MT EMA crosses above LT EMA)
Sell (MT EMA crosses below LT EMA)
Includes the original alert() messages exactly like your Script 1.
3) ORB (Opening Range Breakout)
Builds an opening range for the configured “ORB Window” (default: 10 minutes).
After the window ends, it waits for a breakout:
Breakout based on Close or EMA
Optional breakout buffer %
Optional volume filter (uses your Volume Threshold logic)
Entry requires retests based on sensitivity:
High = 0 retests
Medium = 1 retest
Low = 2 retests
Lowest = 3 retests
Shows:
ORB High / ORB Low lines (unique colors, bold width)
ORB Entry label (ORB)
Optional TP1/SL markers (if enabled)
4) Confluence (optional confidence marker)
Prints a separate CONF label when:
ORB entry happens AND
EMA direction agrees (rule selectable)
Optional: also require SR break in the same direction
5) RR helper (optional)
Draws Entry / SL / TP target lines at 1:2 or 1:3
Trigger can be:
ORB Entry
Confluence only (recommended)
6) Dashboards (optional)
Compact ORB dashboard: current bias + entry + SL
Backtest dashboard: trades, wins, losses, win%
Timeframe behavior (important)
ORB supports these window selections: 1m, 5m, 10m, 15m, 30m, 1h, 1D, 1W, 1M
ORB supports these calc TF selections: 1m, 3m, 5m, 10m, 15m, 30m, 1h
Mode
Auto: uses Native when chart TF is supported, otherwise switches to LTF calculation
Native: ORB runs only on supported chart TF; disables otherwise
LTF: ORB always calculates on Calc TF (best for 1H/1D chart viewing)
Examples (recommended setups)
Example 1 — Your main setup (10m ORB on intraday chart)
Goal: trade ORB normally with minimal complexity
Chart TF: 1m / 3m / 5m
ORB:
Mode: Auto
ORB Window: 10m
Calc TF: 10m (or 5m if you want slightly earlier structure)
Sensitivity: Medium
Breakout Condition: Close
TP Method: Dynamic
Stop Loss: Balanced
Visuals:
Draw ORB Lines: ON
Entry Labels: ON
TP/SL Marks: OFF (keeps chart clean)
Example 2 — View ORB on a 1H chart (LTF-on-HTF mode)
Goal: see 10m ORB levels/signals while looking at 1H structure
Chart TF: 1H
ORB:
Mode: LTF
ORB Window: 10m
Calc TF: 5m or 10m
Sensitivity: Medium
Note: On HTF, multiple LTF events can compress into fewer visible updates (normal with security data).
Example 3 — Higher winrate attempt (fewer trades, more filtering)
Goal: reduce bad ORB entries
ORB:
Sensitivity: Low (2 retests)
Breakout Buffer %: 0.10 – 0.25
Use Vol Osc Filter: ON
Confluence:
Enable Confluence: ON
EMA Rule: Stack (strict)
Require SR Break Same Direction: ON (optional, strict)
RR:
RR Lines: ON
RR: 1:3
Trigger: Confluence
This usually reduces signals but can improve quality depending on ticker.
Example 4 — Conservative risk control (visual RR planning)
Goal: only take trades that offer clear RR
RR:
Show RR Lines: ON
RR: 1:2
Trigger: Confluence
Result: you only see RR targets when the entry is “higher confidence”.
Example 5 — Dashboards only when needed
Goal: keep chart clean, but enable quick stats occasionally
ORB UI:
Show ORB Dashboard: OFF normally
Show Backtest Dashboard: ON only during tuning
Positions: set to Top Right / Top Center as you prefer
Notes on alerts (how to use)
Your SR/EMA alerts are built-in alert() calls, so when creating an alert choose:
“Any alert() function call”
ORB/CONF alerts are alertcondition(), so create alerts selecting:
ORB Entry
ORB TP1
ORB SL
CONF Buy / CONF Sell
Educational Use Only: This script is provided for educational and informational purposes only and is not financial advice—use it at your own risk, as trading involves substantial risk of loss.

Daily & Weekly Levels (Sticky + Individual Alerts)🚀 Sticky Levels: PDH/PDL & Weekly High/Low
💡 Overview
This lightweight Pine Script v6 utility is designed for high-frequency traders and scalpers who require key Daily and Weekly levels without cluttering their price action. Optimized for speed and clarity, it ensures your most important S/R zones are always exactly where you need them.
🌟 Key Features
📌 Sticky Right Alignment – Labels are anchored to the right price scale using a customizable offset. They stay perfectly visible on mobile devices (Android/iOS) regardless of zoom level or scrolling.
⚡ Performance Optimized – Specifically built for low timeframes (15s, 1m, 5m). By using barstate.islast and tuple-based request.security calls, it ensures zero lag and minimal resource usage.
📅 Daily Levels – Instantly plot Previous Day High (PDH) and Previous Day Low (PDL).
🗓️ Weekly Levels – Monitor Previous Week High (PWH), Previous Week Low (PWL), and Current Weekly Open (WO).
🔔 Individual Alert Management – Granular control over notifications. You can manually enable/disable alerts for each specific level to avoid "alert fatigue."
💎 Clean Visuals – Uses elegant dashed lines and non-intrusive labels with an optional price display for pinpoint accuracy.
🛠️ How to Customize Your Setup
1. Visibility & Visuals
Toggle Levels: Turn each level on or off independently in the settings.
Label Offset: Adjust the "3cm" margin by changing the bar offset to fit your screen perfectly.
Price Toggle: Show or hide exact price values next to the labels.
2. Individual Alert Toggles In the settings menu, you will find a 🔔 icon next to each level. You can manually choose which specific levels should trigger a notification:
Enable PDH alerts for breakout trades.
Keep Weekly Open alerts off if you only use it as a visual bias.
Focus only on what matters for your strategy!
❓ Why use this script?
Standard horizontal lines often disappear when you scroll back in time or clutter the immediate price action on lower timeframes. This script solves that by keeping labels fixed at the right margin, providing a professional trading interface similar to high-end institutional platforms. Whether you are at your desk or trading on the go, your key levels remain clear and "sticky."
🚦 Quick Setup Guide
Add to Chart: Save the script and add it to your favorite symbols.
Configure: Open settings and check the "Alert" box for your desired levels.
Create Alert: Press Alt+A, set Condition to this indicator, and select "Any alert() function call".
Trade: Receive precise, non-spammy notifications directly to your phone or desktop.

S.O.F.T Channel & Trend Line // Alerts V1.4S.O.F.T Channel & Trend Line // Alerts V1.4
This indicator draws parallel channels (support & resistance) and trend lines based on time-anchored geometry.
You can add this indicator multiple times on the same chart to create as many channels and/or trend lines as needed, each one with its own settings and alerts.
This makes it suitable for multi-structure analysis (short, medium, and long-term levels).
It is designed to be reliable for alerts, with a strong focus on visual clarity and real trading usability.
Version V1.4 introduces a more practical Auto Channel system that always stays inside the visible chart area, along with smoother angle control and a clean Single Line mode.
🔑 Key Features
📐 Parallel price channel (support & resistance)
📈 Single trend line mode (support or resistance)
🧭 Auto Anchors (Visible Mode)
Point 2 = last chart bar
Point 1 = user-defined number of bars back
➡️ Lines extended into the future
🎚️ Fine vertical offset
📐 Micro-angle control (points per 1000 bars)
🔔 Alerts on line or channel touch
🎨 Dynamic coloring:
Channel → blue
Single Line → green (rising) / red (falling) / gray (flat)
⚠️ IMPORTANT – About Line Handles (Read Carefully)
TradingView automatically displays drag handles on drawn lines.
These handles are visual only in this script.
❗ Do NOT use the vertical anchor handles to move the lines.
Moving the line manually does NOT change:
Anchor points
Channel geometry
Alert trigger levels
Alerts are calculated only from the script inputs, not from manual dragging.
Using the handles may cause a visual mismatch between the line position and alert behavior.
✅ Correct way to adjust the channel or line:
Use the script parameters:
Auto Anchors (bars lookback)
Vertical Offset
Angle control
This guarantees visual and alert consistency.
🧠 Why This Design
This indicator prioritizes:
Stability over repainting
Predictable alerts
Time-based structure instead of bar-index dependencies
It works consistently on:
Indices (NASDAQ, S&P, DAX…)
Metals (XAUUSD, XAGUSD)
Forex
Crypto
And on all timeframes:
M15 / M30 / H1 and higher
🎯 Typical Use Cases
Trend-following channels
Dynamic support & resistance
Mean reversion zones
Alert-based discretionary trading
Clean market structure visualization
📝 Notes
Manual dragging of lines is not supported by design.
Alerts are non-repainting once the anchors are defined.
This script does not read TradingView drawing tools (platform limitation).
IMPORTANT:
Do not manually drag the line anchor handles.
Manual dragging is visual only and does not affect alert levels.
All adjustments must be done using the indicator settings.
S.O.F.T – Stéphane Olivier Fabrice Trading
Built for clarity, precision, and real trading conditions.

BTC 15m VWAP Structure Breakout [ALERT]BTC 15m VWAP Structure Breakout Strategy (Alert Only)
This strategy is designed for BTC on the 15-minute timeframe.
It focuses on identifying high-probability structural breakouts within an established trend, not predicting tops or bottoms.
The script is alert-only.
Entries are taken manually, based on confirmation after the alert.
🎯 Core Idea
The main question this strategy answers is:
“Is this breakout occurring with the trend,
or is it just a fake move inside a ranging market?”
To solve this, the strategy combines:
VWAP (institutional average price)
EMA20 (short-term trend filter)
Market structure breakout
📈 Indicators Used
VWAP (Volume Weighted Average Price)
Represents the market’s fair value and institutional bias.
EMA20
Defines short-term trend direction and momentum.
Structure High / Low (last 25 candles)
Identifies meaningful resistance and support levels.
🧭 Market Bias Filter
🔵 Bullish Bias (Long Setup Allowed)
Price closes above VWAP
EMA20 is rising (higher than 2 candles ago)
This confirms a valid bullish environment before looking for breakouts.
🔴 Bearish Bias (Short Setup Allowed)
Price closes below VWAP
EMA20 is falling (lower than 2 candles ago)
This confirms a valid bearish environment.
🚀 Breakout Signal Conditions
✅ Long Breakout Alert
A LONG alert is triggered when all conditions are met:
Bullish market bias
Price closes above EMA20
Price breaks above the previous 25-candle high
by at least 0.15%
➡️ This captures true continuation breakouts, not random spikes.
❌ Short Breakdown Alert
A SHORT alert is triggered when all conditions are met:
Bearish market bias
Price closes below EMA20
Price breaks below the previous 25-candle low
by at least 0.15%
➡️ This captures trend-aligned support breakdowns.
🔔 How to Use the Alerts (Important)
These alerts are NOT automatic entry signals.
When an alert fires, check:
Volume expansion
Breakout confirmation or pullback-and-reclaim
Higher-timeframe trend alignment
👉 Alert = “Market is ready, pay attention”
🧠 Best Market Conditions
✔ Trending BTC markets
✔ Breakout or expansion phases
✔ Works in all sessions (no session filter)
❌ Choppy or low-volatility ranging markets
👍 Who This Strategy Is For
Traders who can’t watch charts all day
Traders who want to reduce emotional entries
Traders who prefer probability and structure over prediction
Manual traders using alerts as decision triggers
📌 Final Thoughts
This strategy:
❌ does NOT try to catch bottoms or tops
✅ reacts only when structure confirms a real move
Let the market show strength first —
then decide how to trade it.

MACD Histogram Expansion Alerts (Scalp)Purpose: Alerts when MACD histogram is expanding (momentum increasing) rather than simply crossing. Designed for 1-minute scalping and intraday momentum confirmation.
This script is for traders who are tired of late MACD cross alerts.
Instead of firing when MACD lines cross (which often happens after the move), this indicator alerts when the MACD histogram is expanding — meaning momentum is actually increasing right now, not rolling over.
I use it as a “heads up” alert, not a buy/sell signal. When it fires, I check price action, volume, VWAP, support/resistance, etc., to see if the move is worth trading.
Best suited for 1-minute charts, scalping, and fast intraday momentum.
MACD Histogram Expansion Alerts (Scalp) is a lightweight alert-focused indicator designed for intraday traders and scalpers, particularly on lower timeframes such as the 1-minute chart.
Rather than triggering alerts on standard MACD line crossovers (which tend to lag in fast or volatile markets), this script detects MACD histogram expansion — a condition that indicates momentum acceleration, not just direction.
🔍 What this script does
Uses a fast MACD configuration suitable for lower timeframes
Monitors the MACD histogram slope and magnitude
Triggers alerts only when the histogram expands for multiple consecutive bars
Alerts are fired on bar close only, reducing noise and false intrabar signals
🚀 Why focus on histogram expansion?
Histogram expansion highlights when momentum is building, which can be useful for:
Continuation setups
Early momentum confirmation
Avoiding entries when momentum is already fading
This approach is especially helpful in small caps, news-driven stocks, and volatile intraday instruments, where traditional MACD cross alerts can arrive too late.
🔔 Alert Types
Bullish MACD Histogram Expansion
Bearish MACD Histogram Expansion
Each alert can be enabled independently and is intended as an attention signal, not a standalone trading system.
⚙️ Customizable Inputs
MACD Fast / Slow / Signal lengths
Number of consecutive expanding histogram bars required
Optional minimum histogram magnitude filter
Optional directional filter (above/below zero line)
⚠️ Important Notes!!!!
This script does not place trades
Alerts should be used with additional context, such as price action, volume, VWAP, or support/resistance
Not designed for higher-timeframe or swing trading use .
If you find this helpful, feel free to adapt it to your own trading style or timeframe. This script is meant to be simple, flexible, and non-opinionated.

Impulse Alert - Demand (Buy) [Fixed]🔵 Impulse Alert – Demand (Buy)
This indicator is designed to detect high-probability Demand Zones based on impulsive bullish price action, helping traders get alerted only when it matters most.
🧠 Core Logic:
Scans the chart for 2 consecutive bullish impulsive candles with significant range (body size)
Also captures single large bullish impulse candles that often mark institutional buying
Marks the origin of the move as a potential Demand Zone
Sends alerts when such bullish setups form, allowing you to monitor charts passively
⚙️ Features:
✅ Alerts on impulsive move formations
✅ Detects both 2-candle and single-candle impulses
✅ Custom zone detection logic based on pip size and momentum
✅ Cleaner & smarter: removes distractions and avoids false signals
📌 Best Used For:
Smart Money / Supply & Demand traders
Identifying potential institutional buy zones
Executing trades with HTF confluence
Traders who want to get alerted without screen-watching
🔁 Suggested Strategy:
Set HTF directional bias (H1, H4, D1)
Use this indicator on LTF (1M–15M) for impulsive bullish entries
Wait for price to return to the marked zone for low-risk entries
💡 Pro Tip: Combine with your Supply Zone (Sell) indicator to track both sides of market structure and increase R:R
👤 Created by: Rohit Jadhav | YT/Insta/X - @GrowthByTrading
📬 Want updates, enhancements, or personal versions? Leave feedback or reach out through profile!
Supertrend with Volume Filter AlertSupertrend with Volume Filter Alert - Indicator Overview
What is the Supertrend Indicator?
The Supertrend indicator is a popular trend-following tool used by traders to identify the direction of the market and potential entry/exit points. It is based on the Average True Range (ATR), which measures volatility, and plots a line on the chart that acts as a dynamic support or resistance level. When the price is above the Supertrend line, it signals an uptrend (bullish), and when the price is below, it indicates a downtrend (bearish). The indicator is particularly effective in trending markets but can generate false signals during choppy or sideways conditions.
How This Script Works
The "Supertrend with Volume Filter Alert" enhances the classic Supertrend indicator by adding a customizable volume filter to improve signal reliability.
Here's how it functions:
Supertrend Calculation:The Supertrend is calculated using the ATR over a user-defined period (default: 55) and a multiplier (default: 1.85). These parameters control the sensitivity of the indicator:A higher ATR period smooths out volatility, making the indicator less reactive to short-term price fluctuations.The multiplier determines the distance of the Supertrend line from the price, affecting how quickly it responds to trend changes.The script plots the Supertrend line in cyan for uptrends and red for downtrends, making it easy to visualize the market direction.
Volume Filter:A key feature of this script is the volume filter, which helps filter out false signals in choppy markets. The filter compares the current volume to the average volume over a lookback period (default: 20) and only triggers signals if the volume exceeds the average by a specified multiplier (default: 2.0).This ensures that trend changes are accompanied by significant market participation, increasing the likelihood of a genuine trend shift.
Signals and Alerts:
Buy signals (cyan triangle below the bar) are generated when the price crosses above the Supertrend line (indicating an uptrend) and the volume condition is met.Sell signals (red triangle above the bar) are generated when the price crosses below the Supertrend line (indicating a downtrend) and the volume condition is met.Alerts are set up for both buy and sell signals, notifying traders only when the volume filter confirms the trend change.
Customizable Settings for Multiple Markets
The default settings in this script (ATR Period: 55, ATR Multiplier: 1.85, Volume Lookback Period: 20, Volume Multiplier: 2.0) were carefully chosen to provide a balance of sensitivity and reliability across various markets, including stocks, indices (like the S&P 500), forex, and cryptocurrencies.
Here's why these settings work well:
ATR Period (55): A longer ATR period smooths out volatility, making the indicator less prone to whipsaws in volatile markets like crypto or forex, while still being responsive enough for trending markets like indices.
ATR Multiplier (1.85): This multiplier strikes a balance between capturing early trend changes and avoiding noise. A smaller multiplier would make the indicator too sensitive, while a larger one might miss early opportunities.
Volume Lookback Period (20): A 20-bar lookback for volume averaging provides a robust baseline for identifying significant volume spikes, adaptable to both short-term (e.g., daily charts) and longer-term (e.g., weekly charts) timeframes.
Volume Multiplier (2.0): Requiring volume to be at least 2x the average ensures that only high-conviction moves trigger signals, which is crucial for markets with varying liquidity levels.
These parameters are fully customizable, allowing traders to adjust the indicator to their specific market, timeframe, or trading style. For example, you might reduce the ATR period for faster-moving markets or increase the volume multiplier for more conservative signal filtering.
How the Volume Filter Reduces Bad Trades in Choppy Markets
One of the main drawbacks of the Supertrend indicator is its tendency to generate false signals during choppy or ranging markets, where price fluctuates without a clear trend. The volume filter in this script addresses this issue by ensuring that trend changes are backed by significant market activity:
In choppy markets, price movements often lack strong volume, leading to false breakouts or reversals. By requiring volume to be a multiple (default: 2x) of the average volume over the lookback period, the script filters out these low-volume, low-conviction moves.This reduces the likelihood of taking bad trades during sideways markets, as only trend changes with strong volume confirmation will trigger signals. For example, on a daily chart of the S&P 500, a buy signal will only fire if the price crosses above the Supertrend line and the volume on that day is at least twice the 20-day average, indicating genuine buying pressure.
Usage Tips
Markets and Timeframes: This indicator is versatile and can be used on various assets (stocks, indices, forex, crypto) and timeframes (1-minute, 1-hour, daily, etc.). Adjust the settings based on the market's volatility and your trading strategy.
Combine with Other Indicators: While the volume filter improves reliability, consider using additional indicators like RSI or MACD to confirm trends, especially in ranging markets.
Backtesting: Test the indicator on historical data for your chosen market to optimize the settings and ensure they align with your trading goals.
Alerts: Set up alerts for buy and sell signals to stay informed of high-probability trend changes without constantly monitoring the chart.
ConclusionThe "Supertrend with Volume Filter Alert" is a powerful tool for trend-following traders, combining the simplicity of the Supertrend indicator with a volume-based filter to enhance signal accuracy. Its customizable settings make it adaptable to multiple markets, while the volume filter helps reduce false signals in choppy conditions, allowing traders to focus on high-probability trades. Whether you're trading stocks, indices, forex, or crypto, this indicator can help you identify trends with greater confidence.

Volume AlertVolume increase alert: triggers an icon and alert when the current volume is X times greater than the previous one. The multiplier value can be adjusted as needed.
Português:
Alerta de aumento de volume: dispara um ícone e alerta quando o volume atual é X vezes maior que o anterior. O valor do multiplicador pode ser ajustado conforme sua necessidade.

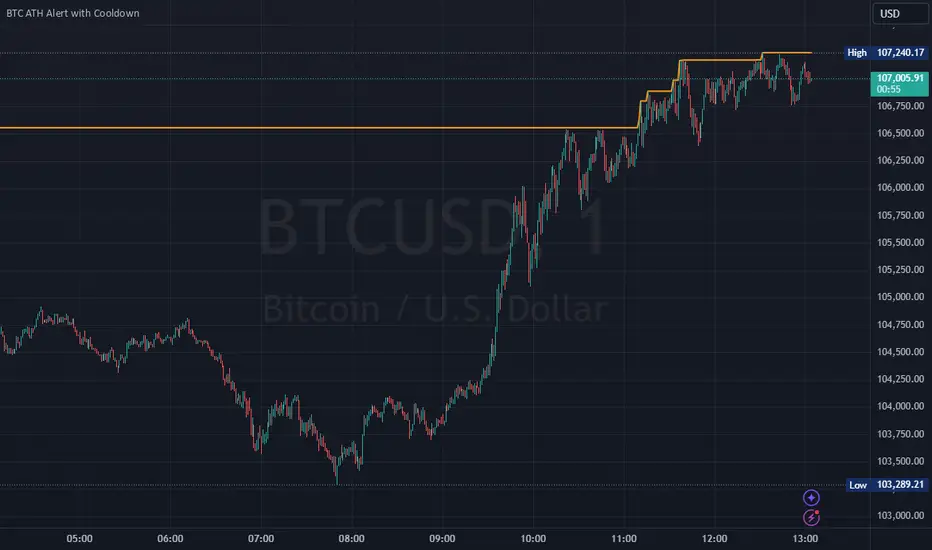
Bitcoin All-Time High (ATH) Alert with Cooldown₿ Bitcoin All-Time High (ATH) Alert with Cooldown 🚀👩🚀
🔍 What it does:
This indicator tracks new all-time highs (ATHs) and alerts you when Bitcoin (or any asset) reaches a fresh ATH, while avoiding alert spam with a customizable cooldown period.
✨ Key Features
✅ Alerts for New ATHs: Never miss when Bitcoin makes history!
✅ Cooldown Period: Prevents multiple alerts within a short timeframe (customizable in settings).
✅ ATH Line on Chart: A clear, visual line marking the all-time high price.
✅ Manual Reset Option: Reset the ATH for testing or specific chart conditions.
⚙️ How to Use
Add the Indicator: Apply it to your chart like any other indicator. Ideally on a small time frame, the cooldown is 20 bars by default (adjustable) which gives 20 minutes on the 1 min chart.
Customize Settings:
- Cooldown Period (bars): Set the number of bars to wait before triggering another alert (e.g., 20 bars).
- Show All-Time High Line: Toggle to display or hide the ATH line visually.
- Reset All-Time High: Use this to manually reset the ATH to the current bar's high.
Create an Alert:
Open the "Alerts" menu.
Select the condition: "New All-Time High" .
Choose a trigger type:
Once Per Bar: For immediate alerts when a new ATH occurs.
Once Per Bar Close: To confirm the ATH at the end of each bar.
🛠️ Who is it for?
Traders and HODLers who want to stay on top of price action.
Anyone looking for clean and efficient ATH tracking with no redundant alerts
🚀 Never miss a new ATH again. Stay ahead of the market!
Perfect Hammer Pattern Indicators and Alerts# Perfect Hammer Pattern Indicators and Alerts
This indicator identifies a specific and precise hammer candlestick pattern formation that can signal potential trend reversals or continuation setups. Unlike traditional hammer pattern indicators, this script focuses on exact wick measurements to identify high-probability trade setups.
## Pattern Specifications
### Bullish Setup Requirements
- Two consecutive green (bullish) candles
- Both candles must have NO lower wick (perfect bottom)
- Both candles must have an upper wick (showing buying pressure)
- Previous candle must be red (bearish) for context
- Marked with a green 'H' below the pattern
### Bearish Setup Requirements
- Two consecutive red (bearish) candles
- Both candles must have NO upper wick (perfect top)
- Both candles must have a lower wick (showing selling pressure)
- Previous candle must be green (bullish) for context
- Marked with a red 'H' above the pattern
## Trading Logic
This pattern is particularly effective because it shows clear control by either buyers (bullish pattern) or sellers (bearish pattern):
- In the bullish pattern, the absence of lower wicks indicates strong buying pressure preventing prices from falling below the open, while the upper wicks show profit-taking at highs
- In the bearish pattern, the absence of upper wicks shows strong selling pressure capping any upward movement, while the lower wicks indicate some buying support below
## Alerts
The indicator includes two alert conditions:
1. Bullish Pattern Alert: Triggers when two perfect bullish hammers appear after a bearish candle
2. Bearish Pattern Alert: Triggers when two perfect bearish hammers appear after a bullish candle
## Usage Tips
- Best used on timeframes 15 minutes and above
- Consider using in conjunction with key support/resistance levels
- Volume confirmation can increase pattern reliability
- The pattern may signal either trend continuation or reversal - always consider the larger market context
## Notes
- This indicator focuses on precise hammer formations rather than approximate patterns
- The requirement for consecutive perfect hammers makes this a relatively rare but high-probability setup
- Visual markers ('H') provide easy pattern identification on charts

Argo II - (alerts for 3commas composite bots) - publicThis script lets users create BUY/SELL alerts for 3commas composite bots (1 alert = 12 pairs) in a simple way, based on a built in set of indicators that can be tweaked to work together or alone through the study settings.
There is a version of this script for single pair bots, with slightly more features here .
If the user choses to create both BUY and SELL signals from the study settings, the (1) alert created will send both BUY and SELL signals for all 12 pairs selected. At this stage, the script forces the user to select 12 pairs in the study settings. If less pairs are inserted, it will not work. Also, the script will only send alerts for the pairs selected in the study settings, not for the current chart (if different).
How to use:
- Add the script to the current chart
- Open the study settings , insert bot details and select 12 pairs. You should write the pairs manually, using the format BTC , ADA, ETH, etc. They MUST be in capital letters or 3commas will not recognize them.
- Still in the study settings, tweak the deal start/close conditions from various indicators until happy. The study will plot the entry / exit points below the current chart (1 = buy, 2 = sell)
- Make sure your strategy works for all the pairs you have selected, simply by checking each chart with the same study settings
- When happy, right click on the "..." next to the study name, then "Add alert'".
- Under "Condition", on the second line, chose "Any alert () function call". Add the webhook from 3commas, give it a name, and "create".
That's it.
Notes:
- If you insert coins that are not available for the quote currency and exchange of your choosing, the script will not work and return an error.
- Make sure you run tests with paper trading or dummy bots (i.e without actual bot ID) to ensure your alerts trigger as intended on all coins.
- If alerts trigger too much (i.e they all trigger at the same time for all coins), Trading View will stop the alert. So probably not ideal for a scalping bot. It could also be the sign the script doesn't work as intended.
- The script is a bit slow on my side. I am a beginner in pinescript, so if anyone knows how to simplify it, please let me know.
- if anyone knows how to tell the script to function with less than 12 pairs (when not filling the 12 fields in the setting), please also let me know :)
EMA CrossoversUseful for identifying and receiving alerts about uptrends and downtrends.
This script uses two Exponential Moving Averages (EMAs) to find price uptrends and downtrends. An Exponential Moving Average (EMA) is a type of moving average that places a greater weight and significance on the most recent data points. The script produces uptrend and downtrend signals based on crossovers and divergences between the two EMAs, the user will be able to spot a trend change (when the EMAs crossover) and to determine the strength of the current trend (when the EMAs diverge). It is also posible to get alerts for uptrends and downtrends on the web and mobile app with sound and pop-ups as well as via email. The optimal time to enter and exit the market can be concluded from this trend changes.
The user can set their own EMAs, by default they are set to 21 and 55 periods for medium and long term respectively. When the medium term EMA crosses below the long term EMA the asset is in a downtrend and the price will decline, and when the medium term EMA crosses above the long term EMA the asset is in an uptrend and price will increase.
This scripts plots the following indicators and signals on the chart to help the user to identify trends:
1.- Medium and long term EMAs as lines overlaid on the price chart.
2.- Up green triangles above bars when the price is on an uptrend and down red triangles below bars when the price is on a downtrend.
3.- Arrows with text to indicate the start of an uptrend or downtrend.
The user can enable and disable the indicators and signals as well as set colors and shapes to their liking.
This script also lets the user create alerts for uptrends and downtrends. To create a new alert using this script follow this instructions:
1.- Once you added this script to your chart, go to the alerts panel (right on web or bottom tool bar on the mobile app) and add a new alert (alarm clock icon with a plus sign).
2.- A modal window will open. On the “Condition” dropdown menu select “EMA Crossovers”.
3.- On the next dropdown menu (right below the “Condition” one) you can select from two types of alerts “Uptrend started” and “Downtrend started”.
4.- Lastly you can set all the normal alert options and create the alert.
