RSI Multi Length With Divergence Alert [Skiploss]This is a modified indicator base code from RSI Multi Length and we will add some of functions by finding a classic/hidden divergence and alert.
The indicator returns information over RSI using multiple periods and calculates the percentage of overbought and oversold by overbought divided by oversold.
To find the divergence and hidden divergence we use base code from platform (Divergence Indicator) but change the input from normal to the average (RSI Multi Length).
RSI Settings
Maximum Length is maximum period.
Minimum Length is minimum period.
Overbought Level is value of the overbought level .
Oversold Level is value of the oversold level.
Source is input source of the indicator.
Divergence Settings
Pivot Right is value look back to the right side.
Pivot Left is value look back to the left side.
Max Range is maximum range value.
Min Range is minimum range value.
Alert Settings
It will be part of display of Divergence and Hidden Divergence.
Style Settings
Color of overbought/oversold/Bullish/Bearish which you can change as you wish.
Cerca negli script per "alert"

STD Stepped Ehlers Optimal Tracking Filter MTF w/ Alerts [Loxx]STD Stepped Ehlers Optimal Tracking Filter MTF w/ Alerts is the traditional Ehlers Optimal Tracking Filter but with stepped price levels, access to multiple time frames, and alerts.
What is Ehlers Optimal Tracking Filter?
From "OPTIMAL TRACKING FILTERS" by John Ehlers:
"Dr. R.E. Kalman introduced his concept of optimum estimation in 1960. Since that time, his technique has proven to be a powerful and practical tool. The approach is particularly well suited for optimizing the performance of modern terrestrial and space navigation systems. Many traders not directly involved in system analysis have heard about Kalman filtering and have expressed an interest in learning more about it for market applications. Although attempts have been made to provide simple, intuitive explanations, none has been completely successful. Almost without exception, descriptions have become mired in the jargon and state-space notation of the “cult”.
Surprisingly, in spite of the obscure-looking mathematics (the most impenetrable of which can be found in Dr. Kalman’s original paper), Kalman filtering is a fairly direct and simple concept. In the spirit of being pragmatic, we will not deal with the full-blown matrix equations in this description and we will be less than rigorous in the application to trading. Rigorous application requires knowledge of the probability distributions of the statistics. Nonetheless we end with practically useful results. We will depart from the classical approach by working backwards from Exponential Moving Averages. In this process, we introduce a way to create a nearly zero lag moving average. From there, we will use the concept of a Tracking Index that optimizes the filter tracking for the given uncertainty in price movement and the uncertainty in our ability to measure it."
Included:
-Standard deviation stepping filter, price is required to exceed XX deviations before the moving average line shifts direction
-Selection of filtering based on source price, the moving average, or both; you can also set the Filter deviations to 0 for no filtering at all
-Toggle on/off bar coloring
-Toggle on/off signals
-Long/Short alerts

Any 8 Moving Averages - Alerts, Clouds & PercentagesANY 8 MOVING AVERAGES WITH ALERTS, COLOR CHANGING CLOUDS AND PERCENTAGE GAPS
This is a fully customizable moving average cloud with alerts. It has 8 moving averages that can be individually set to any type such as: EMA, SMA, HMA, WMA, VWMA & RMA. Each moving average paints green when price is above it and paints red when price is below it. They include colored clouds between the price and each moving average as well.
You can individually change the length, colors, type of moving average and turn them off for those of you that only want a few moving averages on your chart at once.
There is also a percentage gap table that tells you how far away the price is from each moving average which are labeled accordingly.
You can also set alerts for when price crosses each moving average.
***HOW TO USE***
When all the moving averages are green, buy dips down to the next lower moving average. When all the moving averages are red, short the tops up to the next moving average.
Trade in the direction of the trend and wait for all lines to turn one color before taking trades in that direction.
Make sure there is a big enough percentage gap to the next moving average before taking a trade.
***MARKETS***
This indicator can be used as a signal on all markets, including stocks, crypto, futures and forex.
***TIMEFRAMES***
This moving average can be used on all timeframes.
***TIPS***
Try using numerous indicators of ours on your chart so you can instantly see the bullish or bearish trend of multiple indicators in real time without having to analyze the data. Some of our favorites are our Auto Fibonacci, Directional Movement Index + Fisher Price Action, Volume Profile With Buy & Sell Pressure, Auto Support And Resistance and Money Flow Index in combination with this moving average cloud. They all have unique features to help you make better and faster trading decisions.

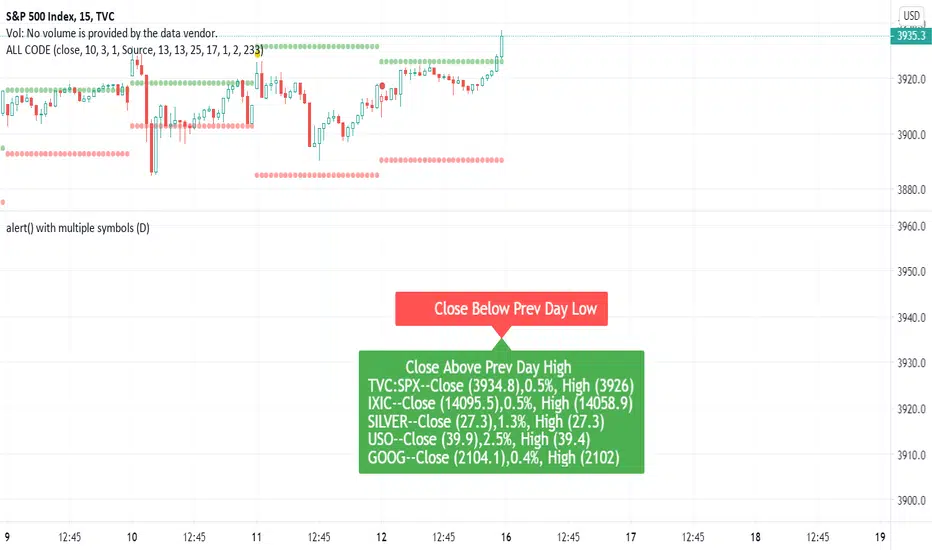
Dynamic Messages & Easy Screener1. Dynamic Message alerts with a Screener function
2. labels are generated using array strings making it easier to customize
3. Alert messages have well defined output with data variables
4. Traders with limited Pine knowledge can also plugin their functions
5. Closely track the alerts with Easy Screener
6. Attach it to the desired chart for alert periodicity and set resolution to the indicator setup
7. OHLC values for scanned securities also extracted for ready use in any indicator or study
Happy Trading and rest your sore eyes with Easy Screener!!
Enjoy TV on the GO!
[BMAX] Moving Average Cross Alert(ENGLISH)
This indicator helps user to create an alert to monitor when a bar closes crossing a moving average, upwards or downwards.
(PORTUGUÊS)
Este indicador ajuda o usuário a criar alertas para monitorar quando um candle fecha em cruzamento com uma média móvel, acima ou abaixo.

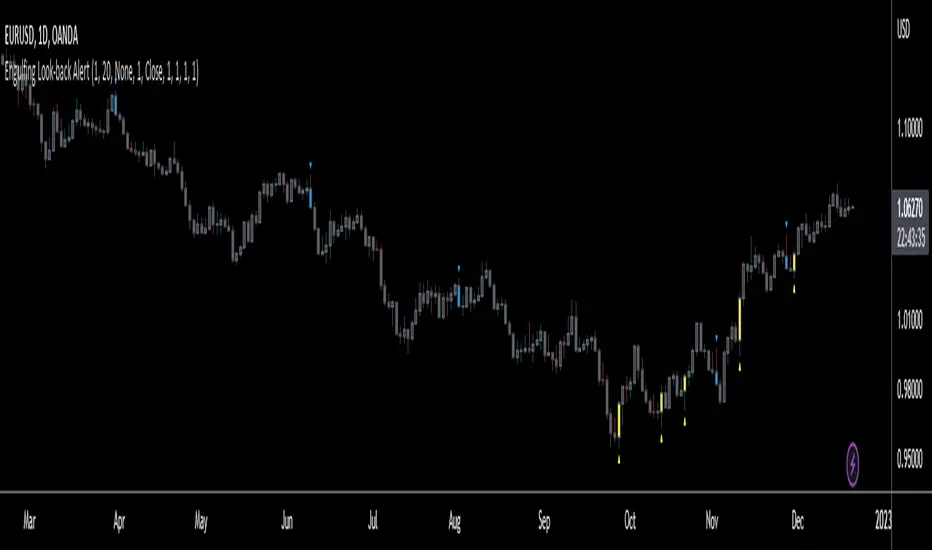
Engulfing Look-back AlertThis script is an extension of the classical engulf pattern with added rules and user defined features.
Engulfing Candle Definition:
- Bullish Engulfing: Trade BELOW the prior candle's LOW and CLOSE ABOVE the prior candle's HIGH. Previous candle can be an up (bullish) or a down (bearish) candle
- Bearish Engulfing: Trade ABOVE the prior candle’s HIGH and CLOSE BELOW the prior candle’s LOW. Previous candle can be an up (bullish) or a down (bearish) candle
Features:
- Set the look-back period for engulfing candle high and low -> default = 1; e.g. Did the bullish eng candle trade below the lows of the last 3 candles and trade above the highs of the last 4 candles? Set the input values accordingly
- Choose time frame(s) engulfing candle is to be displayed on -> default = M/W/D/4H/1H/15M
- Ability to enable Alerts (includes time frame alert was triggered on): IMPORTANT - when setting alerts ensure to choose "ONCE PER BAR"; otherwise alerts will NOT trigger as intended
prntscr.com
Technical Analysis - Binary Option AlertA. Oscillators & B. Moving Averages base on TradingView's Technical Analysis by ThiagoSchmitz
C.Pivot base on Ultimate Pivot Points Alerts by elbartt
D. Summary & Alert by anhnguyen14
Binary Option Alert base on my indicator: Technical Analysis - Panel Info
Put alert = Srong Sell + close>open
Call alert = Strong buy + close

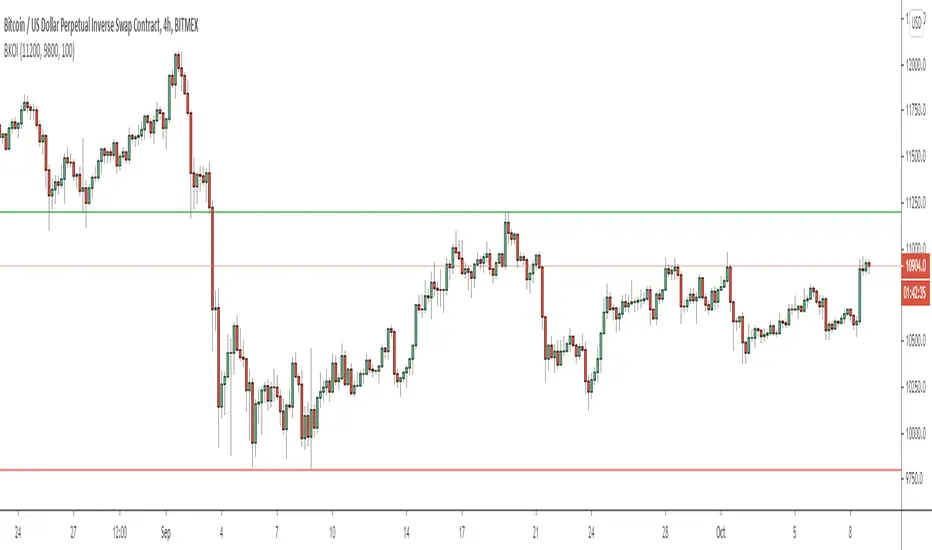
Hancock - Pump Catcher [BitMEX] [Alerts]This is a study to the version of the strategy found here .
It generates 3 alerts:
CLOSE - Triggers to close all open positions
LONG - Triggers to open a long position
SHORT - Triggers to open a short position
Commands for alerts (without stop-loss) to get you started:
CLOSE - a=bitmex e=bitmextestnet c=position t=market
LONG - a=bitmex e=bitmextestnet b=long s=xbtusd l=5 q=99% t=market
SHORT - a=bitmex e=bitmextestnet b=short s=xbtusd l=5 q=99% t=market
I would advise including a stop-loss with your commands. These commands are for autoview and don't include a stop loss, use autoview command documentation to add stop-loss.
Happy trading
Hancock

Ichimoku 2 sets of settings, markers and alertsThis is my take on the masterful, beautiful and powerful Ichimoku.
It comes with:
- 2 sets of settings you can flip between,
- 5 types of markers:
--- Tenkan/Kijun crosses,
--- Price (close)/Tenkan crosses, with the option of only showing those occurring with the trend, so on pullbacks,
--- Price (close) exits out of the Kumo,
--- Chikou exits out of the Kumo,
--- Overbought/Oversold conditions (shown on the chart).
- Choice of showing only long or short markers,
- Coloring of bars using OB/OS conditions,
- Alerts on all markers and on combinations.
The markers are intended as indications—not bulletproof buy/sell signals.
The overbought/oversold conditions are detected when the high/low is a multiple of ATR away from Kijun. The ATR length and multiple used are configurable.
I normally use the Josh Olszewicz (CarpeNoctom) big settings, so those are the default.
I prefer subtle coloring on charts and my choice of colors reflects that.
You will see references to KumoA and KumoB in the names of inputs and style elements. For me, KumoA is the top of the Kumo when it is bullish, so the bottom when bearish.
As usual when creating alerts, be sure you already have defined proper inputs and that you are on the intended interval, as they will be used when triggering alerts.

Breakout IndicatorThis script allows you to set breakout alerts.
An alert will be triggered only when price breaks and closes beyond the specified prices. You will get an alert on the first candle that closes beyond the levels you set.
WaveTrend with Crosses and Alerts - Jab ZootaLazy bear created this script. I added alertconditions to send alerts on crossovers.

CM_Ultimate_MA_MTF_V2 with Alert Long and Short Hello All,
Here is a scirpt of ChrisMoody modified with the alerts of purchases and sales.
I just have a problem with automation. At the bottom of my script my alerts "Buy1" and "Sell2" give alerts constantly and I wish to have a single alert before the order is completed. Before "Sell1" or Buy2 ".
I found the function "barstate.isfirst" that could possibly work?
Does anyone have an idea ? :)

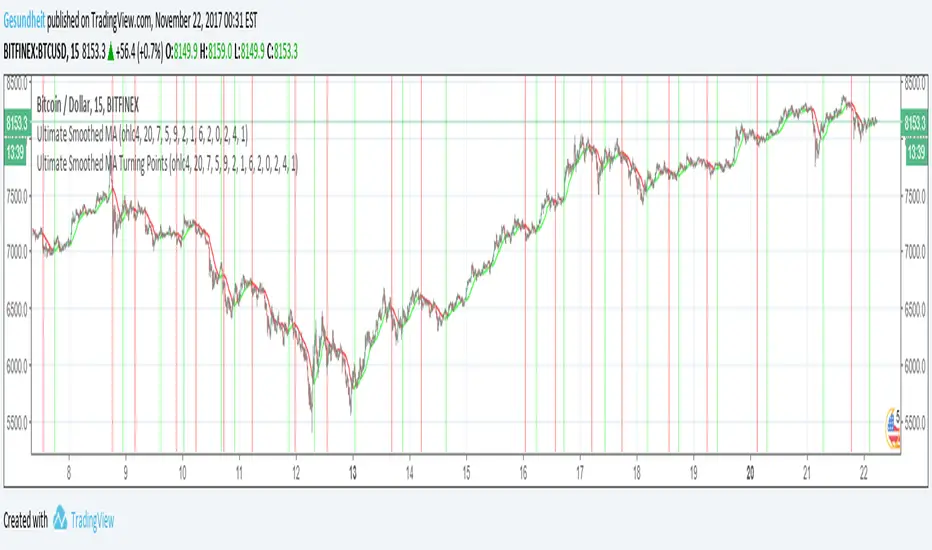
Ultimate Smoothed MA Turning PointsCompanion script to "Ultimate Smoothed MA" , details in that description.
Adapted from Chris Moody's "Ultimate Moving Average-Multi-TimeFrame-7 MA Types"
If you'd like to receive alerts on turning points, the conditions in line 96 and 97 can be used for alertcondition.
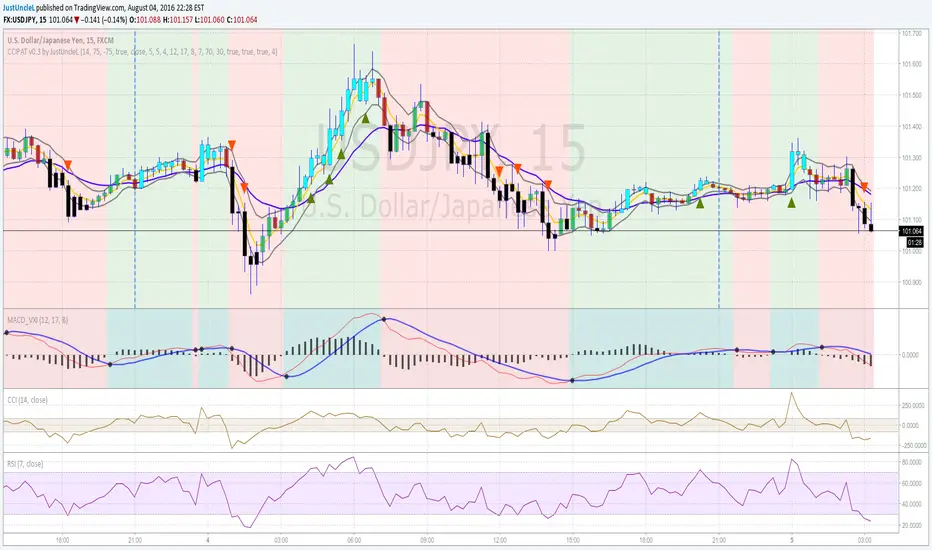
Price Action Trading System v0.3 by JustUncleLThis is an updated and improved version of my "Price Action Trading strategy". I have added two extra optional filters, one is a trend direction filter based on the MACD slow EMA(17), blue line, and the other is a RSI(7) filter which works similarly to CCI(14) but slightly different dynamics (thank you to gianfranco60 for the suggestion). Also made a couple of corrections:
- input for lenLower minval=1 should be maxval=-1
- one bar pullback did not reset trigger, missing some alerts
Some Notes about usage:
- this is an alert indicator not a signal generator, each alert is a strong trend continuance candidate,
but should be treated on it's own merits by looking at chart dynamics and market conditions.
- will work well on trending markets only.
- works best on the first alert after MACD cross over.
- don't take trades when MACD and signal are close together.
- don't trade when channel and slow MA are flat or close together or
chopper (yellow and blue MA cross over quickly over short period).
[AutoView] Trailing Stop Back Testing and alerts + TP and TSThe number one request since the creation of autoview was to have alerts triggered for Take Profit, Stop Loss and Trailing Stops. Finally, we've figured it out, and as an additional bonus, this allows us to back test trailing stops in the strategy tester.
YouTube Video about this script and setup: bit.ly
This script contains 2 things people have been asking for, multiple time frames and of course, a trailing stop that can be both back tested and setup for alerts.
This strategy itself seems to perform better without the use of the Trailing Stop, so play around and monitor it before actually trying to trade it live.
View all the trades being tracked in a Google Sheets here: bit.ly
To learn more about back testing strategies, automation and AutoView join our free slack group via slack.crypto.pink
Referral Tax:
This requires 4 alerts, so you are going to have to upgrade to PRO. It'd be greatly appreciated if you signed up using our referral link.
bit.ly
1Broker
bit.ly
okcoin
bit.ly

15m FVG Alerts with Timezone and time selectorThis indicator will help you detect 15m FVGs on NQ. After setting the alert, you can check the chart to see if the FVG aligns with the Bias. This way, when the price reenters this FVG, we can check the LTF for an IFVG that aligns with the Bias. If you find this FVG interesting, set a manual alert on the FVG again, let the price return, and see if you can initiate a continuation trade towards the clear DOL.
You can also specify a time window for the alerts to arrive.
This indicator is for "NQ1!"

Multi-VWAP Pro (HP) + Alerts - par alphaomega18Multi-VWAP Pro High-Precision (D/W/M) – by alphaomega18
🚀 Overview
Elevate your institutional analysis with the Multi-VWAP Pro High-Precision, a comprehensive tool designed for traders who demand surgical accuracy.
Most standard VWAP indicators lag or shift when changing timeframes. This script solves that by using a 1-minute data polling engine (request.security), ensuring your Daily, Weekly, and Monthly levels remain rock-solid and accurate, whether you are on a 1m, 15m, or 1h chart.
💎 Key Features
High-Precision Engine: Calculation based on 1-minute intraday data for maximum mathematical accuracy.
Multi-Timeframe Anchors: View Daily, Weekly, and Monthly VWAPs simultaneously.
Dynamic Color Logic: The Daily VWAP turns Green when the price is above and Red when below for instant trend bias.
Triple SD Bands: 3 fully customizable Standard Deviation bands for each timeframe to identify exhaustion zones.
Smart Alerts: Fully programmable notifications for price crosses on all levels.
Clean Labels: Real-time labels on the price scale for a professional, organized look.
📈 Trading Strategy: The Power of Confluence
Using three different VWAP anchors allows you to see the market through multiple lenses. Here is how to use this tool:
1. The Institutional Confluence
The strongest setups occur when two or more VWAP lines overlap.
The Setup: If the Daily VWAP clusters with the Weekly VWAP, it creates a "Hard Floor/Ceiling."
The Trade: Look for high-probability bounces in these zones where institutions defend their average price.
2. Mean Reversion with SD3 Bands
The 3rd Standard Deviation (SD3) represents price extremes.
The Trade: When price pierces a Daily SD3, look for a reversal back toward the VWAP (Mean Reversion), especially if it aligns with a Weekly or Monthly SD2 band.
3. Trend Confirmation
Bullish Bias: If the Daily VWAP is Green, prioritize "Buy the Dip" on lower SD bands.
Bearish Bias: If the Daily VWAP is Red, prioritize "Sell the Rip" on upper SD bands.
💡 Pro Tip for my Followers
"Alignment is king. When the Daily, Weekly, and Monthly VWAPs all slope in the same direction, you have a high-conviction trend. Follow me for more high-precision tools and market insights!"
🛠 Settings & Customization
Visibility: Toggle any VWAP or SD band on/off.
Full Color Control: Pick your own colors for Weekly and Monthly lines.
Adjustable Multipliers: Fine-tune the volatility bands (SD1, SD2, SD3) for any asset.

SMT + CVD (NQ vs ES) w/ AlertsSMT + CVD (NQ vs ES) w/ Alerts
This tool combines Smart Money Technique (SMT) and Cumulative Volume Delta (CVD) to highlight high-probability inflection points on NQ (primary) versus ES (secondary).
How it works
SMT condition: the primary breaks its most recent swing (High for bearish / Low for bullish) while the secondary does not break the corresponding swing within a small retest window.
CVD confirmation: at the same time, the primary’s CVD shows divergence (higher price but lower/equal CVD for shorts, lower price but higher/equal CVD for longs).
When both align, the script plots a marker/label and draws a line from the primary swing to the signal bar. Alerts are fired.
Signals & Alerts
Labels: “SMT+CVD DOWN/UP” on the signal bar.
Lines: connects the primary swing → signal bar so you can see the structure that produced the signal.
Alert names: “SMT+CVD Bearish” and “SMT+CVD Bullish.”
Inputs
Primary / Secondary symbols: defaults NQ & ES (you can change them).
Resolution: use chart timeframe or specify one.
Swing Left/Right Bars: pivot detection depth (higher = larger swings).
Break Window Bars: how many bars the secondary has to not break for SMT to be valid.
CVD Up/Down By: Close vs Previous Close (default) or Close vs Open.
Anchor CVD Daily: resets CVD at session/day start.
CVD Smoothing (EMA): smooths the CVD line (optional show).
FAST Pivots (no future bars): left-only swing detection so signals appear sooner and behave well in Replay/live.
Require Secondary Pivot: if ON, SMT checks wait for a confirmed secondary swing; if OFF, signals can appear while the secondary swing is still forming (useful for Replay/testing).
Show CVD line: optional, may compress price scale.
Non-repaint notes
With FAST Pivots ON, swings are detected with no future bars (minimal latency = leftBars).
With FAST Pivots OFF, standard pivots require rightBars future bars to confirm the swing (classic, but naturally delayed).
Tips
For intraday futures, keep leftBars/rightBars small (e.g., 3/3) and Break Window 1–3.
In Replay, enable FAST Pivots and consider disabling Require Secondary Pivot if you want signals to appear as soon as the primary breaks.
Combine with session filters, execution rules, or liquidity zones for context.

Price Above PDH - Complete Multi-Confirmation Alert
Cashapp $jmoskyhigh
Initial Breakout: Must have ALL confirmations to even start counting
During Hold Period: If ANY confirmation fails at ANY bar, the counter RESETS to zero
Must Re-qualify: If confirmations fail, must cross PDH again with all confirmations to restart
Alert Only Fires: When ALL confirmations are continuously met for the ENTIRE hold period
3. Visual Feedback:
Green background: Above PDH + ALL confirmations present
Red background: Above PDH but MISSING one or more confirmations
Red X above bar: Shows when a confirmation is lost during breakout (counter resets)
Green triangle with "✓ ALL": Alert triggered after full confirmation period
4. Example Scenario:
Scenario 1 - SUCCESS:
Bar 1: Price crosses PDH, Volume spike, MA bullish, Above VWAP → Counter = 1
Bar 2: Still above PDH, ALL confirmations still met → Counter = 2
Bar 3: Still above PDH, ALL confirmations still met → Counter = 3
Bar 4: Still above PDH, ALL confirmations still met → Counter = 4
Bar 5: Still above PDH, ALL confirmations still met → Counter = 5 → ALERT!
Scenario 2 - FAILURE (resets):
Bar 1: Price crosses PDH, Volume spike, MA bullish, Above VWAP → Counter = 1
Bar 2: Still above PDH, ALL confirmations still met → Counter = 2
Bar 3: Still above PDH, but volume drops below threshold → RESET Counter = 0
Bar 4: Still above PDH, ALL confirmations back → Counter = 1 (starts over)
5. Info Panel:
Shows which specific confirmations are failing
"OFF" displayed for disabled confirmations
Big "ALL CONFIRMED" row shows overall status
Warning message if confirmations are lost during breakout
This ensures you only get alerts when the setup is truly strong with ALL confirmations maintained throughout the entire hold period! 🎯

Ichimoku Cloud Indicator [TradingFinder] Kinko Hyo Cross Alerts🔵 Introduction
The Ichimoku Cloud (Ichimoku Kinko Hyo) is one of the most powerful and complete trading indicators in technical analysis. Originally developed by Japanese journalist Goichi Hosoda, the Ichimoku system combines multiple tools in one indicator, providing traders with instant insights into trend direction, support and resistance levels, and momentum. Unlike simple moving averages (SMA – Simple Moving Average), the Ichimoku Cloud (Kumo – Cloud) integrates dynamic elements that help traders forecast potential price action with greater clarity.
The Ichimoku Indicator (Ichimoku Signal System) is widely used across global markets, from Forex trading (FX – Foreign Exchange) to stocks, indices, and even cryptocurrencies. Its popularity comes from its ability to generate clear buy signals and sell signals based on the interaction of its components: Tenkan Sen (Conversion Line), Kijun Sen (Base Line), Senkou Span A, Senkou Span B, and Chikou Span (Lagging Line). When combined, these lines create the Ichimoku Cloud, which visually represents the balance between price action and market structure.
Ichimoku Cloud Lines Formulas :
Conversion Line (Tenkan Sen / Conversion Line) : Average of the highest high and lowest low over the past 9 periods => (9-PH + 9-PL) ÷ 2
Base Line (Kijun Sen / Base Line) : Average of the highest high and lowest low over the past 26 periods => (26-PH + 26-PL) ÷ 2
Leading Span A (Senkou Span A / Leading Span A) : Average of the Conversion Line and Base Line, plotted 26 periods ahead => (Tenkan Sen + Kijun Sen) ÷ 2
Leading Span B (Senkou Span B / Leading Span B) : Average of the highest high and lowest low over the past 52 periods, plotted 26 periods ahead => (52-PH + 52-PL) ÷ 2
Lagging Span (Chikou Span / Lagging Span) : Current closing price, plotted 26 periods behind.
One of the biggest advantages of the Ichimoku Trading Strategy (Ichimoku Cloud Trading System) is that it allows traders to identify the market condition at a glance. When the price is above the Kumo (Cloud), it indicates a bullish trend (uptrend). When the price is below the Kumo, the market is in a bearish trend (downtrend). And when the price is inside the cloud, the market is ranging (sideways trend). This simplicity and visual clarity make Ichimoku an essential indicator for both beginner traders and professional analysts.
The Ichimoku Cloud Indicator (Ichimoku Technical Analysis Tool) continues to be one of the most reliable charting methods. Traders often consider it superior to basic moving averages (MA – Moving Average) or exponential moving averages (EMA – Exponential Moving Average), because it not only shows trend direction but also highlights potential future support and resistance levels. With its unique combination of trend analysis, price forecasting, and trading signals, Ichimoku remains a core strategy in modern trading systems.
🔵 How to Use
The Ichimoku Cloud is more than just a set of lines; it’s a complete trading system that helps traders identify trends, momentum, and key support and resistance levels. By combining its five lines Conversion Line, Base Line, Leading Span A, Leading Span B, and Lagging Span traders can develop clear buy and sell strategies.
🟣 Identifying Trend Direction
Bullish Trend (Uptrend) : Price is above the cloud (Kumo), and the cloud is green. Leading Span A is above Leading Span B, signaling strong upward momentum.
Bearish Trend (Downtrend) : Price is below the cloud, and the cloud is red. Leading Span A is below Leading Span B, confirming a downward momentum.
Ranging / Sideways Market : Price is inside the cloud, indicating indecision and consolidation. Traders often avoid opening strong positions during these periods.
🟣 Buy Strategies
Conversion/Base Line Crossover : A buy signal occurs when the Conversion Line (Tenkan Sen) crosses above the Base Line (Kijun Sen). The signal is strongest when this crossover happens above the cloud.
Price Above Base Line : If the price moves above the Base Line while in an uptrend, it confirms bullish momentum and provides a favorable entry point.
Cloud Support Pullback : During a pullback in an uptrend, the price may touch or slightly enter the cloud. Traders can use the cloud as a dynamic support zone for buying opportunities.
Lagging Span Confirmation : Ensure the Lagging Span (Chikou Span) is above the price of 26 periods ago to confirm the strength of the bullish trend.
🟣 Sell Strategies
Conversion/Base Line Crossover : A sell signal is generated when the Conversion Line (Tenkan Sen) crosses below the Base Line (Kijun Sen). This signal is strongest when it occurs below the cloud.
Price Below Base Line : If the price falls below the Base Line in a downtrend, it confirms bearish momentum and strengthens the sell setup.
Cloud Resistance Pullback : During a bounce in a downtrend, the cloud acts as a resistance zone. Traders can enter sell positions when price approaches or touches the cloud from below.
Lagging Span Confirmation : The Lagging Span should be below the price of 26 periods ago, confirming downward momentum.
🟣 Cloud Breakout Signals
A strong buy occurs when the price breaks above the cloud from below, signaling a potential trend reversal.
A strong sell occurs when the price breaks below the cloud from above, indicating a shift toward a bearish trend.
🟣 Combining Signals for Stronger Entries
For higher probability trades, combine multiple signals : trend direction (cloud color and position), crossovers (Tenkan/Kijun), and Lagging Span position.
Avoid trading against the overall trend. For example, avoid buying when price is below a red cloud or selling when price is above a green cloud.
🔵 Setting
Tenkan Sen Period : Lookback period for Conversion Line (default: 9).
Kijun Sen Period : Lookback period for Base Line (default: 26).
Span B Period : Lookback period for Leading Span B, forms one Cloud boundary (default: 52).
Shift Lines : Periods forward for Cloud / backward for Lagging Span (default: 26).
Cross Tenkan/Kijun Alert : Alert on Conversion/Base Line crossover.
Cross Price/Tenkan Alert : Alert when price crosses Tenkan Sen.
Cross Price/Kijun Alert : Alert when price crosses Kijun Sen
🔵 Conclusion
The Ichimoku Cloud (Ichimoku Kinko Hyo) is much more than a simple indicator it is a complete trading system that combines trend detection, momentum analysis, and support/resistance identification in one view. By interpreting the position of price relative to the cloud, the interaction between Tenkan Sen (Conversion Line) and Kijun Sen (Base Line), the leading spans (Senkou Span A and B), and the Chikou Span (Lagging Line), traders can identify potential buy and sell opportunities with higher confidence.
The main advantage of the Ichimoku Cloud is its ability to provide a “one-look equilibrium” snapshot of the market. It highlights bullish trends when the price is above the cloud, bearish conditions when the price is below it, and indecision or transition when the price is inside the cloud. Crossovers, cloud breakouts, and confirmations by the Chikou Span strengthen the trading signals.
However, traders should keep in mind the limitations of the Ichimoku system. It is based on historical data and should not be used in isolation. Combining it with other tools such as RSI, volume analysis, or candlestick patterns can significantly improve accuracy and reduce false signals.

Stalonte EMA - Stable Long-Term EMA with AlertsStalonte EMA - The Adaptive & Stable EMA - Almost Eternal
Here's why you will love "Stalonte":
The Stalonte (Stable Long-Term EMA) is a highly versatile trend-following tool. Unlike standard EMAs with fixed periods, it uses a configurable smoothing constant (alpha), allowing traders to dial in the exact level of responsiveness and stability they need. Finding the "sweet spot" (e.g., alpha ~0.03) creates a uniquely effective moving average: it is smooth enough to filter out noise and identify safe, high-probability trends, yet responsive enough to provide actionable signals without extreme lag. It includes alerts for crossovers and retests.
Pros and Cons of the Stalonte EMA
Pros:
Unparalleled Adaptability: This is its greatest strength. The alpha input lets you seamlessly transform the indicator from an ultra-slow "trend-revealer" (low alpha) into a highly effective and "safe" trend-following tool (medium alpha, e.g., 0.03), all the way to a more reactive one.
Optimized for Safety & Signal Quality: As you astutely pointed out, with the proper setting (like 0.03), it finds the perfect balance. It provides a smoother path than a standard 20-50 period EMA, which reduces whipsaws and false breakouts, leading to safer, higher-confidence signals.
Superior Trend Visualization: It gives a cleaner and more intuitive representation of the market's direction than many conventional moving averages, making it easier to "see" the trend and stick with it.
Objective Dynamic Support/Resistance: The line created with a medium alpha setting acts as a powerful dynamic support in uptrends and resistance in downtrends, offering excellent areas for entries on retests with integrated alerts.
Cons:
Requires Calibration: The only "con" is that its performance is not plug-and-play; it requires the user to find their optimal alpha value for their specific trading style and the instrument they are trading. This demands a period of testing and customization, which a standard 50-period EMA does not.
Conceptual Hurdle: For traders only familiar with period-based EMAs, the concept of a "smoothing constant" can be initially confusing compared to simply setting a "length."
In summary:
The Stalonte EMA is not a laggy relic. It is a highly sophisticated and adaptable tool. Its design allows for precise tuning, enabling a trader to discover a setting that offers a superior blend of stability and responsiveness—a "sweet spot" that provides safer and often more effective signals than many traditional moving averages. Thank you for pushing for a more accurate and fair assessment.
Use Case Example:
You can combine it with classical EMAs to find the perfect entry.
Andean • Dot Watcher (Exact Math + Optional Alerts)Title: Andean • Dot Watcher (1m + 1000T Alerts)
Description:
The Andean • Dot Watcher is a precision trend-detection tool that plots Bull and Bear “dot” signals for both the 1-minute chart and the 1000-tick chart — all in one indicator. It’s designed for traders who want early confirmation from tick data while also monitoring a traditional time-based chart for added confluence.
Key Features:
Dual-Timeframe Signals – Plots and alerts for both 1m and 1000T chart conditions.
Bull Dots – Green markers indicating bullish dominance or trigger events.
Bear Dots – Red markers indicating bearish dominance or trigger events.
Customizable Dot Mode – Choose between continuous dominance, flip-only signals, or crossover conditions.
Real-Time Alerts – Built-in TradingView alerts for:
1m Bull / 1m Bear signals
1000T Bull / 1000T Bear signals
Alert Flexibility – Users can set alerts for either timeframe independently or combine them for confirmation setups.
Usage Tips:
For fastest reaction, combine 1000T dots with 1-minute dots as a confirmation filter.
If your TradingView plan does not include tick charts, you can still use the 1-minute signals without issue.
Works best when combined with your existing trade plan for entries, exits, and risk management.
Requirements:
1-minute chart signals work on any TradingView plan (including Basic).
1000T tick chart signals require a TradingView plan that supports tick charts.
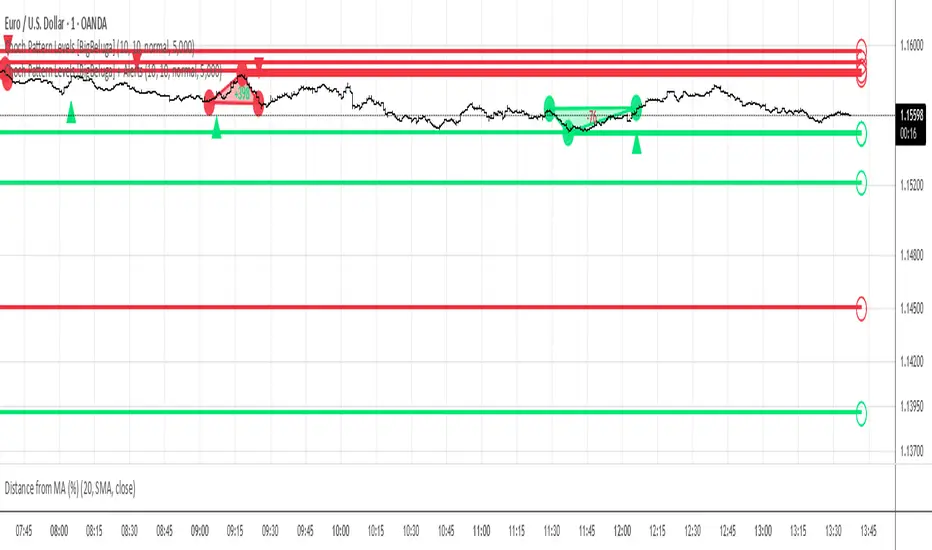
Choch Pattern Levels [BigBeluga] + AlertsThis version of Choch Pattern Levels includes built-in alert conditions for both ChoCh Up and ChoCh Down patterns. You can now set TradingView alerts directly when either pattern occurs, with optional visual markers (triangles) plotted on the chart.
Based on the original script by BigBeluga, licensed under CC BY-NC-SA 4.0. This is a modified version with alert conditions added.