Bollinger Bands Width with AlertsStandard Bollinger Band Width indicator with some convenience alerts -- please only use these alerts in conjunction with the alert-type "Once per Bar Close" in order to avoid premature (false) signals!
Alerts provided:
- bbw has rounded (started to decrease after period of rising)
- bbw has started rising (after a period of falling)
Many thanks again to J. Bollinger for his indicators and efforts in education.
Cerca negli script per "alert"

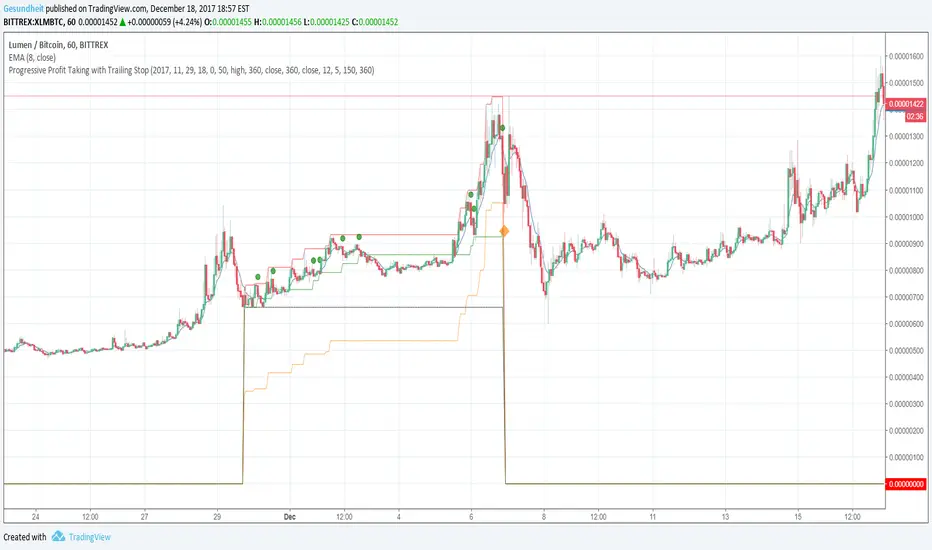
Progressive Profit Taking with Trailing StopThis is version 2 of
Special features:
Added partial profit taking as price rises. Profit taking is triggered by price crossing an EMA.
After profit taking, price has to rise by a user-specified percent before taking profits again.
Also includes condition for fully closing position after meeting specified profit target.
To incorporate into your algo, turn the plotshape functions into alertcondition.
Heiken Ashi zero lag EMA v1.1 by JustUncleLI originally wrote this script earlier this year for my own use. This released version is an updated version of my original idea based on more recent script ideas. As always with my Alert scripts please do not trade the CALL/PUT indicators blindly, always analyse each position carefully. Always test indicator in DEMO mode first to see if it profitable for your trading style.
DESCRIPTION:
This Alert indicator utilizes the Heiken Ashi with non lag EMA was a scalping and intraday trading system
that has been adapted also for trading with binary options high/low. There is also included
filtering on MACD direction and trend direction as indicated by two MA: smoothed MA(11) and EMA(89).
The the Heiken Ashi candles are great as price action trending indicator, they shows smooth strong
and clear price fluctuations.
Financial Markets: any.
Optimsed settings for 1 min, 5 min and 15 min Time Frame;
Expiry time for Binary options High/Low 3-6 candles.
Indicators used in calculations:
- Exponential moving average, period 89
- Smoothed moving average, period 11
- Non lag EMA, period 20
- MACD 2 colour (13,26,9)
Generate Alerts use the following Trading Rules
Heiken Ashi with non lag dot
Trade only in direction of the trend.
UP trend moving average 11 period is above Exponential moving average 89 period,
Doun trend moving average 11 period is below Exponential moving average 89 period,
CALL Arrow appears when:
Trend UP SMA11>EMA89 (optionally disabled),
Non lag MA blue dot and blue background.
Heike ashi green color.
MACD 2 Colour histogram green bars (optional disabled).
PUT Arrow appears when:
Trend UP SMA11

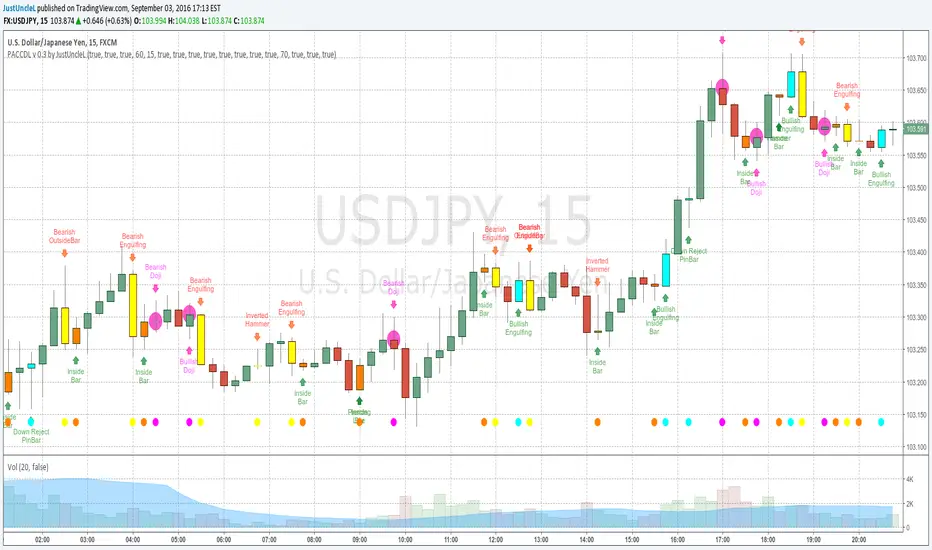
Price Action Candles v0.3 by JustUncleLThis requested release includes an Alert condition, so an alarm can be created on selected Price Action bars. Also this version modifies the Doji calculation to be similar to an Harami, so now the description of the Doji's are:
- Bearish Doji (aka Bearish Harami) (Fuchsia Highlight above Bar):
A large body Bull (green) candle followed by a small or no body candle
with wicks top and bottom that are at least 60% of candle.
- Bullish Doji (aka Bullish Harami) (Fuchsia Highlight below Bar):
A large body Bear (red) candle followed by a small or no body candle
with wicks top and bottom that are at least 60% of candle.
The % wick size (default 60%) of the Doji and the size of previous candle (default 15 pips) can be modified in the script Format parameters.
This modified Doji is particularly useful when combined with Heikin Ashi candles.
When Alerts are selected, an alert dot is also displayed along the bottom of the chart.
strategy MACD and RSI alertThis is a script I created by combining parts of other scripts I looked at. It uses RSI and MACD to give entrance signals for longs or shorts. When the color changes from red to green it signifies a buy, from green to red signifies a short.
The problem that I am having is that I cannot set up the alert script properly, Using the code :
alert1 = (xRSI > Overbought and signal < macd) ? 1: 0
gives repeat signals every time the criteria reasserts itself, and I only want it to show an alert at the same time the bar color changes.
If I could get some advice on how to set up the alert so it only alerts me at the same time that the bars change color, it would be much appreciated.
Thankyou

Quadruple Moving Average with Alerts [FitzTello]Quadruple Moving Average with Alerts (Quad MA)
Quad MA plots four Simple Moving Averages (SMAs) on the chart to help you quickly visualize trend direction, dynamic support/resistance zones, and key mean-reversion areas.
You can choose a built-in preset for the primary trend pair (7–21, 11–22, or 50–200) or switch to Custom to define your own M1 and M2 lengths. Two additional SMAs (M3 and M4) are always available for extra structure (e.g., intermediate trend, pullback filter, or multi-timeframe alignment).
Alerts included: The script provides separate alert conditions for each SMA whenever price crosses above or below that line (effectively a “touch/cross” event), making it easy to automate notifications when price interacts with your chosen moving-average levels.
Inputs: Preset selector, custom MA lengths (M1–M4), and source (default: close).

Fair Value Gaps (40+ Points) with NY Session AlertsFVG with alerts. This works for the NY session only.

Price Range CHoCH Alert🎯 Smart Money Concept (SMC) indicator that monitors a specific price level and alerts only when price touches that level AND
subsequently creates a Change of Character (CHoCH).
Key Features:
• Set a custom price level to monitor
• Detects CHoCH/BOS based on pivot highs/lows
• Alerts ONLY when: Price touches level → CHoCH occurs
• Visual confirmation with level line and status table
• Configurable tolerance for precise level targeting
• Works for both bullish and bearish scenarios
Perfect for:
✓ Institutional level trading
✓ Key support/resistance breakouts
✓ Liquidity grab confirmations
✓ Structure break validation
Simply set your target price level and let the indicator watch for the perfect SMC setup!

REM Algo - Earnings AlertsNot everyone wants to hold positions through earnings announcements — and if you’re evaluating a strategy, earnings-related gaps can distort performance metrics and make results harder to interpret.
This script helps you manage earnings risk by triggering alerts during an Earnings Blackout window. You can:
get an alert to close positions the day before earnings, and/or
receive a reminder not to open new positions on blackout days prior to the earnings announcement.
Add alerts to the stocks you trade. When a blackout day occurs, the script triggers at the hour and minute you choose in the settings. The Earnings Blackout period covers the day before and the day of the earnings announcement, adjusted for weekends and market holidays.
Use it as a standalone risk-control tool — or alongside your existing strategy — so earnings gaps don’t interfere with your trading rules or your backtest results.

SPY Daily Gamma Levels [Manual Input With Alerts]Overview This indicator plots key options-based support and resistance levels (Gamma Exposure / GEX) directly on your chart. Unlike standard technical analysis, these levels (Call Wall, Gamma Flip, Put Support, and Volatility Trigger) represent where Market Makers are positioned, often acting as "magnets" or "repellents" for price action.
Important Note: TradingView Pine Script cannot currently access external options open interest data natively. Therefore, this is a Manual Input Indicator. You must update the four price levels in the settings each morning before the market opens.
Key Features:
4 Key Levels: Plots the Call Wall, Gamma Flip (Zero Gamma), Put Support, and Volatility Trigger.
Auto-Cleaning: Automatically deletes yesterday's lines to keep your chart clean; lines only show for the current session.
Alerts Included: Built-in alert conditions allow you to set notifications when price crosses the Gamma Flip or breaks the Vol Trigger.
Customization: Fully customizable colors and line styles.
Best Practices:
Timeframe: Works best on 15-minute charts for trend identification and 5-minute charts for entry execution.
Strategy:
Above Gamma Flip: Market generally stabilizes; dealers buy dips.
Below Gamma Flip: Volatility expands; dealers sell rips.
Below Vol Trigger: "Danger Zone" – expect accelerated selling pressure.
How to Get the Data (The AI Workflow)
Since these numbers change daily, I use Google Gemini to fetch the data and remind me every morning. Here is how you can set up the same automated workflow:
1. The Prompt You can ask Gemini (or your preferred AI) the following prompt manually each morning:
"Find the daily SPY Call Wall, Gamma Flip, Put Support, and Vol Trigger levels for today to input into my TradingView indicator."
2. Automating the Routine I have set up a scheduled daily reminder with Gemini. To do this yourself, simply ask Gemini:
"Can you schedule a daily task to search for these SPY Gamma levels and send them to me every morning at 8:00 AM?"
3. Updating the Chart
Receive the notification from the AI.
Open the Indicator Settings in TradingView.
Type in the new numbers.
The chart updates instantly.
Disclaimer: This tool is for educational purposes only. Gamma levels are estimates based on Open Interest and Dealer Gamma exposure models. Always manage your risk.

BTC 1H Momentum + Near-Setup Alerts bigbeeukthis alert, sets up on 1h chart of BTC only. it alerts you to price action and when its close to a setup. it will then trigger again once the setup is ready

Price Movement Alert with Previous Close as ReferenceFunctionality of the Indicator
The "Price Movement Alarm with Previous Day Close as Reference" indicator is a tool that helps you monitor significant price levels based on the previous day's closing price. The indicator calculates both decline and rise thresholds in specified percentages to generate potential trade alerts. The lines on the chart represent these thresholds, and the corresponding labels show the exact percentage.
Usage Instructions:
Previous Day's Close: The indicator uses the previous trading day's close as the reference point.
Setting Decline and Rise Percentages: You can adjust the alarm levels for declines (e.g., 0.5%, 1.0%, 1.5%, 2.0%, 2.5%, 3.0%) and rises (e.g., 0.5%, 1.0%, 1.5%, 2.0%, 2.5%, 3.0%).
Lines and Labels: The indicator draws lines on the chart and displays labels that indicate the percentage of price movement.
Market Analysis: Analyze the price movements to make potential trading decisions.
Market in Equilibrium:
A market is in equilibrium when price movements remain within a narrow range (e.g., 0.5% to 1%). During this phase, volatility is low, and there are no significant price changes.
Market not in Equilibrium:
A market is not in equilibrium when price movements fall outside the narrow range (e.g., above 1%). During this phase, larger price movements can occur, often triggered by news or economic events.

Awesome SuperTrend Zone Dynamic Alerts// created by © OmegaTools, upgrade to v6 and alert condition added
//@version=6
Awesome SuperTrend Zone Alerts with dynamic alerts

Triple EMA (5, 8, 13) + Confirmed Alerts with SoundThis indicator uses three Exponential Moving Averages (EMA 5, 8, and 13) to generate buy and sell signals when the EMAs are properly aligned and not touching. Signals are confirmed on candle close and can trigger customizable sound alerts directly from the TradingView alert panel.

Triple EMA (5, 8, 13) + Confirmed Alerts with SoundThis indicator uses three Exponential Moving Averages (EMA 5, 8, and 13) to generate buy and sell signals when the EMAs are properly aligned and not touching. Signals are confirmed on candle close and can trigger customizable sound alerts directly from the TradingView alert panel.
BTC Confluence Alert 1 Overall Purpose
This script is a custom TradingView indicator that scans for confluence (agreement) between:
BTC’s short-term and medium-term momentum (12-minute and 1-hour RSIs),
The MACD histogram (trend direction and momentum strength),
Bitcoin dominance (money flowing back into BTC).
When all three are bullish, it flashes green and triggers a single alert.

Divergences + Alerts (ANY Indicator)📊 Divergences + Alerts (ANY Indicator)
This versatile indicator detects four types of divergences between price action and an oscillator:
Buyer Exhaustion
Buyer Absorption
Seller Exhaustion
Seller Absorption
Each divergence type is automatically identified and visually marked on the chart with colored lines. The indicator also includes built-in alert conditions for all four divergence types, allowing traders to receive real-time notifications when potential reversal signals occur.
By default, the oscillator is a candle-style visualization of the Money Flow Index (MFI), enhanced with volatility filtering via a VWMA-based ATR. However, users can replace the default MFI oscillator with any external source using the “Plug External Source” input, enabling full customization and compatibility with other indicators.
Key features:
🔍 Detects both exhaustion and absorption divergences
🔔 Alerts for each divergence type
🕯️ Candle-style oscillator visualization
🔌 Optional input for external indicator sources
⚙️ ATR-based filtering for precision
Ideal for traders seeking to spot early signs of trend reversals or momentum shifts with customizable flexibility.

Multi-Market Trend-Pullback Alerts (EMA20/50 + RSI) [v6]//@version=6 replaces 5
Some functions (like label.delete) need to be called as methods
Minor syntax tightening around string concatenation and label management
All alertcondition() and table logic still works, but must be explicitly version 6 compatible

34 EMA Cross Alert (Once per sequence)This script is used when 5-12 EMA is above 34-50 EMA and if price corrects to 34-50 cloud and bounces i.e. price crosses below 34 EMA and then cross above 34 EMA, it will trigger alert.
MTF FVG Confluence v6 — JSON Alerts via alert()This strategy combines multi-timeframe confluence with candlestick analysis and fair value gaps (FVGs) to generate structured long/short entries. It aligns Daily and 4H EMA trends with 1H MACD momentum, then confirms with engulfing candles and FVG zones for precision entries. Risk management is built-in, featuring stop-loss, 3R take-profit targets, and optional break-even logic, with dynamic JSON alerts for webhook automation.
Categories:
Candlestick analysis
Chart patterns
Cycles

EMA 9/21 Crossover Alert (BerryRight)This indicator gives entry signals through EMA crossover and the gives the opportunity to set up alerts. I will update this indicator with exits in the future. it's written in Pinesctipt v5

Inside Bar With Alert - RajThis indicator helps you reduce your screen time by giving you consistent alerts on the formation of inside bar candle and it gives you bullish and bearish alerts on breakout of the mother candle. So if you believe in inside strategy this indicator will be helpful for you.

Impulse Alert - Supply (Sell) [Fixed]🟥 Supply Zone (Sell) – Institutional Order Block Detector
This custom indicator automatically detects valid Supply Zones (Sell Zones) based on Smart Money Concepts and institutional trading behavior.
🔍 How It Works:
Identifies strong bearish impulsive moves after price forms a potential Order Block
Valid supply zones are plotted after:
A valid rally–base–drop or drop–base–drop structure
A shift in structure or clear imbalance is detected
The zone is created from the last bullish candle before a strong bearish engulfing move
Zones remain on chart until price revisits and reacts
📊 Use Case:
Ideal for traders using Smart Money Concepts (SMC), Supply & Demand, or ICT-inspired strategies
Perfect for scalping, day trading, or swing setups
Designed for confluence with HTF bias and LTF execution
⚙️ Features:
Supply Zone auto-plotting
Customizable zone color and opacity
Alerts when price returns to the zone (retest entry opportunity)
🧠 Tip for Best Use:
Use in confluence with:
HTF Supply zones (manual or other indicator)
Market Structure breaks
Fair Value Gaps or Imbalance zones
Strong impulsive moves from HTF to LTF
🔁 Future Additions (Coming Soon):
Demand Zone detection
Zone strength rating system
Refined zone filters (volume, candle size, etc.)
Alerts for mitigation or invalidation
📌 Created by: Rohit Jadhav | Real-time market trader | YT/Insta - @GrowthByTrading
💬 Feedback? Drop a comment or connect via profile for updates and tutorials!
