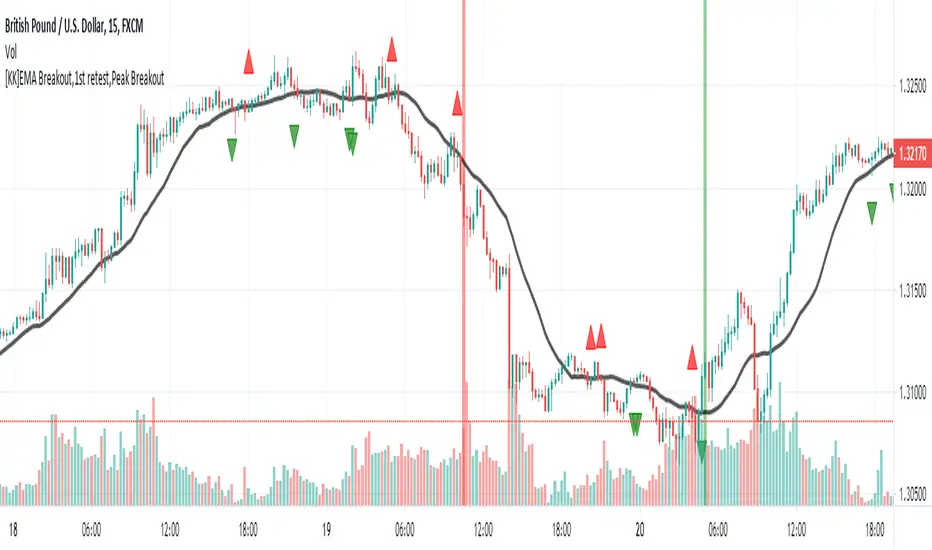
[KK]EMA Breakout,1st retest,Peak BreakoutThis script gives Signal based on 3 parameters
(1) Exponential Moving average breakout
(2)Retest after Breakout
(3) Peak Breakout after retest for conformation
Recommended Settings:
(1) EMA Length = 20 period
(2)Left Bars= Right Bars = 4
(3)15min chart resolution
Note: Default setting is what recommended.
Interpretation:
(1)Green Background = Higher Peak Breakout candle after conformed retest
(2)Red Background = Lower Peak Breakout candle after conformed retest
(3) Green circle = 1st Upward Breakout candle after conformed retest ( if previous breakout is Downward)
(4)Red circle = 1st Downward Breakout candle after conformed retest ( if previous breakout is Upward)
Note: you can additionally add backgrounds for EMA breakout and conformed Retest from code.
Signals:
(1)Long = When Green circle
(2)Short = When Red circle
This script works with any ticker id. Best Use for Equity and Forex Markets. Also, added alert condition for green and red circle.
P.S.: Thanks to @RagingRocketBull for source code for breakout candles
Cerca negli script per "alert"
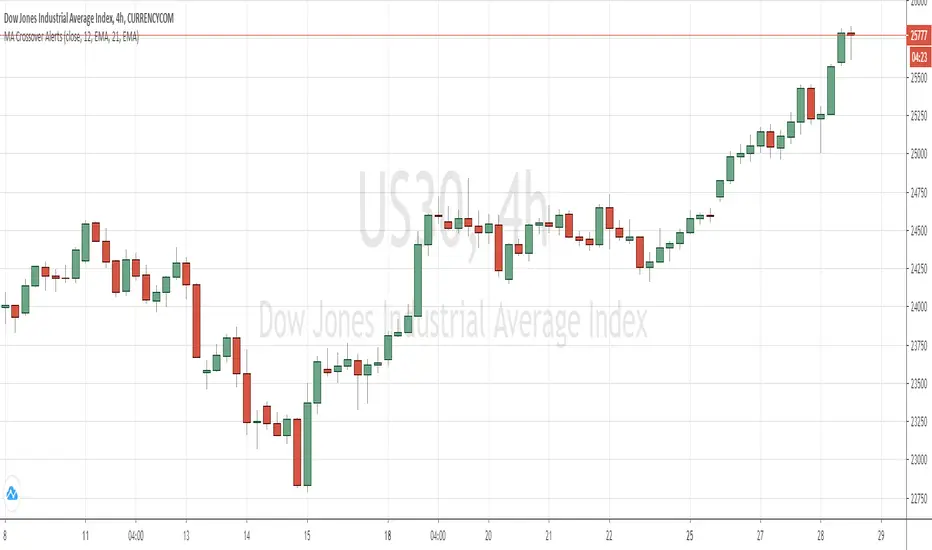
MA Crossover AlertsThis script allows you to configure Create Alert dialogue box for a MA Crossover and send a notification on mobile device.

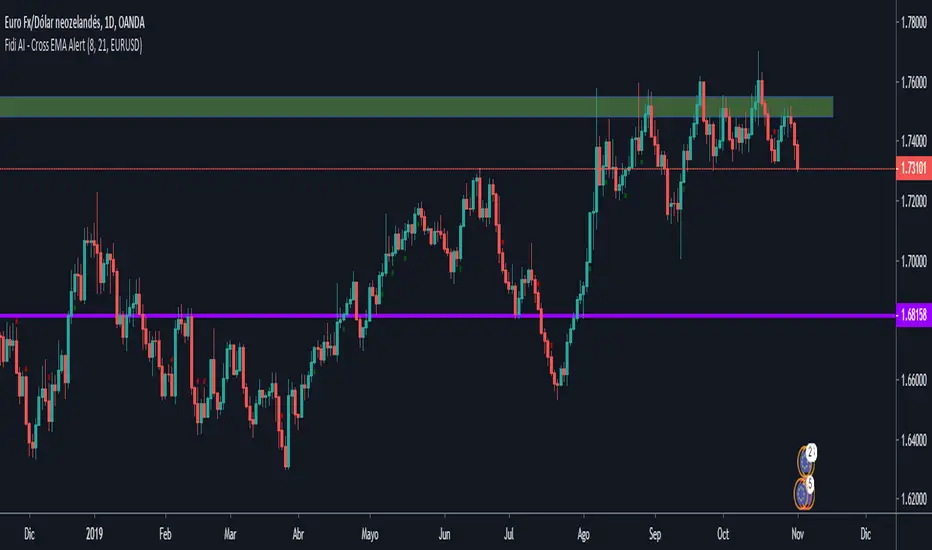
Ema Cross, 10 /21 / 55Ema Cross tool using Ema 10 / Ema 21 / Ema 55
I have found these settings very useful for catching breakouts on Alt coins.
Alerts Added,
Breakout = Ema 10 crossing above Ema 21
Breakdown = Ema 10 crossing under Ema 21
Ema 55 added as a useful area to catch dips when price is trending

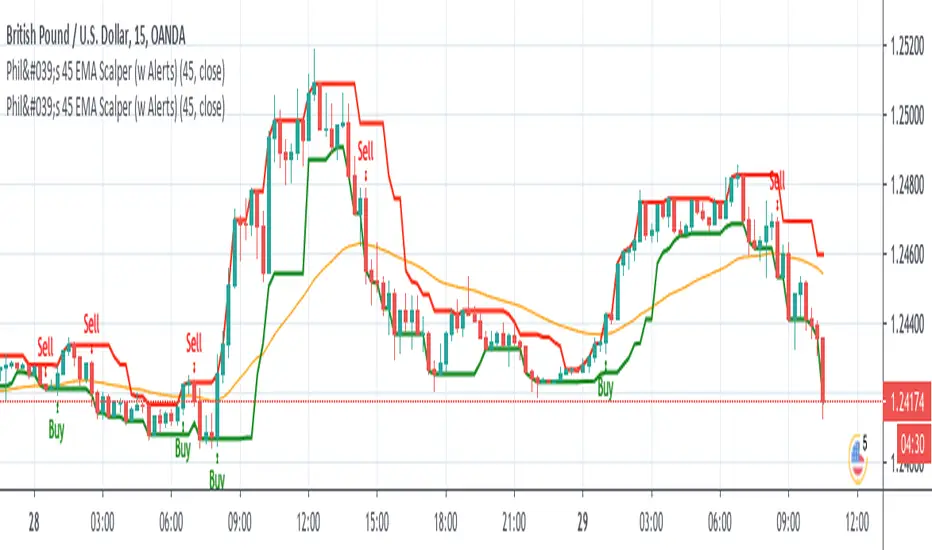
Phil's 45 EMA Scalper - Buy / Sell with Alertsgives buy / sell alert when candle closes above or below 45 EMA respectively.
Ichimoku Kinko Hyo Cloud - no offset - no repaint - strategyIchimoku Kinko Hyo Cloud - no offset - no repaint - RSI filter - strategy
The indicator contains both the standard Ichimoku Cloud , as well as the one without the visual offset.
The Strategy Tester indicates good backtest results when the Ichimoku Cloud is paired with the RSI .
However, it seems it likes to work more as a standalone system.
The indicator can be easily converted to the study() mode by commenting/uncommenting a few lines,
then the alarms can be configured.
There are entry and exit signals ready to be used by the alert system.
The coloring of the cloud without offset contains all 3 conditions: Uptrend , Downtrend , Transition .

Early/Delayed Signal FunctionEarly/Delayed Signal Function (before the bar close or after)
Usually, signals are considered to be valid at the bar close .
Some traders may prefer to have a chance to enter earlier .
It is of great risk , and the Strategy Tester is unable to provide consistent backtest data with regards to this.
But for those who want to integrate such a choice in their strategies, here is the Early Signal Function .
The function takes 2 parameters
- the signal that is considered valid at the bar close , of type bool
- the early time value in seconds, the time before the signal is valid, of type int
it returns a value of type bool - a New Entry Signal
The resulting conditions used for alerts would be:
- newLongCondition = earlySignal_f(myLongSignal, earlyTime)
- newShrtCondition = earlySignal_f(myShrtSignal, earlyTime)
Note: the signals can also be delayed - use a negative value for early time


NVT Signal with RMA and thresholds [alertable]NVT Signal, or NVTS, is an indicator that compares the market cap of Bitcoin to the aggregate USD value of daily transactions on the Bitcoin blockchain. It is a value indicator that shows a multiple of Bitcoin price against the actual usage of its blockchain. When the NVTS is low, it suggests Bitcoin price is low relative to the amount of utility the network provides, and vice versa.
For more information on NVTS, visit medium.com
This indicator aims to provide the following:
1. An open-source implementation of NVTS on Tradingview, as the most popular one currently is closed-source.
2. To provide two simple ways to define and visualize "overbought" or "oversold" conditions using the NVTS. Here, we have absolute value of NVTS & deviation from a long-term moving average.
3. Crude integration into Tradingview's alert system.
What this indicator CANNOT do:
1. Timeframes below 1d.
2. Signals based on statistical analyses, such as seen in Bollinger Bands et al. (However, with the appropriate type of account, you can add BBands on top of this indicator.)
I would like to express my gratitude to Willy Woo, Chris Burniske and Dimitry Kalichkin for their work on NVT Ratio and NVT Signal, without which my indicator would not have been created.
Feel free to fork & improve, or experiment with settings. I hope this indicator will be useful to someone.
Divergences for many indicators v2.0A gift from me to all.
This script is developed to find Divergences for many indicators. it analyses divergences and then draws line on the graph. red for negatif, lime for positive divergences.
Currently script checks divergence for RSI, MACD, MACD Histogram, Stochastic, CCI, Momentum, OBV, Diosc, VWMACD and CMF indicators. You can use some or all of these indicators to check divergences as you wish by choosing them on the menu. Also you can add/remove many other indicators to the script to check if there is divergence.
The script first calculates tops/bottoms by using higher time frame zig zag and then finds divergences.
Higher Time Frames are
if currend period 1 min => HTF = 5 mins
if currend period 3 mins => HTF = 15 mins
if currend period 5 mins => HTF = 15 mins
if currend period 15 mins => HTF = 1 hour
if currend period 30 mins => HTF = 1 hour
if currend period 45 mins => HTF = 1 hour
if currend period 1 hour => HTF = 4 hours
if currend period 2 hours => HTF = 4 hours
if currend period 3 hours => HTF = 4 hours
if currend period 4 hours => HTF = 1 day
if currend period 1 day => HTF = 1 week
if currend period 1 week => HTF = 1 week
future plan : script finds regular divergences, soon I will add hidden divergences and also I plan to add alert ;)

Simple Moving Averages Alert Scriptcan set alerts on 3 moving averages (crossovers) , experiment with different moving average lengths in the input settings menu, there is also a toggle switch which turns off the 3rd moving average being used as a stop.
will add a backtesting version at some point
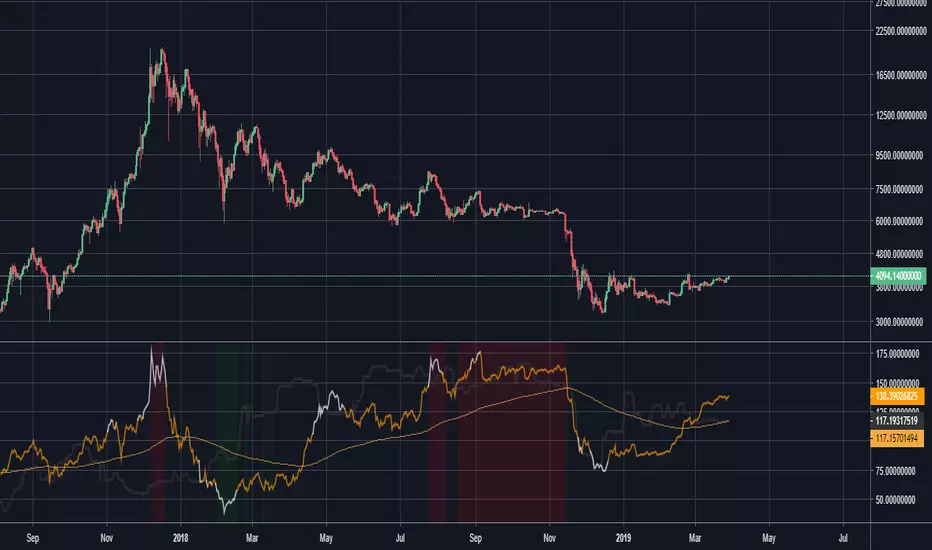
Relative Strength Index of Moving Average MTF alertsAll credit to this study is for chris jhoncic , this is MTF version with alert of his study
basic idea is hybrid of RSI and different MA
You can choose which MA from the following list:
Tillson Moving Average (T3)
Double Exponential Moving Average ( DEMA )
Arnaud Legoux Moving Average ( ALMA )
Least Squares Moving Average ( LSMA )
Simple Moving Average ( SMA )
Exponential Moving Average ( EMA )
Weighted Moving Average ( WMA )
Smoothed Moving Average ( SMMA )
Triple Exponential Moving Average ( TEMA )
Hull Moving Average ( HMA )
Adaptive moving average (AMA)
Fractal Adaptive Moving Average (FAMA)
Variable Index Dynamic Average ( VIDYA )
Triangular Moving Average (TRIMA)
to change the time frame change int2 to what you desire
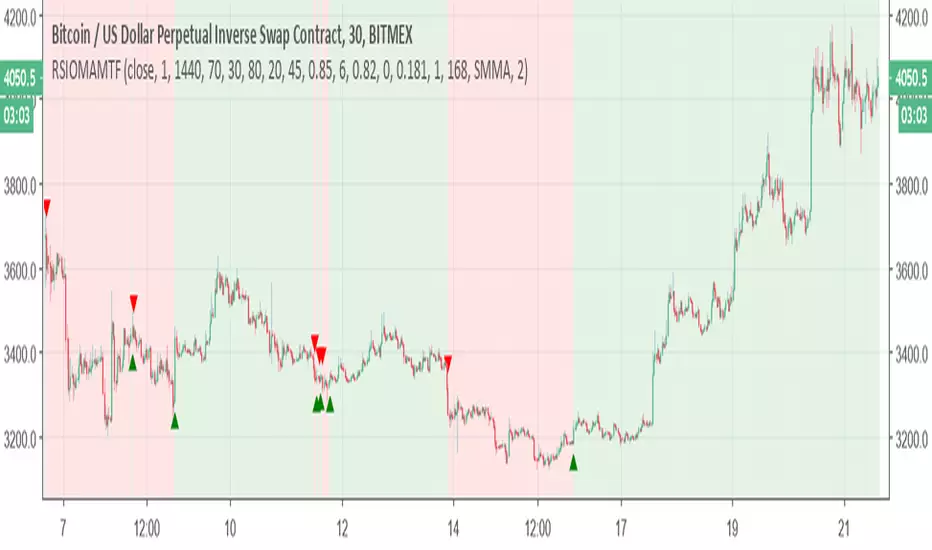
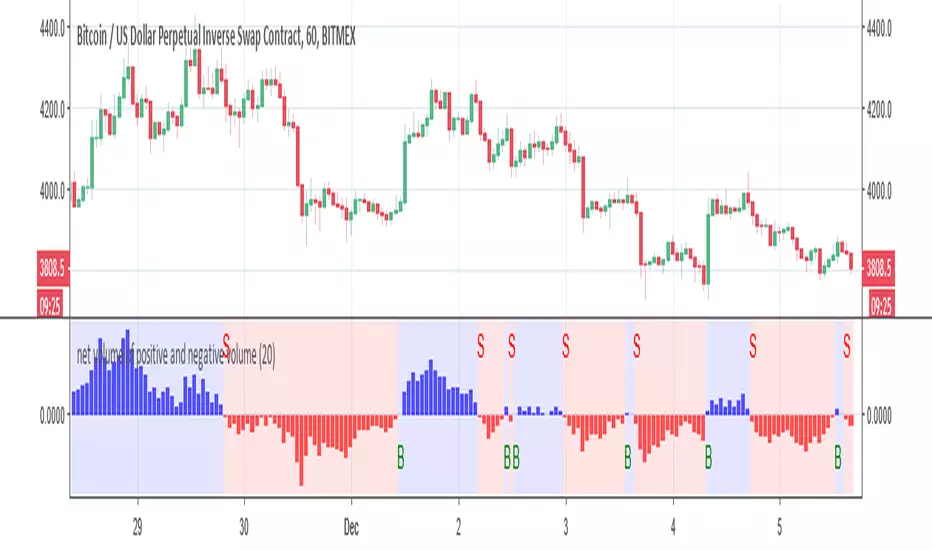
net volume of positive and negative volume buy and sell alertThis indicator try to give the mean number of bars in regarding to net volumes
This signal is produce by either cross up the 0 =buy or crossdown the 0 =sell
alerts inside
you can play with length to make optimization
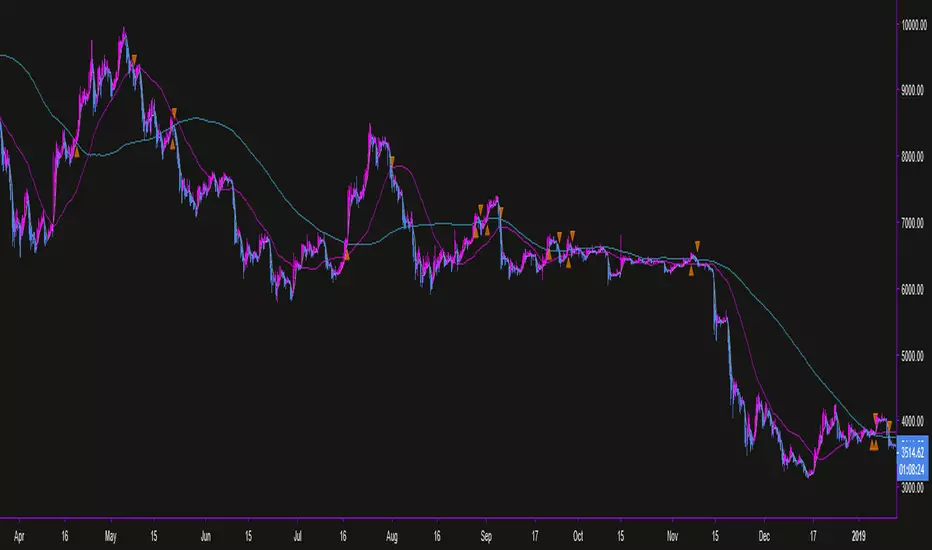
[STRATEGY] MA Cross ElevenThis script is a crossing of eleven different MA, with alerts and SL and TP.
The simplest is what works best...
SMA --> Simple
EMA --> Exponential
WMA --> Weighted
VWMA --> Volume Weighted
SMMA --> Smoothed
DEMA --> Double Exponential
TEMA --> Triple Exponential
HMA --> Hull
TMA --> Triangular
SSMA --> SuperSmoother filter
ZEMA --> Zero Lag Exponential
Using "once per bar close" repaint is 0%, but if you like risk can choose "once per bar", better profit.
Thanks to JustUncleL and his amazing sripts.
Enjoy!
www.tradingview.com
"Note: When using non-standard (Renko, Kagi, Line Break, Point and Figure, Heikin Ashi, Spread Charts) types of chart as a basis for strategy, you need to realize that the result will be different. The orders will be executed at the prices of this chart (e.g.for Heikin Ashi it’ll take Heikin Ashi prices (the average ones) not the real market prices). Therefore we highly recommend you to use standard chart type for strategies."

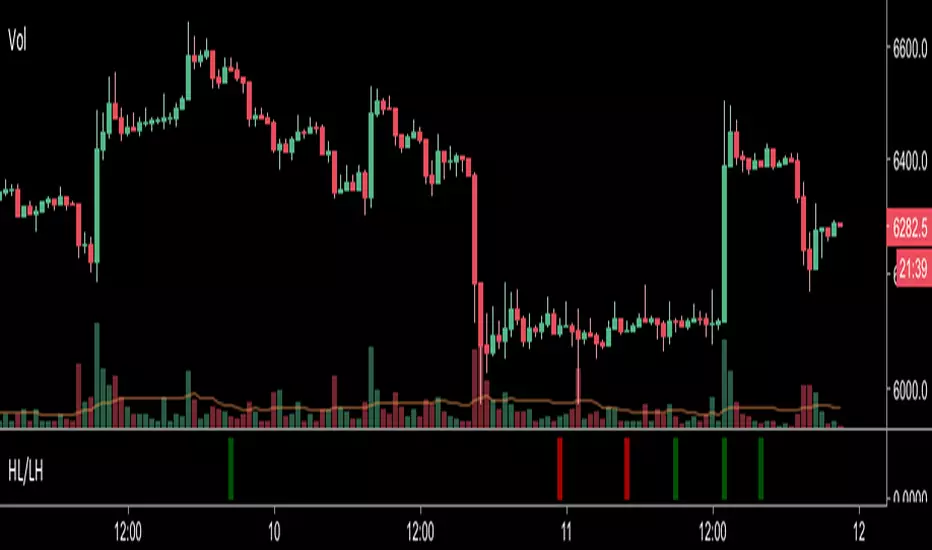
Higher Lows / Lower Highs AlertsSet an alert with this indicator for greater than 0.99 which will notify you of when a higher low or lower high is printed on the chart
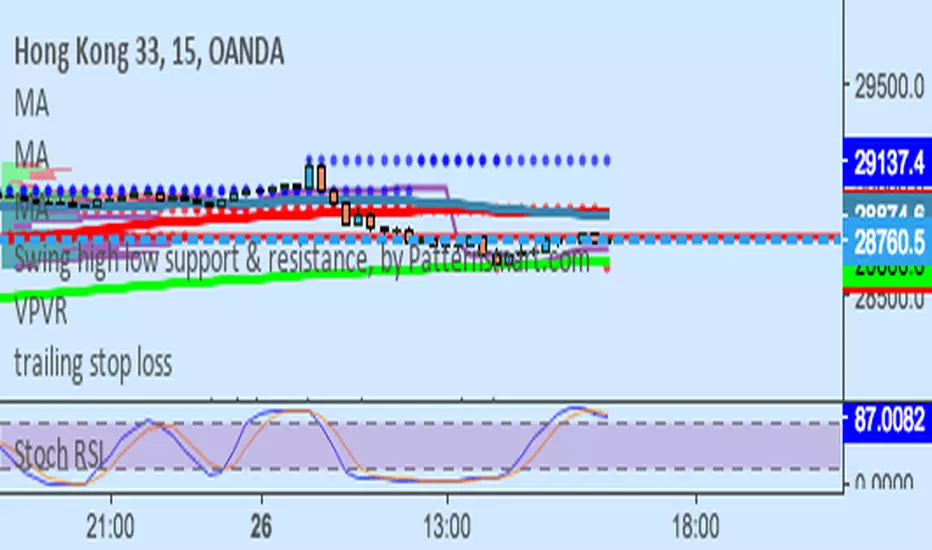
Stochastic RSI Alertscreate alert based on Stochastic RSI when k is greater than 80 or less than 20.
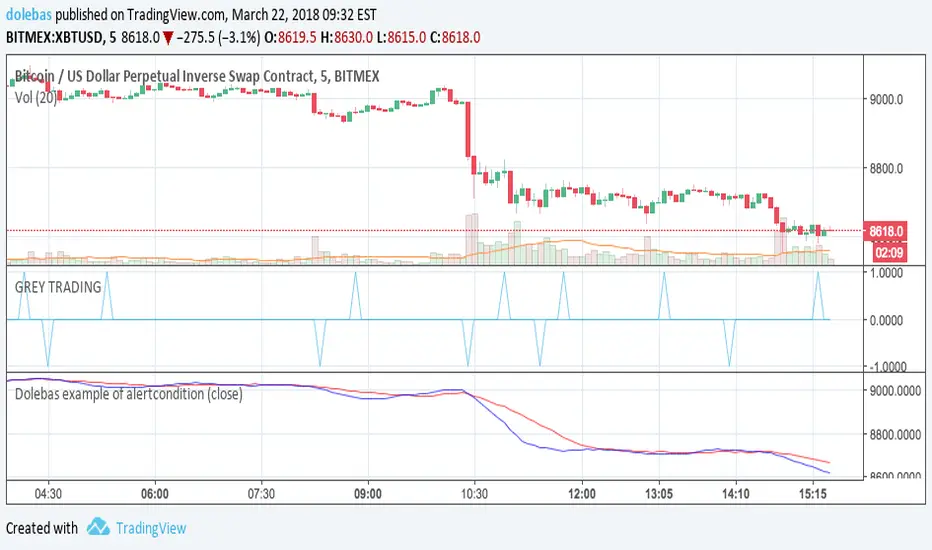

PIP COLLECTOR - REPAINT FIX w/ ALERTSThis fixes the repaint issue in LazyBear's Pip collector and adds alert capability. This strips away much of the original indicator, but it is a clear signal for longing and shorting, good to base off for live trading. As always, find a good entry and have an exit plan.

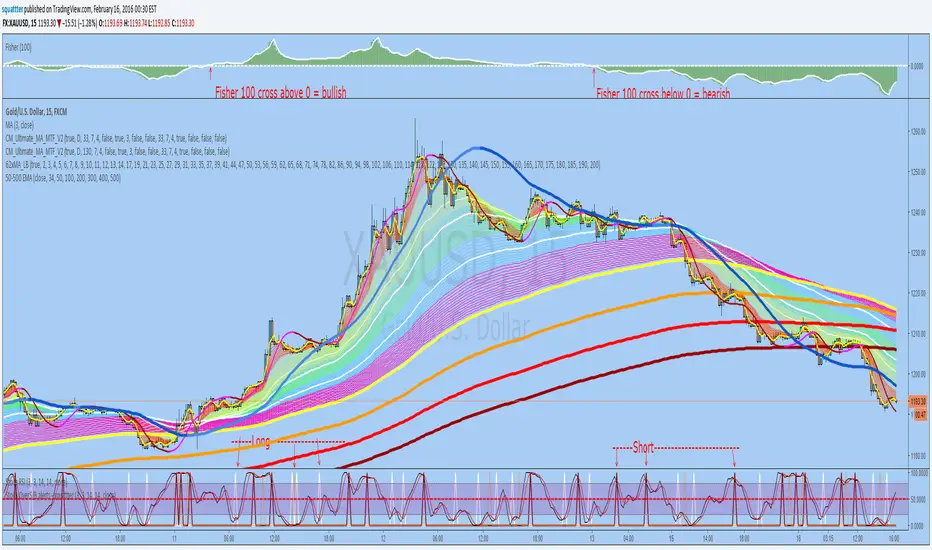
StochRSI overSold/Bought alerts - by squattterDepending on the new trend - Fisher 100 crossing 0;
Set an alert on each Long/Short "crossing down", 0.8 (or anything below 0.99), "on condition"
4All-Alerts Script for an easier setupThis is the alert script for
People have requested this so they can simply favorite and add it to a chart rather then cut and paste. That plus some of the code got converted to ticker data due to simply being in the description.
Happy Trading :)

Auction Session Ranges (AMT Edition) [ Alerts] Auction Session Ranges (AMT Edition)
► Overview
The Session Ranges ( AMT Edition) is a session-based market structure and auction analysis tool designed to visually reveal acceptance, rejection, imbalance, and continuation across the Asia, London, and New York CME trading sessions.
Unlike typical indicators, this script is grounded in Auction Market Theory (AMT) and session-based structure, focusing on how price behaves at session extremes rather than relying on lagging calculations, oscillators, or predictive algorithms. Its purpose is to highlight areas where the market has earned the right to be traded, providing traders with a clear, rules-based framework for high-probability directional trades.
Important for backtesting: To properly backtest session extremes, Interaction Lines, and Closest Opposite Extreme Lines, you must use TradingView’s replay mode, as real-time bar-by-bar progression is required to observe how the market interacts with session extremes over time.
► Key Innovations
This is not a conventional session high/low indicator. Its originality comes from several unique design elements:
Differentiates interaction from true acceptance: Price touching an extreme does not automatically indicate directional intent.
Separates directional confirmation from range-bound indecision: Only confirmed crossings beyond the Interaction Line signal actionable bias.
Tracks failed auctions and partial acceptance: No volume profile or order book data required.
Visual, rule-based trade permission: Signals are objective, minimizing subjective interpretation.
Interaction & Closest Opposite Extreme Lines: Together, these lines map how far an auction progresses after an extreme is tested, highlighting continuation, partial acceptance, or failed auctions.
► Core Concepts Explained
1. Session Highs & Lows (Solid Lines)
Plotted continuously for each CME session (Asia, London, New York).
Represent the current auction boundaries for that session.
2. True Interaction Lines (Thick Dotted Lines)
Drawn when price touches or breaks a session extreme:
Touching session high → dotted line at the low of that candle
Touching session low → dotted line at the high of that candle
Auction context:
Touching alone ≠ acceptance
Acceptance occurs only when price moves beyond the Interaction Line and holds
Trading principle:
Price has not crossed → no directional bias → do not trade
Price crosses and holds → directional bias established
3. Acceptance vs Rejection
Accepted direction: Price crosses and holds beyond the Interaction Line
Rejected direction: Price crosses the line but immediately reverses
Neutral / No-Trade: Price trapped between extreme and Interaction Line
Important: Acceptance is conditional and dynamic. Each time price crosses back over the Interaction Line, acceptance is lost.
4. New Extremes = Continuation
Once an Interaction Line is crossed, each new session extreme in that direction reinforces the trend.
Traders should only look for continuation setups along the established directional bias.
AMT interpretation:
Repeated new extremes → directional imbalance
Failure to make new extremes → potential balance or rotation
5. Closest Opposite Extreme Lines (Thin Dotted Lines)
After acceptance, the script tracks price progress toward the opposite session extreme.
Plotted only if price reaches a user-defined percentage of the session range.
Helps identify:
Full acceptance (price reaches opposite extreme)
Partial acceptance (price stalls)
Failed auctions (price cannot progress meaningfully)
Trading guidance once Closest Lines appear:
Partial acceptance: Price stalls near the Closest Line but does not fully reach the opposite extreme → bias remains valid, but the move may be weakening; consider scaling out or tightening stops.
Full acceptance: Price reaches the opposite extreme → directional auction fully confirmed; bias continues, but expect potential rotation or balance afterward.
Failed auction (cannot progress meaningfully): Price reverses before reaching the Closest Line → signals exhaustion; avoid chasing the move and treat as potential trend failure.
Note: Only relevant after Interaction Line is crossed; if price never crosses the Interaction Line, Closest Lines have no trading significance.
► Step-by-Step Usage
Wait for a session extreme
Let price interact with the session high or low.
Observe the Interaction Line
No cross → do not trade
Cross and hold → directional bias established
Trade in the direction of new extremes only
Ignore counter-trend trades unless the Interaction Line is lost
Manage risk using structure
Interaction Line acts as a dynamic invalidation level
Use Closest Lines for context
Partial acceptance → bias valid, watch for weakening
Full acceptance → bias strong, continuation likely
Failed attempt → potential exhaustion, do not chase
Useful for trade management, scaling, and expectation setting
► Price Retests & Pullbacks
Scenario:
Price crosses above the Interaction Line (e.g., from a low interaction).
Over the next 3–4 15-minute bars, price dips back toward the Interaction Line, with wicks touching it but no decisive close below.
Interpretation:
Initial Acceptance Confirmed: Bias remains valid while price holds above/below the line.
Temporary Pullback / Retest: Market is re-evaluating the auction; testing participant agreement.
Wicks Touching the Line: Partial probing or liquidity sweep; market still respects original acceptance.
Trading Implication:
Continuation bias remains intact.
Pullbacks near the Interaction Line offer lower-risk entries.
Decisive close below → acceptance lost, signaling trend failure or invalidation.
Market Psychology:
Healthy auction behavior: extreme tested → acceptance confirmed → boundary retested for liquidity → continuation.
Failure to hold above signals weak acceptance or exhaustion.
✅ Key Takeaways:
Holding above Interaction Line → bias intact, pullback = opportunity
Closing below Interaction Line → acceptance lost, bias invalidated
Wicks touching only → normal retest, still valid
► No-Trade Conditions
Avoid trading when:
Price never crosses the Interaction Line
Price remains trapped between the extreme and the Interaction Line
Market rotates without forming new extremes
These indicate balance, not directional opportunity.
► Alerts
Optional alerts trigger when price crosses an Interaction Line for:
Asia session
London session
New York session
Alerts signal possible acceptance, not automatic trade entries.
► Who This Script Is For
Best suited for traders who:
Trade session structure in futures, indices, or FX
Follow Auction Market Theory principles
Prefer objective, rules-based confirmation
Want fewer but higher-quality trade opportunities
Not intended for:
Indicator stacking
Predictive trading
High-frequency scalping without structure
► Final Notes
This script does not tell you when to buy or sell.
It shows where the market has earned the right to be traded.
Use it as a decision filter, not a prediction engine.
