GEMINI Advanced SMA with Trend & AlertsDescription:
This indicator is a professional Trend & Signal analysis tool designed to help traders identify market direction, entries, and momentum strength at a glance. It combines a customizable dual Moving Average system with an advanced real-time Information Dashboard.
The script is built to keep charts clean while providing maximum data through the on-screen panel.
📈 Key Features
1. Dual Moving Average System
Fast MA (Signal Line): Acts as the primary trigger for entries.
Slow MA (Trend Baseline): Filters the overall market direction.
Visual Cloud: The area between the two MAs is filled with color (Green/Red) to visualize the trend strength and potential support/resistance zones.
Flexibility: You can choose between SMA, EMA, HMA, WMA, or RMA for both lines independently.
2. Professional Data Dashboard A customizable table positioned on your chart provides real-time analytics:
Price Action: Immediate Bullish/Bearish status.
MA Status: Shows if the Fast and Slow MAs are currently Rising or Falling.
Exact Levels: Displays the precise price values of the MAs.
Spread Analysis: Monitors the gap between the Fast and Slow MA ("Expanding" vs "Squeezing") to help identify momentum acceleration or exhaustion.
3. Signals & Alerts
BUY Signal: Generated when the Price crosses OVER the Fast MA.
SELL Signal: Generated when the Price crosses UNDER the Fast MA.
Alerts: Fully compatible with TradingView alerts for automation.
4. Multi-Timeframe (MTF) Support You can calculate the Moving Averages based on a higher timeframe (e.g., viewing 4-hour MAs while trading on a 15-minute chart) to stay aligned with the macro trend.
🛠 How to Use
Trend Identification: Look at the "Cloud" color. Green indicates an uptrend context; Red indicates a downtrend context.
Entry Points: Use the "BUY" and "SELL" labels.
Pro Tip: Take BUY signals only when the Cloud is Green (trading with the trend).
Pro Tip: Take SELL signals only when the Cloud is Red.
Momentum Check: Use the Dashboard to see if the Spread is "EXPANDING" (strong momentum) or "SQUEEZING" (potential consolidation or reversal).
⚙️ Settings
Fast/Slow Length & Type: Fully customizable periods and MA types.
MTF: Enable/Disable higher timeframe calculations.
Dashboard: You can toggle the table visibility, change its size (Tiny, Small, Normal, Large), and move it to any corner of the screen.
Disclaimer: This tool is for informational purposes only and does not constitute financial advice.
Cerca negli script per "alert"

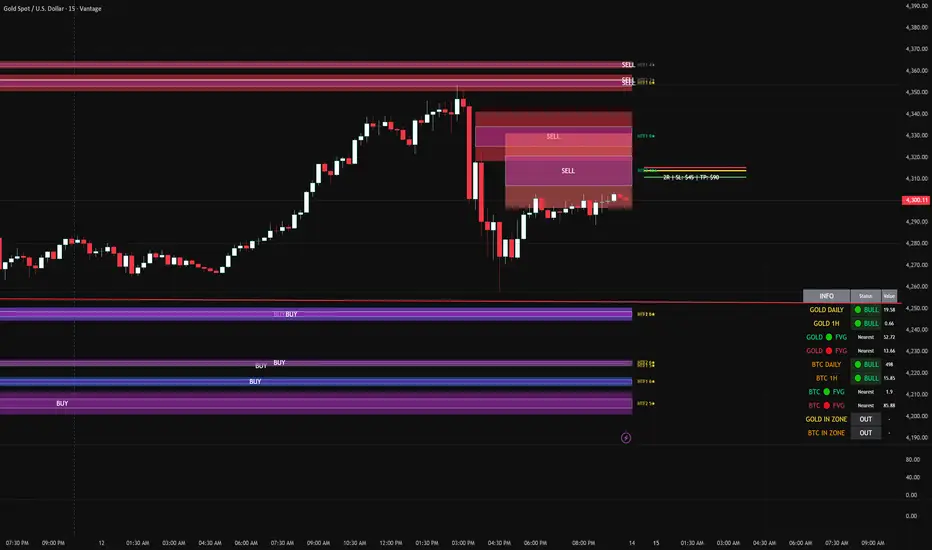
FVG DUAL HTF ALERTS FINAL DG FVG Dual HTF - Advanced Fair Value Gap Detector with Confluence & Strength Analysis
Professional-grade Fair Value Gap (FVG) detection system designed for precision trading on Gold and other instruments.
🎯 Key Features
Dual Higher Timeframe Analysis
HTF1 & HTF2 Detection: Simultaneously monitors two higher timeframes (default: 15min & 60min) for Fair Value Gaps
Multi-timeframe Confluence: Automatically detects when FVGs align across multiple timeframes for high-probability setups
Customizable Timeframes: Choose from 5min, 15min, 60min, 4H, or Daily for each HTF
Intelligent Strength Scoring System (0-11 Scale)
Our proprietary algorithm rates each FVG based on:
Gap size relative to ATR
Volume analysis vs. average
Current timeframe confluence (★ symbol indicates FVG exists on your chart timeframe)
Session timing (London & New York priority)
HTF confluence bonus
Color-Coded Ratings:
🟢 Lime (8-11): Premium strength - highest probability setups
🟡 Yellow (5-7): Good strength - solid opportunities
⚪ Gray (0-4): Weak strength - proceed with caution
Sweet Spot Entry Zones
Inner Box Technology: Highlights the optimal 10% entry zone within each FVG
BUY/SELL Labels: Clear visual cues for directional bias
Automatic Entry/Stop/Target Lines: Shows precise risk-reward setups on the 3 nearest FVGs
Position Sizing Calculator: Displays dollar values based on your lot size
Advanced Fill Methods
Choose how FVGs are invalidated:
Wick Sweep: Most conservative - requires price to sweep through the gap
Any Touch: Price touches the FVG boundary
Midpoint Reached: 50% fill required
Body Beyond: Strictest - candle body must close through the gap
Comprehensive Market Intelligence Table
Real-time monitoring of:
Gold Daily & Hourly Bias (with pip movement)
BTC Daily & Hourly Bias (optional)
Distance to nearest Bull/Bear FVGs
IN ZONE Indicator: 🔥 Alerts when price enters premium sweet spots
Shows strength rating and HTF source
Color-coded: Premium / Good / Weak / Out
Professional Alert System
HTF1 & HTF2 Zone Entry Alerts
Sweet Spot Entry Alerts (BUY/SELL)
High-Strength FVG Alerts (8+ rating)
Combined "ANY HTF" alerts for maximum flexibility
📊 Default Configuration
Optimized for Gold (XAU/USD) on 3-minute charts
Session Focus: London (8am-12pm GMT) & New York (1:30pm-4pm GMT)
Risk Management: Built-in R:R calculator with customizable stops and targets
🎨 Customization Options
Multiple color schemes for bull/bear zones
Adjustable inner box percentage
Confluence highlighting (bright colors when HTF1 & HTF2 align)
Show/hide individual components
BTC correlation tracking (optional)
⚙️ Technical Specifications
Maximum Display: Up to 50 FVGs per type (HTF1 Bull/Bear, HTF2 Bull/Bear)
Fill Tracking: Monitors touched vs. untouched zones
Lookback Period: Configurable (default: 100 bars for current TF confluence)
Body Close Requirement: Optional strict mode for cleaner signals
📈 Best Used For
Gold (XAU/USD) day trading
Institutional order flow analysis
High-probability reversal setups
Multi-timeframe confirmation strategies
Risk-reward optimization
🔒 Access & Support
This is a private indicator. Contact the owner for details about access and usage.
Disclaimer: This indicator is a tool for technical analysis. Past performance does not guarantee future results. Always use proper risk management and trade responsibly.
Short Version (if space is limited):
FVG Dual HTF - Professional Fair Value Gap System
Advanced FVG detector with dual higher timeframe analysis, intelligent strength scoring (0-11), and multi-timeframe confluence detection. Features sweet spot entry zones, automatic R:R lines, real-time IN ZONE alerts, and comprehensive market intelligence table.
Highlights:
🎯 Dual HTF monitoring (15m/60m default)
⭐ Strength scoring with current TF confluence (★)
📊 Color-coded ratings: Lime (8+) / Yellow (5-7) / Gray (<5)
🎨 Sweet spot inner boxes with BUY/SELL signals
🔔 Professional alert system
💰 Built-in position sizing calculator
📈 Gold Daily/Hourly + BTC bias tracking
Optimized for Gold and BTC. Multiple fill methods, customizable colors, and extensive settings.
Contact owner for access details.
SM Screener — Alert Engine (Tiered)🔥 Momentum Radar — Powered by My Premium All-In-One Signal Engine
This isn’t just another screener.
This is the official early-warning radar that plugs directly into my Premium All-In-One Buy/Sell Signal Tool.
The Premium version is where the real executions happen — the legitimate Buy and Sell signals, trend flips, squeeze confirmations, BOS/CHOCH tracking, and high-accuracy momentum logic.
But this?
This is the scanner that tells you where to look BEFORE the big move happens.
If the Premium tool is the weapon…
this screener is the radar locking onto targets.
🚀 What It Actually Does
It monitors every ticker on your chart and fires alerts the moment a symbol starts showing:
✔ Early momentum ignition
✔ Rising relative volume
✔ Trend pressure shifting
✔ Volatility expansion
✔ Early squeeze build-up
✔ Clustered signal behavior
✔ High-tier conviction score
These alerts tell you exactly which tickers to pull up in your Premium tool so you can inspect the chart deeper with full confirmation.
If you're serious about catching explosive moves, this combo is unreal.
💥 Designed for Traders Who Want the Monster Moves
This system is built for the same plays that create legends — the massive momentum runners and wild squeezes like the $4 → $400+ SMX eruption.
The goal is simple:
**Find the move early.
Confirm it with the Premium tool.
Then ride it with confidence.**
⚡ Alert Engine That Feels Like Insider Info
Every alert is laser-targeted:
🔥 Early Interest — tells you something is heating up
🔥 Entry Signal — means the ticker is firing on all cylinders
🔥 Volume bursts
🔥 Momentum flips
🔥 High conviction score
🔥 Trend strength alignment
You get notified instantly so you never miss the tickers entering “potential explosion mode.”
Perfect for:
→ Custom automation
→ Watchlist building
📈 A Complete Momentum Ecosystem
This isn’t a standalone indicator — it’s part of a full ecosystem:
1️⃣ The Premium All-In-One Tool (master)
→ Generates true Buy/Sell signals
→ Full trend model
→ Squeeze engine
→ Premium/discount logic
→ Volume & volatility confirmation
→ BOS/CHOCH structure tracking
2️⃣ THIS Screener Engine (scanner)
→ Alerts you which tickers deserve attention
→ Filters out noise
→ Points you to the potential runners
→ Helps you never miss the early setups
Together, they’re unreal.
⭐ Follow for More
This is only one piece of a growing suite of professional-grade tools I’m publishing.
If you want:
🔥 More scanners
🔥 Predictive momentum engines
🔥 AI-grade alert logic
🔥 My official Premium trading toolkit
Hit Follow — new releases drop frequently.
Trade smart.
Trade fast.
And catch the ones everyone else regrets missing.

Multi Condition Stock Screener & Alert SystemMulti Condition Stock Screener & Strategy Builder
This script is a comprehensive Stock Screener and Strategy Builder designed to scan predefined groups of stocks (specifically focused on BIST/Istanbul Stock Exchange symbols) or a custom list of symbols based on user-defined technical conditions.
It allows users to combine multiple technical indicators to create complex entry or exit conditions without writing code. The script iterates through a list of symbols and triggers alerts when the conditions are met.
Key Features
• Custom Strategy Building: Users can define up to 6 separate conditions. • Logical Operators: Conditions can be linked using logical operators (AND / OR) to create flexible strategies. • Predefined Groups: Includes 14 groups of stocks (covering BIST symbols) for quick scanning. • Custom Scanner: Users can select the "SPECIAL" group to manually input up to 40 custom symbols to scan. • Directional Scanning: Capable of scanning for both Buy/Long and Sell/Short signals. • Alert Integration: Generates JSON-formatted alert messages suitable for webhook integrations (e.g., sending notifications to Telegram bots).
Supported Indicators for Conditions
The script utilizes built-in ta.* functions to calculate the following indicators:
• MA (Moving Average): Supports EMA, SMA, RMA, and WMA. • RSI (Relative Strength Index) • CCI (Commodity Channel Index) • ATR (Average True Range) • BBW (Bollinger Bands Width) • ADX (Average Directional Index) • MFI (Money Flow Index) • MOM (Momentum)
How it Works
The script uses request.security() to fetch data for the selected group of symbols based on the current timeframe. It evaluates the user-defined logic (Condition 1 to 6) for each symbol.
• Comparison Logic: You can compare an indicator against a value (e.g., RSI > 50 ) or against another indicator (e.g., MA1 CrossOver MA2 ). • Signal Generation: If the logical result is TRUE based on the "AND/OR" settings, a visual label is plotted on the chart, and an alert condition is triggered.
Alert Configuration
The script produces a JSON output containing the Ticker, Signal Type, Period, and Price. This is optimized for users who want to parse alerts programmatically or send them to external messaging apps via webhooks.
Disclaimer This tool is for informational purposes only and does not constitute financial advice. Since it uses request.security across multiple symbols, please allow time for the script to load data on the chart.

3x ORB Alerts (JSON webhook, 3 ORBs)2× ORB Alerts (JSON Webhook, ORB4 + ORB5) is a clean, lightweight multi-session Opening Range Breakout (ORB) alert engine designed for automated trading systems using TradingView webhooks.
This indicator provides up to 3 independent ORB windows, each with:
Custom session time
Custom cutoff time (HHMM or HH:MM)
First-close breakout detection (Up or Down)
Dedicated alert conditions
Persistent ORB range + breakout price
Full JSON webhook output for bots
No boxes, no lines, no visual clutter (performance-optimized)
✔️ What this indicator does
Tracks ORB high/low during the selected session
Locks the range once the session ends
Waits for a valid breakout (close > high or close < low)
Triggers alerts only once per ORB per day
Sends a clean JSON payload to your trading bot
✔️ Webhook JSON includes
Symbol
Timeframe
ORB window number (1–3)
Breakout direction
Break price
ORB range
ATR (optional filtering)
Close price
Timestamp
Custom API key
✔️ Why this script exists
This indicator is built specifically for automated ORB trading bots, where reliability, clean signals, and low-latency alerts are critical.
No repainting, no noise — just clear breakout confirmations for fully automated systems.
✔️ Use Cases
Futures (GC, NQ, ES, CL, FDAX, etc.)
Forex session breakout strategies
Crypto ORB systems (BTC, ETH)
Multi-session automated strategies
Proprietary trading automation
✔️ How to use
Set up 1,2,3 ORB sessions
Add corresponding alert conditions
Select "Once per bar close"
Paste your webhook URL
Your trading bot receives a JSON package on every breakout

2x ORB Alerts (JSON webhook, ORB4 + ORB5)2× ORB Alerts (JSON Webhook, ORB4 + ORB5) is a clean, lightweight multi-session Opening Range Breakout (ORB) alert engine designed for automated trading systems using TradingView webhooks.
This indicator provides 2 independent ORB windows, each with:
Custom session time
Custom cutoff time (HHMM or HH:MM)
First-close breakout detection (Up or Down)
Dedicated alert conditions
Persistent ORB range + breakout price
Full JSON webhook output for bots
No boxes, no lines, no visual clutter (performance-optimized)
✔️ What this indicator does
Tracks ORB high/low during the selected session
Locks the range once the session ends
Waits for a valid breakout (close > high or close < low)
Triggers alerts only once per ORB per day
Sends a clean JSON payload to your trading bot
✔️ Webhook JSON includes
Symbol
Timeframe
ORB window number (4&5)
Breakout direction
Break price
ORB range
ATR (optional filtering)
Close price
Timestamp
Custom API key
✔️ Why this script exists
This indicator is built specifically for automated ORB trading bots, where reliability, clean signals, and low-latency alerts are critical.
No repainting, no noise — just clear breakout confirmations for fully automated systems.
✔️ Use Cases
Futures (GC, NQ, ES, CL, FDAX, etc.)
Forex session breakout strategies
Crypto ORB systems (BTC, ETH)
Multi-session automated strategies
Proprietary trading automation
✔️ How to use
Set up to 4&5 ORB sessions
Add corresponding alert conditions
Select "Once per bar close"
Paste your webhook URL
Your trading bot receives a JSON package on every breakout

VWAP and IVP Volatility Screener AlertVWAP and IVP Volatility Screener Alert is a multi-asset, institutional-grade market scanner that combines Auto-Anchored VWAP, Implied Volatility Percentile (IVP), Choppiness Index, Strike Price Structure, and Volume Profile (POC / Value Area) to generate high-probability trade signals across multiple symbols.
Designed for traders who rely on volatility regimes, VWAP interactions, trend confirmation, and strike-based price behavior, this tool automatically evaluates up to 10 assets simultaneously and displays actionable BUY/SELL conditions in a unified dashboard and screener panel.
Key Features
1. Multi-Asset Screener (10 Symbols)
Scans FX, indices, commodities, and metals. Displays RSI, ADX, trend, score, volatility regime, VWAP/POC/Value Area position, IVP, and Choppiness. Custom strike increments per asset.
2. Auto-Anchored VWAP System
Auto anchors by Session, Day, Week, Month, or Auto. Includes VWAP bands and bounce detection to show when price is Above, Below, or interacting with VWAP.
3. Volume Profile + POC / Value Area
Generates intraday/session POC, VAH, and VAL. Detects breaks, retests, and bounce signals.
4. IV Percentile (IVP) Engine
Converts realized volatility into IVP and classifies regimes (EXT.HI → EXT.LO). Supports Favorable, Extreme, and High-Volatility modes for different trading styles.
5. Choppiness Index (CHOP)
Identifies trending vs ranging conditions and feeds directly into scoring and alerts.
6. 11-Criteria Alert System
Alert logic includes RSI, ADX, trend, volume, VWAP, POC/VA, strike proximity, std-dev breaks, IVP, CHOP, and score thresholds. Supports Score-Based or Multi-Criteria modes.
7. Price-to-Strike Mapping
Rounds price to the correct strike ladder, detecting reversals, continuation, breakout levels, and helping frame stop-loss/TP zones.
8. Session-Aware Filtering
Filters signals for Asian, London, and NY sessions with custom timezone support.

Pi Cycle BTC Top + Pre-Alert BandsPi Cycle BTC Top + Pre-Alert Bands is an advanced implementation of the classic Pi Cycle Top model, designed for Bitcoin cycle analysis on higher timeframes (especially 1D BTCUSD/BTCUSD·INDEX).
The original Pi Cycle Top uses two moving averages:
• 111-day SMA (short MA)
• 350-day SMA ×2 (long MA)
A Pi Top is signaled when the 111 SMA crosses above the 350×2 SMA. Historically, this has occurred near major BTC cycle highs.
This script extends that idea with a 3-step early-warning sequence:
• Pi Green – early compression: short/long MA ratio crosses upward into the green band (convergence from below is required).
• Pi Yellow – mid-cycle warning: only fires if a valid Green has already occurred in the same cycle.
• Pi Cycle Top – final top: the classic Pi Cycle cross, limited to one top signal per cycle. After a top, no new Yellow or Top signals can appear until a new Green event starts the next cycle.
Background shading shows the active phase (Green / Yellow / late-cycle zone), so you can see at a glance where BTC is within its Pi-based macro structure.
All logic is non-repainting: request.security() uses lookahead_off and no future data is accessed.
Typical use
This indicator is intended as a macro-cycle timing and risk-awareness tool, not a stand-alone entry system. Many traders use it to:
• Watch for Pi Green as the start of a potential late-cycle advance.
• Treat Pi Yellow as a rising-risk environment and tighten risk management.
• Use the Pi Cycle Top as a historical high-risk zone where large profit-taking or hedging may be considered.
Always combine this with your own analysis (trend, volume, on-chain, macro) before making decisions.
How to set alerts
Add the indicator to your chart (1D BTCUSD or BTCUSD·INDEX recommended).
Click Alerts → Condition → Pi Cycle BTC Top + Pre-Alert Bands.
Choose one of:
• Pi Cycle – Green Pre-Alert (early convergence)
• Pi Cycle – Yellow Pre-Alert (after Green only)
• Pi Cycle – TOP (Single per Cycle, after Green)
Use “Once per bar close” for higher-timeframe reliability.
Disclaimer
This tool is for educational and analytical purposes only. The Pi Cycle concept is based on historical behavior and does not guarantee future results. This is not financial advice; always do your own research and manage risk appropriately.

WASDE Dates V2WASDE Dates V2 – USDA Release Calendar with Alerts, Countdown & Event Markers
By cot-trader.com
WASDE Dates V2 is a complete and reliable visualization tool for all scheduled WASDE (World Agricultural Supply and Demand Estimates) releases for 2025 and 2026.
The USDA’s WASDE report is one of the most market-moving fundamental catalysts in agricultural futures—affecting Corn (ZC), Wheat (ZW), Soybeans (ZS), Soymeal (ZM), Soybean Oil (ZL), and many related CFD products.
This script gives traders a precise timing layer directly inside their TradingView charts.
🔍 What this script does
WASDE Dates V2 automatically:
Marks each WASDE release day with a vertical line and label.
Shows an automated countdown to the next WASDE release:
In days (>24h)
In hours & minutes (<24h)
Displays an optional table of upcoming WASDE dates for quick reference.
Provides two alert conditions:
WASDE Day Alert – triggers exactly on the event
WASDE 24h Reminder – pre-alert when less than 24 hours remain
Handles both 2025 and 2026 confirmed dates.
Works on any symbol and timeframe.
📌 Why WASDE matters
The WASDE report updates global supply and demand estimates for:
Corn
Soybeans
Wheat
Other major agricultural commodities
Changes in yield, acres, production, imports/exports, and ending stocks can cause immediate and significant volatility.
Many traders combine WASDE awareness with seasonality, COT positioning, volatility filters, or fundamental models.
This script ensures you never miss the timing of these key releases.
⚙️ How the script works
The script stores official USDA WASDE release dates for 2025 and 2026 in two dedicated arrays.
On every bar, it compares the bar’s timestamp with known WASDE timestamps to detect an event day.
When an event occurs:
A red “WASDE” label is plotted above the candle
A dotted vertical line is drawn through the bar
It finds the next upcoming WASDE by scanning forward through both arrays.
A live-updating countdown label is displayed, showing days or hours/minutes until release.
If the event is less than 24 hours away:
A yellow “WASDE soon” warning appears near price
The 24h alert condition becomes active
An optional table lists upcoming events for 2025 & 2026.
This script does not generate trading signals.
It provides a time-based event layer designed to complement any discretionary or algorithmic trading approach.
🧭 How to use
Add the script to your chart.
Enable alerts for:
“WASDE Day Alert”
“WASDE 24h Reminder”
Follow the countdown to prepare for upcoming volatility.
Use together with other agricultural tools such as:
Seasonality indicators
COT (Commitment of Traders) analysis
Trend / VWAP / Volume signals
Pre- and post-WASDE trading strategies
Works on all chart types, all symbols, and all timeframes.
📅 Included WASDE Dates (Confirmed)
2025:
Jan 12, Feb 11, Mar 11, Apr 10, May 12, Jun 12, Jul 11, Aug 12, Sep 12, Oct 9, Nov 10, Dec 9
2026:
Jan 12, Feb 10, Mar 10, Apr 9, May 12, Jun 11, Jul 10, Aug 12, Sep 11, Oct 9, Nov 10, Dec 10
(All dates based on USDA’s official 12:00pm ET schedule.)
💡 What makes this script original
Fully updated 2025 + 2026 calendar
Uses a robust time-comparison method for accurate marking
Unique dual alert system (event + 24h pre-alert)
Clean, readable layout with countdown + upcoming dates table
Tailored specifically for grain & agricultural traders
Built entirely in Pine Script v6 with careful attention to performance

ORB 30 Alerts (ATH)Overview
ATH ORB 30m automates the Opening Range Breakout (ORB) process across multiple global sessions — Tokyo, London, and New York — and delivers clean, consolidated alerts when fresh breakouts occur.
It’s built for traders who track several tickers and want precise, non-repeating signals that reflect genuine momentum shifts, not constant noise.
How it works
The script defines a 30-minute Opening Range (ORB) for each enabled session and plots its high, low, and midpoint levels.
Every 10-minute candle close is evaluated to detect first-time crosses of those range boundaries — upward or downward.
Once a breakout triggers, that side’s alert is disabled until price returns inside the range, where the system automatically re-arms.
Multiple triggers in the same bar are batched into one combined alert, listing all symbols that broke out.
A built-in debug panel and optional chart labels visualize each trigger and re-arm event in real time.
Key features
-Multi-session ORB logic (Tokyo, London, New York)
-10-minute confirmation filter to validate breakouts
-Automatic alert re-arming when price re-enters range
-Combined per-bar alert messages (no duplicates)
-Optional on-chart labels and debug diagnostics
-Optimized for watchlists and multi-symbol scanners
Usage
Designed for day traders and momentum scalpers, this tool highlights early directional strength during market opens.
Add it to your chart, enable your preferred sessions, and set alert conditions for “ORB Breakouts (BUY),” “ORB Breakdowns (SELL),” or "Any alert() function call" You’ll receive one concise message each bar showing exactly which symbols broke out and in which direction.
DISCLAIMER:
This script is for educational and informational purposes only.
It does not constitute financial advice or a recommendation to buy or sell any security.
Always perform your own due diligence and backtesting before using any trading strategy live.
Trading involves risk; past performance does not guarantee future results.

Multi-Timeframe SMA + AlertsThis indicator displays the Simple Moving Average (SMA) across multiple timeframes simultaneously on your chart. It helps traders quickly visualize trend direction across different intervals without switching charts.
Features:
Multi-Timeframe SMA: Shows SMA for multiple timeframes (1m, 3m, 5m, 15m, 30m by default; visibility customizable).
Customizable SMA Length: Choose any SMA length to suit your trading strategy.
Colored SMAs: Each timeframe is represented with a distinct color for easy differentiation.
Price vs SMA Table: Displays SMA values and whether the current price is Above, Below, or At the SMA for each timeframe.
Chart Labels: Marks the last SMA values on the chart for quick reference.
Alerts: Set alerts when price crosses above or below any timeframe’s SMA, with clear messages indicating the timeframe and price.
Customizable Inputs: Select which SMAs to display and define the SMA length.
Use Cases:
Identify short-term vs. longer-term trend alignment.
Spot potential entry or exit points when price crosses the SMA on multiple timeframes.
Keep track of SMA relationships without constantly switching timeframes.
How to Use:
Add the indicator to any chart.
Choose which timeframes’ SMAs to display.
Set the SMA length according to your strategy.
Optionally, set alerts for crossovers or crossunders.
Use the table and labels to monitor SMA levels at a glance.
Tips:
Combine with other indicators for confirmation of trend direction.
Use alerts to avoid constantly watching the chart.

Camarilla D/W/M, Alerts, TP/SL, ADX, EMA, Volume# Camarilla Levels Pro - Advanced Trading Indicator
## 📊 **Overview**
A sophisticated Camarilla levels indicator with multiple timeframe support, advanced filtering, and comprehensive trading statistics. Designed for professional traders seeking precise entry/exit points with robust risk management.
## 🎯 **Key Features**
### **Multi-Timeframe Camarilla Levels**
- **D/W/M Timeframes**: Calculate levels from Daily, Weekly, or Monthly data
- **Accurate Calculations**: Uses previous period's High, Low, Close for precise level calculation
- **6 Key Levels**: H3, H4, H5 (Resistance) and L3, L4, L5 (Support)
### **Advanced Entry Signals**
- **4 Trading Scenarios**:
- LONG 1: Price crosses above H4 with stop at H3, target at H5
- LONG 2: Price crosses above L3 with stop at L4, target at H3
- SHORT 1: Price crosses below L4 with stop at L3, target at L5
- SHORT 2: Price crosses below H3 with stop at H4, target at L3
### **Smart Filtering System**
- **ADX Filter**: Confirms trend strength (configurable threshold)
- **Volume Filter**: Ensures significant volume participation
- **EMA Filter**: Aligns with trend direction (50-period default)
- **Flexible Combination**: Use any combination of filters
### **Non-Repainting Signals**
- **Signal Protection**: Once triggered, signals don't disappear or repaint
- **Executed Signal Tracking**: Historical record of all filled positions
- **Visual Confirmation**: Clear distinction between potential and executed trades
### **Comprehensive Alert System**
- **Entry Alerts**: Buy/Sell signals with level information
- **Exit Alerts**: TP/SL notifications with profit/loss data
- **Customizable**: Set alerts for specific conditions only
### **Professional Risk Management**
- **Auto TP/SL**: Automatic take-profit and stop-loss levels
- **Position Tracking**: Monitors active trades with real-time P/L
- **Single Position**: Prevents over-trading with one active position rule
### **Advanced Statistics**
- **Trade Analytics**: Total trades, win rate, profitability
- **Performance Metrics**: Total profit %, average trade performance
- **Real-time Monitoring**: Current position status and filter status
- **Visual Table**: Clean statistics display in corner
## ⚙️ **Customization Options**
### **Display Settings**
- Toggle level labels, signals, TP/SL markers, and statistics
- Adjust visual styles and sizes for clarity
- Right-positioned labels to avoid chart clutter
### **Filter Configuration**
- **ADX**: Length (14) and threshold (20) settings
- **Volume**: Period (20) and multiplier (1.2x) adjustment
- **EMA**: Customizable period (50 default)
### **Timeframe Selection**
- Daily levels for intraday trading
- Weekly levels for swing trading
- Monthly levels for position trading
## 📈 **Trading Strategy**
### **Entry Logic**
1. **Breakout Confirmation**: Price must cross and hold beyond level
2. **Filter Validation**: All active filters must pass conditions
3. **Single Position**: No new entries while position is active
### **Exit Logic**
- **Take Profit**: Automatic at calculated target levels
- **Stop Loss**: Automatic at calculated risk levels
- **Visual Feedback**: Green circles for TP, Red X for SL
### **Risk Management**
- Pre-defined risk/reward ratios based on Camarilla mathematics
- No pyramiding or multiple position risks
- Clear visual tracking of active trade parameters
## 🎨 **Visual Features**
- **Clean Level Display**: Gray circles for unobtrusive level marking
- **Signal Markers**: Tiny triangles for executed entries
- **Exit Markers**: Tiny circles (TP) and X (SL) for clear exits
- **Statistics Table**: Professional performance monitoring
- **Right-Aligned Labels**: Prevents chart congestion
## 🔔 **Alert Conditions**
- **Buy Signals**: LONG 1 or LONG 2 conditions met
- **Sell Signals**: SHORT 1 or SHORT 2 conditions met
- **Exit Alerts**: TP or SL hit for both long and short positions
## 💡 **Professional Use Cases**
- **Day Trading**: Use Daily levels with volume filter
- **Swing Trading**: Use Weekly levels with ADX trend confirmation
- **Position Trading**: Use Monthly levels with EMA trend alignment
- **Strategy Testing**: Comprehensive statistics for backtesting
This indicator provides institutional-grade Camarilla analysis with professional risk management tools, making it suitable for traders of all experience levels seeking systematic trading approaches with clear entry/exit rules.

Strat 1-2 Break AlertsThe Strat 1-2 Break Alerts
by Yolanda Marie Dixon
This indicator automatically identifies Inside Bars (1) and alerts when price breaks out into a 2-1-2 Bullish or 2-1-2 Bearish setup — two of the most actionable patterns in The Strat methodology created by Rob Smith.
📊 What It Does:
Marks Inside Bars with a yellow triangle below the candle.
Plots a green “2-1-2↑” triangle when a bullish breakout occurs.
Plots a red “2-1-2↓” triangle when a bearish breakdown occurs.
Provides built-in alerts so traders never miss a 2-1-2 setup.
💡 How to Use It:
Add the indicator to your chart, then go to Alerts → Create Alert → Condition: Strat 1-2 Break Alerts, and choose either 2-1-2 Up or 2-1-2 Down.
Perfect for traders who follow The Strat and want simple, reliable visual and alert-based signals for 1-2 setups.
—
🔔 Stay ready, stay Stratified.
Master The Strat with instant alerts for every 2-1-2 breakout.

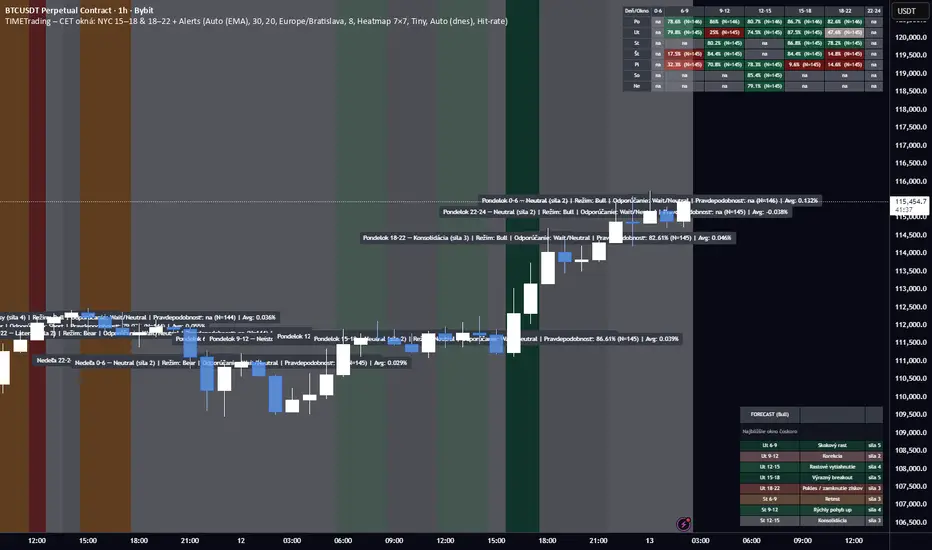
TIME-Trading Indicator + AlertsWhat it is
A Pine Script study that profiles intraday behavior by day+time windows in CET/CEST, verifies it on history, colors the chart by the expected bias & strength, shows tables/heatmaps with backtest stats, and can alert at the start of each window with a full trading summary.
Core ideas
Day is split into 7 CET windows: 0–6, 6–9, 9–12, 12–15, 15–18, 18–22, 22–24
(NYC is unified as 15–18 and 18–22 across the whole script.)
For each weekday & window we have an expectation (Bull/Bear/Neutral/Chop) with a strength 1–5 and a label (e.g., “Skokový rast”, “Výplach”…).
Script backtests those expectations on your chart’s history:
Computes return of each window (log-return from first bar open to last bar close of the window).
Counts Hit-rate (bull window = return>0; bear window = return<0; neutral/chop excluded).
Tracks Avg % drift, t-stat, and sample size N.
Trend regime (Auto/Manual)
Auto (EMA): price vs EMA(length) on a higher timeframe (configurable) + optional slope filter.
Manual override: Bull / Bear / Neutral.
Regime is read without look-ahead (uses previous bar’s regime when closing a window).
What you see
Background shading of the current window
– color family by category (green=bull, red=bear, gray=neutral, orange=chop), shade by strength 1–5.
Optional labels on window change with regime + label text (“Bull • Najsilnejší rast týždňa”).
Forecast panel (bottom-right) listing the next X windows with label & strength.
Results tables (three views):
Heatmap 7×7 (default): weekday × window grid, each cell shows one metric (toggle among Hit-rate / Avg % / t-stat).
Deň (stránkovanie): full stats for a single day (N, Hit-rate, Avg %, t, label).
Split 2× (dlhá): two stacked tables (Mon–Thu, Fri–Sun) to fit small screens.
Alerts (window start)
Optionally fire at the start of every window.
Message includes: weekday + window, expectation label, strength, current regime, recommended action (Long/Short/Wait), Hit-rate %, Avg %, and N.
Create alerts in TV with Condition → Any alert() function call (so the script’s dynamic text is used).
Optional filters (easy to add/adjust): min N, min Hit-rate, only Bull/Bear windows.
Inputs you control
Regime mode, EMA length, higher-TF for trend check, require EMA slope.
CET/CEST timezone (uses “Europe/Bratislava” by default).
Toggles: background, labels, forecast, results view, table text size, heatmap metric.
Alert enable; (we can add min-N / min-HR filters if you want them by default).
How stats are computed (important)
A window’s return is measured strictly inside the window (open of first bar → close of last bar).
The window is credited to the correct weekday even across midnight.
Hit-rate uses only directional windows (Bull/Bear). Neutral/Chop are excluded.
Best practices
Use chart TF that divides an hour (5/15/30/60m) so window boundaries align cleanly.
Read the heatmap primarily by Hit-rate (signal reliability) and cross-check with Avg % (effect size) and t-stat (significance).
Trade at the start of a strong window in the direction of the current regime, exit time-based (end of window) or on PT/SL.
If you want, I can also:
mask/show only cells with N ≥ threshold,
add NYC sub-split toggle off/on,
export stats to CSV,
or add webhooks-friendly compact alert strings.
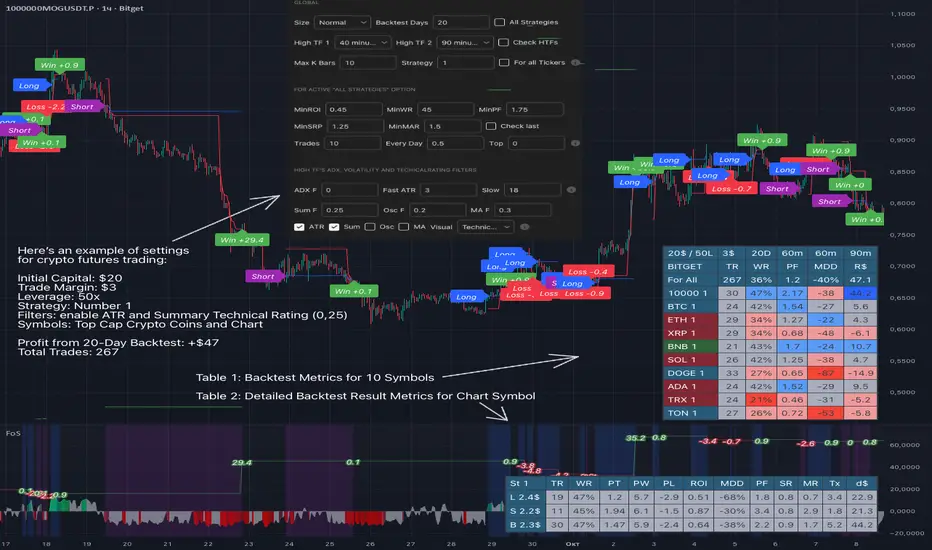
Force of Strategy (FoS, Multi TF/TA, Backtest, Alerts)Introducing the FoS Trading System
A comprehensive and innovative solution designed for both novice and experienced traders to enhance their intraday trading.
The basic idea of creating this script is to stay profitable in any market
Key Features:
There are over 25 no-repaint strategies for generating buy and sell signals to choose from
10 symbols for simultaneous trading
Webhook alerts in TTA format (tradingview to anywhere) pre-configured to send messages for trading cross-margin futures on major Crypto Exchanges: Binance, Bitget, BingX, Bybit, GateIO and OKX
A unique automated "Strategy switcher" feature for backtesting and live trading—not just a specific strategy, but the logic behind choosing a trading one or another strategy based on backtesting data obtained in real time
Advanced risk management options and backtest result metrics
Higher Timeframe filters (Technical Rating, ADX, Volatility) and ability for check backtest results with 9 main higher timeframes
Buy and sell signals are generated using TradingView Technical Ratings, indicators with adaptive length algorithms and various classic indicators with standard settings to avoid overfitting
Next, I will describe in detail what this script does and what settings it operates with:
"All Strategies" off
- In the global settings block, as shown in the main chart screenshot, you select how long the script will perform backtests in days, with a limitation on the number of bars for calculations. This limitation is necessary to maintain an acceptable calculation speed. You also choose which two higher timeframes we will use for signal and filters when confirming the opening of trades
- With "All Strategies" off - as in the example on the main chart screenshot, trading is carried out by strategy #1 on 10 selected tickers simultaneously. By default, I selected the 9 top-capitalized cryptocurrencies on the Bitget exchange and the chart symbol. You can change that choice of 9 non chart opened instruments and # strategy for each them
- The first row in the table 1 shows some of the main choosen script settings, in attached example: initial capital 20$, leverage 50L, 20 backtest days, 3$ is invest in one deal, 60m - is chart timeframe, next 60m is higher timeframe 1 and last 90m is higher timeframe 2. In first column you see shortened to 5 characters ticker names
- The exchange name in the second row determines the alert messages format
I've attached another example of trading with setting "All strategies" off in the image below. In this example, trading 10 standard symbols on an hourly timeframe, 2 coins from 10: 1000SATS and DOGE have generated a profit of over $65 over the past 20 days using strategy #4
Can you browse a wide range of trading instruments and select the 10 best strategies and settings for future trading? Of course, trading is what this script is do!
The parameters in the table 1 mean the following:
TR - count of closed trading deals
WR - Winning Rate, PF - Profit Factor
MDD - Max Draw Down for all calculated time from initial capital
R$ - trading profit result in usd
The parameters in the table 2 is just more metrics for chart symbol:
PT - result in usd Per one Trade
PW - result Per Win, PL - result Per Lose
ROI - Rate of Investments
SR - Sharpe Ratio, MR - CalMAR ration
Tx - Commision Fee in Usd
R$ - trading profit result in usd again
Table 2 separate trade results of backtesting for longs and shorts. In first column you see how many USD were invested in one trade, taking into account possible position splitting (will be discussed in more detail in the risk management section)
Settings:
"All Strategies" on, "Check Last" off
When "All Strategies" is active, trading changed from 10 symbols and one strategy to all strategies and one chart symbol. If option "Check Last" is inactive you will see backtest results for each of strategy in backtest setting days. This is useful, for example, if you want to see backtest results under different settings over a long period of time for calibrating risk management or entry rules
"All Strategies" on, "Check Last" on
- If "All Strategies" and "Check Last" is active trading will occur on the chart symbol only for those strategies that meet the criteria of the settings block for the enabled "All Strategies" option. For example your criteria is: for last 5 trades for all strategies, open next trade only on strategy which reached ROI 25% and WinRate 50%. When strategy with this setting criteria receive Buy or Sell Signal this trade will be opened, and when trade will be close "check last" will repeat. This feature i called "Strategy switcher"
-In Table 1 if strategy meet criteria you will see "Ok" label, if strategy meet criteria and have maximum from other reached ROI they labeled "Best". Chart strategy labeled "Chart", Chart and Ok labels in one time is "Chart+", "Chart" and "Best" is labeled "Best+"
- The color in the first column of table 1 indicates that the strategy is currently in an open position: green means an open long position, red means an open short position.
In picture bellow you will see good example for trading with check results for last 10 trades, and make desicion for trading when criteries 0.25 ROI and WinRate 50% reached for Top 2 by ROI strategies from all list of them. This example of trading logic in last 20 days (include periods when strategy don't arise 10 trades) give a profit $30+. At the bottom of the screen, you can see Labels with the numbers of the strategies that opened the trades. In this example, trades were primarily opened using strategy number 2, and the second most effective strategy after the 20-day backtest was strategy number 9
Who can promise you'll make a profit of $30 in the next 20 days with a drawdown of no more than $8 from the initial $20 with invest in one trade just 2.7$? No one. But this script guarantees that in the future it will repeat the same logic of switching trading strategies that brought profit over the last 20 days
Risk management options
- When a buy or sell trade is opened, you'll see three lines on the chart: a red stop-loss line (SL), a green take-profit line (TP), and a blue line representing the entry price. The trade will be closed if the high price or low price reaches the line TP or SL (no wait for bar close) and alert will be triggered once per bar when script recalculates
- Several options are available to control the behavior of SL/TP lines, such as stop-loss by percentage, ATR, or Highest High (HH) and Lowest Low (LL). Take Profit can be in percent, ATR or in Risk Reward ratio. There some Trailing Stop with start trail trigger options, like ATR, percent or HH / LL
- Additionally, in risk managment settings a function has been implemented for adding a position when the breakeven level expressed in the current ROI is reached for opened trade (splitting position). The position is added within the bar.
- Webhook alerts in TTA format with message contained next info : Buy / Sell or adding Quantity, Leverage, SL price, TP price and close trade
Keep in mind if the stop-loss changed when adding a position, the stop-loss will not be able to be higher than the current bar's low price, regardless of your settings, as backtest trades do not use intra-bar data, in this situation SL will be correct at next bar (but alert message don't be sended twice). And please note that this script does not have an option to simultaneously open trades in different directions. Only 1 trade can be opened for 1 trading instrument at a time
Backtest Engine
Backtest is a very important part of this script. Here describe how its calculate:
- Profit or Loss is USD: close trade price * open trade quantity - open trade price * open trade quantity - open trade quantity * (open trade price + close trade price)/2 * commision fee
Possible slippage or alert sending delay needed to be include in commission % which you will set in risk managment settings block, default settings is 0.15% (0,06% for open, 0,06% for close and 0,03% for possible slippage or additional fees)
- Maximum Draw Down: Drawdown = (peak - current equity) / peak * 100 ;
Drawdown > maxDrawdown ? maxDrawdown = Drawdown
- ROI: profit result in USD / sum of all positions margin
- CalMAR Ratio: ROI / (-MaxDrawDown)
- Sharpe Ratio: ROI / standard deviation for (Sum of all Profits and Loses) / (Sum of all Position Margins)
This description was added because in metrics i don't use parameters like "The risk-free rate of return". Keep in mind how exactly this script calculate profit and perfomance when adjusting key criteria in the strategy switching parameters block of script settings
Strategies itself
For trading, you can enable or disable various Higher Timeframes Filters (ADX, volatility, technical rating).
With filters enabled, trades will only open when the setting parameters are reached
- Strategy number 1, 2 and 3: is Higher Timeframe TradingView Technical Ratings itself, 1 is summary total rating, 2 is oscillators and 3 is moving averages. When TR filter cross filter levels trade will be open at chart bar close. By Default on chart you see Summary Technical Rating oscillator, but here the options for change it to Oscillator TR or Moving Average TR
- Strategy number 4, 5 and 6: is Chart TimeFrame TR. Trades will open when its values (Summary, Oscillators and Moving Averages) reached setting buy sell level
- Strategy number 7, 8 and 9: is Alternative buy sell logic for Chart TimeFrame TR, trades will open when counting rising or falling values will be reached
- Strategies with number from 10 to 18: is chosen by user adaptive moving averages and oscillators indicators. There in settings you will see many different adaptive length algorithms for trading and different types of moving averages and oscillators. In tooltips in settings you will find very more information, and in settings you will see list of all indicators and algorithms (more than 30 variations). All adaptive strategies have their options in settings for calibrating and plotting
- Strategies with number from 19: its can't be chosen or calibarted, this is needed for avoid overfitting, i try to found mostly time worked strategies and use its with standard settings. In future it's possible to changing current or adding additional strategies. At the time of publication this script uses: Dynamic Swing HH LL (19), Composite indicator (20), %R Exhausting with different signals (21,22,23), Pivot Point SuperTrend (24), Ichimoku Cloud (25), TSI (26), Fib Level RSI (27). I don't plot classic strategies in this script
Let me explain, the value of this script is not in the strategies it includes, but in how exactly it collects the results of their work, how it filters the opening of trades, what risk management it applies and what strategy switching logic it performs. The system itself that you are now reading about represents the main value of this script
Finally if you get access for this script
- You will see many other not described options and possibilities like Kelly position or list of settings for adaptive strategies, also i added many usefull tooltips in script settings
Happy trading, and stay tuned for updates!
DISCLAIMER: No sharing, copying, reselling, modifying, or any other forms of use are authorized for this script, and the information published with them. This script is strictly for individual use. No one know future and Investments are always made at your own risk. I am not responsible for any losses you may incur. Please before investment make sure that chosen logic is enaugh profitable on virtual demo account.
AI Trading Alerts v6 — SL/TP + Confidence + Panel (Fixed)Overview
This Pine Script is designed to identify high-probability trading opportunities in Forex, commodities, and crypto markets. It combines EMA trend filters, RSI, and Stochastic RSI, with automatic stop-loss (SL) & take-profit (TP) suggestions, and provides a confidence panel to quickly assess the trade setup strength.
It also includes TradingView alert conditions so you can set up notifications for Long/Short setups and EMA crosses.
⚙️ Features
EMA Trend Filter
Uses EMA 50, 100, 200 for trend confirmation.
Bull trend = EMA50 > EMA100 > EMA200
Bear trend = EMA50 < EMA100 < EMA200
RSI Filter
Bullish trades require RSI > 50
Bearish trades require RSI < 50
Stochastic RSI Filter
Prevents entries during overbought/oversold extremes.
Bullish entry only if %K and %D < 80
Bearish entry only if %K and %D > 20
EMA Proximity Check
Price must be near EMA50 (within ATR × adjustable multiplier).
Signals
Continuation Signals:
Long if all bullish conditions align.
Short if all bearish conditions align.
Cross Events:
Long Cross when price crosses above EMA50 in bull trend.
Short Cross when price crosses below EMA50 in bear trend.
Automatic SL/TP Suggestions
SL size adjusts depending on asset:
Gold/Silver (XAU/XAG): 5 pts
Bitcoin/Ethereum: 100 pts
FX pairs (default): 20 pts
TP = SL × Risk:Reward ratio (default 1:2).
Confidence Score (0–4)
Based on conditions met (trend, RSI, Stoch, EMA proximity).
Labels:
Strongest (4/4)
Strong (3/4)
Medium (2/4)
Low (1/4)
Visual Panel on Chart
Shows ✅/❌ for each condition (trend, RSI, Stoch, EMA proximity, signal now).
Confidence row with color-coded strength.
Alerts
Long Setup
Short Setup
Long Cross
Short Cross
🖥️ How to Use
1. Add the Script
Open TradingView → Pine Editor.
Paste the full script.
Click Add to chart.
Save as "AI Trading Alerts v6 — SL/TP + Confidence + Panel".
2. Configure Inputs
EMA Lengths: Default 50/100/200 (works well for swing trading).
RSI Length: 14 (standard).
Stochastic Length/K/D: Default 14/3/3.
Risk:Reward Ratio: Default 2.0 (can change to 1.5, 3.0, etc.).
EMA Proximity Threshold: Default 0.20 × ATR (adjust to be stricter/looser).
3. Read the Panel
Top-right of chart, you’ll see ✅ or ❌ for:
Trend → Are EMAs aligned?
RSI → Above 50 (bull) or below 50 (bear)?
Stoch OK → Not extreme?
Near EMA50 → Close enough to EMA50?
Above/Below OK → Price position vs. EMA50 matches trend?
Signal Now → Entry triggered?
Confidence row:
🟢 Green = Strongest
🟩 Light green = Strong
🟧 Orange = Medium
🟨 Yellow = Low
⬜ Gray = None
4. Alerts Setup
Go to TradingView Alerts (⏰ icon).
Choose the script under “Condition”.
Select alert type:
Long Setup
Short Setup
Long Cross
Short Cross
Set notification method (popup, sound, email, mobile).
Click Create.
Now TradingView will notify you automatically when signals appear.
5. Example Workflow
Wait for Confidence = Strong/Strongest.
Check if market session supports volatility (e.g., XAU in London/NY).
Review SL/TP suggestions:
Long → Entry: current price, SL: close - risk_pts, TP: close + risk_pts × RR.
Short → Entry: current price, SL: close + risk_pts, TP: close - risk_pts × RR.
Adjust based on your own price action analysis.
📊 Best Practices
Use on H1 + D1 combo → align higher timeframe bias with intraday entries.
Risk only 1–2% of account per trade (position sizing required).
Filter with market sessions (Asia, Europe, US).
Strongest signals work best with trending pairs (e.g., XAUUSD, USDJPY, BTCUSD).

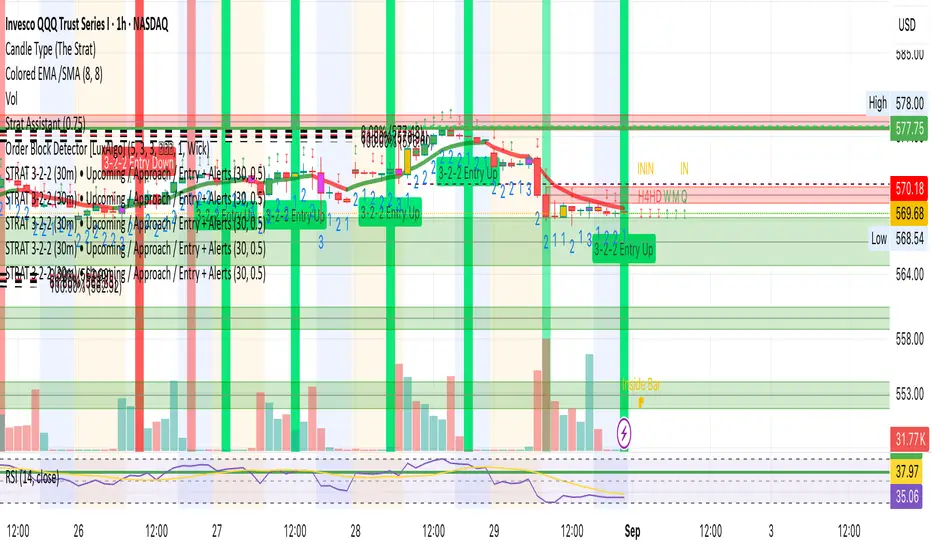
STRAT 3-2-2 (30m) • Upcoming / Approach / Entry + AlertsThis indicator is built for The STRAT trading method, specifically the 3-2-2 reversal pattern. It monitors price action on the 30-minute timeframe (HTF = 30m) and visually/alert-wise highlights where a 3-2-2 setup, approach, or entry trigger occurs.
---
⚙️ How it works
1. Detects bar types:
3 (Outside Bar) = range breaks both high & low of the previous bar
2u (Up bar) = higher high, not outside
2d (Down bar) = lower low, not outside
1 (Inside bar) = fully contained within prior bar
2. Looks for 3-2-2 setups:
Bullish 3-2-2 = 3 → 2d → 2u (expect reversal UP)
Bearish 3-2-2 = 3 → 2u → 2d (expect reversal DOWN)
3. Defines trigger levels:
Bullish trigger = high of the first “2d” bar
Bearish trigger = low of the first “2u” bar
4. Signals 3 phases:
Upcoming: pattern is forming, second “2” hasn’t triggered yet
Approach: price comes within 50% (adjustable) of the trigger level
Entry: price breaks the trigger (actual reversal confirmation)
5. Visualization:
Labels above/below candles show “Approach” and “Entry”
Background or bar colors (toggle in settings) highlight Setup / Approach / Entry
Optional dotted line marks the trigger level for clarity
---
🔔 Alerts
Two alert systems are built in:
1. Safe static conditions (for normal TradingView alert setup):
APPROACH: Bullish 3-2-2 (30m)
APPROACH: Bearish 3-2-2 (30m)
ENTRY: Bullish 3-2-2 (30m)
ENTRY: Bearish 3-2-2 (30m)
2. Dynamic messages (using alert() calls with price info):
If you create an alert with “Any alert() function call”, the pop-up will include the trigger price.
---
📋 Inputs (Settings)
Signal timeframe (HTF) → default 30m
Confirm signals at HTF bar close → waits for bar close (non-repainting)
Approach = % of first '2' bar range → default 50%
Show labels → On/Off
Color candles instead of background → toggle between candle color vs. chart background
EMA Crossover Lines with VWAP, EMA 50/200 and Premarket AlertsOverview
An intraday overlay that combines trend and liquidity cues in one view. It plots your Fast/Slow EMAs, the widely watched EMA-50 and EMA-200, plus VWAP for session bias. During the configured pre-market session, it tracks and projects the pre-market high/low into regular hours—then alerts when price breaks those levels.
What it shows
EMAs: Fast + Slow (user-defined), EMA-50, EMA-200 for trend and crossover context.
VWAP: Session anchor for mean-reversion vs. trend continuation.
Pre-Market Levels: Dynamic Pre-Market High/Low lines (extend into RTH).
Alerts: Triggers when price crosses above pre-market high or below pre-market low (bar-close, non-repainting).
Inputs
Fast EMA Length (default 9)
Slow EMA Length (default 21)
EMA 50 Length (default 50)
EMA 200 Length (default 200)
Pre-market Session (default 04:00–09:30)
Session Timezone (default America/New_York)
How to use
Use EMA-50/200 slope and position to gauge higher-timeframe trend.
VWAP helps identify premium/discount within the day.
Watch pre-market breakouts for momentum entries, or fades back inside for mean reversion.
Combine with your own risk rules; alerts are informational.
Notes
Alerts fire on closed bars to avoid repainting.
Works on most intraday timeframes. Ensure the timezone matches the exchange you trade.
Lines only show when a pre-market session exists for the day.

ORB Breakouts with alerts"ORB Breakouts with Alerts" is a utility indicator that highlights an Opening Range Breakout (ORB) setup during a user-defined intraday time window. It allows traders to visualize price consolidation ranges and receive alerts when price breaks above or below the session high/low.
🔧 Features:
*Customizable session time (start and end), adjustable to local time using a timezone offset.
*Automatically plots:
*A shaded box around the session's high and low.
*Horizontal lines at session high and low levels.
*Optional "BUY"/"SELL" labels to mark breakout directions.
*Visual breakout signals when price crosses above or below the session range.
*Built-in alerts to notify when breakouts occur.
*Configurable styling options including box color, highlight color, and label placement.
⚙️ How It Works:
*During the defined time range, the script tracks the highest high and lowest low.
*After the session ends:
*A box is drawn to represent the opening range.
*Breakouts above the high or below the low trigger visual markers and optional alerts.
*Alerts are limited to one per direction per day to reduce noise.
⚠️ This indicator is a technical analysis tool only and does not provide financial advice or trade recommendations. Always use with proper risk management and in conjunction with your trading plan.

Sunmool's Next Day Model FVG AlertNY Killzone FVG Alert - ICT Fair Value Gap Detection Indicator
This comprehensive Pine Script indicator is specifically designed for traders following ICT (Inner Circle Trader) methodology and Smart Money Concepts. The indicator automatically detects Fair Value Gaps (FVG) that occur during the New York Killzone session, providing real-time alerts when these critical market imbalances are identified.
Key Features:
🎯 Fair Value Gap Detection
Automatically identifies bullish and bearish Fair Value Gaps using the classic 3-candle pattern
Filters gaps based on customizable minimum size thresholds to avoid insignificant imbalances
Provides visual representation through colored boxes and labels for easy identification
⏰ New York Killzone Focus
Specifically monitors the NY Killzone session (default: 7:00 AM - 10:00 AM EST)
Fully customizable session times to accommodate different trading preferences
Only detects FVGs when all three candles forming the gap occur within the killzone timeframe
📅 ICT Next Day Model Compliance
Automatically excludes Mondays from FVG detection as per ICT Next Day Model principles
Optional Monday exclusion can be toggled on/off based on trading strategy
Ensures alignment with professional ICT trading methodologies
🔔 Advanced Alert System
Three distinct alert conditions: Bullish FVG, Bearish FVG, and Combined alerts
Customizable alert messages for different notification preferences
Compatible with TradingView's full alert system including email, SMS, and webhook notifications
🎨 Visual Customization
Adjustable colors for bullish and bearish FVG boxes
Configurable box extension length for better visualization
Optional background highlighting during killzone sessions
Clean, professional chart presentation that doesn't clutter your analysis
📊 Technical Specifications
Works on all timeframes, though most effective on intraday charts (1m, 5m, 15m)
Timezone-aware calculations ensure accurate session detection globally
Efficient code structure minimizes processing load and chart lag
Compatible with other indicators and doesn't interfere with existing chart setups
🎯 Ideal For:
ICT methodology traders seeking automated FVG detection
Smart Money Concepts practitioners
Scalpers and day traders focusing on NY session
Traders looking to identify high-probability entry zones
Anyone interested in market structure and liquidity concepts
📈 Trading Applications:
Fair Value Gaps often serve as areas where price may return to "fill" the imbalance, making them excellent zones for:
Potential reversal areas
Take profit targets
Stop loss placement reference points
Market structure analysis
Confluence with other ICT concepts
⚙️ Customizable Parameters:
FVG minimum size filter
Killzone session start/end times
Visual display options
Alert preferences
Color schemes and styling options
This indicator brings institutional trading concepts to retail traders, helping identify the same market inefficiencies that smart money targets. By focusing specifically on the New York Killzone - one of the most liquid and volatile trading sessions - it provides high-quality signals during optimal market conditions.
Whether you're new to ICT concepts or an experienced trader looking to automate your FVG detection, this indicator provides the precision and reliability needed for professional trading analysis.

Trend Display Table (with Change Alerts)📌 Indicator: Trend Display Table (with Change Alerts)
This indicator helps identify trend direction based on a 15-minute 20 SMA compared against a 10 EMA applied to that SMA.
Trend Logic:
Bullish → 20 SMA crosses above 10 EMA (on SMA values)
Bearish → 20 SMA crosses below 10 EMA (on SMA values)
Neutral → No crossover (trend continues from previous state)
Display:
A compact trend table appears on the chart (top-right), showing the current trend with customizable colors, font size, and background.
Alerts:
Alerts are triggered only when the trend changes (from Bullish → Bearish or Bearish → Bullish).
This prevents repeated alerts on every bar.
✅ Useful for:
Confirming higher timeframe trend bias
Filtering trades in choppy markets
Getting notified instantly when the trend flips

EZ FX Zones (OR Pro + Auto Alerts) v6.3Purpose:
This indicator automatically calculates and plots ORH (Opening Range High) and ORL (Opening Range Low) based on the first X minutes of trading (customizable), then uses those levels to:
Mark clear Buy and Sell Zones on the chart
Show targets based on ATR (Average True Range) or fixed pip/point settings
Automatically trigger alerts when price crosses important levels so you can enter trades in TopstepFX within your 5-minute execution window
What It Plots on the Chart:
Opening Range High (ORH) – top of the initial range (green line)
Opening Range Low (ORL) – bottom of the initial range (red line)
Midpoint – average of ORH and ORL (dotted white line)
Target Levels – projected profit targets above ORH and below ORL (gray dashed lines)
Labels – “BUY ABOVE” and “SELL BELOW” text for instant clarity
How to Use It (Third Grader Mode):
If price breaks above ORH → BUY.
If price breaks below ORL → SELL.
Your target is the nearest dashed line in the trade direction.
Alerts are sent to your phone when:
Price crosses ORH (BUY alert)
Price crosses ORL (SELL alert)
Price hits target levels
Alerts Included:
"BUY Signal – Price Crossed ORH"
"SELL Signal – Price Crossed ORL"
"Target Hit – Long"
"Target Hit – Short"
Why This Helps in TopstepFX:
No guesswork — you only react to breakouts of the first range.
You can trade with confidence in your 5-minute reaction window because the script does all calculations automatically.
You get push alerts on your phone so you don’t have to stare at charts all day.

Mutanabby_AI | Fresh Algo V24Mutanabby_AI | Fresh Algo V24: Advanced Multi-Mode Trading System
Overview
The Mutanabby_AI Fresh Algo V24 represents a sophisticated evolution of multi-component trading systems that adapts to various market conditions through advanced operational configurations and enhanced analytical capabilities. This comprehensive indicator provides traders with multiple signal generation approaches, specialized assistant functions, and dynamic risk management tools designed for professional market analysis across diverse trading environments.
Primary Signal Generation Framework
The Fresh Algo V24 operates through two fundamental signal generation approaches that accommodate different market perspectives and trading philosophies. The Trending Signals Mode serves as the primary trend-following mechanism, combining Wave Trend Oscillator analysis with Supertrend directional signals and Squeeze Momentum breakout detection. This mode incorporates ADX filtering that requires values exceeding 20 to ensure sufficient trend strength exists before signal activation, making it particularly effective during sustained directional market movements where momentum persistence creates profitable trading opportunities.
The Contrarian Signals Mode provides an alternative approach targeting reversal opportunities through extreme market condition identification. This mode activates when the Wave Trend Oscillator reaches critical threshold levels, specifically when readings surpass 65 indicating potential bearish reversal conditions or drop below 35 suggesting bullish reversal opportunities. This methodology proves valuable during overextended market phases where mean reversion becomes statistically probable.
Advanced Filtering Mechanisms
The system incorporates multiple sophisticated filtering mechanisms designed to enhance signal quality and reduce false positive occurrences. The High Volume Filter requires volume expansion confirmation before signal activation, utilizing exponential moving average calculations to ensure institutional participation accompanies price movements. This filter substantially improves signal reliability by eliminating low-conviction breakouts that lack adequate volume support from professional market participants.
The Strong Filter provides additional trend confirmation through 200-period exponential moving average analysis. Long position signals require price action above this benchmark level, while short position signals necessitate price action below it. This ensures strategic alignment with longer-term trend direction and reduces the probability of trading against major market movements that could invalidate shorter-term signals.
Cloud Filter Configuration System
The Fresh Algo V24 offers four distinct cloud filter configurations, each optimized for specific trading timeframes and market approaches. The Smooth Cloud Filter utilizes the mathematical relationship between 150-period and 250-period exponential moving averages, providing stable trend identification suitable for position trading strategies. This configuration generates signals exclusively when price action aligns with cloud direction, creating a more deliberate but highly reliable signal generation process.
The Swing Cloud Filter employs modified Supertrend calculations with parameters specifically optimized for swing trading timeframes. This filter achieves optimal balance between responsiveness and stability, adapting effectively to medium-term price movements while filtering excessive market noise that typically affects shorter-term analytical systems.
For active intraday traders, the Scalping Cloud Filter utilizes accelerated Supertrend calculations designed to capture rapid trend changes effectively. This configuration provides enhanced signal generation frequency suitable for compressed timeframe strategies. The advanced Scalping+ Cloud Filter incorporates Hull Moving Average confirmation, delivering maximum responsiveness for ultra-short-term trading while maintaining signal quality through additional momentum validation processes.
Specialized Assistant Functionality
The system includes two distinct assistant modes that provide supplementary market analysis capabilities. The Trend Assistant Mode activates advanced cloud analysis overlays that display dynamic support and resistance zones calculated through adaptive volatility algorithms. These levels automatically adjust to current market conditions, providing visual guidance for identifying trend continuation patterns and potential reversal areas with mathematical precision.
The Trend Tracker Mode concentrates on long-term trend identification by displaying major exponential moving averages with color-coded fill areas that clarify directional bias. This mode maintains visual simplicity while providing comprehensive trend context evaluation, enabling traders to quickly assess broader market direction and align shorter-term strategies accordingly.
Dynamic Risk Management System
The integrated risk management system automatically adapts across all operational modes, calculating stop loss and take profit targets using Average True Range multiples that adjust to current market volatility. This approach ensures consistent risk parameters regardless of selected operational mode while maintaining relevance to prevailing market conditions.
Stop loss placement occurs at dynamically calculated distances from entry points, while three progressive take profit targets establish at customizable ATR multiples respectively. The system automatically updates these levels upon trend direction changes, ensuring current market volatility influences all risk calculations and maintains appropriate risk-reward ratios throughout trade management.
Comprehensive Market Analysis Dashboard
The sophisticated dashboard provides real-time market analysis including volatility measurements, institutional activity assessment, and multi-timeframe trend evaluation across five-minute through four-hour periods. This comprehensive market context assists traders in selecting appropriate operational modes based on current market characteristics rather than relying exclusively on historical performance data.
The multi-timeframe analysis ensures mode selection considers broader market context beyond the primary trading timeframe, improving overall strategic alignment and reducing conflicts between different temporal market perspectives. The dashboard displays market state classification, volatility percentages, institutional activity levels, current trading session information, and trend pressure indicators with professional formatting and clear visual hierarchy.
Enhanced Trading Assistants
The Fresh Algo V24 includes specialized trading assistant features that complement the primary signal generation system. The Reversal Dot functionality identifies potential reversal points through Wave Trend Oscillator analysis, displaying visual indicators when crossover conditions occur at extreme levels. These reversal indicators provide early warning signals for potential trend changes before they appear in the primary signal system.
The Dynamic Take Profit Labels feature automatically identifies optimal profit-taking opportunities through RSI threshold analysis, marking potential exit points at multiple levels for long positions and corresponding levels for short positions. This automated profit management system helps traders optimize exit timing without requiring constant manual monitoring of technical indicators.
Advanced Alert System
The comprehensive alert system accommodates all operational modes while providing granular notification control for various signal types and risk management events. Traders can configure separate alerts for normal buy signals, strong buy signals, normal sell signals, strong sell signals, stop loss triggers, and individual take profit target achievements.
Cloud crossover alerts notify traders when trend direction changes occur, providing early indication of potential strategy adjustments. The alert system includes detailed trade setup information, timeframe data, and relevant entry and exit levels, ensuring traders receive complete context for informed decision-making without requiring constant chart monitoring.
Technical Foundation Architecture
The Fresh Algo V24 combines multiple proven technical analysis components including Wave Trend Oscillator for momentum assessment, Supertrend for directional bias determination, Squeeze Momentum for volatility analysis, and various exponential moving averages for trend confirmation. Each component contributes specific market insights while the unified system provides comprehensive market evaluation through their mathematical integration.
The multi-component approach reduces dependency on individual indicator limitations while leveraging the analytical strengths of each technical tool. This creates a robust analytical framework capable of adapting to diverse market conditions through appropriate mode selection and parameter optimization, ensuring consistent performance across varying market environments.
Market State Classification
The indicator incorporates advanced market state classification through ADX analysis, distinguishing between trending, ranging, and transitional market conditions. This classification system automatically adjusts signal sensitivity and filtering parameters based on current market characteristics, optimizing performance for prevailing conditions rather than applying static analytical approaches.
The volatility measurement system calculates current market activity levels as percentages, providing quantitative assessment of market energy and helping traders select appropriate operational modes. Institutional activity detection through volume analysis ensures signal generation aligns with professional market participation patterns.
Implementation Strategy Considerations
Successful implementation requires careful matching of operational modes to prevailing market conditions and individual trading objectives. Trending modes demonstrate optimal performance during directional markets with sustained momentum characteristics, while contrarian modes excel during range-bound or overextended market conditions where reversal probability increases.
The cloud filter configurations provide varying degrees of confirmation strength, with smoother settings reducing false signal occurrence at the expense of some responsiveness to price changes. Traders must balance signal quality against signal frequency based on their risk tolerance and available trading time, utilizing the comprehensive customization options to optimize performance for their specific requirements.
Multi-Timeframe Integration
The system provides seamless multi-timeframe analysis through the integrated dashboard, displaying trend alignment across multiple time horizons from five-minute through four-hour periods. This analysis helps traders understand broader market context and avoid conflicts between different temporal perspectives that could compromise trade outcomes.
Session analysis identifies current trading session characteristics, providing context for expected market behavior patterns and helping traders adjust their approach based on typical session volatility and participation levels. This geographic market awareness enhances strategic decision-making and improves timing for trade execution.
Advanced Visualization Features
The indicator includes sophisticated visualization capabilities through gradient candle coloring based on MACD analysis, providing immediate visual feedback on momentum strength and direction. This enhancement allows rapid market assessment without requiring detailed indicator analysis, improving efficiency for traders managing multiple instruments simultaneously.
The cloud visualization system uses color-coded fill areas to clearly indicate trend direction and strength, with automatic adaptation to selected operational modes. This visual clarity reduces analytical complexity while maintaining comprehensive market information display through professional chart presentation.
Performance Optimization Framework
The Fresh Algo V24 incorporates performance optimization features including signal strength classification, automatic parameter adjustment based on market conditions, and dynamic filtering that adapts to current volatility levels. These optimizations ensure consistent performance across varying market environments while maintaining signal quality standards.
The system automatically adjusts sensitivity levels based on selected operational modes, ensuring appropriate responsiveness for different trading approaches. This adaptive framework reduces the need for manual parameter adjustments while maintaining optimal performance characteristics for each operational configuration.
Conclusion
The Mutanabby_AI Fresh Algo V24 represents a comprehensive solution for professional trading analysis, combining multiple analytical approaches with advanced visualization and risk management capabilities. The system's strength lies in its adaptive multi-mode design and sophisticated filtering mechanisms, providing traders with versatile tools for various market conditions and trading styles.
Success with this system requires understanding the relationship between different operational modes and their optimal application scenarios. The comprehensive dashboard and alert system provide essential market context and trade management support, enabling systematic approach to market analysis while maintaining flexibility for individual trading preferences.
The indicator's sophisticated architecture and extensive customization options make it suitable for traders at all experience levels, from those seeking systematic signal generation to advanced practitioners requiring comprehensive market analysis tools. The multi-timeframe integration and adaptive filtering ensure consistent performance across diverse market conditions while providing clear guidelines for strategic implementation.
