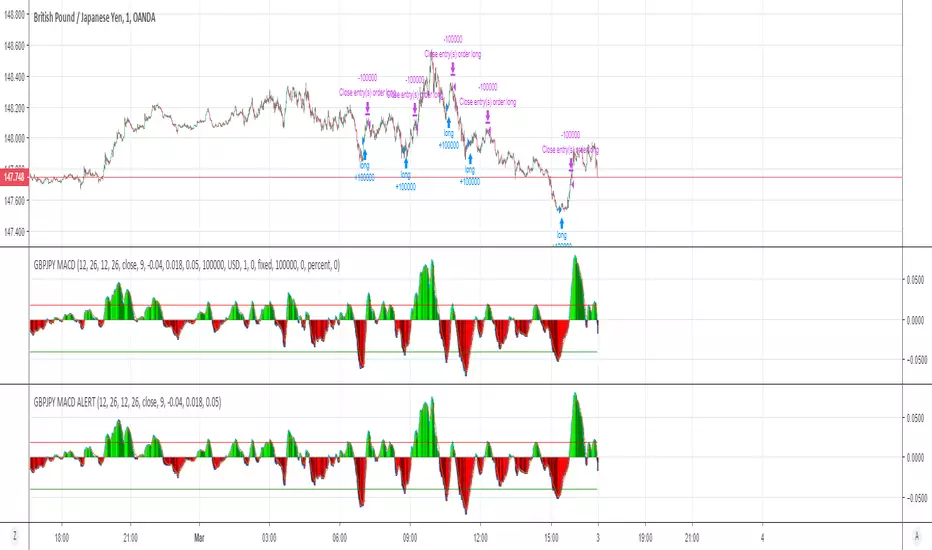
GBPJPY MACD ALERT 1min Long only Alert Script for AutoviewThis is the Alert Script for the GBPJPY 1min Long only script. It is also scripted with the Autoview syntax in the message body of the alert to execute Long at market price and sell open orders at market price. These conditions are set based on the GBPJPY 1min Long only script posted. You can adjust as needed.
Cerca negli script per "alert"
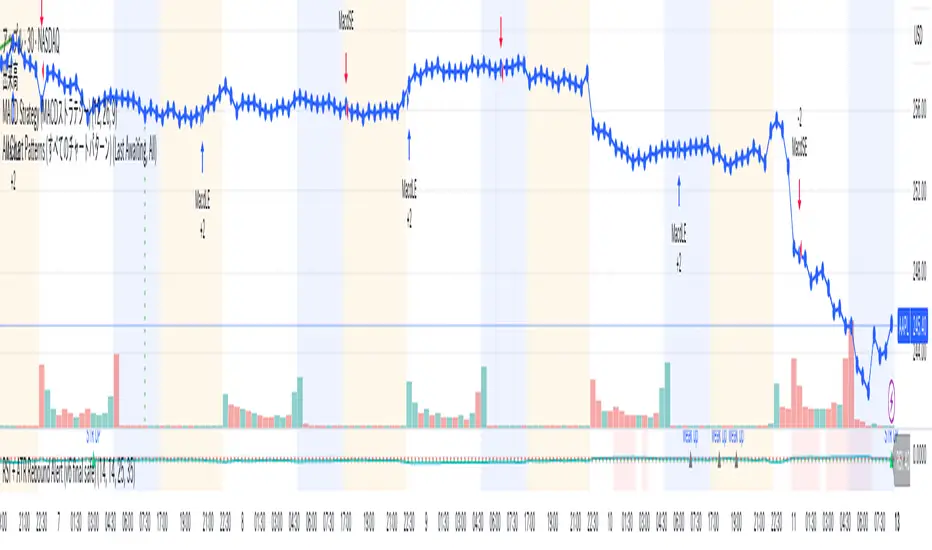
Strategy Moving Average Stop and Reverse alertsSo this is for strategy for the Moving Average Stop and Reverse alerts
its seems to be nice , I did not play so much with the TF but one can change settings as he wish
my indicator with alerts is
I think the results is more due to the condition of the test rather to the model? on the other hand the original model in version 2 (not mine) had similar results . also TV put the signals one bar forward where in reality the signal will beep correctly at the right bar as shown in graph
the model is attempt to make SAR better

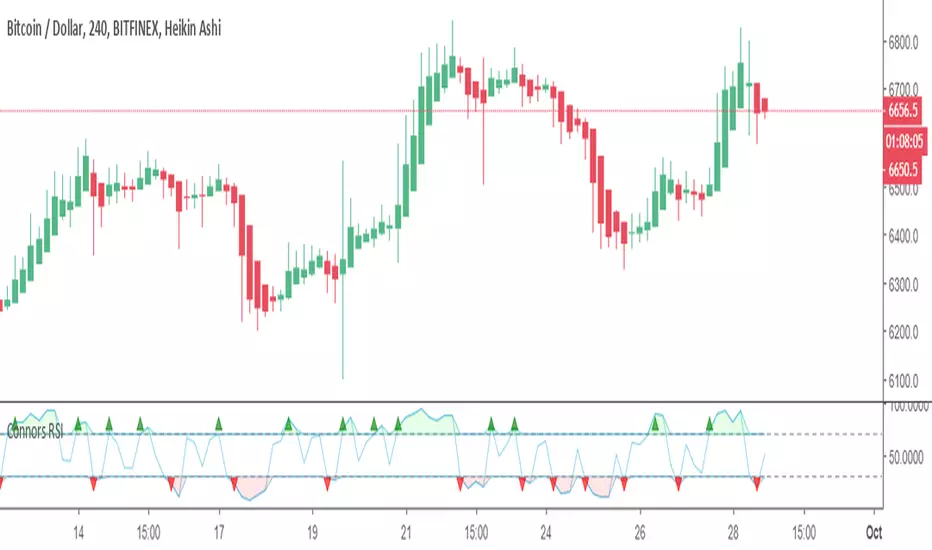
Connors RSI with alert1-alert condition added. to use alert right click on connors rsi and set alert for buy and sell
2-for better use i added triangle up and down
when see green triangle up, go long
when see red triangle down, go short
[Autoview][Alerts]Dual MA Ribbons R0.12 by JustUncleLSorry I have had trouble getting the TradingView to point to the "Alerts" script instead of the "Backtest".
This is the Alerts part of this pair of Scripts. This part creates alerts to be picked up by the Chrome Add-on.

Guppy w/AlertsStandard Guppy indicator with alerts for when EMA agreement (color) changes
In the Alerts dialog, select Guppy w/Alerts from the Condition dropdown (the ema selected next to it doesn't matter)
Then select one of (Fast Trend Switch, Slow Trend Switch, Trend Switch) in the next drop down.
Trend Switch is when either set of EMAs change from bullish => neutral, neutral => bullish, bearish => neutral, or neutral => bearish
Fast Trend Switch alerts only on fast EMAs switches
Slow Trend Switch alerts only on slow EMAs switches
bullish = green/aqua
bearish = red/orange
neutral = gray

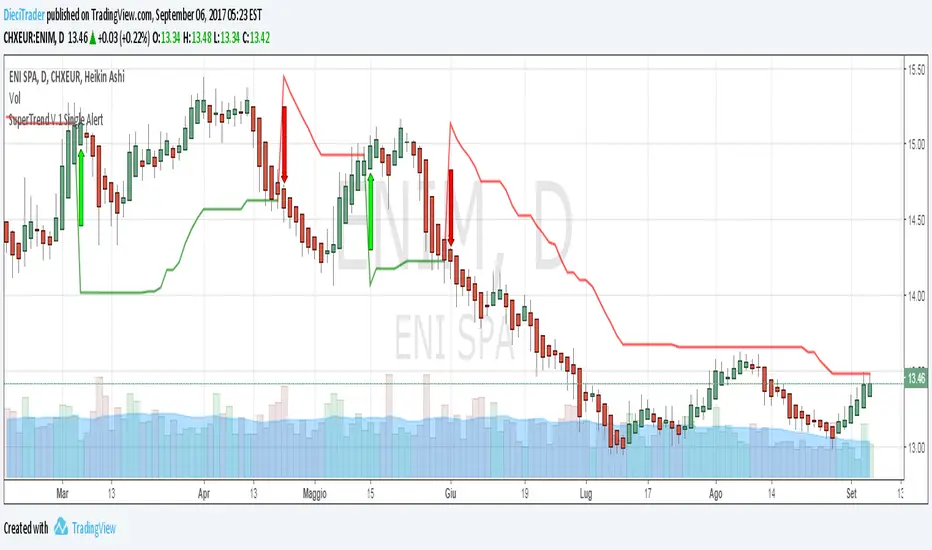
SuperTrend V.1 Single AlertLike SuperTrend V.1 Alert, but no difference for long alert and short alert ...
PPO Divergence AlertsThis is a pretty straightforward script that adds alerts to Pekipek's excellent PPO Divergence indicator and changes the visuals a bit. You can have the alerts fire on these events:
Purple Circle (bullish signal)
Orange Circle (bearish signal)
Green Dot (High Point)
Red Dot (Low Point)
I use this on daily Forex charts to get alerts when purple or orange dots show. As you can see, it catches a lot of big moves, some of which can give insane returns if you're 200x leveraged on the likes of 1Broker.com. In regards to reducing false signals, I'm getting good results with a Williams %R but would love to hear any suggestions.
Edit: Oops. Box #6 in the example should be yellow, not purple.

EMA Squeeze Alert (ADR Filter)This indicators is for Pine Screener. You could use it on Pine Screener to filter out stocks with EMAs Convergence.
The EMAs used are EMA 9, EMA 12 and EMA 20.
When the current closing price is within 50% of 20-days ADR% from these three EMAs, it would give you an alert signal.
The way to use it is to apply it onto the Pine Screener.
You then select the watchlist you would like to filter out, and check the alert signal to True, and click scan.
If Condition is True, the candlesticks would have a green arrow below and the background is highlighted.
The script is published, feel free to amend it as you like
Have a Nice Day, and Trade Safe !

3 EMA with AlertsThis indicator plots three key EMAs (20, 50, and 200) directly on the chart, making it easy to track short-, medium-, and long-term trends. A color-coded table is displayed in the top-right corner for quick reference.
-> YOU CAN CHANGE EMA VALUE ACCORDING YOUR TRADING STYLE.
The script also includes smart alerts that trigger only when the state changes:
• FAST EMA crossing above MEDIUM AND SLOW EMA → Bullish signal
• FAST EMA crossing below MEDIUM AND SLOW EMA → Bearish signal
This tool is designed for traders who want clean visuals, reliable alerts, and simplified trend recognition.

ARX Session Time Alerts (UK)This script provides time-based alerts for major market sessions and predefined time windows using UK time (Europe/London).
Alerts are purely time reminders and do not generate trade signals, predictions, or execution guidance.
Designed to support market awareness, preparation, and education.
Educational use only. Not financial advice.

RV − IV Spread Alert (SPY vs VIX)Realized vs Implied Volatility Spread (RV − IV) for the S&P 500 / SPY.
Plots the daily difference between 30-day realized volatility (SPY) and implied volatility (VIX) in basis points.
Key insight from the research: when the spread turns and stays above ≈ +50 bps, forward returns historically degrade and volatility of returns rises sharply — a useful early-warning regime flag.
Features:
- Clean daily plot of RV − IV in bps
- Horizontal lines at 0, −50 bps and +50 bps
- Red background when spread > +50 bps
- Built-in alert condition that fires once per bar close when spread closes above +50 bps
- Optional “all-clear” alert when it drops back below
Use on SPY or ES1! daily chart. Perfect for anyone wanting a simple notification when the market enters the “risk-on” volatility regime highlighted by Machina Quanta and the original Bali & Hovakimian (2007) paper.

Donchian 20/10 Screener + Alerts Donchian 20/10 Screener + Alerts identifies stocks breaking their 20-day high.
Includes ADX trend filter to confirm strong momentum.
Plots Donchian high/low lines and marks BUY/SELL signals on chart.
Screener output shows “PASS” for stocks meeting entry criteria.
Supports alerts for entry, exit, and screener signals for easy monitoring.

[CASH] Crypto And Stocks Helper (MultiPack w. Alerts)ATTENTION! I'm not a good scripter. I have just learned a little basics for this project, stolen code from other public scripts and modified it, and gotten help from AI LLM's.
If you want recognition from stolen code please tell me to give you the credit you deserve.
The script is not completely finished yet and contains alot of errors but my friends and family wants access so I made it public.
_________________________________________________________________________________
CASH has multiple indicators (a true all-in-one multipack), guides and alerts to help you make better trades/investments. It has:
- Bitcoin Bull Market Support Band
- Dollar Volume
- 5 SMA and 5 EMA
- HODL Trend (a.k.a SuperTrend) indicator
- RSI, Volume and Divergence indicators w. alerts
More to come as well, like Backburner and a POC line from Volume Profile.
Everything is fully customizable, appearance and off/on etc.
More information and explainations along with my guides you can find in settings under "Input" and "Style".

Volume Surge AlertVolume is often the fuel behind meaningful price moves. The Volume Surge Alert indicator highlights bars where volume explodes above its recent average, helping you spot accumulation, distribution, and breakout attempts before the price fully reacts.
Calculates a configurable simple moving average of volume to establish “normal” activity.
Flags bars where the current volume exceeds the SMA by a user-defined multiple (default 2×).
Colors the column and background on surge bars for quick visual confirmation.
Provides an alert condition so you can receive notifications the moment activity spikes.
Use it on any timeframe or market to monitor for unusual participation, confirm breakouts, or filter entries. Adjust the SMA length and surge multiple to match your market’s typical liquidity profile.

Volume Peak (2 before & 2 after) - With AlertVolume Peak (2 before & 2 after) - With Alert
There will be an alert for you when a signal appears.
If you find it useful, please give me a like

Arisa RSI Rebound Alert (v6.2)Short description:
Simple RSI-based rebound detection with ATR confirmation — designed for traders who prefer a clean and intuitive signal.
Full description:
This indicator detects oversold and rebound phases using RSI and confirms the strength of each rebound with ATR slope analysis.
It is optimized for deep correction phases (e.g. RSI 25→35 cross), helping traders catch early reversal signals while avoiding unnecessary noise.
💡 Recommended use:
• Timeframes: 30min–4h
• Ideal for short- to mid-term rebound trades
• Combine with Heikin-Ashi or volume expansion for higher accuracy
✨ Key Features:
• Clear oversold/rebound thresholds (default RSI <25 / cross-up >35)
• Background highlight for deep oversold conditions
• Visual markers for strong vs. weak rebounds (ATR slope filter)
• Alert-ready (three conditions included)
🪶 Concept:
This script is designed for traders who value simplicity and intuition — focusing on meaningful signals rather than automation overload.
It’s for those who still want to see and feel the market before taking action.
⸻
Author:
Arisa Sanjo (Japan)
Created with the support of GPT-5, based on live trading insights from October 2025.
License:
Free to use and modify with proper attribution.
If you redistribute or enhance this script, please mention “Based on Arisa RSI Rebound Alert (v6.2)” in your description.
EMA 9/20 Crossover AlertThis EMA 9/20 Crossover Alert indicator is a technical tool used on price charts to detect and notify traders when the short-term 9-period Exponential Moving Average (EMA) crosses above or below the longer-term 20-period EMA. This crossover often signals potential shifts in market momentum, signaling possible buy or sell opportunities. The indicator visually plots both EMAs on the chart and creates alert conditions so traders can be promptly informed of these crossover events, aiding in timely decision-making without needing to constantly watch the chart. It is widely used in momentum and trend-following trading strategies to identify trend reversals or continuations

TMA Bands with AlertsTMA Bands with Alerts uses bands to indicate the up and downtrend with alerts to show potential reversals. POAYEE

RSI with Multiple MAs + Slope Alerts 5,9,34,55RSI with Multiple MAs + Slope Alerts 5,9,34,55
Stacking Alerts Available
HTF POC with Zones & AlertsPlots a Point of Control (POC) per candle from a timeframe you choose (MTF). Because TradingView doesn’t expose true footprint data, the POC here is a proxy (choose: Body Mid, Range Mid, or Typical Price HLC3). The script draws the POC line and an optional POC zone (±% of that candle’s range), then alerts when price retests the zone (wick touches count).
Use it to:
Mark key levels inside candles that often act as magnets or reaction zones
Track retests of strong bars (imbalance) across higher timeframes
Add clean confluence with S/R, FVGs, or trend tools
Features: Selectable TF, zone width, extend lines/zones, historical caps, alerts, and info panel.
Note: This is an estimate of POC from OHLC, not real bid/ask volume. Use as context, not a standalone signal.

Minimalist RSI - Nasdaq (14) with Volume Filter and AlertsDescription:
This indicator shows the standard RSI (period 14) adapted for Nasdaq, with a clean and minimalist design. It adds visual levels for overbought (75) and oversold (25), plus an optional centerline 50 to better interpret momentum.
It incorporates a high volume visual filter to confirm signals and avoid false entries in low-interest conditions. Buy and sell signals are based on RSI crosses in extreme zones, optionally filtered by volume to improve reliability.
You can enable automatic alerts to receive notifications when important signals occur.
How to use:
Watch the RSI and its position relative to overbought/oversold zones and the 50 line.
Wait for high volume confirmation for greater reliability (you can disable this filter if preferred).
Use buy and sell signals alongside your price action and overall context analysis to make decisions.
Set alerts to not miss opportunities.
Important Notice:
This indicator is a support tool, not a complete strategy. Trading involves risks and no guarantees. Always use risk management and test the indicator on a demo before using it live.
Personal note:
This is my first script and I would love to receive constructive feedback to improve and offer better tools to the community. Thanks for trying it!
Motivational phrase:
“No risk, no reward.”
1H MA20 Downbreak Alert1H MA20 Downbreak Alert
1H MA20 Downbreak Alert1H MA20 Downbreak Alert1H MA20 Downbreak Alert

RSI 20/80 Arrows + AlertsRSI 20/80 Arrows + Alerts
This indicator is a modified Relative Strength Index (RSI) tool designed to help traders spot potential overbought and oversold conditions using customizable threshold levels (default 80 for overbought, 20 for oversold).
Features:
Custom RSI Levels – Default to 80/20 instead of the standard 70/30, but fully adjustable by the user.
Visual Signals –
Blue Arrow Up appears below the bar when RSI crosses up from below the oversold level (potential buy zone).
Red Arrow Down appears above the bar when RSI crosses down from above the overbought level (potential sell zone).
Alerts Built In – Receive notifications when either signal occurs, with the option to confirm signals only on bar close for reduced noise.
Guide Levels – Optionally display overbought/oversold reference lines on the chart for quick visual reference.
Overlay Mode – Signals are plotted directly on the price chart, so you don’t need to switch between chart windows.
Use Case:
Ideal for traders who want quick, visual confirmation of potential turning points based on RSI, especially in strategies where more extreme levels (like 20/80) help filter out weaker signals. Works well across all markets and timeframes.
