Miyagi (10 in 1) + AlertsMiyagi: The attempt at mastering something for the best results.
Miyagi indicators combine multiple trigger conditions and place them in one toolbox for traders to easily use, produce alerts, backtest, reduce risk and increase profitability.
VWAP has been the main condition for entry for our trading community for quite some time now, however using VWAP alone can lead to poor entries and bags.
Miyagi adds filtering conditions which can then be used to improve entries as opposed to simply using VWAP alone.
Miyagi (10-in-1) + Alerts combines multiple trigger conditions in an easy to use format.
Each trigger or filtering condition is selectable and able to be combined using the selector checkboxes.
Trigger or filter conditions can be used on a different timeframe chart than the current user selected chart.
For instance, the user's chart can be set to a 15M for entry however using filtering from a 30 minute RSI.
It is recommended to not use a lower timeframe chart setting than the current chart timeframe.
The following trigger and filter conditions are present in the 10-in-1:
EMA: Takes two "Exponential Moving Averages" into effect for filtering with user selectable chart timeframe, length and sources.
EMA Trend Type is user selectable for Trend-following or Counter-trend which allows you to counter-trade the markets.
Beside the "Simple Moving Average" the EMA has a multiplier.
Calculation is SMAxMultipier / SMAxMultiplier of the previous candle.
MACD: Takes the "Moving Average Convergence Divergence" into effect for trigger condition or filtering with user selectable chart timeframe,
source, fast & slow length and signal smoothing. MACD is a trend-following momentum indicator that shows the relationship between two moving averages of a price.
The MACD is calculated by subtracting the EMA 26 period from the EMA 12. Long alert is triggered on crossing the MACD zero line upwards and short alert vise versa.
RSI: Takes the "Relative Stregth Index" into effect for trigger condition or filtering with user selectable chart timeframe, length, source, and oversold and overbought values.
The RSI is a technical oscillator that uses price and volume data for identifying overbought or oversold signals in an asset.
It can also be used to spot divergences which warn of a trend change in price. This oscillator moves between 0 and 100.
RSI > 80 is considered overbought and an RSI < 20 is considered oversold.
Stochastic RSI: oscillator version of RSI.
Takes the stochRSI into effect for trigger condition or filtering with user selectable chart timeframe, K D, length, upper and lower length.
stochRSI = (actual RSI - lowest RSI) / (highest RSI - lowest RSI)
VWAP: Takes the "Volume Weighted Average Price" into effect for trigger condition with user selectable chart timeframe, period, and VWAP lower line (long),
or VWAP Upper line (Short) values. VWAP is calculated by totaling the money traded for every transaction (price x volume) and then dividing by the total shares traded.
The VWAP appears as a single line on charts. It looks similar to a moving average line, but smoother. In general it is a intraday/week anchored indicator that resets,
but we are using a steady version over a selectable period of candles.
TTM: Takes the TTM squeeze indicator into effect for trigger condition with user selectable chart timeframe, length, multiplier, smoothing and trend direction.
The TTM is used to identify when to enter or exit a market for the best chance of profitability. It squeezes pairs well with other indicators, such as the ADX indicator.
For Multiplicator you can use Keltner and Boilinger Bands.
ADX: Takes the "Average Directional Movement Index" into effect for trigger condition with user selectable chart timeframe, smoothing, DI-length, a long and a short setting.
The ADX is used to detect trend direction with a positive and a negative direction indicator (+DI & -DI). The factor of those is a value between 0 and 100.
A low value can be a week trend or consolidation. A value > 25 is considered as a positive trend, >50 is a strong long trend >75 extremely strong trend.
Beside timeframe, you can choose smoothing and DI length.
SuperTrend: Takes the SuperTrend into effect for filtering with user selectable chart timeframe, ATR length and factor.
As an alternative to moving averages you can keep a fix distance to determine long or short trend.
That way you can avoid a lot of switching during a consolidation phase. Once crossed it switches trend direction.
The "Average True Rage" is used for calculation of the SuperTrend distance, it measures the volatility of the coin.
MFI: Takes the "Money Flow Index" into effect for filtering with user selectable chart timeframe, length, source, long and short settings.
The MFI is a technical oscillator that uses price and volume data for identifying overbought or oversold signals in an asset.
It can also be used to spot divergences which warn of a trend change in price. Like RSI this oscillator moves between 0 and 100.
MFI > 80 is considered overbought and an MFI < 20 is considered oversold.
W-Divergence: Takes the "Wolfpack Divergence" into effect for trigger condition with user selectable chart timeframe, length, lookback, divergence and ranges.
W-Divergence is MACD 3-8 setting with added divergence hunter.
How to use: Select the VWAP, and set the VWAP up as you would normally trade with your selected timeframe, period, and VWAP settings (long and short).
All entries will be shown, based on the VWAP settings.
From here, filtering can be implemented to produce better entries, ie using EMA/MACD/RSI/SuperTrend/MFI filtering.
Happy Trading!
Cerca negli script per "alert"

ATR alerts & backtestingThe Basics
Alert will trigger if the current (real time) price surpasses the high of the ATR of the previous bar. (can also be set for the Low of the ATR). Each time the follow up candle surpasses the high of the previous ATR, the background will be coloured orange. This makes back testing easier on the eye. This can be turned off.
- Colours can be changed.
- Can also set a color and alert when the current price surpasses the Low of the ATR of the previous bar.
- ATR distance can be changed.
- Can be used on different chart types.
- Can be used as entry or exits in combination with bots.
- Can display only ATR top or bottom or both.
Example
An alert will trigger if the price of the current bar surpasses the red dot (ATR) of the previous bar.
Alerts can be created on all timeframes, if this is within your Tradingview plan.
Final Words
Disclaimer: Please use it with care and at own risk. The owner of this indicator is not liable for any financial losses.
Past performance is no guarantee of future returns.

STD Stepped Ehlers Optimal Tracking Filter MTF w/ Alerts [Loxx]STD Stepped Ehlers Optimal Tracking Filter MTF w/ Alerts is the traditional Ehlers Optimal Tracking Filter but with stepped price levels, access to multiple time frames, and alerts.
What is Ehlers Optimal Tracking Filter?
From "OPTIMAL TRACKING FILTERS" by John Ehlers:
"Dr. R.E. Kalman introduced his concept of optimum estimation in 1960. Since that time, his technique has proven to be a powerful and practical tool. The approach is particularly well suited for optimizing the performance of modern terrestrial and space navigation systems. Many traders not directly involved in system analysis have heard about Kalman filtering and have expressed an interest in learning more about it for market applications. Although attempts have been made to provide simple, intuitive explanations, none has been completely successful. Almost without exception, descriptions have become mired in the jargon and state-space notation of the “cult”.
Surprisingly, in spite of the obscure-looking mathematics (the most impenetrable of which can be found in Dr. Kalman’s original paper), Kalman filtering is a fairly direct and simple concept. In the spirit of being pragmatic, we will not deal with the full-blown matrix equations in this description and we will be less than rigorous in the application to trading. Rigorous application requires knowledge of the probability distributions of the statistics. Nonetheless we end with practically useful results. We will depart from the classical approach by working backwards from Exponential Moving Averages. In this process, we introduce a way to create a nearly zero lag moving average. From there, we will use the concept of a Tracking Index that optimizes the filter tracking for the given uncertainty in price movement and the uncertainty in our ability to measure it."
Included:
-Standard deviation stepping filter, price is required to exceed XX deviations before the moving average line shifts direction
-Selection of filtering based on source price, the moving average, or both; you can also set the Filter deviations to 0 for no filtering at all
-Toggle on/off bar coloring
-Toggle on/off signals
-Long/Short alerts

Any 8 Moving Averages - Alerts, Clouds & PercentagesANY 8 MOVING AVERAGES WITH ALERTS, COLOR CHANGING CLOUDS AND PERCENTAGE GAPS
This is a fully customizable moving average cloud with alerts. It has 8 moving averages that can be individually set to any type such as: EMA, SMA, HMA, WMA, VWMA & RMA. Each moving average paints green when price is above it and paints red when price is below it. They include colored clouds between the price and each moving average as well.
You can individually change the length, colors, type of moving average and turn them off for those of you that only want a few moving averages on your chart at once.
There is also a percentage gap table that tells you how far away the price is from each moving average which are labeled accordingly.
You can also set alerts for when price crosses each moving average.
***HOW TO USE***
When all the moving averages are green, buy dips down to the next lower moving average. When all the moving averages are red, short the tops up to the next moving average.
Trade in the direction of the trend and wait for all lines to turn one color before taking trades in that direction.
Make sure there is a big enough percentage gap to the next moving average before taking a trade.
***MARKETS***
This indicator can be used as a signal on all markets, including stocks, crypto, futures and forex.
***TIMEFRAMES***
This moving average can be used on all timeframes.
***TIPS***
Try using numerous indicators of ours on your chart so you can instantly see the bullish or bearish trend of multiple indicators in real time without having to analyze the data. Some of our favorites are our Auto Fibonacci, Directional Movement Index + Fisher Price Action, Volume Profile With Buy & Sell Pressure, Auto Support And Resistance and Money Flow Index in combination with this moving average cloud. They all have unique features to help you make better and faster trading decisions.

Yoshi AlertsRemake of infernixx's traders reality script.
Traders Reality indicator
This indicator serves as the Tradingview equivalent of an MT4 indicator suite.
It differentiates from existing TV indicators in its style and total feature set (most notably PVSRA and PVSRA Override)
It was originally designed for forex markets, and it will work for crypto as well, but it has not been tested on stocks.
List of features:
PVSRA Candles
Market boxes (NY/JP/ HK /UK/ FR and Brinks Boxes)
5/13/50/200/800 EMAs (cloud for 50EMA)
Pivot points (S/M/R 1,2,3; PP )
Yesterday and Last Week price range
Average Daily Range (Weekly and Monthly as well)
Daily Open
PVSRA Override
All of these are configurable in the indicator settings.
Usage instructions:
PVSRA Candle colors meaning:
Green (bull) and red (bear): Candles with volume >= 200% of the average volume of the 10 previous chart candles, and candles where the product of candle spread x candle volume is >= the highest for the 10 previous chart time candles.
Blue (bull) and blue-violet (bear): Candles with volume >= 150% of the average volume of the 10 previous chart candles
PVSRA Override
In order to get reliable bar coloring, we need accurate data. If you're on a chart with low volume on some obscure exchange, you may want to use another exchanges datafeed for the symbol you are on to calculate the PVSRA bar colors with. This lets you do exactly that. By default it's off, but you can turn it on and use INDEX:BTCUSD, or really any other chart you want. You can combine charts too, e.g. use BINANCE:BTCUSDT+COINBASE:BTCUSD.
PVSRA Alerts
Alerts can be made for PVSRA "vector"/"climax" candles:
1. Create Alert (Clock with + sign)
2. Set Condition: "Traders Reality",
3. Select "Alert on Vector Candle",
4. Set it to Once per Bar,
5. choose your notification options.
Market boxes
The market boxes times are configurable and will change depending on the exchange timezone. I recommend to pick your main exchange/chart and adjust the times so that they are correct. Technically you will need to shift the time from the exchanges' timezone to GMT . Default values should be good for UTC based exchanges in current US+UK summer time.

Super Trend Triple - With Buy/Sell/Close and trailing S/L AlertsSuper Trend Triple by © PaulJC
Having 3 super trend indicators is a fairly well-known strategy, taking an order when all 3 lines confirm the trend
while above/below the 200ema (optional)
!!!!! Do your own backtesting on symbols you trade before trying with real funds !!!!!
That said, this works well on most time frames when trailing the stop up the trend line...
You need to see which is the best line to follow based on the symbol you are trading and select this in the options if you want alerts when it moves!
Alerts for: (Set alerts to 'Once Per Bar Close' to avoid early entry.)
Buy Signal
Sell Signal
Order Signal (Both Buy or Sell)
Change in Stop
Change in stop with stop prices (Select "Any alert() function call")
Close Position
Options/Inputs:
Show/Hide Trend Lines
Show/Hide Background Colors
Show/Hide Entry Background
Show/Hide Close Background
Show/Hide Entry / Close Arrows
Show/Hide Entry / Close Labels
Show/Hide 200EMA
Turn On/Off EMA200 Filter
Choose which Trend Line to follow for SL alerts
Turn off all alerts
Any ideas for improvements or changes, let me know :)

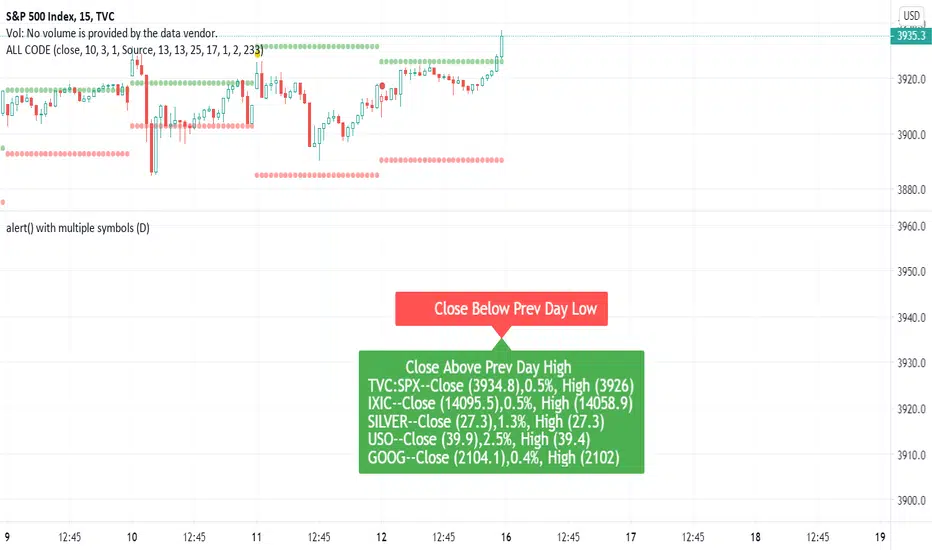
Dynamic Messages & Easy Screener1. Dynamic Message alerts with a Screener function
2. labels are generated using array strings making it easier to customize
3. Alert messages have well defined output with data variables
4. Traders with limited Pine knowledge can also plugin their functions
5. Closely track the alerts with Easy Screener
6. Attach it to the desired chart for alert periodicity and set resolution to the indicator setup
7. OHLC values for scanned securities also extracted for ready use in any indicator or study
Happy Trading and rest your sore eyes with Easy Screener!!
Enjoy TV on the GO!
Trading-Dojo BTC Spot to Perps AlerterTrading-Dojo BTC Spot to Perps indicator
This indicator takes the top exchanges in BTC spot and the top exchanges for BTC Perps and displays the difference / premium of each aggregate.
Allows you to estimate in real time where the premium lies
Allows you to set alerts on consecutive bars in one trend or another
Allows you to set alerts if a premium threshold is crossed on either trend.

DekaBot V5.1 AlertsDekabot is a BTCUSDT trading signals indicator. The buy/sell alerts are not re-painted so the results displayed will not change when Tradingview is reloaded.
Dekabot Alerts uses a combination of Bollinger Bands , MAs and RSI to determine if the market is in an uptrend or downtrend and a custom built indicator determines when a market is oversold and overbought which creates the buy and sell signals.
Please PM us to obtain access to use Dekabot Alerts.

[BMAX] Moving Average Cross Alert(ENGLISH)
This indicator helps user to create an alert to monitor when a bar closes crossing a moving average, upwards or downwards.
(PORTUGUÊS)
Este indicador ajuda o usuário a criar alertas para monitorar quando um candle fecha em cruzamento com uma média móvel, acima ou abaixo.

ATR Auto Oscillator [DepthHouse]The ATR Auto Oscillator uses advanced range calculations to determine a dynamic range that the applied market moves within. Like an RSI , the ATR Auto Oscillator measures the speed and change of price movements through a given range. Unlike an RSI , the ATR Auto Oscillator automatically re-configures range values dependent on the user set lookback.
The oscillator ranges between (0.1) and 1.1. Generally, the market is oversold while the bands are below 0.2 and is overbought while above 0.8.
The two bands displayed are used to determine short term trend directions and the oversold/undersold state of the applied market. Crossovers of these bands could give a hint to the direction the market is moving.
The fast band (green) is the direct value of where the market is within its calculated range; 1.1 representing the top of range, and -0.1 representing the bottom. Even when this value is near the bottom of the top of the range, the auto oscillator will readjust to create a new range that the market travels within.
The slow band (red) is a lagging version of the fast band which is used to determine the oversold/overbought signals. When this band travels within the oversold and overbought regions the background color will change to signal a warning. If the fast band crosses the slow band within these zones, an opaque signal will appear. These signals are used to catch possible trend reversals.
Breakout Signals ( BETA ):
Breakout signals are the up and down arrows displayed on the top and bottom of the oscillator. A refined range is generated by the user set 'High Low Length'; it is then displayed by the light gray horizontal lines. If the user set band (fast or slow) returns into the range within a given period (breakout offset) then a signal will generate.
Built in Alerts (must be set up by user):
Bullish & Bearish Crossovers within the oversold and overbought ranges.
Bullish & Bearish Breakout alerts (beta)
Users can also set custom alerts. Example: Fast Band crossing up Value: 0.7
To gain access to this indicator please follow the link below.
Feel free to message me with any questions directly here on TradingView.

BigBendFX Ichimoku Cloud | Cloud BreakoutCloud breakout is an enhancement of TradingView's built-in Ichimoku Cloud Indicator. By default, only the cloud is visible. The other Ichimoku lines can be toggled on if needed. This indicator focuses on the breakout of the Kumo cloud. An additional simple moving average filter can be added as well.
Breakout Condition
2 candlesticks are part of the breakout condition
Candlestick 1: 'open' price is still within the cloud and 'close' price breaks out of the cloud
Candlestick 2: 'open' price confirms that candlestick 1 'close' remains as a breakout
There are 4 possible breakout conditions: 2 bullish direction moves crossing each senkou span and 2 bearish direction moves crossing each senkou span
Note: ranging markets will cause false breakouts, so a moving average is integrated to help filter this out
Moving Average Integration
A simple moving average can easily be toggled on/off to filter out cloud breakout signals
The SMA length and color can be adjusted in the settings
Alerts
There are 2 alert options: bullish or bearish
Alerts will confirm if the Moving Average Integration is activated
To add to your chart simply search for the title "BigBendFX Ichimoku Cloud" in indicators & strategies.
If you would like any added features or functionalities, please comment/share below. Be sure to check out our website (link below)!
Thank you!

TDI Traders Dynamic Index Alerts v1 - BonavestTo add this indicator to your charts:
Click the 'Add to Favorite Scripts' button down below this description.
This indicator places BUY and SELL tags on the chart using the Trader's Dynamic Index Indicator created by Dan Malone. This indicator is RSI based and is best used with ranging markets and will tend to create a trail of false signals (colored tags) when price is at it's extremes for a long period of time. Utlizing some other indicator such as a volume based one will assist in optimizing signals.
I have used this indicator with success for a few years, however I do not plan to support users of this indicator. It is offered as-is.
I use this indicator for:
Counter Trend Trading (colored tags)
Detecting Best Entries to Follow Trend (gray tags)
Trading Extreme Overbought/Oversold Price Areas (bright colored tags)
Detecting RSI Divergences (circles)
SETTINGS
Custom Timeframe - Default current chart timeframe. Custom selection only works when selecting a smaller timeframe than what is on the chart.
Lengthrsi - RSI Period
Lengthband - TDI Band Length
Lengthrsipl - TDI Price Line Length
Lengthtradesl - TDI Signal Line Length
There are 5 Built-In Notifications already created for you and are available by simply right clicking in the indicator area and selecting:
Condition: TDI Alerts v1
Then 1 of the 5 Alerts:
BUY Signal - All Green colored tags
SELL Signal - All Red colored tags
Gray BUY signal - All Gray BUY tags
Gray SELL signal - All Gray SELL tags
All Signals - All colored and gray tags
This adaptation was based off of the original code from the talented LazyBear.

Fibonacci Retracement level with 10 preset cross alert.The Fibonacci retracement is also called the golden mean or golden section.
It has been used to analyze the proportions of natural objects as well as man-made systems such as financial markets.
The mathematics of the golden ratio and of the Fibonacci sequence is intimately interconnected. The Fibonacci sequence is:
1, 1, 2, 3, 5, 8, 13, 21, 34, 55, 89, 144, 233, 377, 610, 987, ....
The golden ratio is the limit of the ratios of successive terms of the Fibonacci sequence (or any Fibonacci-like sequence).
This Fibonacci retracement level indicator automatically plots 7 support and resistance levels on chart based on selected number of bars.
How it works?
It shows the Fibonacci retracement support and resistance levels for a given range and display the corresponding ratio on the right side of the levels. The price range and levels are adjustable by user, you can easily identify the major and minor support/resistance levels from the chart with your desired inputs.
Features and inputs:
Show Level Label, enable to display the level on chart.
Range, it's the number of bars used to detect the highest and lowest price. The default value is 300 it means the indicator will plot the Fibonacci retracement based on the price range of last 300 bars.
If you want to use different ratios other than the default ones, you can change them from input Level1 to Level5.
You can change the color of each level line from the following available colors: silver , gray, white, maroon, red, purple, fuchsia, green, lime, olive, yellow, navy, blue, teal, aqua, orange.
The highest and lowest level are auto detected and can't be changed.
Line style: you can choose from: Solid, Dotted and Dashed.
1 is Solid like this: ______________________
2 is Dashed - - - - - - - - - - - - - - - - - - -
3 is dotted ............................................
It works on all timeframes and Renko, Heikin Ashi, Bars, Candle and Line chart types.
There are also 10 pre-set alert conditions for you to choose.
For example, if you chose "Cross over Level 1", alert will be triggered when close price cross above level 1.
"Please Use the link below to obtain access to this indicator".

Sqeeze Momentum, DMI and Parabolic SAR study with alertsThe study combines Sqeeze Momentum, Directional Movement Index (DMI) and Parabolic SAR indicators indicators providing you with a powerful indicator with long and short scalping strategies in it
When conditions of long or short position from all mentioned indicators are met script opens position. Once trend changes it closes position and fixes profit
Advantages:
1. Deal start alert condition includes the folowing filters and requirements:
- Momentum value is adjusted using a relative proportion of volume at each timeframe scale to exclude a chance of opening position at a low impulse stage
- Squeeze momentum trigger condition is automatically checked before a position is opened
- +DI , -DI and ADX values are taken into account to confirm the trend direction
- Position size is taken into account to ensure there will not be opened any excess deals or alerts
2. Exit deal alert condition was modified using Parabolic SAR indicator. Hence, it is ensured positions will not be closed in a middle of a trend
3. Study allows you to apply custom alerts to any position you would like thus you can connect your own trading panels with TradingView Webhooks
If you want to obtain access to the strategy please send us a personal message

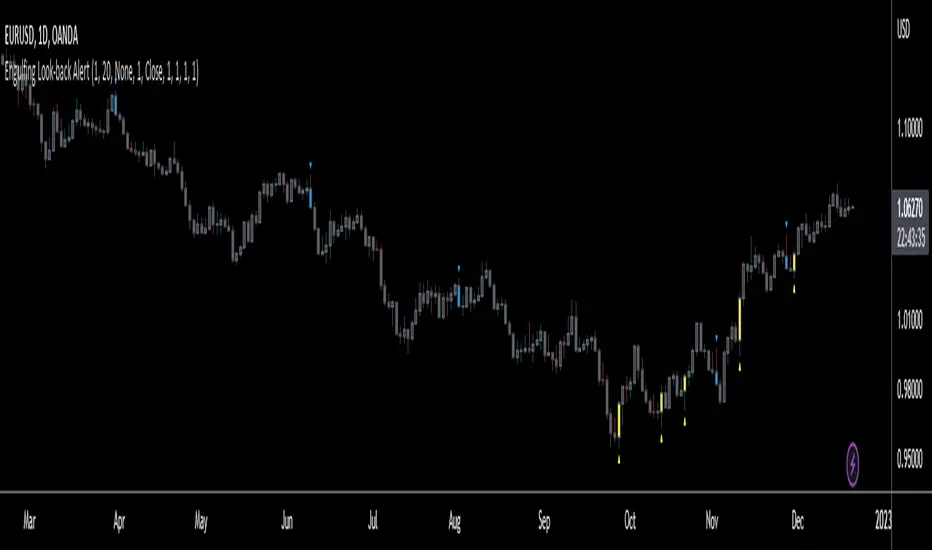
Engulfing Look-back AlertThis script is an extension of the classical engulf pattern with added rules and user defined features.
Engulfing Candle Definition:
- Bullish Engulfing: Trade BELOW the prior candle's LOW and CLOSE ABOVE the prior candle's HIGH. Previous candle can be an up (bullish) or a down (bearish) candle
- Bearish Engulfing: Trade ABOVE the prior candle’s HIGH and CLOSE BELOW the prior candle’s LOW. Previous candle can be an up (bullish) or a down (bearish) candle
Features:
- Set the look-back period for engulfing candle high and low -> default = 1; e.g. Did the bullish eng candle trade below the lows of the last 3 candles and trade above the highs of the last 4 candles? Set the input values accordingly
- Choose time frame(s) engulfing candle is to be displayed on -> default = M/W/D/4H/1H/15M
- Ability to enable Alerts (includes time frame alert was triggered on): IMPORTANT - when setting alerts ensure to choose "ONCE PER BAR"; otherwise alerts will NOT trigger as intended
prntscr.com
*FIBAUS BUY and SELL Trender V2 with AlertsFIBAUS BUY and SELL Trender v2 with ALERTS: Hit me up if you want access.
Always be on the right side of the trade and know where to place the stop loss.
Its a very consistent system allowing for a low risk, high gain trading stratergy. Simply wait for the signal to show as BUY or SELL (LONG or SHORT) and place the order.
SET YOUR ALERTS and WAIT!
Tight stops losses are placed above (Sell/shorts) and below (Buy/Long) orders.
Horizonatal plot lines are to be used as Targets and reversal zones. Green lines are support zones and red lines act as resistance zones.
The Lagging line is the 200 EMA which give me a view of the overall trend of the market and indicates if I should only take Buy or Sell orders. When the 200 is RED, I only sell/short. When it is GREEN, I only Buy/Long.
NB: In trading support and resistance zones interchange. This means that supports can become resistance and resistance can become support zones.
For BTC/XBT, I use 2 hour candles.
Forex, I use 1 hour and 3 hour candles.
For Options I use the 1 hour candles.
Stop Loss stays the same for all types (which is above or below the candle signaling buy or sell.
Hit me up if you want access.
Happy Trading !!
FIBAUS

Technical Analysis - Binary Option AlertA. Oscillators & B. Moving Averages base on TradingView's Technical Analysis by ThiagoSchmitz
C.Pivot base on Ultimate Pivot Points Alerts by elbartt
D. Summary & Alert by anhnguyen14
Binary Option Alert base on my indicator: Technical Analysis - Panel Info
Put alert = Srong Sell + close>open
Call alert = Strong buy + close

Hancock - Pump Catcher [BitMEX] [Alerts]This is a study to the version of the strategy found here .
It generates 3 alerts:
CLOSE - Triggers to close all open positions
LONG - Triggers to open a long position
SHORT - Triggers to open a short position
Commands for alerts (without stop-loss) to get you started:
CLOSE - a=bitmex e=bitmextestnet c=position t=market
LONG - a=bitmex e=bitmextestnet b=long s=xbtusd l=5 q=99% t=market
SHORT - a=bitmex e=bitmextestnet b=short s=xbtusd l=5 q=99% t=market
I would advise including a stop-loss with your commands. These commands are for autoview and don't include a stop loss, use autoview command documentation to add stop-loss.
Happy trading
Hancock

CYBER ENSEMBLE {PREVIEW}This is the PREVIEW version of CYBER ENSEMBLE
The subscription based PREMIUM version is found here:
Please PM me for access information.
Signals for the last 5 days are disabled.
Signal Alerts are disabled.
===============
CYBER ENSEMBLE is a sophisticated signalling script base on the interplay of an ensemble of optimized indicators and market state filters.
(>1000 lines of code)
Users are advised to manually back-test and optimize the settings for a particular chart and time frame, before proceeding with its use.
The algorithms will be periodically updated to further optimize and improve their performances, and new algorithms may be tested and added in the future.
Note: In no way is this intended as a financial/investment/trading advice. You are responsible for your own investment/trade decisions.

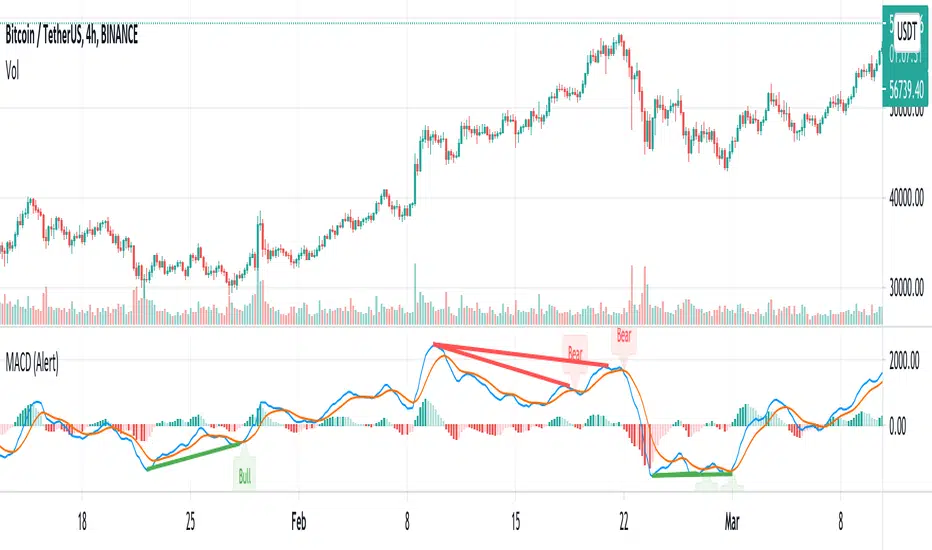
MACD w/ Divergences (Alert)To best use the MACD Divergence indicators, adjust the following settings accordingly.
• MACD Bullish Divergence Under: <0 (lower for larger volatility and more bearish markets)
• MACD Bearish Divergence Above: >0 (higher for larger volatility and more bullish markets)
Key Notes:
1. Set "Once Per Bar" instead of "Once Per Bar Close" alert.
The strategy already uses prior bar close (instead of current bar close) for calculation. This ensures that the signals will stay as they are after fired off, even when the current bar price is still changing.
2. It's OKAY to see the "alert may trigger differently than expected" warning.
Reason why you are seeing this warning is because we used a function called valuewhen() in our strategy. This function does not look at the entire history of data and has several limitations. For instance, on a 30min resolution, at the end of 2018, the function will be able to find past occurrences of BTC exceeding 16k. However, the function won't be able to find such occurrences at the end of 2019. Since our strategy is only concerned with very recent events, these limitations will not impact our results or cause repainting. You can find out more about this in the TradingView Wiki .
Trend Pulse Pro V2Trend Pulse Pro V2 (Non Repaint)
TradingView Account Needed: Free
You don't need to be an expert to use Trend Pulse Pro.
Just follow the signals and that's all and use simple Fibonacci levels to find stop loss and take profit!
You can increase the win rate even more by following some simple technical analysis, for example, when trend breaks (price break signal level) you can use that as support become resistance level (sell) or resistance becomes support (buy):
No complex things. No waste of time.
And although you won't win 100% of the trades (no signals can guarantee that), your trading will surely improve a lot!
Even someone with almost no trading experience can read the simple trading rules given in the included user guide, watch the how-to videos and follow Trend Pulse Pro’s signals to consistently make smarter trades.
With Trend Pulse Pro you will get accurate buy and sell signals every time there is a new trading opportunity so that you never miss any big price movements and makes your trading both easier and more profitable.
How to use the signals and alerts:
Trend Pulse Pro automatically analyze trend and price action to give you a signal when there's a good trade.
These trend signals and alerts are derived from live data but the stability of our code allows it to not repaint.
Trend Pulse Pro allow you to easily determine the trend and will give you buy and sell entry levels.
Works on all markets on all time frames so it's suitable for scalpers, day and swing traders.
If you want more details, the link is in the signature.
Disclaimer:
Past performance is not indicative of future performance. No representation is being made that any results discussed within the service and its related media content will be achieved. All opinions, news, research, analyses, prices or other information is provided as general market commentary and not as investment advice. TradingWalk, their members, shareholders, employees, agents, representatives and resellers do not warrant the completeness, accuracy or timeliness of the information supplied, and they shall not be liable for any loss or damages, consequential or otherwise, which may arise from the use or reliance of the TradingWalk service and its content. © 2019 TradingWalk.
TradingWalk indicators are built for TradingView. TradingWalk is on no way a part of TradingView.

*FIBAUS Ultimate Trender with AlertsVery easy to follow indicator. Its all about the trend. It works in any timeframe with any entity. Crypto, forex, commodities, and stocks. It can be used to scalp but I personally dont day trade anymore and use it for longterm trades. I normally use 6H to 1D candles.
The green ribbon and green arrows indicate a long/buy opportunity and the red ribbon with red arrows at the top of the page indicate a short/sell opportunity.
All you do is set the alerts based on your preferred timeframe and wait for the alert.
Blue spotted lines act as necklines, stop loss levels/ take profit levels.
You can see many areas where the red and green ribbons bounce or are rejected at the blue dotted line. This gives plenty of entry, re-entry, and exit opportunities.
Message me if you want a shot at it.
Happy Trading,
FIBAUS
