Cerca negli script per "alert"

HTF Rejection Blocks (RB) + Alerts EmojiHTF Rejection Blocks (RB) + Alerts Emoji
Version amélioré
Original RB logic by yaweeh, adapted to higher timeframes


DTS Momentum Dot Plot (Stoch / RSI) + AlertsThis comes from Treyding Stocks Famous Dot Plot, but for think or swim. When the green and red dots align, then it is a good opportunity for a buy or sell. It is the Fast Stochastic,the slow stochastic and the RSI, there is another version with the MACD but I liked this one!
You can also add alerts when all lines turn green or red!
Enjoy!

Touch/Overlap Alert (12M/6M/3M/1M)Wick or price action connection...This indicator is to alert you when price action connects for an entry.


Ichimoku MTF Heatmap WITH ALERT meeting D and W conditionsThis is a version of the Ichimoku Cloud Heatmap but adds a can't miss alert when it meets Daily and Weekly conditions. The cloud metric is still being refined and the qualifier is ignoring just the cloud for now. As of 12/21/2025 GLD is meeting the conditions to set this flag.


Custom ORB (Adjustable Time + Alerts)Opening range Breakout for the current day only. Time frame and be adjusted for first 15 min, 30 min, e.g., 9:30 am to 9:45 am or to 10 am, etc. You can add price alerts for high and low. You can also change the color of solid lines.

Entry / TP / SL Alert Bands (Simple & Stable)
Get an alert before you reach your take profit or stop loss. Set as a percentage over the distance to your stop loss and take profit and improve your Money Management

NQ 300+ Point Day Checklist (Bias + Alerts + Markers)This indicator helps identify high-range (≥300-point) days on Nasdaq-100 futures (NQ / MNQ) using a clear, rule-based checklist.
It evaluates volatility, compression, price displacement, prior-day structure, and overnight activity to generate a daily expansion score (0–6). Higher scores signal an increased likelihood of a strong trending or expansion day.
The script also provides:
Expansion probability levels (Normal / Watch / High-Prob)
Bullish, bearish, or neutral bias
On-chart markers and background highlights
Optional alerts for early awareness
Best used on the Daily timeframe to help traders focus on high-opportunity days and avoid overtrading during consolidation.
This is a context and probability tool — not a trade signal.

MTF Bias Alert SystemMulti-Time-Frame Bias Alert System
include HTF BIAS and any Time Frame Confluence

Candlestick Pattern Identifier (Extended + Alerts)Candlestick Pattern Identifier (Extended + Alerts)

Custom ORB (Adjust Time, Color, + Alerts)Set Opening Range Break Out for whatever time range you choose for current day only. 15 min, 30 min etc. You can add alerts on ORB High Low and change color of Lines.

RSI Golden & Dead Cross AlertRSI 14 Golden And Dead Cross Indicator
It will give you an alert when there are rsi golden and dead cross.
It is a intergated signal: Crossing up and Crossing down of RSI.

Santhosh Zero lag Trend change AlertThis indicator alert whenever these is a change in trend direction. Change input to match with your Asset/Index. This works well in all time frame, I recommend this for Scalping and Position trading

Top-Down 8 Levels + Wick Alerts + H4 Box (Stable)Top-Down Analysis Box
This Indicator Helps You Do
Perform top-down analysis quickly
Identify HTF liquidity levels instantly
Spot wick taps (liquidity grabs) in real-time
Trade key institutional levels with confidence
Use H4 zones for direction and bias
Set alerts for high-probability reaction levels

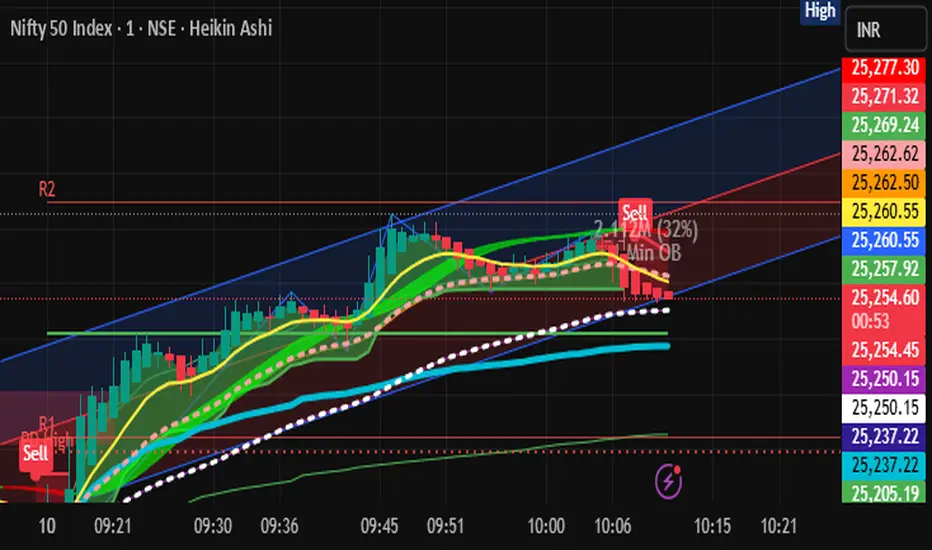
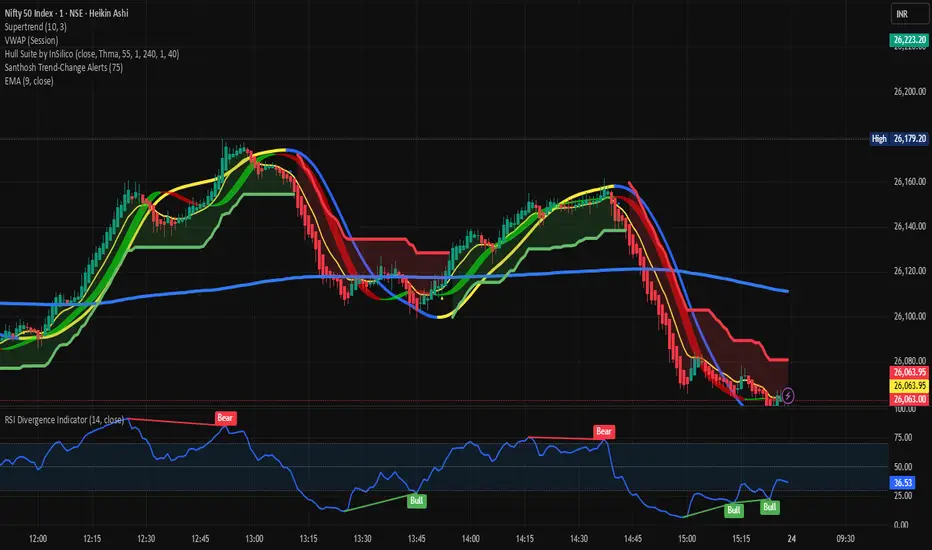
Santhosh Trend-Change AlertsSanthosh Trend-Change Alerts : This indicator identifies potential trend change in market. i would suggest to use 1Min time frame with 75 Period ( Input). To have more accuracy on trading , add RSI Divergence (14) and Super trend (10,3)
Micha Stokes Buyers Breakout Alert v2Buyer Breakout Rules (Word Definition)
The alert is triggered when ALL conditions in Section 1 and Section 3 are met, AND one of the two Scenarios in Section 2 is met.
1. The Setup and Breakout (The Initial Requirement)
Price Action: The closing price of the current candle must break above the highest resistance level established during the recent period of flat trading (the setup).
2. The Confirmation (Scenario A OR Scenario B)
The breakout must be accompanied by evidence of buying strength:
Scenario A: High-Conviction Breakout (Immediate Demand)
The current candle is GREEN (it closed higher than it opened).
AND the volume is HIGHER than the volume of the previous candle.
Scenario B: Seller-Exhaustion Breakout (Micha Stokes' Unique Signal)
The current candle is GREEN (it closed higher than it opened).
AND the volume is LOWER than the volume of the previous candle. (This means the price rose without much seller resistance.)
3. The Strength Filter (Conviction Check)
The candle must close near its high, showing that buyers maintained control and didn't face significant selling pressure immediately after the breakout.

9 & 20 EMA Cross Alert 9 and 20 EMA will be put on chart. Bull and bear signal will appear when EMAs cross. Alert is available when EMAs cross.

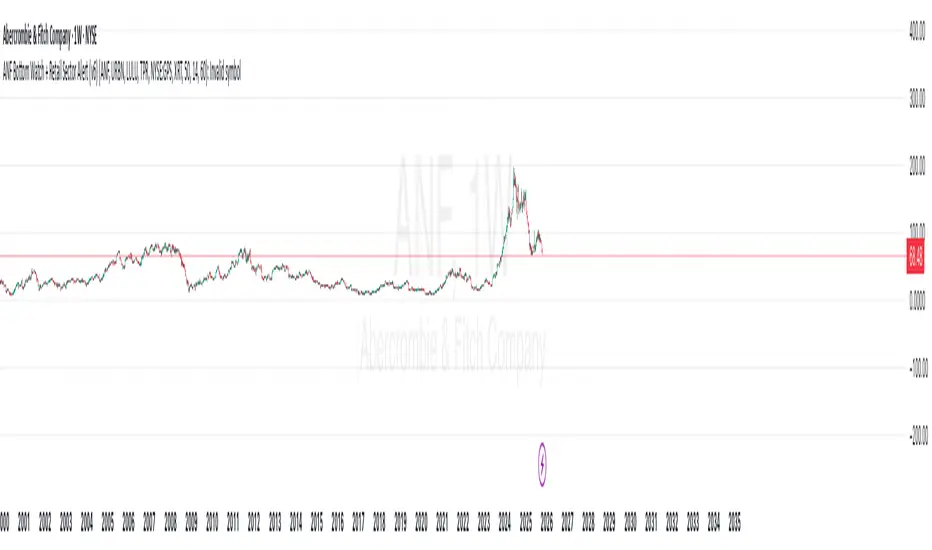
ANF Bottom Watch + Retail Sector Alert (v6) Detect when ANF crosses above its 50-day moving average (technical recovery signal).
Show visual + alert when RSI recovers above 40 (momentum bottom confirmation).
Track peer strength (URBN, LULU, TPR, GPS) — if 3+ peers are trading above their own 50-day MA, the script flags a sector rotation (bullish context).
Give a “Bottom Watch Active” label when all three signals align.
AI Bot Regime Feed (v6) — stableThis indicator generates real-time, structured JSON alerts for external trading bots or automation systems.
It combines multiple technical layers to identify market regimes and high-probability buy/sell events, and sends them to any webhook endpoint (e.g., a FastAPI or Zapier listener).

Santhosh VWAP + 3 EMA + Buy Sell AlertI have combined VWAP and EMA , along with this generated buy and sell alert based on ATR . Best for Scalping