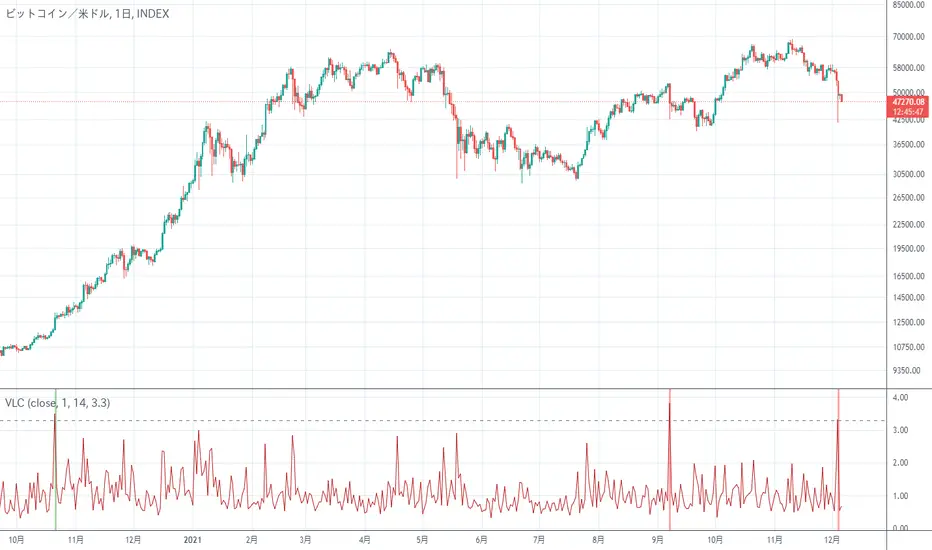
Very Long Candlestick Alert 長いローソク足を検出It is an indicator that only detects long candlesticks.
May alert you when the market crashes
Depending on the chart, it may be necessary to adjust the Threshold of the setting
長いローソク足を検出するだけのインジケーターです
相場がクラッシュした時にアラートをならせるかもしれません
チャートによっては設定のThresholdを調整する必要があります
Cerca negli script per "alert"
P-Signal Strategy & AlertThanks to your advices I removed in this version something that was not necessary for the strategy but added alert and the chart of the current state of the strategy (white 1 - in trade, 0 - out of trade).

ICHIMOKU Crypto Swing AlertThis is a crypto swing alert for the strategy with the same name designed for timeframes bigger than 1h.
The main components are
ICHOMOKU
KDJ
Average High
Average Low
Rules for entry
For long: we have the ichimoku crosses between tenkan and baselines, we have a rising kdj line and at the same time we have a increase in the average high
For short: we have the ichimoku crosses between tenkan and baselines, we have a falling kdj line and at the same time we have an increase in the average low
Rules for exit
We exit when we have inverse conditions than the initial ones used for entry.
Caution
This strategy does not use a risk management, so be careful with it !
If you have any questions let me know !

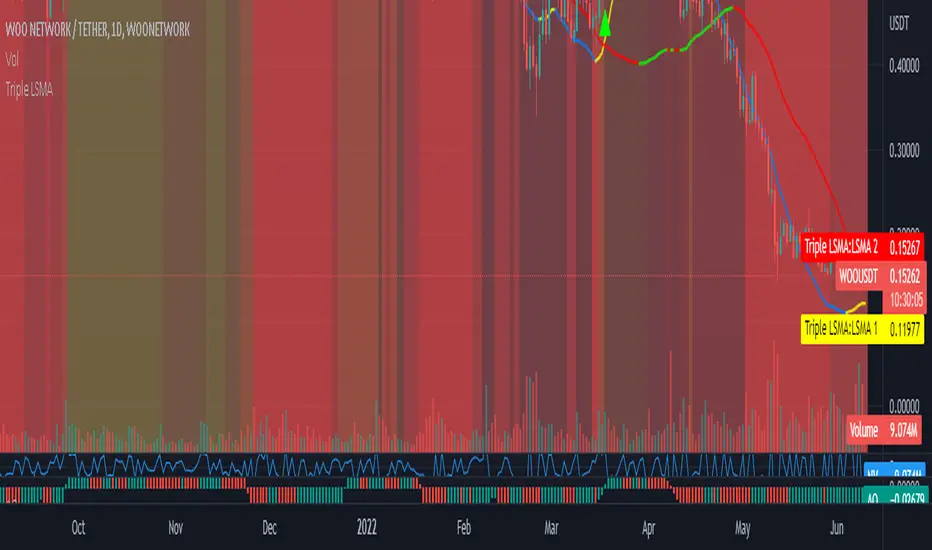
Triple Colored Least Squares Moving Average + Crossover AlertsThis script is forked from the ‘ Double Colored Least Squares Moving Average + Crossover Alerts ‘ from @IronKnightmare.
First release & notes : 2021-11-03.
Overview:
The Least Squares Moving Average is used mainly as a crossover signal to identify bullish or bearish trends. When a shorter duration line cross a longer one a trend can be identified. When multiple lines or the price action cross a longterm trend the confirmation can be further validated. Tradingview contains already some indicators with 1 or two LSMA trendlines that can be configured and toggled.
The original script that I forked had two LSMA lines that could be plotted with other valuable functions, I added a third for further confirmation as some trading systems will use three lines or some combination of those for validation.
Usage:
In inputs
- You will see LSMA 1, LSMA 2 & LSMA 3. The default values are 40, 100 & 400 representing the number of periods plotted by that line : fast, medium and slow changing trendlines will be plotted. The offset value and source are standard for most scripts.
In Style
- You can toggle LSMA 1, 2 or 3 and any combination of those. There are much more possibilities this way.
- For each LSMA, Color 0 & Color 1 are for coloring the slope of the trendline,
- Color 0 for rising slope,
- Color 1 for descending slope.
- The script will automatically color the rise or fall of the trendline accordingly. You can also set one identical color in both slopes for one unique color.
- The ‘ Long Crossover 1 on 2 ’ is a signal for when the LSMA 1 cross over the LSMA 2, usually a shorter periods trendline, more volatile, climbing over the medium term one. A Signal will be traced on the chart at that crossing, you can configure this. The ‘Short Crossover 1 on 2’ is when the LSMA 1 cross under the LSMA 2, a signal will be traced on the chart accordingly.
- The Long Crossover 1 on 3 & Short Crossover 1 on 3 act on the same principle, although the crossing of the fast LSMA on the long / slow LSMA are used. Both can be toggled.
- The ‘ Background Coloring Line 1 : 0-Neutral, 1-Up, 2-Down ’ is an optional background coloring for the LSMA1 line. This can provide additional information at a quick glance, especially if you combine the two other lines backgrounds, the partial transparency will compound.
Bollinger bands dynamic alertsThis triple Bollinger script is very useful for options traders to determine the trend condition. When the trend stays within 1 sigma limits it is termed as "congestion", breakout of congestion starts the "trending" phase and the big breakout termed "Blowout" happens when the underlying crosses the 2sigma and reaches 3 sigma limits in very short time at steep trend angles. The script provides dynamic alerts as soon as the underlying breaks out of these zones and enables options traders to stay in the trade longer. www.tradingview.com

Scalping EMA ADX RSI with Buy/Sell AlertsThis is a study indicator that shows the entries in the strategy seen in one of the youtube channel so it does not belong to me. I can't tell who it is because it's against the House Rules to advertise but you can find out if you look for it on youtube. Default values of oscilators and ema adjusted as suggested. He says he got the best results in 5 min timeframe but i tried to make things as modifiable as possible so you can mess around with the settings and create your own strategy for different timeframes if you'd like. Suggested to use with normal candlestick charts. The blue line below indicates the ADX is above the selected threshold set in the settings named "Trend Ready Limit". You can set alerts for Buy, Sell or Buy/Sell signal together.
The entry strategy itself is pretty straight forward.
The rules for entry are as follows, the script will check all of this on auto and will give you buy or sell signal :
Recommended time frame: 5 min
For Long Entry:
- Check if price above the set EMA (Can disable this rule if you'd like in the settings)
- RSI is in Oversold
- ADX is above set "Trend Ready" threshold (Meaning there is a trend going on)
- Price must approve the trend of previous candles. This is bullish for buy entries and bearish for sell entries.
- Enter with stop loss below last swing low with 1:1 or 1.5:1 take profit ratio.
For Short Entry:
- Check if price below the set EMA (Can disable this rule if you'd like in the settings)
- RSI is in Overbought
- ADX is above set "Trend Ready" threshold (Meaning there is a trend going on)
- Price must approve the trend of previous candles. This is bullish for buy entries and bearish for sell entries.
- Enter with stop loss above last swing high with 1:1 or 1.5:1 take profit ratio.
This is my first indicator. Let me know if you want any updates. I am not sure if i can add everything but i'll try nonetheless.
Changed: Signals will check up to 2 candles before if the RSI is below or above the set value to show signal. This is because sometimes the entry signal is right but the response might be a bit late.

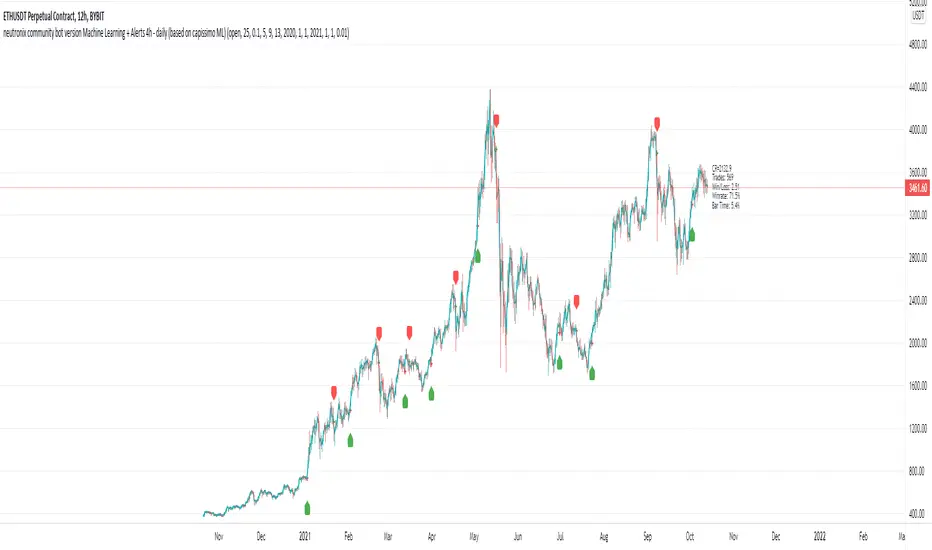
neutronix community bot ML + Alerts 4h-daily (mod. capissimo)Gm traders,
i have been a python programmer for some years studying artificial intelligence for general purpose; after some time i finally decided to have a look at some finance related stuff and scripts.
Moved by curiosity i've decided to make some but decisive modifications to a script i tried to use initially but without success: the LVQ machine learning strategy.
So after studying the charts and indicators, i have rewritten this script made by Capissimo and added heavy filtering thanks to vwap and vwma, then fixed repaint and other issues.
I hope you enjoy it and that it could increase your possibilities of success in trading.
HOW TO USE THE SCRIPT
Add the script to 3h+ charts like for example BTC 4h, 6h, 8h, 12h, daily. (In order for it to work on shorter timeframes charts you can try to change to lookback window but i dont advise it).
Change only rsi and volfilter(volume filtering) settings to try to find the best winrate. Leave dataset to open. Fyi the winrate isn't 100% accurate but can give you a raw vision of final results.
Use alerts included for trading and and in options click on 'Once per bar'. If you have checked 'Reverse Signals' in the control panel you have got more 'risky' signals so be advised if trading futures and stocks.
Exit trade signals not provided, so it is recommended the use of take profits and stop loss (1.5:1 ratio)
As always, the script is for study purposes. Do not risk more than you can spend!
Original LVQ-based strategy made by capissimo
Modified by gravisxv 13/10/2021
RSI Overbought Divergence Indicator with AlertsThis indicator alerts you only if there are divergences after price was oversold or overbought

Inverse Fisher Transform on RSI for backtest w/alertsThis version of the Inverse Fisher Transform on RSI comes with support for
1) Backtesting with Gavin's backtest script
2) Bypass, you can use another indicator to pause buy signals from this indicator. Just create another indicator that plots "1" whenever you want to activate the bypass on the IFTRSI signal.
3) Independent buy and sell level thresholds. Some tokens perform better with a higher sell level, even levels as high as 0.996, sometimes the buy level can also be relaxed to even 0.6 and get incredible results on the 5 minute chart.
4) alerts for Buy and Sell signals
Make sure you add Gavin's backtest and select external signal and this indicator as the source.

Darvas box (with alerts)Darvas box by Nicholas Darvas, extended original script by KıvanÇ @fr3762 to use new PineScript v4 function box.new()
You can create alerts with this script when price break to the upside or downside from Darvas box

Smart EMA SignalsThis indicator starts by plotting each time the price action crosses above or below the EMA, of which you can tune the timeframe and duration.
It then takes it a step further and plots whether or not that indicator would have given you a profitable trade, of which you can also tune the parameters (Max wait time, and % Profit).
Once you have your EMA tuned to your liking, set up alerts to notify you of a golden opportunity.

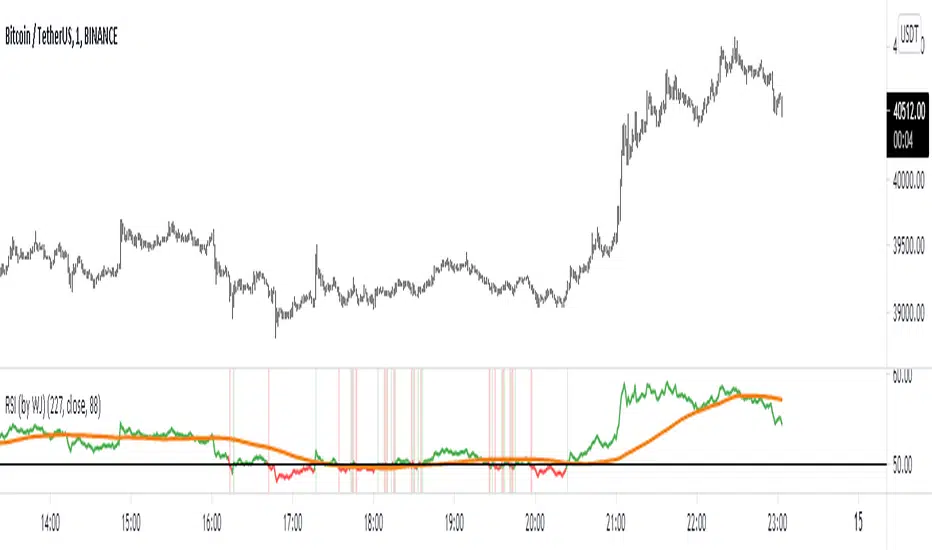
Relative Strength Index w/ 3 Levels & 0 Line Colour (by WJ)NOTE:
// RSI CODE TAKEN FROM DEFAULT INDICATOR
// I HAVE ONLY MADE SOME ADJUSTMENTS FOR VISUAL AID
// I MADE THIS FOR MY OWN USE BUT HAVE DECIDED TO PUBLISH AND SHARE IN CASE ANYBODY WANTS TO USE IT
This is the normal default built-in RSI indicator which I have added some stuff for visual aid:
Added middle line (50)
RSI turns green when crossed above 50
RSI turns red when crossed below 50
RSI background turns green and red on crossover candle based on whether RSI just crossed over or below 50 respectively
Alert notification on the crossover candle
EMA+RSI Pump & Drop Swing Sniper (With Alerts)This is using an EMA and RSI with slightly modified settings to give good entry and exit points while looking at Bitcoin. I use this on a 4-hour chart and with other indicators to find good positions to enter a trade or exit if things are turning red.
If you click on the EMA line it will color the bars of the chart based on if they are above or below the EMA - This is just visually helpful for me to see the active trend.
Make sure you hover over or click on the EMA line to see the colors of the candles change - it's not visible by default or without doing this.

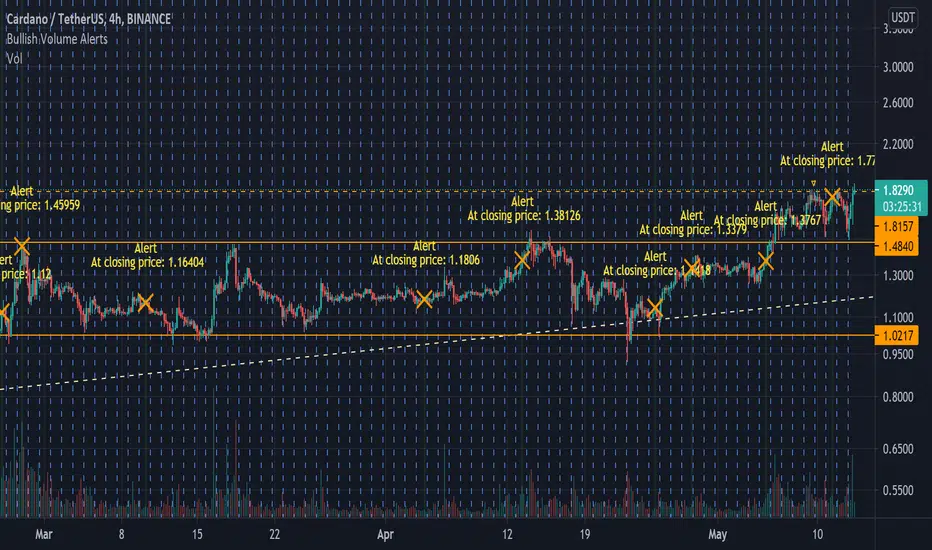
Bullish Volume [Alerts]A really simple script I made for someone, but also noticed I couldn't find anything like it that's as quick or simple (I may just be dumb)
Simply labels out and alerts you when three consequently higher volume bars appear, pretty useless on its own but for crypto, it works great to quickly notice if some important fundamentals suddenly cause the price to rocket. It works best with hour timeframes. Personally I'd use it with 4h.
I find it useful to know if something in a market is stirring attention and hope others can find it useful.
Squeeze Momentum Indicator MTF with alerts [lazy bear]MTF version of the popular squeeze momentum indicator, created and shared by Lazy Bear

Three EMA and Stochastic RSI Signals with TP and SL AlertsThis is kind of similar to one of my other scripts but I figured people might be looking for this one in a simple wrapped up package. It takes 3 EMAs, a 50, 14 and an 8 and the trade signals come from crossovers of the Stochastic RSI lines and conditions that marry up with the EMAs lining up in an uptrend or downtrend condition. I used the TP and SL lines from one of my other scripts so you can see where the winners and losers are. Includes alerts so they can be used with webhooks to automate however you wish. I have added signal confirmation with Weiss Wave Volume on side with trend. Stop and TP Levels are configurable in the settings as well as the periods for the ATR used in these calculations.
