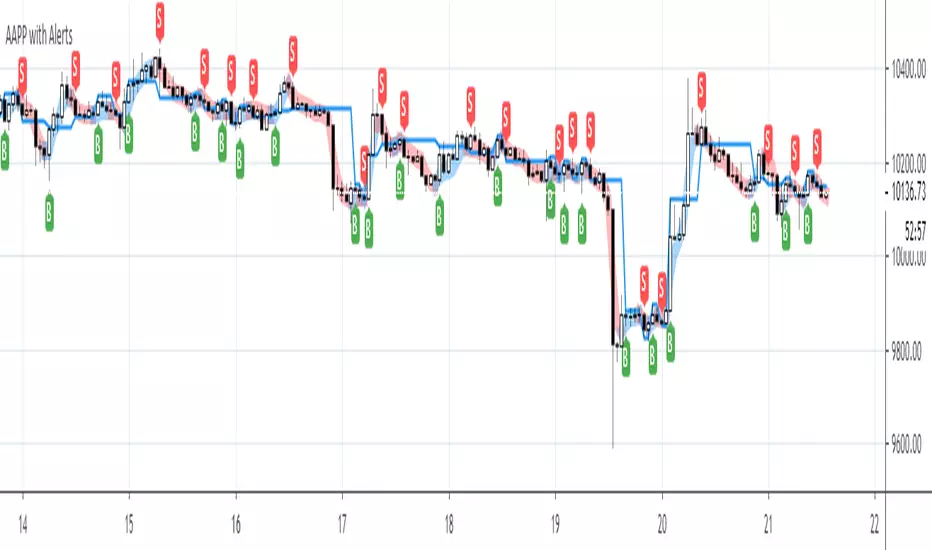
Vdub FX SniperVX3 / Strategy Alerts BetaThis is nothing other than a simple alert script I created for Vdub FX Sniper VX3 / Strategy by Vdubus
Thank you to WillowGoLightly for coming to me with the idea.
Change Log:
Removed plots & layover
Added a simple alert indicator to match original
Be sure to give Vdubus a big thanks!
Original Sniper Script by Vdubus:
Disclaimer: I have never used this indicator or alert script. There may be several unknown bugs. If found, please feel free to comment below and I will attempt to fix them. Use at your own risk.
Cerca negli script per "alert"

SuperTrend Multi Time Frame with Alerts V.1SuperTrend Multi Time Frame with Alerts.
You can add long and short alerts for all supertrend viewed on the graph.
The script plot 5min, 1H and D Supertrend.
Enjoy!

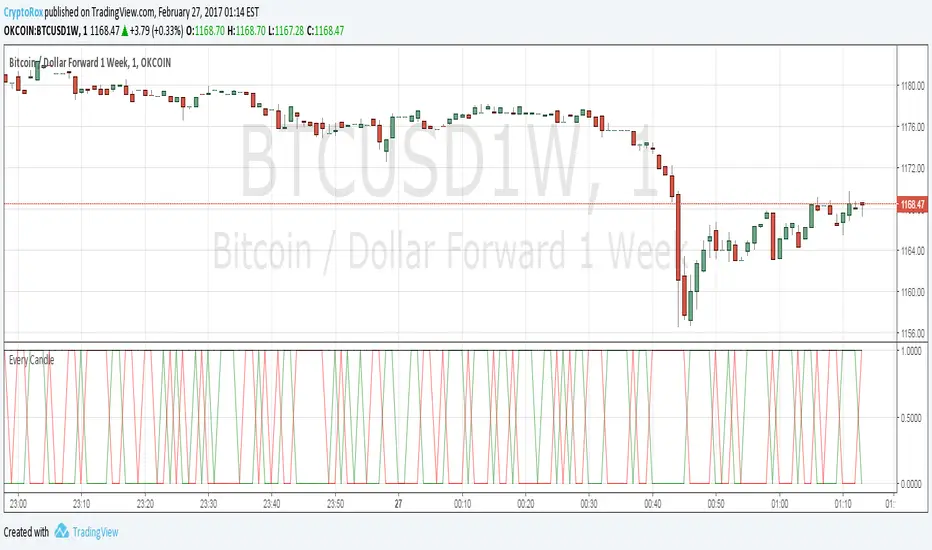
[Autoview] Every Candle Alert ScriptThis script is designed specifically for firing an alert every candle. It can also be used to just fire an alert on a green candle, or a red candle to slow it down a bit.
This is a script we use to close all of our orders or positions on any of the integrated exchanges.
You can use a fire once alert with greater than on condition and the alert will typically fire within seconds. You can also use this to place orders for you without having to navigate away from TradingView to your exchange/brokerage site.
If you would like a better understanding of how to create an alert for automation, please visit the article this strategy is being published for.
use.autoview.with.pink
SuperTrend V.1 AlertThis script is to use with "SuperTrend V1.0 - Buy or Sell Signal" by Rajandran.r
Use it with original Strategy for add TradingView Alert.
Enjoy!

Cumulative Price Change AlertCumulative Price Change Alert
Version: 1.0
Author: QCodeTrader 🚀
Overview 🔍
The Cumulative Price Change Alert indicator analyzes the percentage change between the current and previous open prices and sums these changes over a user-defined number of bars. It then generates visual buy and sell signals using arrows and labels on the chart, helping traders spot cumulative price momentum and potential trading opportunities.
Key Features ⚙️
Customizable Timeframe 🕒:
Use a custom timeframe or default to the chart's timeframe for price data.
User-Defined Summation 🔢:
Specify the number of bars to sum, allowing you to analyze cumulative price changes.
Custom Buy & Sell Conditions 🔔:
Set individual percentage change thresholds and cumulative sum thresholds to tailor signals for
your strategy.
Visual Alerts 🚀:
Displays green upward arrows for buy signals and red downward arrows for sell signals directly
on the chart.
Informative Labels 📝:
Provides labels with formatted percentage change and cumulative sum details for the analyzed
bars.
Versatile Application 📊:
Suitable for stocks, forex, crypto, commodities, and more.
How It Works ⚡
Price Change Calculation ➗:
The indicator calculates the percentage change between the current bar's open price and the
previous bar's open price.
Cumulative Sum ➕:
It then sums these percentage changes over the last N bars (as specified by the user).
Signal Generation 🚦:
Buy Signal 🟢: When both the individual percentage change and the cumulative sum exceed
their respective buy thresholds, a green arrow and label are displayed.
Sell Signal 🔴: Conversely, if the individual change and cumulative sum fall below the sell
thresholds, a red arrow and label are shown.
How to Use 💡
Add the Indicator ➕:
Apply the indicator to your chart.
Customize Settings ⚙️:
Set a custom timeframe if desired.
Define the number of bars to sum.
Adjust the buy/sell percentage change and cumulative sum thresholds to match your trading
strategy.
Interpret Visual Cues 👀:
Monitor the chart for green or red arrows and corresponding labels that signal potential buy or
sell opportunities based on cumulative price movements.
Settings Explained 🛠️
Custom Timeframe:
Select an alternative timeframe for analysis, or leave empty to use the current chart's timeframe.
Number of Last Bars to Sum:
Determines how many bars are used to compute the cumulative percentage change.
Buy Condition - Min % Change:
The minimum individual percentage change required to consider a buy signal.
Buy Condition - Min Sum of Bars:
The minimum cumulative percentage change over the defined bars needed for a buy signal.
Sell Condition - Max % Change:
The maximum individual percentage change threshold for a sell signal.
Sell Condition - Max Sum of Bars:
The maximum cumulative percentage change over the defined bars for triggering a sell signal.
Best Use Cases 🎯
Momentum Identification 📈:
Quickly spot strong cumulative price movements and momentum shifts.
Entry/Exit Signals 🚪:
Use the visual signals to determine potential entry and exit points in your trading.
Versatile Strategy Application 🔄:
Effective for scalping, swing trading, and longer-term analysis across various markets.
UPD: uncheck labels for better performance

Heikin-Ashi Trend AlertThis script:
Adds a Heikin-Ashi line to the chart (EMA-based).
Provides alerts triggered when the color goes from green to red and vice versa.
Just add the indicator to the chart, create an alert and select " Heikin-Ashi Trend Alert " from the dropdown. Profit.

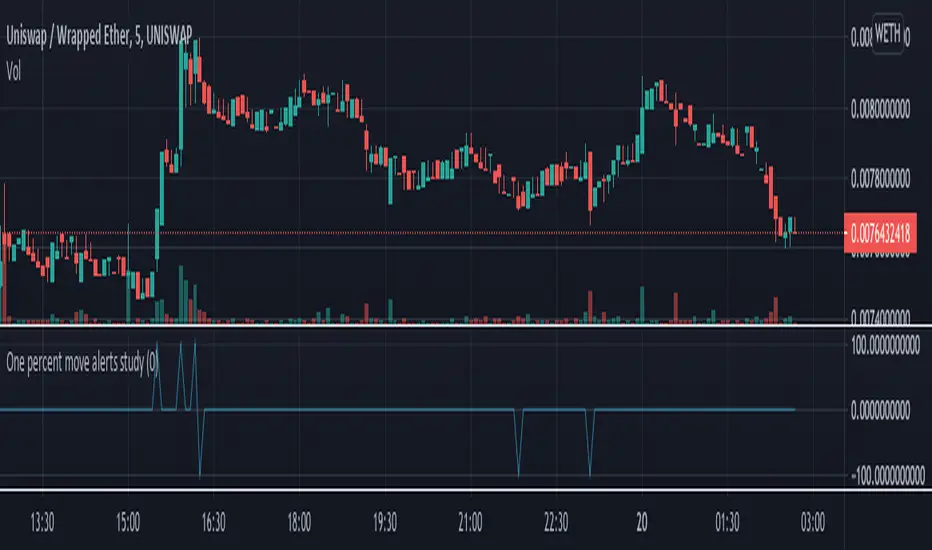
One Percent Move Study (For your Alerts)This is a simple script that can be used to alerts. The signal1 variable goes to 100 if there is a 1% up move in a tick, and goes to -100 if there is a 1% down move in a tick for an asset. This is best on a 1 minute or 5 minute chart.
This example shows this on the DeFi exchange Uniswap for the UNI/ETH pair
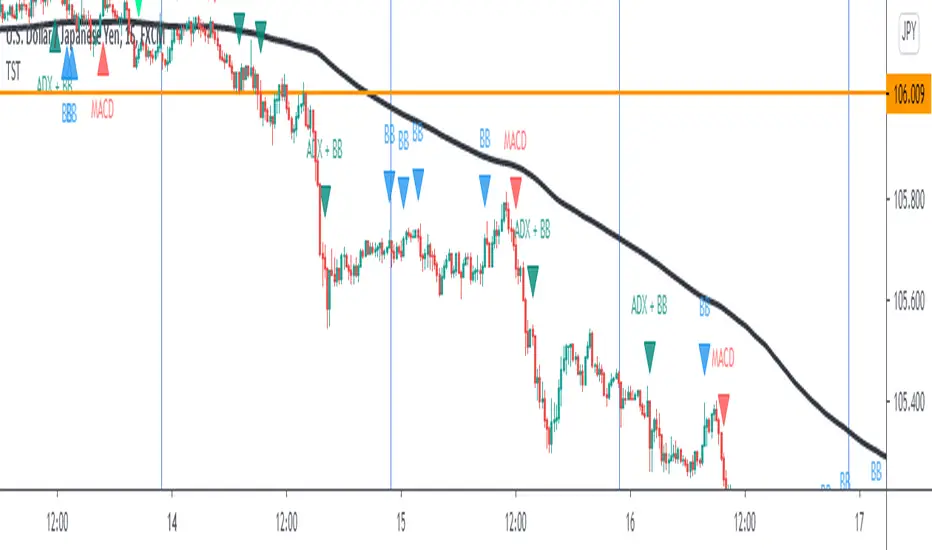
TST Signals & AlertsThis is an unofficial script for strategies tested on Trading Strategy Testing Youtube channel. Over time, most successful strategies will be added with an option to set strategy-specific alerts . TST Signals & Alerts will draw signals on the chart when the entry conditions are met. You can also opt for displaying indicators .
My script is meant for beginners but can be used by veterans too. Just pick one or two strategies, you don't want to flood your chart with conflicting signals. You may want to support your trades with a proper analysis. Is the market trending? Is there a fundament around the corner?
If a new signal occurs when there is still an open position, you are not supposed to take another.
The current version includes MACD and ADX + BB and BB strategies.
MACD strategy:
►Buy, when MACD crosses below the signal line when it is negative. The price must also be above 200 EMA.
►Sell, when MACD crosses above the signal line when it is positive. The price must also be below 200 EMA.
►This strategy was tested on 15-minute charts of EURUSD with reward-to-risk ratio 1,5 and win rate of 61% over 100 trades.
►►►MACD has to be added to your chart separately because it needs a new window. Ticking display indicators will not add MACD to your chart.
►►►MACD was also tested by a different channel I made a script for. You can view the results and the script here:
ADX + BB strategy:
►Buy, when the price is above 200 EMA and ADX becomes higher than 25.
►Sell, when the price is below 200 EMA and ADX becomes higher than 25.
►Stop-loss is either 200 EMA or Bollinger Bands level. Check the channel for more information.
►This strategy was tested on 5-minute charts of EURUSD, USDJPY, AUDUSD with reward-to-risk ratio 1,2 and win rate of 56% over 100 trades in total.
BB strategy:
►Buy, when the price is above 200 EMA and candle's low is below the lower Bollinger Band.
►Sell, when the price is below 200 EMA and candle's high is above the upper Bollinger Band.
►This strategy was tested on 15-minute charts of EURUSD with reward-to-risk ratio 1,5 and win rate of 52% over 100 trades in total.
►►►Due to the relatively low win rate of this strategy, you need to filter out potentially harmful signals with a proper analysis.
Bear in mind that backtesting performance doesn't guarantee future profitability. • Most systematic strategies are not suitable for each timeframe - if you use the different timeframe than the one it was tested on, the result can differ significantly. • You should perform your own backtest to base your trades on more data & to establish confidence in the selected strategy. • This script is not a replacement for proper analysis.
New strategies will be added when I have time. If I see multiple people asking for the same feature, I might agree to release it with a new version. I am not going to add input options in this script, it could come as a separate script though. I am in no way affiliated with the Youtube channel, so if you find the script helpful, shot me a message or send me some TradingView coins >)
If you encounter any bug, you can report it in a message or in comments. Support it with screenshot and relevant information such as a time when it occurred and what options were on etc.
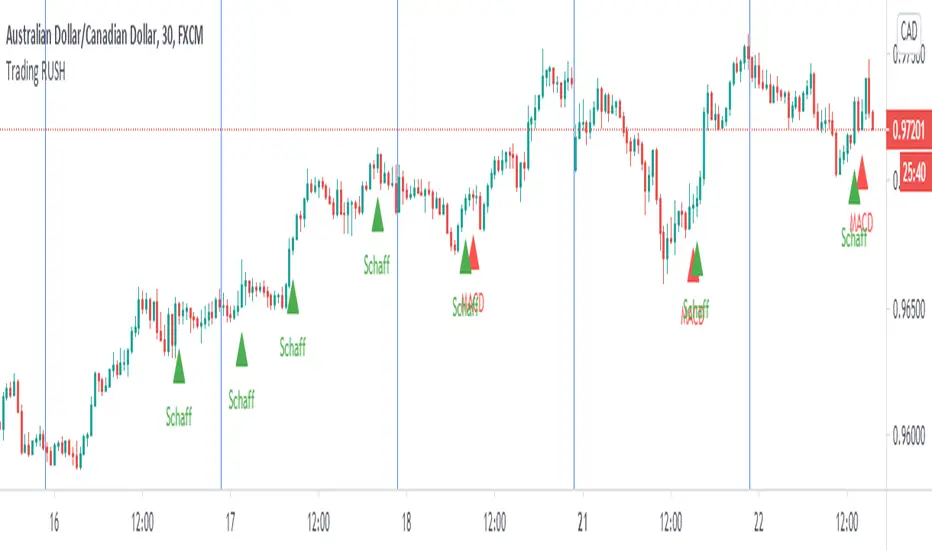
Trading Rush Signals & AlertsThis is an unofficial script for strategies tested on TRADING RUSH Youtube channel. Over time, most successful strategies will be added with an option to set strategy-specific alerts . Trading Rush Signals & Alerts will draw signals on the chart when the entry conditions are met. You can also opt for displaying indicators .
My script is meant for beginners but can be used by veterans too. Just pick only one or two strategies, you don't want to flood your chart with conflicting signals. You may want to support your trades with a proper analysis. If a new signal occurs when there is still an open position, you are not supposed to take another.
The current version includes MACD and Donchian Channels.
MACD strategy:
►Buy, when MACD crosses below the signal line when it is negative. The price must also be above 200 EMA.
►Sell, when MACD crosses above the signal line when it is positive. The price must also be below 200 EMA.
►This strategy was tested on 30-minute charts of EURUSD and EURJPY with reward-to-risk ratio 1,5 and win rate of 62% over 100 trades .
►►►MACD has to be added to your chart separately because it needs a new window. Indicators displaying will not add this indicator to the chart.
Donchian Channels strategy:
►Buy, when the price breaches Donchian to the upside after making a new low. The price must also be above 200 EMA.
►Sell, when the price breaches Donchian to the downside after making a new high. The price must also be below 200 EMA.
►Stop-loss is Donchian bottom for long and Donchian top for shorts. Check the channel for more information.
►This strategy was tested on 30-minute charts of EURUSD with reward-to-risk ratio 1,5 and win rate of 58% over 100 trades .
►►►I programmed alerts for Donchians to come ahead of an actual breach. If you often leave the screen when trading, this will help you. The necessary downside for that is the alerts might come when the signal doesn't trigger in the end. You will see a mark on the chart if the conditions are truly met.
Bear in mind that backtesting performance doesn't guarantee future profitability. • Most systematic strategies are not suitable for any timeframe. • You should perform your own backtest to base your trades on more data & to establish confidence in the selected strategy.
New strategies will be added when I have time. If I see multiple people asking for the same new feature, I might agree to release it with a new version. I am not going to add input options in this script, it could come as a separate script though. I am in no way affiliated with the Youtubechannel , so if you find the script helpful, shot me a message or send me some TradingView coins >)
If you encounter any bug, you can report it in a message or in comments. Support it with screenshot and relevant information such as a time when it occurred and what options were on etc.
Pump AlertsMy very first indicator in Pine Script with two alert conditions for trading bots.
It's based on " Pump Catcher " by @ joepegler
I modified some parts, hopefully improved the usability and enabled alerts, so you can use it to trigger bots like 3commas via webhooks.
Pump Alerts 🚀 attempts to "detect moments of abnormal and accelerating increase in volume" AKA "pumps". Small and big pumps.
I recommend using it on small timeframes like 1 to 15 min and tinkering with the lookback period as well as threshold values.
Other than that it's pretty self-explanatory and beginner-friendly.
Free and Open Source. Let me know how you use it!

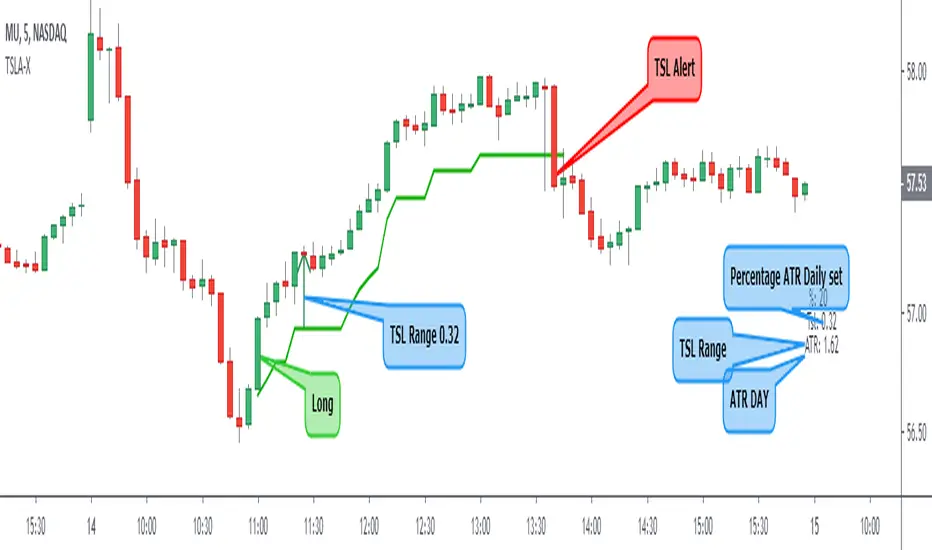
Trailing Stop Loss ATR + AlertI share this TSL indicator with alert (I use it only for Stocks), the configuration is very simple, you must select if it is a Short or Long operation, time at which the operation was opened,% of the daily ATR for TSL. It also contains:
- Alert
- Panel Info
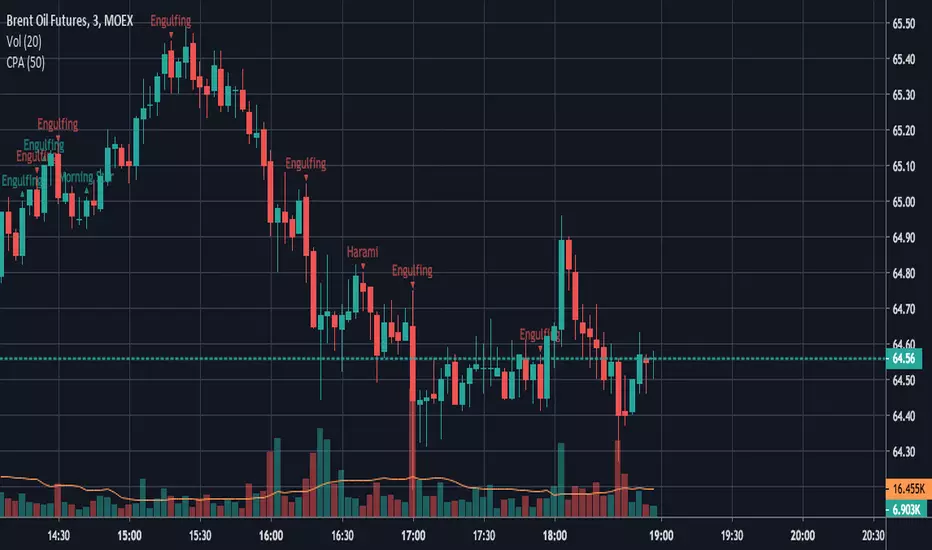
Candle Patterns AlertCandlestick pattern alerts for strategies "Candle Patterns Strategy" and "Candle Patterns Strategy - 2".
In order not to receive unnecessary signals, in the "Manage alerts" option should be selected "Once per bar close".
Elgrand - MACD crossover overlay with alertVisualize MACD bullish and bearish crossovers on your chart as an overlay. This way you won't necessarily have to add the MACD script and check manually at which point on your chart the MACD crossed. Optionally you can set alerts on the MACD crossovers in case you would like to trade from this after the signal occured.

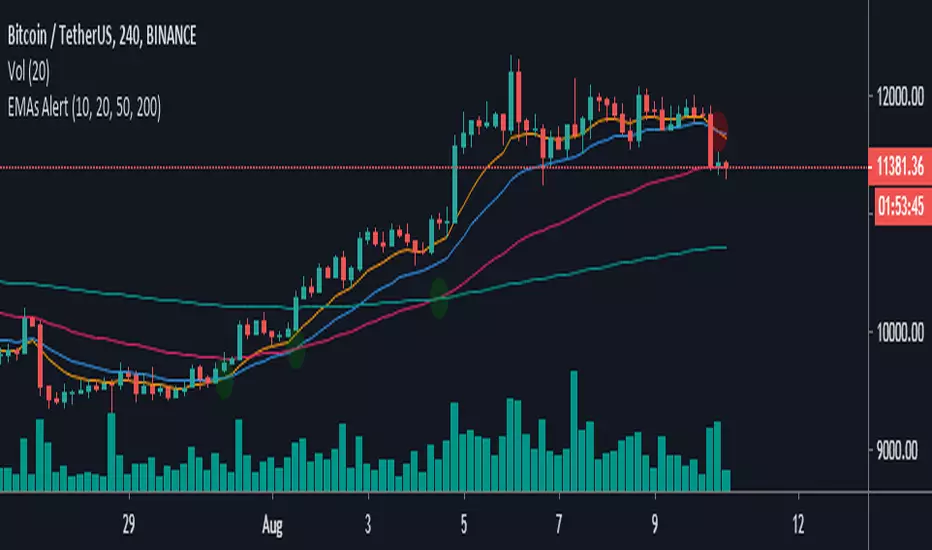
EMAs Alert-This script allows you to show the crossings of the most important emas such as 10, 20, 50 and 200
-You can modify the values of each ema you like
-Bring alerts of the crosses of each ema, which will allow you to activate this function to only the assets you want to track
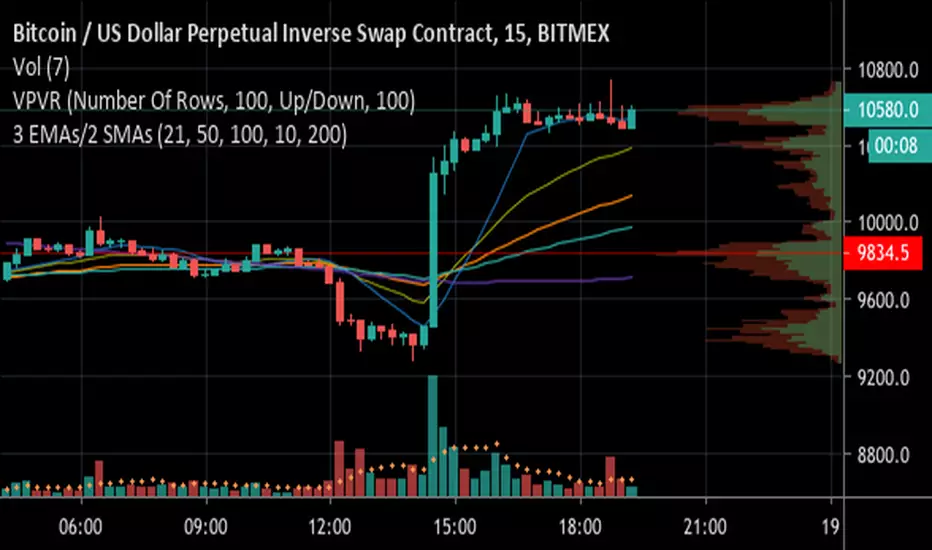
3 EMAs with Crossing Alerts & 2 SMAsHi all,
This is a simple indicator that plots 3 EMA lines and 2MAs of your choice to the screen and has built in alert triggers.
Features:
1) Alerts are triggered when EMAs 1 (Signal line) and 2 (Baseline) cross - a Long signal is called if the cross is above EMA 3 ( Trendline ), a short if the cross is below EMA3
2) Signals are represented visually as a triangle on the chart, below the candles is a long, above is a short
3) TradingView Alerts can be easily set as I have labelled the signals clearly as many other Indicators like this aren’t easy to work out if trying to create alerts to trigger a 3commas bot, for example!
Each EMA is fully customisable and if you wish to take advantage of the alerts, only a few simple rules need to be followed:
EMA1 needs to be less than EMA2.
EMA2 needs to be the same or greater than EMA3
That’s it, happy trading!
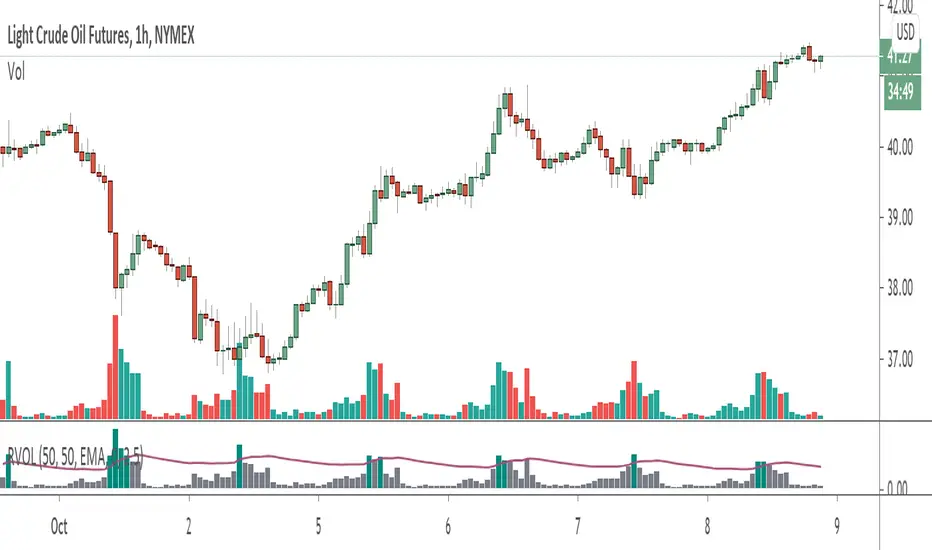
Volume+ (RVOL/Alerts)This indicator colors the volume bars based on any of the three follow criteria:
- Volume Amount
- RVOL (Relative Volume)
- Lookback (Highest Over Period)
You can use one, two or all three of these settings at the same time.
You can also set alerts with this indicator. The script will trigger an alert whenever any of the three specified flags are triggered.
RVOL is calculated as: Volume divided by Moving Average value. You can change the moving average period (and type) in the settings.
Big Snapper Alerts R2.0 by JustUncleLThis is a diversified Binary Option or Scalping Alert indicator originally designed for lower Time Frame Trend or Swing trading. Although you will find it a useful tool for higher time frames as well.
The Alerts are generated by the changing direction of the ColouredMA (HullMA by default), you then have the choice of selecting the Directional filtering on these signals or a Bollinger swing reversal filter.
The filters include:
Type 1 - The three MAs (EMAs 21,55,89 by default) in various combinations or by themselves. When only one directional MA selected then direction filter is given by ColouredMA above(up)/below(down) selected MA. If more than one MA selected the direction is given by MAs being in correct order for trend direction.
Type 2 - The SuperTrend direction is used to filter ColouredMA signals.
Type 3 - Bollinger Band Outside In is used to filter ColouredMA for swing reversals.
Type 4 - No directional filtering, all signals from the ColouredMA are shown.
Notes:
Each Type can be combined with another type to form more complex filtration.
Alerts can also be disabled completely if you just want one indicator with one colouredMA and/or 3xMAs and/or Bollinger Bands and/or SuperTrend painted on the chart.
Warning:
Be aware that combining Bollinger OutsideIn swing filter and a directional filter can be counter productive as they are opposites. So careful consideration is needed when combining Bollinger OutsideIn with any of the directional filters.
Hints:
For Binary Options try ColouredMA = HullMA(13) or HullMA(8) with Type 2 or 3 Filter.
When using Trend filters SuperTrend and/or 3xMA Trend, you will find if price reverses and breaks back through the Big Fat Signal line, then this can be a good reversal trade.
Some explanation about the what Hull Moving average and ideas of how the generated in Big Snapper can be used:
tradingsim.com
forextradingstrategies4u.com
Inspiration from @vdubus
Big Snapper's Bollinger OutsideIn Swing filter in Action:

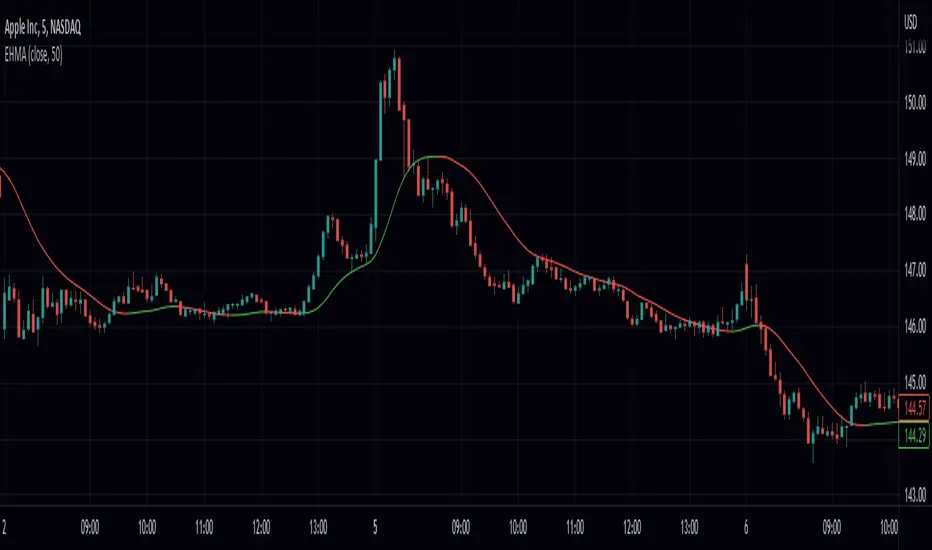
Exponential Hull Moving Average With Alerts (EHMA)Hello! This is simply HMA calculated with EMA's instead of WMA! I have added alerts for the direction of the average.
Heres a recap the traditional HMA:
The Hull Moving Average ( HMA ) attempts to minimize the lag of a traditional moving average while retaining the smoothness of the moving average line. Developed by Alan Hull in 2005, this indicator makes use of weighted moving averages to prioritize more recent values and greatly reduce lag.
MACD Multiple AlertsThis script help traders to catch bullish and bearish momentum. It creates an alert for 40 altcoins based on the MACD cross over and cross under.
The MACD input are adjustable in the settings and you can choose your favorite assets.
Simply add this indicator to the chart wait that if finish to load and then create an alert on the time frame of your choice.
Enjoy your trading
F_rank_01

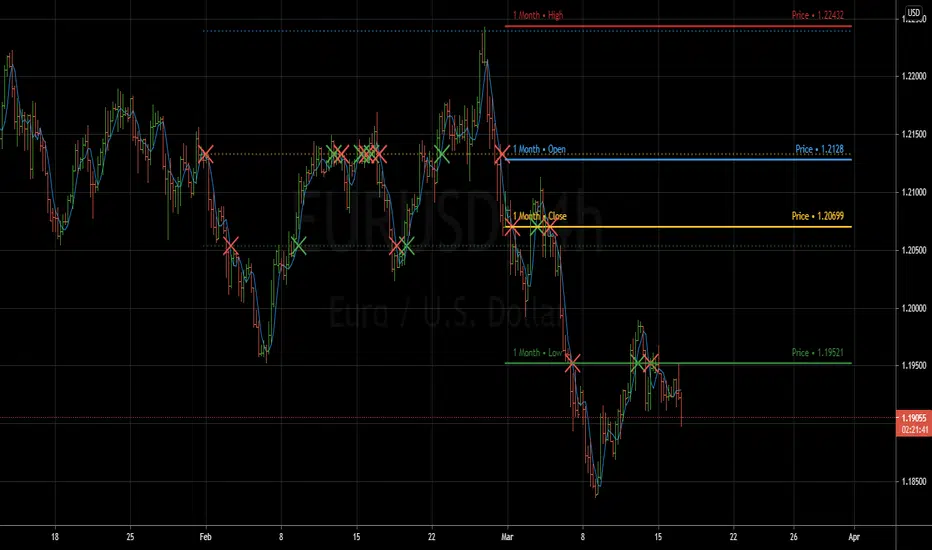
Previous Period Levels - X Alerts====== ABOUT THIS INDICATOR
- A simple but highly customisable display of previous higher time-frame
OHLC values, drawn using line.new and label.new. Nothing fancy but...
- Customised resolution input which excludes time frames lower than 1 hour
while extending the common higher reference inputs to include:
• 6, and 12 Hour
• 5 Day
• 3, and 6 Month
• 1 Year
- Alert conditions using an adjustable SMA to help reduce false positive
spam.
- Full visual customisation options for (almost) every aspect, so it can be
tuned to suit most individual preferences.
- In line with the miriad visual customisation options is the ability to
change the display format of the Labels, to show more or less information,
or disable them altogether.
====== REASON FOR STUDY
- To practice advanced user input option handling to allow for a full visual
customisation experience without stepping outside of, or interfering with,
the intended function of the indicator.
- Provide reasonably clear code commenting and structure in order to be
useful as a potential learning aid for others, and future reference for
myself.
====== DISCLAIMER
Any trade decisions you make are entirely your own responsibility.
I've made an effort to squash all the bugs, but you never know!
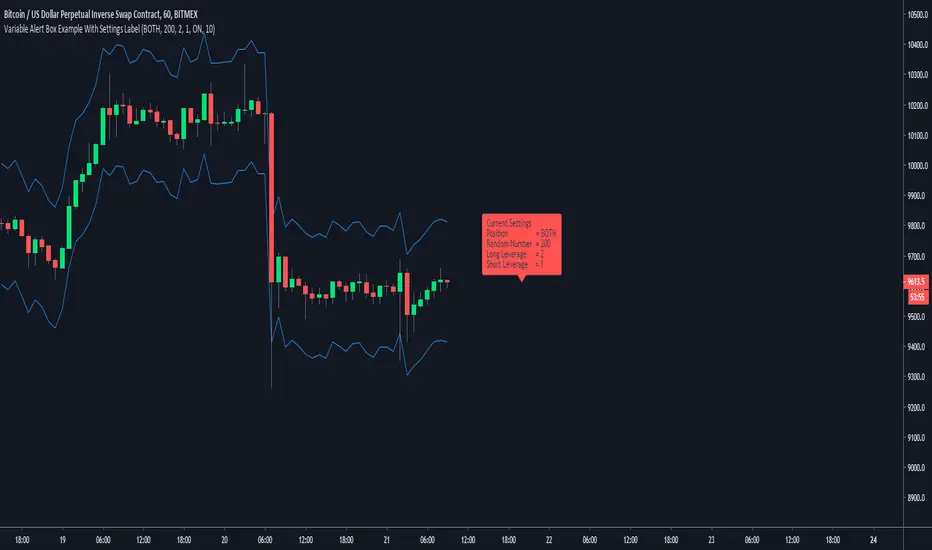
Variable Alert Box Examplejust publishing to share to novice pine coders like myself
any feedback on layout/structure/shortcuts will always be appreciated, not that this is a long script with much that can go wrong
short little what ever to show variable alert message
needs to draw the number from a plotted number like line 18 and 19, and cant be gettin the numbers from line 14 and 16
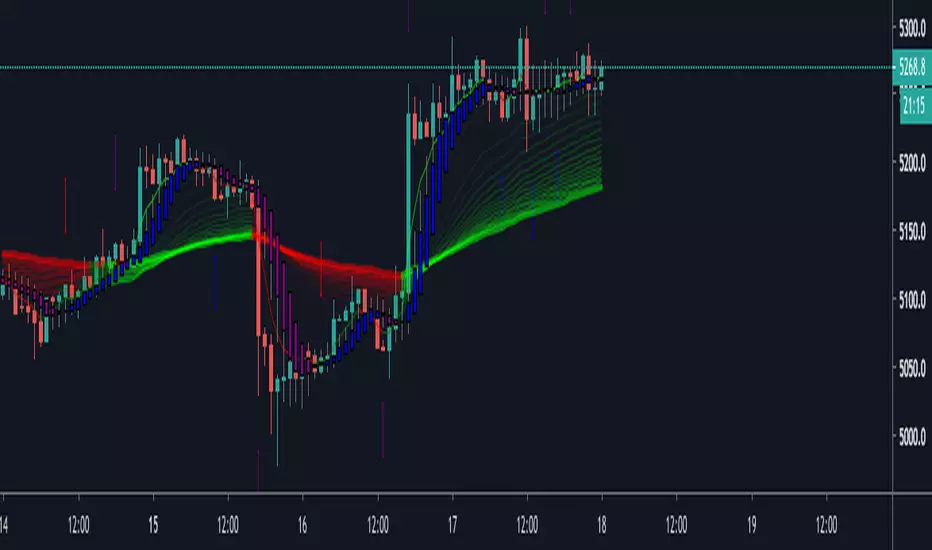
SHA & MMAR Strategy Alert IndicatorIndicator w/ alerts for 'Slow-Heiken Ashi & Madrid Moving Average Strategy'.
High win-percentage with cryptocurrencies on a 1H timechart.