function: Array DownsamplingA low cost function to down sample a array.
specially useful for pattern recognition algorithms.
Cerca negli script per "algo"

Reversal Algo (Zeiierman)█ Overview
Reversal Algo (Zeiierman) is an adaptive reversal and momentum detection system that helps identify hidden turning points, pressure zones, and changes in market direction. It brings together advanced modeling techniques such as dynamic volatility bands, adaptive trend tracking, and momentum-based confirmation signals into one clear, visual framework.
Unlike traditional reversal indicators that depend on static oscillators or fixed levels, this tool adapts in real time to market movement. It tracks volatility and directional flow to reveal when momentum is building, slowing down, or preparing to reverse.
Whether applied to short-term scalping, swing positioning, or macro structural validation, this tool provides an adaptive analytical environment that translates complex price dynamics into actionable context.
⚪ Why This One Is Unique
This version of Reversal Algo employs multi-domain adaptive modeling, combining envelope projection, trend inertia estimation, and contrarian equilibrium tracking within a single structure.
Its framework merges nonlinear smoothing manifolds with volatility-compensated directional phase mapping, allowing it to evolve with shifting market states rather than react to them.
Optional AI-driven optimizations enhance precision in unstable regimes by dynamically reshaping envelopes and tracking lines around localized flow curvature.
█ Main Features
⚪ Reversal Cloud
The Reversal Cloud highlights areas of potential expansion, compression, and turning points in price. It adapts to volatility by expanding when markets become unstable and tightening during periods of calm, creating a visual map of market rhythm and elasticity.
When the Cloud widens, it often signals exhaustion or increased turbulence; when it narrows, it suggests balance or an upcoming breakout.
With AI mode enabled, the Cloud automatically fine-tunes its shape to align with live price behavior, keeping its structure responsive and accurate.
⚪ Reversal Signals
Reversal Signals are designed to identify potential market turning points with precision. They combine multiple layers of price behavior—momentum shifts, directional changes, and balance-point deviations—to highlight areas where reversals are statistically more likely. To reduce false clusters, the system intelligently filters out repeated signals within a short time window.
⚪ Reversal/Exit Points
Reversal/Exit Points appear as small, color-coded dots above or below candles. They signal moments where price momentum slows or where the system detects a potential shift in directional strength. These markers are often found near short-term highs or lows, making them ideal for identifying profit-taking zones, re-entry setups, or early warnings of a possible reversal.
⚪ Trend Framework
The Trend Framework provides a clean visualization of the market’s prevailing direction. It smooths out short-term noise to reveal the core trend structure, showing when the market is expanding, contracting, or transitioning between phases.
This framework helps traders quickly see whether price action supports continuation or if the trend is weakening.
⚪ Trend Tracker Line
The Trend Tracker Line is a highly responsive trend detector that reacts quickly to shifts in momentum. It adapts dynamically to volatility, providing an accurate real-time view of directional acceleration and deceleration. This helps traders spot early changes in market tone and evaluate whether a move has the strength to continue.
When AI mode is enabled, the line automatically adjusts its sensitivity to remain stable and consistent across different market conditions.
⚪ Contrarian Bar Coloring
Contrarian Candle Coloring enhances chart readability by visually distinguishing strength from weakness. Green bars highlight areas of building upward momentum, while red bars point to potential pressure or exhaustion. The system continuously adapts its color transitions to reflect subtle momentum shifts, making it easier to recognize when the market is gaining or losing conviction.
An optional AI mode fine-tunes these transitions to match the current market rhythm, ensuring that candle coloration always reflects the underlying flow of strength and weakness.
█ How to Use
⚪ Reversal Trading
The primary purpose of the indicator is to identify reversal opportunities in the market. Reversal or contrarian trading means entering positions against the current directional move in anticipation of a fade or trend rotation. This approach often occurs in high-volatility environments, so it is important to widen your stops, reduce your initial position size, and, if appropriate, scale or average into positions carefully rather than committing all capital at once.
The Reversal Algo provides predefined Buy and Sell signals designed to highlight potential market peaks and troughs. While these signals are highly accurate, they are not meant to call every top or bottom perfectly. In a strong trending market, several reversal signals may appear consecutively before the market fully turns.
⚪ Reversal Signal + Candle Coloring
Combine Reversal Signals with Contrarian Candle Coloring for added confirmation. A practical approach is to wait for a Reversal Signal and then look for a color shift in the candles (for example, from contrarian-colored to standard candles). This color transition acts as confirmation that the active move may be losing strength and that a reversal could be underway.
⚪ Reversal Signals + Reversal Cloud
Consider taking reversal entries only when price interacts with the Reversal Cloud boundaries. The Cloud’s upper and lower layers act as dynamic resistance and support zones. When a Reversal Signal appears near or immediately after price rejection from one of these layers, it adds structural confirmation to the setup and strengthens the case for entry.
⚪ Reversal Signals + Key Levels
One of the most effective ways to trade Reversal Signals is by combining them with key price levels, such as the previous day’s high, low, or close. If price rejects one of these levels while a Reversal Signal prints simultaneously, the confluence of the two events serves as strong validation for a potential turning point.
⚪ Take Profit
The Reversal/Exit Points can function both as entry confirmations and as take-profit zones. If a Reversal Signal was missed but a new Reversal/Exit Point appears near a peak or trough, it can indicate a late-entry opportunity aligned with exhaustion behavior.
These dots are most powerful as profit-taking signals. Since they form near local highs and lows, they often mark regions of temporary imbalance where reversals are likely. When a Reversal/Exit Point forms in the opposite direction of your current position, consider taking partial profits or tightening stops to lock in gains while maintaining participation in the broader move.
█ How It Works
⚪ Reversal Cloud Engine
The Reversal Cloud defines the dynamic upper and lower boundaries of market elasticity by transforming recent price displacements into a smooth volatility field. Through multi-layered envelope modeling, it constructs a continuous topology of expansion and compression zones, revealing where directional energy accumulates or dissipates.
Calculation: Uses layered volatility envelopes that adapt to changing market speed and expansion. A built-in alignment mechanism keeps the upper and lower bands synchronized, while optional AI optimization adjusts the symmetry of the cloud based on short-term directional bias.
⚪ Trend Tracker System
The Trend Tracker isolates directional persistence by modeling angular displacement of price flow over adaptive temporal curvature. It interprets slope evolution as a continuously evolving directional vector field, capturing both acceleration and deceleration within the active regime.
Calculation: Applies adaptive slope modeling to estimate the dominant direction of price flow. The system smooths fluctuations dynamically while maintaining responsiveness to significant shifts in trend velocity. When AI mode is active, an intelligent weighting adjustment refines the tracker’s equilibrium bias for better phase synchronization.
⚪ Trend
The Trend module projects a dual-polarity directional lattice, distinguishing constructive (positive) and distributive (negative) flow environments. It defines equilibrium corridors that expand and contract with evolving trend geometry, offering visual feedback on regime strength and transition probability.
Calculation: Uses weighted directional regression to estimate upper, middle, and lower trend layers. Each structure is color-coded based on price slope and relative position, creating a continuous and easy-to-read trend map.
⚪ Contrarian Bar Coloring Engine
Contrarian bar coloring converts raw bar data into a slope-weighted momentum matrix, visually encoding thrust versus decay phases in real time. It acts as a microstructural interpreter of price inertia, identifying acceleration clusters and momentum fatigue through color transitions.
Calculation: Combines slope analysis and volatility normalization to evaluate how strong or weak each price bar is relative to its trend. The results are reflected in real-time color changes that emphasize momentum strength and fatigue.
⚪ Reversal/Exit System
Reversal and Exit Points are derived from an evolving volatility-based trail that tracks directional exhaustion and reversion potential. These markers visualize transitions in directional energy—helping traders anticipate trend slowdowns or reversal probabilities.
Calculation: Constructs an adaptive volatility trail that contracts as directional momentum weakens. A state-aware detection model identifies inflection points where pressure changes polarity, producing the plotted up/down dots that mark possible reversals or exits. This ensures that each signal dynamically reflects real-time shifts in market energy rather than static thresholds.
⚪ Reversal Signals Core
The Reversal System’s entry framework is designed for precision. It combines several layers of short-term momentum analysis into clear, directionally aligned signals. By balancing different market speeds and measuring how far the price moves from its equilibrium, it identifies high-probability areas where trends may continue or reverse.
Calculation: Implements a composite synchronization framework that aligns short-term momentum phases with equilibrium drift and directional bias. Redundant triggers are filtered out through temporal separation logic, ensuring only the most distinct and reliable signals are displayed. Adaptive thresholds adjust automatically based on volatility and trading mode, maintaining signal consistency across scalp, intraday, and swing environments.
⚪ AI-Adaptive Optimization Layer
The AI layer refines selected modules — Reversal Cloud, Trend Tracker, and Contrarian Candles — by continuously recalibrating their internal weighting curves according to volatility structure and price curvature. It acts as an intelligent stabilizer that adjusts smoothing depth, boundary stiffness, and gradient bias dynamically.
Calculation: Utilizes a Context-Aware Kernel Adjustment Engine, estimating curvature variance and phase imbalance to auto-tune envelope response. The model performs iterative self-alignment to preserve directional fidelity under rapidly changing flow dynamics.
-----------------
Disclaimer
The content provided in my scripts, indicators, ideas, algorithms, and systems is for educational and informational purposes only. It does not constitute financial advice, investment recommendations, or a solicitation to buy or sell any financial instruments. I will not accept liability for any loss or damage, including without limitation any loss of profit, which may arise directly or indirectly from the use of or reliance on such information.
All investments involve risk, and the past performance of a security, industry, sector, market, financial product, trading strategy, backtest, or individual's trading does not guarantee future results or returns. Investors are fully responsible for any investment decisions they make. Such decisions should be based solely on an evaluation of their financial circumstances, investment objectives, risk tolerance, and liquidity needs.
Script a pagamento

Bitcoin: Top & Bottom Mini-AlgoHere we have a mini-algorithm that tries to show absolute 4-year-cycle top and bottom zones for the case of the BraveNewCoin Liquid Index (BLX) for Bitcoin on the weekly (W) timeframe by using several oscillators as RSI, VPCI etc. employed with a custom logic. When the background gets red we might be near to a cycle peak, and when it gets green we might be near to the absolute bottom of the current cycle. Note that only absolute top/bottoms are indicated (at least since the end of 2013), so that the current strong drop in March 2020 was correctly not tagged, as it wasn't the lowest price of the current cycle.
It is best to combine this mini-algorithm with some of my boundary indicators for BLX, e.g. "Bitcoin: Price Action Integrals", for confluence . For the next peak one could then watch for the mini-algo to go red and for the price to hit the boundary. You can change the background transparency if you like to have this indicator be more unobstrusive on the chart.
For access please contact me via DM on TradingView or on Twitter (linked on my TradingView profile and my signature).

Aggressive Buy/Sell AlgoBacktested, high percentage gains aggressive indicator/algo.
Version 1.
I recommend using this script to form your bias for your selected timeframe.
If you are trading solely based off the indicator, each Buy/Sell signal is not an indication to close a previous position.
For example, if you open a position because of a recent sell signal you do not have to close it on the next buy signal.
If you are running an algo however, it is personal preference.
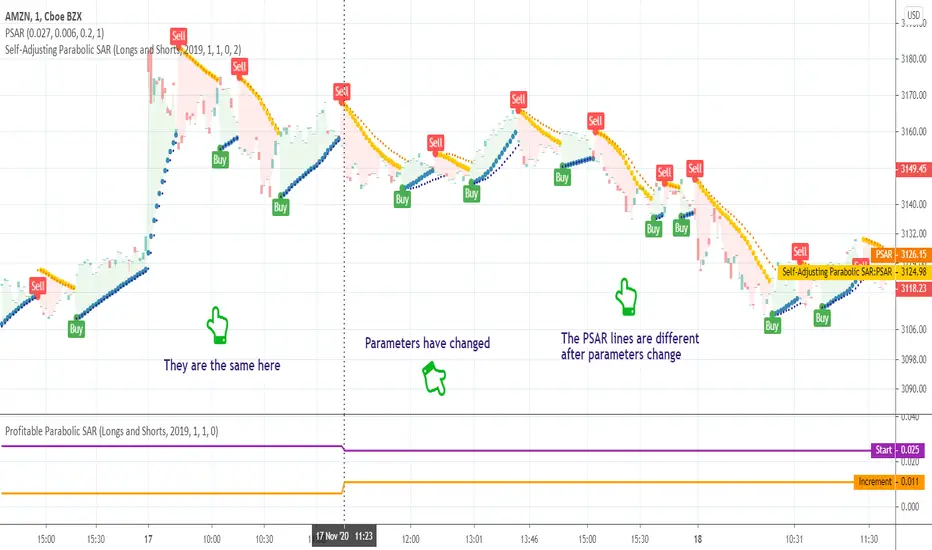
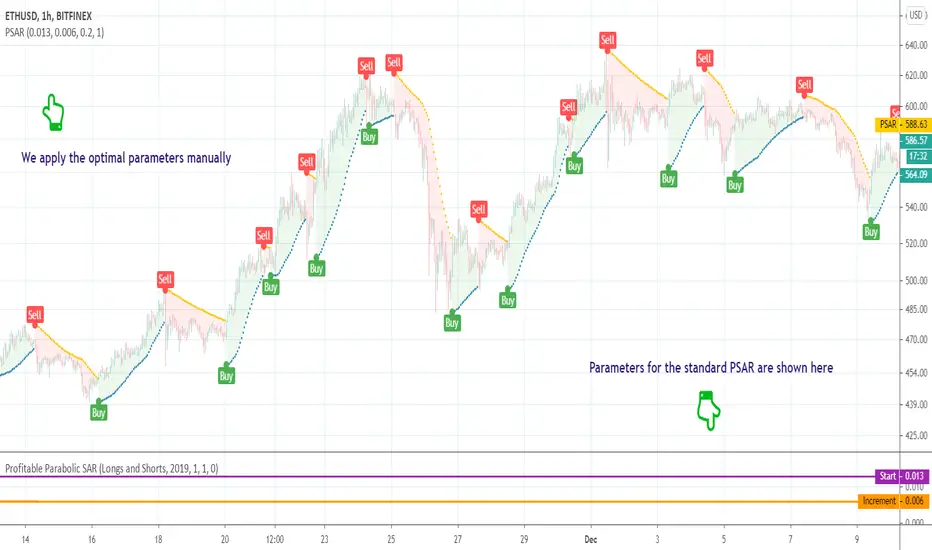
Self-Adjusting Parabolic SARWhat is this tool?
This is an implementation of the well-known Parabolic SAR indicator that can adjust parameters on the fly to achieve a better profitability.
The algorithm was borrowed from Profitable Parabolic SAR and connected to the basic Parabolic SAR implementation. So, now it will switch parameters automatically without any manual work required.
Profitable Parabolic SAR indicator can be found here:
Parabolic SAR indicator can be found here:
Self-Adjusting SuperTrendWhat is this tool?
This is an implementation of the well-known SuperTrend indicator that can adjust parameters on the fly to achieve a better profitability.
The algorithm was borrowed from Profitable SuperTrend and connected to the basic SuperTrend implementation. So, now it will switch parameters automatically without any manual work required.
Alerts
The same alerts as for the basic SuperTrend + special alert to notify user about parameters switching.
Profitable SuperTrend indicator can be found here:
SuperTrend indicator can be found here:
Good luck!

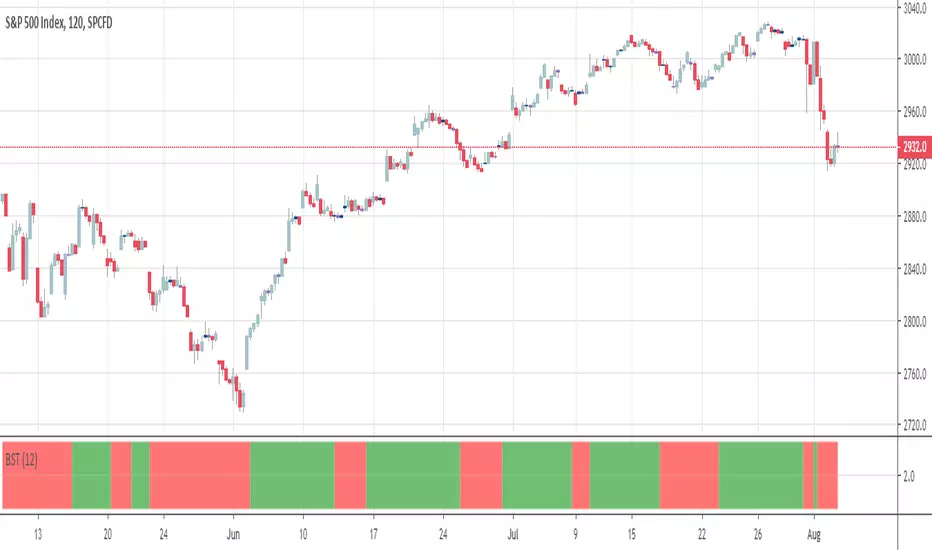
BSTtrend (and a quick note on trading psychology)Hi again :)
Script #2 for tonight, more to come :)
This one is a Pine transcription of a FXCM/LUA script called BSTrend
I used it years ago to trade index on very low timeframes with it. I'm always looking for oscillators that are more reactive than the traditional MACD. And even more reactive than the MACD Zero Lag
This is a proof of concept that Pinescript is my favorite trading programming language vs MT4/LUA/PRT. I just find it easier and the Pinescript community is helping a lot
With the BSTrend you can win but also lose. I see a lot of scripts out there but there is not a better or worst indicator. The key is HOW to use it.
In other words the key is your PSYCHOLOGY, without a rock-solid psychology, you'll end up committing a mistake even with G. himself whispering "BUY NOW", "SELL NOW" to your ears. (wait..... Do you mean this is happening only to me ????)
However, indicators help immensely in reducing the psychology pressure that we have to endure ... sometimes for days..... But better not to overcharge with dozens of indicators per chart and have a tool to detect whenever there is a confluence/convergence of your favorite indicators :) #algorithm #builder
I'll publish an educational post about next week
Those are the exact words that my mentor traders told me 6 years ago when I started trading
PS
____________________________________________________________
Be sure to hit the thumbs up as it shows me that I'm not doing this for nothing and will motivate to deliver more quality content in the future.
- I'm an officially approved PineEditor/LUA/MT4 approved mentor on codementor. You can request a coaching with me if you want and I'll teach you how to build kick-ass indicators and strategies
Jump on a 1 to 1 coaching with me
- You can also hire for a custom dev of your indicator/strategy/bot/chrome extension/python
Profitable SuperTrendHello friends,
This script is a powerful, non-repainting optimizer for the classic SuperTrend indicator — one of the most popular tools for trend-following and volatility-based trading. It automatically finds and applies the most profitable SuperTrend settings for each instrument and timeframe, removing the need for manual parameter tuning or guesswork.
🛠 How It Works
The indicator evaluates over 1,400 combinations of ATR Periods and Multipliers using a decision tree–based optimization algorithm .
Each configuration is backtested across the instrument's full history, and when a more profitable setup is identified, the indicator automatically switches to those values in real time — while preserving the standard SuperTrend logic.
It also supports commission customization for more realistic backtesting and includes an alert system that notifies you whenever a better parameter set is found.
This adaptive approach keeps the SuperTrend continuously tuned to evolving market conditions without repainting or distorting past data.
💡 Integrated Versions Explained
This all-in-one tool merges 3 complementary indicators:
• Profitable SuperTrend — A dedicated optimizer that runs in a separate window below your chart. It doesn’t produce buy/sell signals directly but analyzes your asset and timeframe to find optimal ATR settings. Results are visualized as two lines (purple and orange), with optional labels displaying the best parameter values. You can then manually apply these values to your standard SuperTrend.
• Self-Adjusting SuperTrend — A real-time overlay version that behaves like the standard SuperTrend but dynamically adjusts its parameters on the fly. It requires no manual setup and can be paired with the Profitable SuperTrend for full transparency over which values are currently active.
• Compact Self-Adjusting SuperTrend — A minimalist oscillator version that uses simple binary outputs: -1 for Sell and 1 for Buy. This format is ideal for filtering or integrating the adaptive logic into other trading systems.
Together, they form a complete adaptive suite that combines automation, flexibility, and precision — suitable for both discretionary and systematic traders.
🔥 Key Features
Adaptive optimization powered by a decision tree–based algorithm
Real-time switching to the most profitable SuperTrend parameters
Commission customization for realistic backtesting
Direction filter (Longs | Shorts | Longs & Shorts)
Optional analysis start date for focused historical testing
Smart alert when better settings are detected
Optional buy/sell labels and compact trend output
Clean and organized UI with improved workflow
If you'd like access or have any questions, feel free to reach out to me directly via DM.
👋 Good luck and happy trading!
Script a pagamento


Profitable Parabolic SARHello friends,
This script is a powerful, non-repainting optimizer for the classic Parabolic Stop and Reverse (PSAR) — one of J. Welles Wilder's most respected trend-following systems. It automatically finds and applies the most profitable PSAR settings for each instrument and timeframe, eliminating the need for manual parameter tuning.
🛠 How It Works
The indicator evaluates over 500 combinations of PSAR parameters using a decision tree–based algorithm under the hood .
Each configuration is backtested across the instrument's full price history, and when a more profitable setup is identified, the indicator seamlessly switches to those values in real time — while maintaining the original PSAR logic.
The Maximum parameter remains fixed since its impact on overall profitability is minimal compared to Start and Increment.
This self-adjusting approach removes the guesswork of parameter optimization and keeps the PSAR dynamically tuned to changing market regimes.
💡 Integrated Versions Explained
This all-in-one tool merges 3 complementary indicators:
• Profitable PSAR — A parameter optimizer that runs in a separate window below your main chart. It doesn't generate buy/sell signals directly but analyzes your specific asset and timeframe to find optimal settings. These are displayed as two lines (purple and orange), with optional labels showing the actual parameter values. Once identified, you can apply these optimal values manually to the standard PSAR.
• Self-Adjusting PSAR — A real-time overlay version that looks and behaves like the standard PSAR but automatically adjusts its parameters on the fly. It requires no manual configuration and can be paired with the Profitable PSAR to monitor which settings are currently active.
• Compact Self-Adjusting PSAR — A minimalist oscillator version that reflects the same adaptive logic through simple binary outputs: -1 for Sell and 1 for Buy. This variant is ideal for filtering or signal integration into other systems.
Together, they form a unified adaptive system that gives users both automation and interpretability — the best of both worlds.
🔥 Key Features
Adaptive optimization powered by a decision tree–based algorithm
Real-time switching to more profitable parameter configurations
Direction filter (Longs | Shorts | Longs & Shorts)
Optional analysis start date for focused historical testing
Commission customization for realistic performance modeling
Visual highlighting of parameter changes
Optional buy/sell labels and compact trend signal display
If you'd like access or have any questions, feel free to reach out to me directly via DM.
👋 Good luck and happy trading!
Script a pagamento
Profitable Vortex Indicator ScannerIntroduction
The Vortex Indicator is a technical indicator invented by Etienne Botes and Douglas Siepman (Technical Analysis of Stocks & Commodities, V.28:1 (January, 2010): "The Vortex Indicator") to identify the start of a new trend or the continuation of an existing trend within financial markets.
It is composed of two lines, +VI and -VI . +VI represents up trending momentum and -VI represents down trending momentum.
The most basic strategy is to use the crossovers as trade signals:
when +VI crosses above -VI , go Long
when -VI crosses above +VI , go Short
Exit when a crossover occurs in the opposite direction
What is this tool?
This tool is a performance scanner that uses a decision tree-based algorithm under the hood to find the most profitable period's setting for the indicator. It analyzes the range of periods between 2 to 100 and backtests the Vortex Indicator for each period using the strategy mentioned above across the entire history of an instrument.
Settings
Net Profit line is optional and can be hidden through settings.
Alerts
It has an alert that notifies when a more profitable period was detected.
NOTE : It does not change what has already been plotted.
Good luck!

ICT Macro Slot Algo Event📊 Overview
A powerful multi-timeframe trading indicator that combines Institutional Macro Session Tracking identify optimal trading windows throughout the day. This tool helps traders align with institutional flow patterns and algorithmic activity across major sessions.
🎯 Key Features
1. Macro Algo Event Sessions
Tracks 6 key institutional time windows during NY Session:
NY Sweep (08:50-09:10) - Opening balance flows
Silver Bullet #1 (09:50-10:10) - First major macro move
Silver Bullet #2 (10:50-11:10) - Second chance/retest opportunity
Lunch Macro (11:50-12:10) - Mid-day repositioning
Post-Lunch Rebalance (13:10-13:40) - Post-lunch adjustments
NY Closing Macros (15:15-15:45) - End-of-day flows

ICT Macro Slot Algo Event📊 Overview
A powerful multi-timeframe trading indicator that combines Institutional Macro Session Tracking to identify optimal trading windows throughout the day. This tool helps traders align with institutional flow patterns and algorithmic activity across major sessions.
🎯 Key Features
1. Macro Algo Event Sessions
Tracks 6 key institutional time windows during NY Session:
NY Sweep (08:50-09:10) - Opening balance flows
Silver Bullet #1 (09:50-10:10) - First major macro move
Silver Bullet #2 (10:50-11:10) - Second chance/retest opportunity
Lunch Macro (11:50-12:10) - Mid-day repositioning
Post-Lunch Rebalance (13:10-13:40) - Post-lunch adjustments
NY Closing Macros (15:15-15:45) - End-of-day flows

Smart Cloud by Ilker (Custom Matriks)A Proprietary Hybrid Trend System for All Major Financial Assets
This indicator, originally developed for the Matriks platform, is a highly effective hybrid trend identification system designed for day-to-day analysis across all major asset classes, including Stocks, Forex, Indices, and Cryptocurrencies. It combines the forward-looking principle of the Ichimoku Kinko Hyo Cloud with heavily smoothed Moving Averages (MAs) to create a clear, visually guided trading signal. (Daily Timeframe recommended for optimal results).
📊 Algorithmic Structure and Parameters
The "Smart Cloud" utilizes six primary user-adjustable parameters that govern its sensitivity and shape, moving away from standard Ichimoku settings to provide a robust, customized trend view:
P1, P2, P3 (60, 56, 248): These long-term settings define the core structure and width of the cloud, acting as the primary dynamic support and resistance zone. The significantly longer P3 (Lagging Period) ensures the cloud reflects strong, deep market cycles.
P4 (Displacement 26): Maintains the traditional Ichimoku principle of projecting the cloud 26 periods forward to provide a predictive view of future trend support/resistance.
P5 (MA50 - Blue) & P6 (MA10 - Purple): These are the two primary Moving Averages plotted inside the cloud. They serve as fast-response momentum lines:
P5 (MA50): Represents the middle-term trend average.
P6 (MA10): Represents the short-term market momentum.
📈 Core Trend and Signal Interpretation
The indicator provides powerful trend identification based on three key components:
The Cloud (Kumo):
Green Cloud (Bullish): Indicates the dominant trend is up, suggesting dynamic support for price action.
Red Cloud (Bearish): Indicates the dominant trend is down, suggesting dynamic resistance.
The thickness and slope of the cloud are key indicators of trend strength.
MA Crossover Signal (Blue/Purple):
Buy Signal: When the faster Purple MA (P6=10) crosses above the slower Blue MA (P5=50).
Sell Signal: When the faster Purple MA (P6=10) crosses below the slower Blue MA (P5=50).
Price Action & Confirmation:
The most powerful signals occur when a MA Crossover is confirmed by price breaking out of the cloud in the same direction.
Price above the cloud and MA crossover to the upside suggests a strong buy entry.
Disclaimer: This tool is intended for analysis and decision-making support. It is not financial advice. Always use stop-loss orders and manage your risk accordingly.

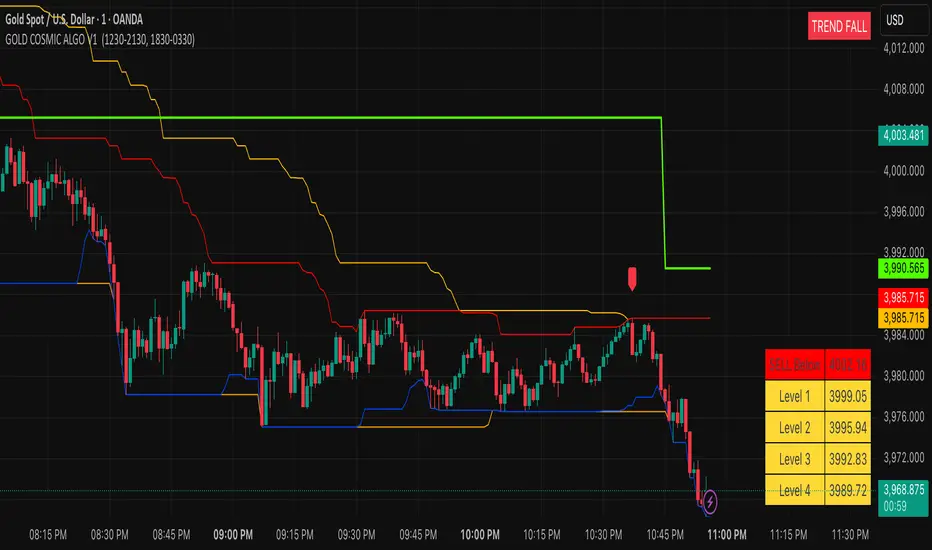
GOLD COSMIC ALGO V1### Cosmic Gold Trading Algorithm
- **Overview**: Cosmic Gold is an advanced, invite-only Pine Script indicator optimized for trading Gold (XAUUSD), blending trend analysis, market structure detection, and predictive modeling to generate reliable buy/sell signals across scalping, intraday, and swing strategies.
- **Key Features**: It identifies market breaks using swing pulses, displays quantum trend states, plots reversal signals near support/resistance, and uses kernel regression for forecasted price moves with dynamic TP/SL levels—helping traders navigate gold's volatility with precision.
- **Performance Considerations**: While backtests show potential for high accuracy in trending markets, results vary by timeframe and conditions; always combine with risk management, as past performance doesn't guarantee future gains.
#### Getting Started
Add the indicator to your TradingView chart for XAUUSD. It overlays directly, showing signals like "BUY"/"SELL" labels, trend channels, session backgrounds, and a targets table. Default settings suit most users, but adjust visuals (e.g., colors) via inputs for personalization.
#### Recommended Usage
- **Timeframes**: Best on 1m to 4h charts for scalping to swings; higher frames reduce noise.
- **Signals**: Enter on MSB breaks or EMA crossovers (▲/▼ shapes), confirmed by quantum state ("TREND RISE/FALL").
- **Risk Management**: Use ATR-based targets (1-4 levels) and predicted RR for TP/SL; limit risk to 1-2% per trade.
- **Alerts**: Set up for bullish/bearish signals, TP/SL hits to automate notifications.
#### Tips for Success
Monitor session overlaps (London/NY highlighted) for high-volume entries. Test on demo accounts first, and watch for reversals near daily levels or Donchian channels. For optimal results, pair with fundamental gold news.
---
Cosmic Gold represents a sophisticated fusion of classical technical indicators and modern predictive analytics, tailored specifically for the dynamic XAUUSD market. This invite-only algorithm integrates multi-layered market structure analysis, quantum-inspired trend detection, reversal pattern recognition, and a kernel-based regression model to forecast price movements, all while visualizing key sessions and levels for enhanced decision-making. Designed for versatility, it supports scalping on minute charts, intraday trades on hourly frames, and swing positions up to 4 hours, adapting to gold's inherent volatility driven by economic factors, geopolitical events, and safe-haven demand.
At the heart of Cosmic Gold lies a dual swing detection system. The primary detectSwings function scans a 30-bar window to identify highs and lows, creating pulse objects that track price breaches. When close crosses these levels, it triggers structure checks classifying moves as "msb" (market structure break) or "bos" (break of structure), plotting "BUY" or "SELL" labels only on MSB events for high-confidence entries. Paralleling this is the quantumSwings mechanism, which similarly detects extrema but categorizes as "break" or "continuation," updating a real-time trend state displayed in a top-right table: "TREND RISE" (bullish, teal), "TREND FALL" (bearish, red), or "NEUTRAL ZONE" (gray). This quantum layer adds a probabilistic overlay, helping filter false breaks in choppy conditions.
Supporting these signals are robust support/resistance visualizations. Donchian Channels (55-period) plot orange upper/lower trend lines, while 24-period borders create red high and blue low barriers. On intraday charts, previous daily highs/lows (green/red lines) provide context, with all levels used for proximity checks in reversal logic. Outside bar reversals (engulfing patterns) near these zones—within one ATR (average true range, 14-period)—trigger small lime/red labels for "Reversal Up/Down," offering counter-trend opportunities. Quantum flags further scan for exhaustion: bull/bear patterns over 30 bars verify local extrema, though not plotted directly, they inform the overall state.
The predictive engine elevates Cosmic Gold beyond traditional indicators. Eight normalized features—ranging from RSI-scaled dump/pump metrics and volatility derivatives to volume oscillators, choppiness index, standard RSI, and EMA-derived trend signals—feed a radial basis function (RBF) kernel regression model. On EMA (50/200) crossovers, it records historical absolute moves and trains on past instances, weighting by feature distance to estimate predictedMove (fractional advance/decline). Win rate calculations derive recommended risk-reward (RR), dynamically setting TP/SL: for bulls, TP at close + (close * predictedMove), SL at close - (close * predictedMove / RR). Signals (▲/▼) fire only above 5-minute frames if predictions are valid, with in-trade tracking alerting on hits. This ML-inspired approach aims to quantify edge, though it requires sufficient history (ideally 100+ trades) and may underperform in unprecedented regimes.
Visual and utility elements enhance usability. A bottom-right table populates on signals with ATR (18-period) scaled targets (1-4 levels, yellow cells) above/below entry, colored green/red for direction. Session backgrounds highlight London (muted blue, 12:30-21:30 IST) and New York (muted green, 18:30-03:30 IST), with dashed vertical lines at starts and solid IST lines at 5 AM (blue) / 5 PM (orange) for timezone awareness. Alerts cover signals, TP/SL, ensuring hands-off monitoring.
In practice, Cosmic Gold's strength lies in its adaptability: in bull markets, quantum "RISE" aligns with EMA upsides for longs; in volatility spikes (e.g., Fed announcements), reversals near channels provide quick scalps. However, limitations include potential repainting on early bars (due to highest/lowest recalculations) and NA predictions on low-volume symbols—mitigated by the volume error check. Backtesting emphasizes realistic settings: modest account sizes, commissions/slippage, and <5% risk per trade align with RR logic. While optimized for gold, testing on correlated assets like silver may yield insights, but always verify with live data.
| Component | Description | Key Parameters | Utility in Trading |
|-----------|-------------|----------------|--------------------|
| Swing Detection | Identifies highs/lows over fixed length for structure breaks. | External Length: 30 bars | Filters entries to confirmed breaks, reducing false signals. |
| Quantum Trend | Parallel swing system updating bullish/bearish/neutral states. | Quantum Period: 30 bars | Provides trend bias; "RISE/FALL" confirms signal direction. |
| Reversal Signals | Engulfing patterns near S/R within ATR. | ATR Length: 14 | Spots counter-trends; ideal for scalps near daily levels. |
| Kernel Regression | RBF model predicts moves from 8 features. | Bandwidth: 5; Features: RSI, volatility, etc. | Forecasts TP/SL; enhances RR for sustainable trading. |
| Visual Aids | Channels, sessions, targets table. | Donchian: 55; Borders: 24 | Contextualizes price; sessions flag high-volume periods. |
| Alerts & Risk | Dynamic TP/SL, win rate tracking. | Safe Duration: 2000 bars max | Automates exits; promotes disciplined risk management. |
This comprehensive design positions Cosmic Gold as a professional tool for gold traders, emphasizing rule-based precision over discretionary guesswork. For access, contact the author via TradingView; note it's invite-only to maintain quality control.
**Key Citations:**
- (tropicalglitz.net)
- (www.cnn.com)
- (www.forbes.com)
- (auronum.co.uk)
- (www.prismaticpowders.com)
- (cosmicgoldmusic.com)
Follow-up Buy / Sell Volume Pressure at Supply / Demand Zones█ Overview:
BE-Volume Footprint & Pressure Candles, is an indicator which is preliminarily designed to analyze the supply and demand patterns based on Rally Base Rally (RBR), Drop Base Drop (DBD), Drop Base Rally (DBR) & Rally Base Drop (RBD) concepts in conjunction to volume pressure. Understanding these concepts are crucial. Let's break down why the "Base" is you Best friend in this context.
Commonness in RBR, DBD, DBR, RBD patterns ?
There is an impulse price movement at first, be it rally (price moving up) or the Drop (price moving down), followed by a period of consolidation which is referred as "BASE" and later with another impulse move of price (Rally or Drop).
Why is the Base Important
1. Market Balance: Base represents a balance between buyers and sellers. This is where decisions are made.
2. Confirmation: It confirms the strength of previous impulse move which has happened.
Base & the Liquidity Play:
Supply & Demand Zone predict the presence of all large orders within the limits of the Base Zone. Price is expected to return to the zone to fill the unfilled orders placed by large players.
For the price to move in the intended direction Liquidity plays the major role. hence indicator aims to help traders in identifying those zones where liquidity exists and the volume pressure helps in confirming that liquidity is making its play.
Bottom pane in the below snapshots is a visual representation of Buyers volume pressure (Green Line & the Green filled area) making the price move upwards vs Sellers volume pressure (Red Line & the Red filled area) making the price move downwards.
Top pane in the below snapshots is a visual representation on the pattern identification (Blue marked zone & the Blue line referred as Liquidity level)
Bullish Pressure On Buy Liquidity:
Bearish Pressure On Sell Liquidity:
█ How It Works:
1. Indicator computes technical & mathematical operations such as ATR, delta of Highs & Lows of the candle and Candle ranges to identify the patterns and marks the liquidity lines accordingly.
2. Indicator then waits for price to return to the liquidity levels and checks if Directional volume pressure to flow-in while the prices hover near the Liquidity zones.
3. Once the Volume pressure is evident, loop in to the ride.
█ When It wont Work:
When there no sufficient Liquidity or sustained Opposite volume pressure, trades are expected to fail.
█ Limitations:
Works only on the scripts which has volume info. Relays on LTF candles to determine intra-bar volumes. Hence, Use on TF greater than 1 min and lesser than 15 min.
█ Indicator Features:
1. StrictEntries: employs' tighter rules (rather most significant setups) on the directional volume pressure applied for the price to move. If unchecked, liberal rules applied on the directional volume pressure leading to more setups being identified.
2. Setup Confirmation period: Indicates Waiting period to analyze the directional volume pressure. Early (lesser wait period) is Risky and Late (longer wait period) is too late for the
ride. Find the quant based on the accuracy of the setup provided in the bottom right table.
3. Algo Enabled with Place Holders:
Indicator is equipped with algo alerts, supported with necessary placeholders to trade any instrument like stock, options etc.
Accepted PlaceHolders (Case Sensitive!!)
1. {{ticker}}-->InstrumentName
2. {{datetime}}-->Date & Time Of Order Placement
3. {{close}}-->LTP Price of Script
4. {{TD}}-->Current Level:
Note: Negative Numbers for Short Setup
5. {{EN}} {{SL}} {{TGT}} {{T1}} {{T2}} --> Trade Levels
6. {{Qty}} {{Qty*x}} --> Qty -> Trade Qty mapped in Settings. Replace x with actual number of your choice for the multiplier
7. {{BS}}-->Based on the Direction of Trade Output shall be with B or S (B == Long Trade & S == Short Trade)
8. {{BUYSELL}}-->Based on the Direction of Trade Output shall be with BUY or SELL (BUY == Long Trade & SELL == Short Trade)
9. {{IBUYSELL}}-->Based on the Direction of Trade Output shall be with BUY or SELL (BUY == SHORT Trade & SELL == LONG Trade)
Dynamic Alerts:
10. { {100R0} }-->Dynamic Place Holder 100 Refers to Strike Difference and Zero refers to ATM
11. { {100R-1} }-->Dynamic Place Holder 100 Refers to Strike Difference and -1 refers to
ATM - 100 strike
12. { {50R2} }-->Dynamic Place Holder 50 Refers to Strike Difference and 2 refers to
ATM + (2 * 50 = 100) strike
13. { {"ddMMyy", 0} }-->Dynamically Picks today date in the specified format.
14. { {"ddMMyy", n} }-->replace n with actual number of your choice to Pick date post today date in the specified format.
15. { {"ddMMyy", "MON"} }-->dynamically pick Monday date (coming Monday, if today is not Monday)
Note. for the 2nd Param-->you can choose to specify either Number OR any letter from =>
16. {{CEPE}} {{ICEPE}} {{CP}} {{ICP}} -> Dynamic Option Side CE or C refers to Calls and PE or P refers to Puts. If "I" is used in PlaceHolder text, On long entries PUTs shall be used
Indicator is equipped with customizable Trade & Risk management settings like multiple Take profit levels, Trailing SL.

Apex Edge – Liquidity RaiderApex Edge – Liquidity Raider
The Predator That Hunts Where Retail Never Looks
The Liquidity Raider is not your average liquidity line plotter.
This is an institutional-grade hunting system that tracks the pools of liquidity Smart Money algos stalk — and tells you exactly when price is circling in for the strike.
Where most retail tools simply mark lines, this one acts like a predator:
Scans the chart dynamically to detect clustered highs & lows (pivot-based liquidity zones).
Filters noise with sensitivity & price rounding so you only get real liquidity levels — not every random swing.
Plots live BSL (Buy-Side Liquidity) & SSL (Sell-Side Liquidity) lines in clean dotted format.
Auto-deletes levels when swept, so your chart stays clean and focused.
Triggers directional arrows when price comes within your specified % distance to the target liquidity pool — before the market moves.
EMA confluence layer lets you align with institutional flow (customizable Fast & Slow EMAs).
Core Power
Cluster Logic – Finds high-probability liquidity zones using repeated pivot levels.
Sweep Awareness – Lines vanish the moment liquidity is taken, keeping focus on the next pool.
Proximity Strike Detection – Arrow signals only when price is within striking range.
Directional Clarity – Red arrows = targeting BSL, Green arrows = targeting SSL.
Scalable Across Timeframes – Adapts to your chart’s timeframe with dynamic lookback scaling.
Institutional Flow Filter – Optional EMA confirmation keeps you aligned with the real trend.
How to Use
Identify liquidity pools – Dotted green = buy-side, dotted red = sell-side.
Watch proximity arrows – These mean price is in range and hunting that pool.
Align with EMA bias – Enter only in the direction of institutional momentum.
Target the sweep – Your take profit is where the liquidity is resting.
Why Liquidity Raider Wins
This is not a lagging signal system.
It’s a real-time, clean, predictive tool designed to mimic the targeting logic of high-frequency algos.
By removing swept levels and focusing only on the next available pools, Liquidity Raider keeps you one step ahead of the crowd — and perfectly positioned for the kill shot.

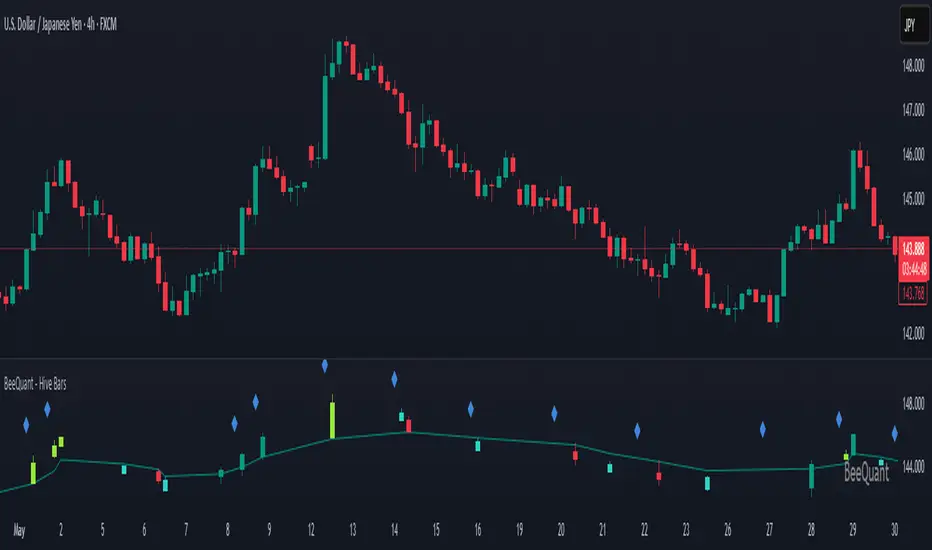
BeeQuant - Hive Bars🔶 OVERVIEW
The "Hive Bars" indicator is a truly revolutionary analytical instrument, meticulously engineered to transcend the limitations of conventional price charting and unveil the profound, underlying essence of market dynamics. Imagine possessing a sophisticated visual engine that intelligently reconstructs raw price data into unique, dynamically consolidated "Hive Bars." These specialized constructs intuitively reveal the dominant market momentum and highlight high-conviction signals often obscured by the ubiquitous noise of traditional candlesticks. This indicator acts as a precision filter, illuminating exactly when pivotal shifts are occurring by coloring these reconstructed units with an adaptive, unparalleled accuracy. It is expertly crafted for the discerning trader seeking an undeniable analytical advantage, offering a fresh, meticulously refined perspective that enables the discernment of concealed patterns, fostering more decisive and confident trading actions. Crucially, "Hive Bars" now feature proactive, real-time alert capabilities, ensuring no critical market inflection point ever goes unnoticed.
__________________________________________________________________________
🧠 CONCEPTS
At its intellectual core, the "Hive Bars" indicator operates upon an advanced, proprietary framework that fundamentally reinterprets market data. It presents this refined information through its unique "Hive Bars"—specialized visual constructs that dynamically encapsulate the consolidated spirit and true directional bias of price action, delivering unparalleled clarity.
⬜ Smart Bar Reconstruction: Hive Bars don’t follow time, they follow the market. They are derived through a sophisticated, multi-faceted internal process that precisely captures the dominant price influence and momentum over variable periods. This structure adapts dynamically to changing conditions, letting you see the real pressure behind price moves with consistency that time-based candles can’t match. This proprietary reconstruction creates a new, inherently consistent, and highly focused visual narrative of underlying market flow, effectively stripping away extraneous "noise" and revealing the market's authentic directional intent.
⬜ Multi-Layered Internal Analysis: A dynamic and live, adaptive line powers the core of Hive Bars. It recalibrates constantly, tracking market structure in real time. Every bar is formed in relation to this internal baseline, giving immediate context to price behavior. You choose the data that drives this line—open, close, high, low, or custom blends—to match your style.
⬜ Intelligent Bar Formation Sequences: Bars are created when the market speaks, not when the clock ticks. A built-in pattern engine reads the flow and waits for real structure to form. This allows the indicator to autonomously consolidate price action, presenting a cleaner, more coherent visualization of trend development as it truly unfolds, rather than fragmented snapshots based on time.
⬜ Visual Signal Precision: "Hive Bars" spring to life with an intuitively powerful coloring system. While primary colors (Green for upward bias, Red for downward bias) denote the prevailing market direction, the "Hive Bars" indicator introduces distinctively colored "Signal Hive Bars". These specialized bars emerge when the market price exhibits a particularly robust, high-conviction interaction with the adaptive internal baseline, standing out instantly and often mark key turning points or breakouts you want to act on.
⬜ Daily Reset Option: For intraday traders, there’s a reset feature that clears the internal build-up at the start of each new trading day. This ensures fresh, unbiased perspectives that are meticulously tailored to the distinct market dynamics and cyclic rhythms of the current trading day.
⬜ Adjustable Sensitivity: With Hive Smoothing, you’re in full control. This setting lets you fine-tune how sensitive the bars are to price movement. Want tighter, faster signals? Dial it down. Prefer broader, more filtered setups? Turn it up. You decide when a new Hive Bar forms—and when a Signal Bar confirms. It’s all based on how you trade and how your asset moves. No guesswork, no one-size-fits-all defaults. Hive Bars adapts to your strategy and trading style, not the other way around.
__________________________________________________________________________
✨ FEATURES
The "Hive Bars" indicator is equipped with a comprehensive suite of cutting-edge features, designed for unparalleled clarity, adaptive responsiveness, augmented analytical depth, seamless interoperability with your broader analytical toolkit, and proactive real-time notifications:
🔹Proprietary Hive Bar Reconstruction
Experience a uniquely advanced visual representation of price action that dynamically consolidates market data, leading to enhanced trend and momentum clarity that goes beyond standard charting and candlestick data.
🔹Customizable Internal Analysis Line
Gain precise control over the underlying adaptive baseline's calculation by selecting various internal price source options, ensuring its alignment with your specific analytical focus.
🔹 Smart Alerts for Key Events 🔔
Get notified in real time when:
◦ A new Hive Bar completes – signaling a fresh structural range reset
◦ A new Signal Hive Bar closes – identifying a potential overbought or oversold condition
Built-in alert conditions make it easy to stay ahead of shifts without watching every candle manually.
🔹Intelligent Bar Formation Sequencing
Diamond-shaped markers clearly indicate the start of the indicator's internal combination logic for enhanced visual understanding.
🔹High-Conviction "Signal Hive Bars" (Distinct Colors)
Receive specialized, uniquely colored visual alerts when Hive Bars exhibit strong, decisive movements relative to the adaptive baseline, indicating moments of heightened market conviction and potential opportunity.
🔹Session-Based Reconstruction
Opt for the "Daily New Start" to intelligently reset the indicator's perspective with each new trading day, providing fresh, session-aligned insights tailored for intraday precision.
🔹Unrivaled External Indicator Collaboration
A truly unique and powerful advantage of "Hive Bars" is its capability to seamlessly integrate and profoundly enhance the performance of other external indicators. By outputting clean, smoothed price data, it lets you feed a higher-quality source into tools like RSI, MACD, moving averages etc. Use close for indicators like RSI, and close for moving averages. The result is better clarity, fewer false signals, and a stronger edge across your setup. Hive Bars isn’t just an indicator, it’s an upgrade for everything you use.
🔹Non-Repainting Historical Integrity
Hive Bars never repaints. Each bar is locked in only after all internal conditions are fully met. This means you can trust every historical signal—it won’t shift or vanish after the fact. What you see in hindsight is exactly what was shown in real time.
🔹Universal Timeframe Compatibility
Whether you're scalping on the 1-minute chart or analyzing multi-month trends, Hive Bars delivers consistent, clean insights. Its architecture adapts to any timeframe without losing fidelity, making it a reliable tool for any strategy or style.
🔹Cross-Market Versatility
Hive Bars is engineered to perform with precision across all major markets—whether you're trading forex, commodities, stocks, or indices. Its adaptive logic automatically aligns with the unique volatility and structure of each asset class, delivering consistently reliable insights no matter where you trade.
__________________________________________________________________________
⚙️ USAGE
Integrating the "Hive Bars" indicator into your daily analytical regimen is an intuitive process that will profoundly enhance your ability to discern crucial market dynamics and spot high-conviction opportunities with unprecedented clarity:
💁 Effortless Application
Simply add the "Hive Bars" indicator to any chart within your TradingView platform. Note that it plots on a separate panel below your main price chart to provide its unique visual output without obscuring the primary price action.
📊 Strategic Calibration
Access the indicator's comprehensive settings panel to meticulously calibrate its powerful engines and unlock its full potential:
⚙ "Internal EMA Config"
Configure the internal adaptive baseline by choosing its source (e.g., CLOSE, HL/2) and its specific EMA length. This shapes the core reference point for the dynamic formation of the "Hive Bars."
🤖 "CONFIG Group"
Here, you decide if you want "Daily New Start" for session-based analytical resets (particularly beneficial for intraday strategies). The "Hive Smoothing" input allows you to control a further layer of consolidation for the "Hive Bars."
🟩🟥 "Color": Customize the appearance of both standard "Hive Bars" and "Signal Hive Bars" to suit your visual preferences, enhancing their immediate interpretability.
🧭 Empirical Exploration
Experimentation with these parameters is paramount. Dedicate time to exploring different combinations across various assets and timeframes to discover the optimal configuration that resonates with your unique trading methodology and the inherent volatility of the market being analyzed.
👀 Interpreting the Unveiled Market Reality: Once calibrated, the "Hive Bars" will present a strikingly clear and actionable picture of market dynamics:
+ Green/Red Hive Bars: These visually denote the consolidated directional bias of the market over the reconstructed period. A sustained sequence of Green "Hive Bars" suggests pervasive bullish pressure and an upward path of least resistance, while a series of Red "Hive Bars" indicates dominant bearish control and a clear downward momentum.
+ "Signal Hive Bars" (Distinct Colors): Pay close attention to these specially colored "Hive Bars." They signify critical moments where the reconstructed price action exhibits a particularly strong, high-conviction interaction with its adaptive internal baseline. These often precede or confirm significant market movements and serve as your clearest, most reliable visual triggers for potential shifts in market control.
⛓️ Intermittent Appearance: Observe that "Hive Bars" do not necessarily appear for every single native time unit of your chart. They are intelligently reconstructed and consolidated representations of price action, appearing only when specific internal conditions are met to present a coherent, high-impact view of distinct market phases.
🔗 Harnessing Advanced External Synergy: To unlock a new dimension of analytical power, profoundly enhance your existing indicator suite by integrating the output of "Hive Bars" as the data source for other external indicators. When adding or configuring indicators such as RSI, Stochastic Oscillators, various Moving Averages (EMA, SMA), or any other indicator that prompts for a 'source' input, you can now select the purified output of the "Hive Bars" as your desired data stream.
For oscillators (e.g., RSI, MACD), select the close or a similar relevant output from "Hive Bars" as your source. This allows the oscillator to react to the purified, consolidated momentum of the "Hive Bars" rather than the potentially noisy raw price data, leading to smoother and more meaningful oscillator signals.
For moving averages (e.g., EMA, SMA), utilize the close or other pertinent "Hive Bar" output as your source. This provides an exceptionally smooth, highly responsive, and less choppy average that precisely tracks the true underlying trend as identified by "Hive Bars." This unique capability allows for the construction of powerfully layered and synergistic trading strategies.
📢 Setting Up Proactive Alerts for Critical Events: Leverage the newly incorporated alert capabilities to maintain real-time awareness of pivotal market developments, even when not actively monitoring your charts.
You can now choose to be alerted specifically when a "New Hive Bar Closed" (signifying the definitive completion of a major market phase as identified by the indicator) or when a "New Signal Hive Bar Closed" (highlighting a high-conviction market event that warrants immediate attention due to its pronounced significance).
__________________________________________________________________________
⚠️ LIMITATIONS
While the "Hive Bars" indicator is an incredibly powerful and advanced tool for dissecting market dynamics, it is vital to understand its inherent design parameters and the prevailing platform-specific constraints for optimal and informed utilization:
👉 Visual Gaps in Plotting: Due to current platform limitations pertaining to custom candle plotting functionality, you may occasionally observe visual gaps or intermittent non-contiguous plotting between "Hive Bars" on the chart. They’re not missing data, but a result of strict plotting rules. A bar is only drawn when all internal conditions are met. This ensures accuracy, even if the chart shows some spacing.
👉 Complementary Tool: This indicator excels at providing high-conviction directional insights and identifying significant market phases. However, it is fundamentally designed as a sophisticated complementary tool to a broader trading strategy, not as a standalone, all-encompassing system. Its true power is unlocked when integrated with other analytical methods.
👉 Input Calibration Essential: The efficacy and depth of insights derived from the "Hive Bars" are highly dependent on the careful and thoughtful calibration of its input parameters, including the "Internal EMA Config," "Hive Smoothing" setting. Optimal results necessitate empirical user experimentation and fine-tuning to discover the configurations best suited for specific assets, analytical objectives, and market conditions.
👉 Exclusion of Auxiliary Data: The "Hive Bars" indicator's primary focus is exclusively on transforming and presenting price data. It does not natively incorporate other vital market information such as fundamental economic data, or news events. Integrating these additional analytical layers remains an essential aspect of constructing a truly comprehensive and robust trading strategy.
█ ▒▒▒▒▒▒▒▒▒▒▒▒▒▒▒▒▒▒▒▒▒▒▒ 『•••• ✎ ••••』 ▒▒▒▒▒▒▒▒▒▒▒▒▒▒▒▒▒▒▒▒▒▒▒▒ █
🎯 CONCLUSION
The "Hive Bars" indicator offers an unparalleled, intuitively accessible, and highly adaptable framework for instantly grasping true price momentum and direction through its intelligent, non-repainting reconstruction of market data. By transforming chaotic raw data into strikingly clear, high-conviction "Hive Bars" and dynamic signals, and now with proactive alerts to highlight critical moments, it empowers you to cut through distractions and identify market currents with unprecedented ease. Think of it as a custom lens for the market. It filters out the clutter and shows you the real structure—bars formed not by time, but by intent. It's about seeing the unseen, with enhanced clarity and a deeper understanding of market forces, now with the power to supercharge all your other tools and keep you informed. No fluff. No hype. Just an edge you can actually see—and use.
▣▣▣▣▣▣▣▣▣▣▣▣▣▣▣▣▣▣▣▣▣▣▣▣▣▣▣▣▣▣▣▣▣▣▣▣▣▣▣▣▣▣▣▣▣▣▣▣▣▣▣
🚨 RISK DISCLAIMER
Engagement in financial market speculation inherently carries a substantial degree of inherent risk, and the potential for capital diminution, potentially exceeding initial deposits, is a pervasive and non-trivial consideration. All content, algorithmic tools, scripts, articles, and educational materials disseminated by "Hive Bars" are exclusively purposed for informational and pedagogical objectives, strictly for reference. Historical performance data, whether explicitly demonstrated or implicitly suggested, offers no infallible assurance or guarantee of future outcomes. Users bear sole and ultimate accountability for their individual trading decisions and are emphatically urged to meticulously assess their financial disposition, risk tolerance parameters, and conduct independent due diligence prior to engaging in any speculative activity.
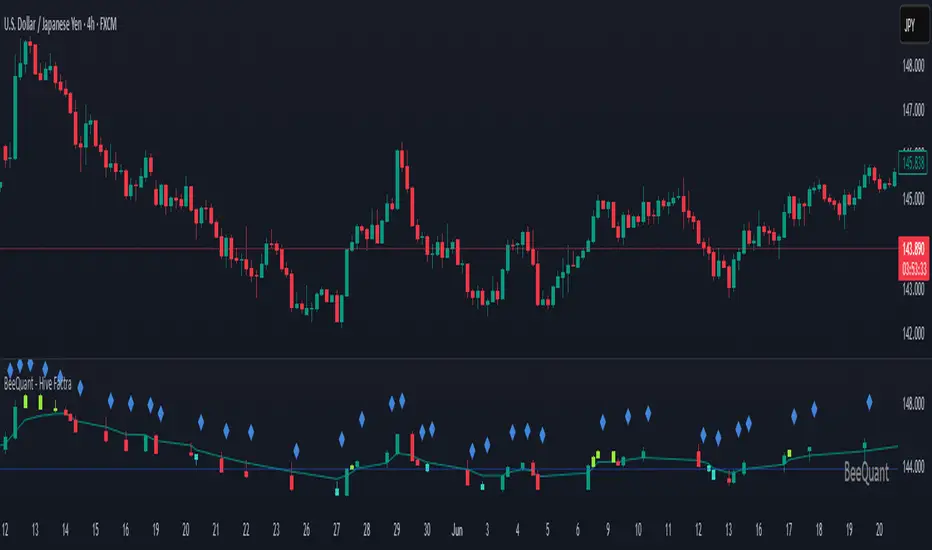
BeeQuant - Hive Factra🔶 OVERVIEW
The "Hive Factra" is a groundbreaking analytical instrument designed to unveil the true essence of market movement, transforming complex price action into powerfully consolidated insights. Imagine having a specialized lens that intelligently reconstructs market periods into unique "Hive Factra Bars," revealing underlying momentum and high-conviction signals often obscured in traditional charts. This indicator cuts through the noise, showing you precisely when significant shifts are occurring by coloring these reconstructed bars with an adaptive precision. It's built for traders who seek unfiltered perspective that helps see hidden patterns and make more decisive moves.
__________________________________________________________________________
🧠 CONCEPTS
Markets move in impulses and compressions. Most trend indicators rely on single-frame slope logic, which often flips during minor pullbacks. Hive Factra takes a different route. At its core, the "Hive Factra" operates on a sophisticated framework that reinterprets market data, presenting it through its proprietary "Hive Factra Bars", unique visualizations that capture the consolidated spirit of price action.
⬜ The "Hive Factra" Reconstruction: Unlike standard candles, "Hive Factra Bars" are intelligently re-engineered representations of market activity. They are derived through a proprietary process that captures the dominant price influence over specific periods, presenting a clearer, more focused view of underlying momentum. These unique bars visually consolidate information, making the core directional bias immediately apparent.
⬜ The Adaptive Baseline: An internal, dynamic analysis line constantly adjusts to market flow, serving as a crucial reference point for the "Hive Factra Bars." This adaptive baseline provides real-time context, helping the indicator precisely determine the significance of each reconstructed bar's movement.
⬜ High-Conviction Coloring & Signal Bars: The "Factra Bars" come to life with a discerning coloring system. While they reflect the primary market direction (Green for upward bias, Red for downward bias), the "Hive Factra" introduces specialized "Signal Hive Bars" with distinct colors. These unique bars appear when the consolidated price action exhibits a particularly strong, high-conviction interaction with the adaptive baseline, acting as powerful visual alerts for moments of heightened significance.
⬜ Session-Aligned Insights: For intraday traders, the "Daily New Start" option provides a unique advantage. When enabled, the indicator can reset its internal reconstruction process with each new trading session, offering fresh, unbiased perspectives tailored to the day's distinct market dynamics.
⬜ Dynamic Sensitivity: A configurable "Offset" allows you to fine-tune the indicator's responsiveness and the thresholds for initiating these "Hive Factra Bars" and "Signal Hive Bars." This ensures the indicator aligns perfectly with your individual trading style and the volatility of the asset you're analyzing.
__________________________________________________________________________
✨ FEATURES
The "Hive Factra" is equipped with a suite of cutting-edge features, all meticulously designed for unparalleled clarity, adaptive responsiveness, and augmented analytical depth:
🔹 Proprietary Hive Factra Bars
Experience a unique visual representation of price action that consolidates market data for enhanced trend and momentum clarity.
🔹 Customizable Internal Analysis Line
Control the underlying adaptive baseline's calculation for precise alignment with market flow, utilizing various price source options.
🔹 High-Conviction "Signal Hive Bars" (Distinct Colors)
Receive specialized visual alerts when Factra Bars exhibit strong, decisive movements relative to the adaptive baseline, indicating moments of heightened market conviction.
🔹 Overbought/Oversold Visuals
Signal Hive Bars highlight areas of potential exhaustion, providing intuitive insight into stretched conditions
🔹 Session-Based Reconstruction
Opt for the "Daily New Start" to reset the indicator's perspective with each new trading day, providing fresh, session-aligned insights.
🔹 Dynamic Offset Control
Adjust the "Offset" parameter to fine-tune the sensitivity of the Factra Bar reconstruction and signal generation thresholds, tailoring the indicator to specific market conditions.
🔹 Non-Repainting Logic for Historical Reliability
Each "Hive Factra Bar" is plotted only when its internal reconstruction conditions are fully met and confirmed. This ensures that the historical display of Factra Bars does not repaint, providing a high degree of reliability and trust in past signals and visualizations.
🔹 Cross-Market Versatility
This indicator is engineered to perform with precision across all major markets—whether you're trading forex, commodities, stocks, or indices. Its adaptive logic automatically aligns with the unique volatility and structure of each asset class, delivering consistently reliable insights no matter where you trade.
🔹 Custom Range Start Marker
A subtle diamond-shaped symbol is plotted to indicate the start of the Hive Factra logic cycle. This marks the bar from which the internal price range begins accumulating until a new Hive Factra Bar is confirmed and displayed. Helps visualize the dynamic evaluation period used in Factra’s structural detection.
🔹 Smart Alerts for Key Events
Get notified in real time when:
◦ A new Hive Factra Bar completes – signaling a fresh structural range reset
◦ A new Signal Hive Bar closes – identifying a potential overbought or oversold condition
Built-in alert conditions make it easy to stay ahead of shifts without watching every candle manually.
🔹 Universal Timeframe Compatibility: The "Hive Factra" is meticulously engineered to perform flawlessly across all timeframes, from rapid intraday charts to long-term weekly and monthly views. This universal compatibility ensures you receive consistent, high-quality insights regardless of your analytical horizon.
🔹 Unrivaled External Indicator Collaboration: A truly unique advantage of the "Hive Factra" is its capability to seamlessly integrate and enhance the performance of other external indicators. Its meticulously processed output, can serve as a highly purified and consolidated 'source' for indicators that accept such inputs (e.g., RSI, StochRSI, moving averages), which allows for more insightful data stream into your favorite indicators, potentially unlocking new levels of responsiveness and signal accuracy for your entire analytical setup.
__________________________________________________________________________
⚙️ USAGE
Integrating the "Hive Factra" into your daily analytical regimen is intuitive and will profoundly enhance your ability to discern crucial market dynamics and spot high-conviction opportunities:
💁 Effortless Application
Simply add the "Hive Factra" indicator to any chart within your TradingView platform. Note that it plots on a separate panel below your main price chart to provide its unique visual output without obscuring price.
📊 Tailored Calibration: Access the indicator's settings to unlock its full potential:
⚙ "Internal EMA Config"
Configure the internal adaptive baseline by choosing its source (e.g., Close, HL/2) and length. This shapes the core reference point for the Factra Bars.
⚙ "Hive Factra"
Decide if you want "Daily New Start" for session-based analysis and choose the "Source" type for how the Factra Bars are built.
🤖 "Offset"
Experiment with the "Offset" percentage to adjust the sensitivity of the Factra Bar's reconstruction. A smaller offset will make the Factra Bars appear more frequently, while a larger one will highlight only more significant movements.
🟩🟥 Green/Red Hive Factra Bars
These indicate the consolidated directional bias of the market over the reconstructed period. A sequence of Green bars suggests sustained bullish pressure, while Red bars point to dominant bearish control.
🚀 "Signal Hive Bars" (Unique Colors)
Pay close attention to these specially colored Hive Factra Bars. They signify moments where the reconstructed price action exhibits a high-conviction interaction with its adaptive baseline, often preceding or confirming significant market moves. These are your clearest signals for potential shifts.
✨ Appearance of Hive Factra Bars
Notice that these Bars do not necessarily appear for every single time unit. They intelligently reconstruct and consolidate price action, appearing only when conditions align to present a coherent, high-impact view of market phases.
🪢 Harnessing External Synergy
To unlock a new dimension of analysis, consider integrating "Hive Factra" as the data source for other indicators:
1. When adding indicators like RSI, StochRSI, or others that prompt for a 'source' input, you can select the "Hive Factra" as the input.
2. For oscillators (e.g., RSI, Stochastic), choose the close or similar output from "Hive Factra" as your source. This allows the oscillator to react to the purified, consolidated momentum of the Factra Bars rather than raw price.
For moving averages (e.g., EMA, SMA), use the close or other relevant Factra Bar output as your source. This provides an exceptionally smooth and responsive average that tracks the true underlying trend.
__________________________________________________________________________
⚠️ LIMITATIONS
While the "Hive Factra" is an incredibly powerful tool for dissecting market dynamics, it's vital to understand its design parameters for optimal use. It does not attempt to front-run reversals or predict market turns. Instead, it focuses on framing price behavior so traders can react with context.
👉 Visual Gaps in Plotting: Due to Tradingview platform limitations with custom candle plotting functionality, you may observe visual gaps between "Hive Factra Bars" on the chart. This occurs because the indicator only plots a Hive Factra Bar when its internal conditions for reconstruction are fully met, and there isn't an 'offset' parameter for custom candles to bridge these visual discontinuities. Importantly, this behavior ensures that each plotted Factra Bar is confirmed and does not repaint, providing reliable historical analysis.
👉 Reconstructed Data, Not Raw Price: It's crucial to remember that "Hive Factra Bars" are not traditional candles. They are a derived visualization that intelligently consolidates price data.
👉 Complementary Tool: This indicator excels at providing high-conviction directional insights and identifying significant market phases. However, it is designed as a sophisticated complement to a broader trading strategy, not a standalone system.
👉 Input Calibration Essential: The effectiveness of the "Hive Factra" is highly dependent on careful calibration of its input parameters, especially the "Offset" and internal EMA settings. Optimal results require user experimentation to find settings best suited for specific assets and timeframes.
👉 Exclusion of Auxiliary Data: The "Hive Factra" focuses solely on transforming price data. It does not incorporate other vital market information such as trading volume, market breadth, or fundamental news. Integrating these additional analytical layers remains essential for a comprehensive trading strategy.
█ ▒▒▒▒▒▒▒▒▒▒▒▒▒▒▒▒▒▒▒▒▒▒▒ 『•••• ✎ ••••』 ▒▒▒▒▒▒▒▒▒▒▒▒▒▒▒▒▒▒▒▒▒▒▒▒ █
🎯 CONCLUSION
The "Hive Factra" offers an unparalleled, intuitive, and highly adaptable framework for instantly grasping true price momentum and direction through its intelligent reconstruction of market data. By transforming chaotic raw data into strikingly clear, high-conviction "Factra Bars" and dynamic signals, it empowers you to cut through distractions and identify critical market currents with ease. Its revolutionary capability for seamless collaboration with external indicators (like RSI, EMA, etc., by using its purified output as their source) means you can elevate the performance of your entire analytical suite to new levels of precision and clarity. Seamlessly integrate this advanced visual tool within your analytical framework to gain a sharper, more confident perspective, and elevate your strategic decision-making in the markets. It's about seeing the unseen, with enhanced clarity and a deeper understanding of market forces, now with the power to supercharge all your other tools.
▣▣▣▣▣▣▣▣▣▣▣▣▣▣▣▣▣▣▣▣▣▣▣▣▣▣▣▣▣▣▣▣▣▣▣▣▣▣▣▣▣▣▣▣▣▣▣▣▣▣▣
🚨 RISK DISCLAIMER
Engagement in financial market speculation inherently carries a substantial degree of inherent risk, and the potential for capital diminution, potentially exceeding initial deposits, is a pervasive and non-trivial consideration. All content, algorithmic tools, scripts, articles, and educational materials disseminated by "Hive Factra" are exclusively purposed for informational and pedagogical objectives, strictly for reference. Historical performance data, whether explicitly demonstrated or implicitly suggested, offers no infallible assurance or guarantee of future outcomes. Users bear sole and ultimate accountability for their individual trading decisions and are emphatically urged to meticulously assess their financial disposition, risk tolerance parameters, and conduct independent due diligence prior to engaging in any speculative market activity.
BeeQuant - Hive HeikinAshi💠 OVERVIEW
The "Hive HeikinAshi" is your ultimate tool for simplifying the chaotic world of price charts. Imagine a specialized lens that cuts through all the market "noise" – those tiny, confusing movements – and reveals the clear, underlying current of price action. This indicator transforms standard, sometimes choppy, candlestick charts into a powerful, trend-focused visualization. It’s designed to help every trader, whether you're a discretionary trader seeking cleaner structures or a quant enthusiast looking for visual cues to complement models, Hive HeikinAshi provides a simplified yet highly informative lens through which to read price action.
Its main advantage lies in its seamless compatibility with external indicators — offering a next-level smoothing foundation that enhances the clarity and reliability of any existing trend, momentum, or signal-based system layered on top of it.
__________________________________________________________________________
🧠 CONCEPTS
At its core, the "Hive HeikinAshi" isn't just another way to look at candles; it's a profound re-interpretation of price dynamics. It employs a sophisticated internal process to distill raw market movements into a more coherent, trend-identifying display, making the market's story incredibly easy to read.
The "Hive" Transformation: Unlike traditional candlesticks that show every small price fluctuation, the "Hive HeikinAshi" candles are intelligently constructed to smooth out the data. They are derived from a multi-point calculation process, creating a new, more consistent visual representation of price. This transformation helps to reduce the "visual clutter" and make trend following a much more intuitive experience. You'll see the forest, not just the trees.
⬜ Highlights dominant price direction by filtering reactive fluctuations
⬜ Visually separates impulsive vs corrective behavior with clear color transitions
⬜ Enables quicker discretionary recognition of trend shifts without complex overlays
⬜ Ideal for confirming momentum zones and stable trending phases
⬜ The Intelligent Filter. An optional yet powerful "Filter" mechanism has been integrated, providing an additional layer of analytical discernment.
⬜ Designed to integrate natively with trend-following, oscillator, or signal indicators — enabling amplified precision across diverse trading systems
A significant advantage of the "Hive HeikinAshi" is its inherent ability to minimize distracting "noise" from typical candle wicks. While standard candles can often show long, confusing wicks that obscure the true body direction, our specialized candles are engineered to emphasize the core directional move. This intelligent design allows you to focus on the momentum generated by the candle's body, rather than getting sidetracked by fleeting price extremes, thereby providing a cleaner, more reliable visual of trend strength.
__________________________________________________________________________
✨ FEATURES
Hive HeikinAshi includes several key features designed for both clarity and functionality:
🔹Multi-Bar Averaging
Generates a visually balanced candle structure using averaged pricing across configurable recent bars.
🔹 Wickless Visualization
Candles are rendered without upper/lower shadows, enhancing trend detection and reducing signal confusion.
🔹 Signal Filter
Adaptive color filter using a dynamic high/low lookback logic
🔹 Directional Color Coding
Clean green/red coloring helps instantly interpret bullish or bearish pressure.
🔹 Adjustable History Depth
Customize how many bars are considered in the smoothing process to match your style and timeframe.
🔹 Invisible Price Feed Outputs
Underlying smoothed OHLC values are available for custom strategies or overlays.
🔹Non-Repainting Logic for Historical Reliability
Each "Hive HeikinAshi" is plotted only when its internal reconstruction conditions are fully met and confirmed. This ensures that the historical display of HeikinAshi does not repaint, providing a high degree of reliability and trust in past signals and visualizations.
🔹Cross-Market Versatility
This indicator is engineered to perform with precision across all major markets—whether you're trading forex, commodities, stocks, or indices. Its adaptive logic automatically aligns with the unique volatility and structure of each asset class, delivering consistently reliable insights no matter where you trade.
__________________________________________________________________________
⚙️ USAGE
Using Hive HeikinAshi is simple and effective:
📥 Add to Chart
Once access is granted, apply the indicator to any timeframe or asset directly from your TradingView invite-only indicators list.
⚙️ Tweak “No. of Bars”
This setting controls how far back the smoothing engine looks.
• Lower values = more responsive, shorter-term smoothing
• Higher values = steadier candles, better for macro trends
🎚️ Next, consider the "Filter" option:
Turn this on to activate the advanced filtering mechanism. Then, adjust the "lookback bars" (from 1 to 10). A smaller number here will make the filter more responsive to immediate "Hive HeikinAshi" candle extremes, while a larger number will require a more sustained breakout from the recent filtered range. Experiment to discover the optimal "sweet spot" that best reveals the underlying market flow for your specific strategy. The tooltip guides you to this optimal setting.
Disable "Filter": If turned off, the candles will revert to a more direct HeikinAshi coloration based purely on their calculated open and close, without the additional layer of range filtering.
🔍 Interpreting Candles
• 🟢 Green Candle: Bullish continuation zone
• 🔴 Red Candle: Bearish pressure dominates
• Lack of wick = strong directional conviction
Combine with your favorite indicators — Hive HeikinAshi acts as a foundation to reduce noise and enhance clarity across tools like EMAs, MACD, VWAP, and more.
__________________________________________________________________________
⚠️ LIMITATIONS
While Hive HeikinAshi provides clear visual advantages, it is important to understand its scope:
👉 Not a Signal Generator: This indicator excels at identifying and confirming trends, making it less suitable for pinpointing exact, high-frequency entry and exit points that require unadulterated real-time price. It prioritizes overall directional clarity.
👉 Lag by Design: Due to multi-bar data smoothing, candles reflect stable price behavior but not ultra-short-term fluctuations.
👉 No Volume or Macro Inputs: Hive HeikinAshi focuses purely on price structure — it does not include volume, news, or external conditions.
👉 Filter Calibration: While the "Filter" enhances clarity, its effectiveness is dependent on appropriate "lookback bars" calibration. Users should understand that adding filtering inherently balances responsiveness with a more refined signal, and finding the optimal setting is part of the analytical process.
█ ▒▒▒▒▒▒▒▒▒▒▒▒▒▒▒▒▒▒▒▒▒▒▒ 『•••• ✎ ••••』 ▒▒▒▒▒▒▒▒▒▒▒▒▒▒▒▒▒▒▒▒▒▒▒▒ █
🎯 CONCLUSION
Hive HeikinAshi is a powerful visual companion for modern traders seeking smoother, clearer price trends. By combining directional clarity with reduced chart clutter, it allows you to interpret the market with less noise and more confidence. Seamlessly integrate this advanced visual tool within your analytical framework to gain a sharper, more confident perspective, and elevate your strategic decision-making in the markets. It's about seeing the unseen, with clarity.
▣▣▣▣▣▣▣▣▣▣▣▣▣▣▣▣▣▣▣▣▣▣▣▣▣▣▣▣▣▣▣▣▣▣▣▣▣▣▣▣▣▣▣▣▣▣▣▣▣▣▣
🚨 RISK DISCLAIMER
Engagement in financial market speculation inherently carries a substantial degree of inherent risk, and the potential for capital diminution, potentially exceeding initial deposits, is a pervasive and non-trivial consideration. All content, algorithmic tools, scripts, articles, and educational materials disseminated by "Hive HeikinAshi" are exclusively purposed for informational and pedagogical objectives, strictly for reference. Historical performance data, whether explicitly demonstrated or implicitly suggested, offers no infallible assurance or guarantee of future outcomes. Users bear sole and ultimate accountability for their individual trading decisions and are emphatically urged to meticulously assess their financial disposition, risk tolerance parameters, and conduct independent due diligence prior to engaging in any speculative market activity.
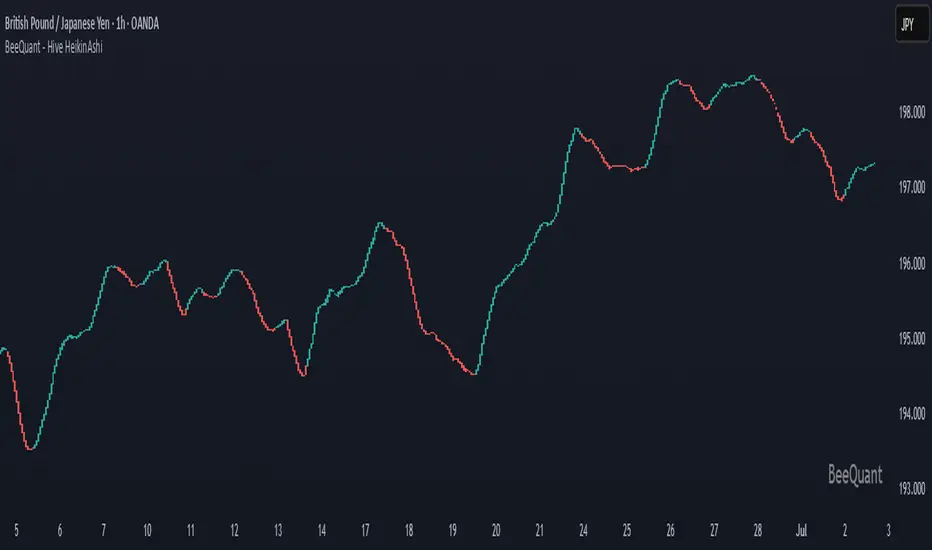
BeeQuant - Hive Visualizer💠 OVERVIEW
The " Hive Visualizer " is a game-changing, invite-only tool, expertly designed to give every trader, from beginner to experienced, instant and clear visual clues about what price is doing. Its main job is to easily show you the highest and lowest points price has reached recently. Think of it as a smart, automated helper that colors your candles to reveal powerful market moves. This helps you quickly see if prices are getting stronger or weaker right on your chart. It's a groundbreaking, high-quality tool that cuts through the noise, making it simple to spot key moments when the market is about to make a big move up or down, giving you an edge.
__________________________________________________________________________
🧠 CONCEPTS
The core philosophy behind Hive Visualizer is rooted in contextual volatility exposure and directional bias reinforcement. Through a sophisticated internal mechanism that evaluates local maxima/minima behavior within a compact temporal field, the indicator provides adaptive color‑based candle transitions that align with latent directional pressure.
1. Uses localized equilibrium breach detection to monitor directional intent and exhaustion points.
2. Embeds a dynamically updating framework that reacts to both trend continuation and structural reversals.
3. Avoids false positives by disregarding noisy fluctuations below system‑defined relevance thresholds.
4. Provides non‑repainting, fully forward‑confirmed visual outputs for reliable retrospective analysis.
Hive Visualizer is not designed to be predictive. Instead, it allows traders to observe the evolution of price structure in a cleaner and more digestible format, supporting high-confidence discretionary execution or automated model overlays.
__________________________________________________________________________
✨ FEATURES
The "Hive Visualizer" comes with a suite of smart features, all designed for amazing clarity, quick reactions, and deeper understanding, making your charting experience truly effortless:
🔹 Easy Range Customization
A super easy "Smoother" setting lets you perfectly adjust how the indicator reacts to recent price changes. This means you can fine-tune it to match exactly how you like to trade
🔹 Instant, Clear Signals
The simple Green and Red candles give you immediate, unmistakable visual cues about strong upward or downward moves, providing insights you can grasp in a heartbeat.
🔹 Smart Continuity in Quiet Times
The clever way it keeps the same color for candles that aren't breaking out offers valuable, subtle insights into those periods when the market is just moving sideways or finding its balance, helping you see the hidden dynamics.
🔹 Seamless Chart Integration
This indicator works like a transparent overlay, appearing directly on your price chart without getting in the way or changing your original candles. It fits perfectly, making your analysis smooth and uninterrupted.
🔹 Clean and Focused Visuals
The indicator’s simple design focuses only on coloring the main candle body and border to clearly highlight important breakouts. This keeps your chart clean and effective, showing you only what truly matters.
🔹 Cross-Market Versatility
This indicator is engineered to perform with precision across all major markets—whether you're trading forex, commodities, stocks, or indices. Its adaptive logic automatically aligns with the unique volatility and structure of each asset class, delivering consistently reliable insights no matter where you trade.
__________________________________________________________________________
⚙️ USAGE
Using and making the "Hive Visualizer" a part of your trading routine is incredibly simple and designed to significantly boost how you understand the market:
Getting Started: Once you have access, just add the "Hive Visualizer" indicator to any chart and timeframe you want on TradingView. It's that easy.
Tuning the "Smoother" Setting: Go into the indicator's settings and play with the "Smoother" number. This is a crucial step to make it react just right for you.
Smaller numbers (like 1-3 bars) will make the indicator very quick to react to the most recent, short-term ups and downs, perfect for fast trading.
Larger numbers (like 5-10+ bars) will give you a wider view, smoothing out small changes and highlighting bigger, more important breakouts, ideal for longer-term analysis. Spend a little time trying different settings to find what works best for your chosen asset and your trading style – it's like finding the perfect lens for your market view.
Understanding the Colors: Once you've set it up, here's how to quickly understand what the "Hive Visualizer" is telling you: New Green Candle: This means a strong sign that buyers are in control and prices are likely to keep moving up, giving you confidence in bullish moves.
New Red Candle: This indicates as a strong signal that sellers are dominating and prices are likely to keep moving down, preparing you for bearish shifts.
__________________________________________________________________________
⚠️ LIMITATIONS
👉 Visual Guide, Not a Bot: Use as part of a broader strategy—it won’t auto‑trade for you
👉 Retroactive Insight: It reflects past price action; it doesn’t predict the future.
👉 Setting‑Dependent: Effectiveness relies on your “Smoother” choice—too low = noise; too high = lag.
👉 Price‑Range Focused: Highlights trends and range only — doesn’t analyze volume, news, or other complex factors.
👉 This tool enhances trend validation but isn’t a standalone signal generator.
█ ▒▒▒▒▒▒▒▒▒▒▒▒▒▒▒▒▒▒▒▒▒▒▒ 『•••• ✎ ••••』 ▒▒▒▒▒▒▒▒▒▒▒▒▒▒▒▒▒▒▒▒▒▒▒▒ █
🎯 CONCLUSION
The "Hive Visualizer" offers an incredibly easy-to-use and adaptable way to see price strength and weakness with crystal clarity on your charts. By giving you instant, clear feedback on whether prices are powerfully breaking out or falling below a recent historical range, it truly empowers you to quickly understand market momentum and spot key turning points. Seamlessly add this smart visual tool into your current trading methods to gain a sharper, more insightful view, and elevate your trading decisions. It's about seeing the market with new eyes.
▣▣▣▣▣▣▣▣▣▣▣▣▣▣▣▣▣▣▣▣▣▣▣▣▣▣▣▣▣▣▣▣▣▣▣▣▣▣▣▣▣▣▣▣▣▣▣▣▣▣▣
🚨 RISK DISCLAIMER
Engagement in financial market speculation inherently carries a substantial degree of inherent risk, and the potential for capital diminution, potentially exceeding initial deposits, is a pervasive and non-trivial consideration. All content, algorithmic tools, scripts, articles, and educational materials disseminated by "Hive Visualizer" are exclusively purposed for informational and pedagogical objectives, strictly for reference. Historical performance data, whether explicitly demonstrated or implicitly suggested, offers no infallible assurance or guarantee of future outcomes. Users bear sole and ultimate accountability for their individual trading decisions and are emphatically urged to meticulously assess their financial disposition, risk tolerance parameters, and conduct independent due diligence prior to engaging in any speculative market activity.

BotDCA | Algorithmic Smart DCA Bot🌌 What the script does, how it does ?
At the heart of its algorithm, this script incorporates the concept of Dollar Cost Averaging (DCA), a method of periodically allocating funds to an asset to mitigate the effects of market volatility.
Before we start, it's important to clarify that the script is adapted for the cryptocurrency market on USDT & USDC pairs in Spot, and on the Daily timeframe (D).
For this reason, and to optimize profits, the script will generate very few buy and sell positions.
Please also note that the script does not repaint.
Essentially, BotDCA generates buy and sell orders.
These buy and sell orders are generated using the following logic :
BUYING LOGIC :
• Volume : Current volume is compared with a linear percentile of volume over a short period.
This means that if current volume is higher than observed volumes over this period, the volume criteria is considered valid.
• Momentum & Volatility : The Average True Range (ATR) indicator adjusted by a square root is used as a measure of volatility.
Momentum is then calculated as the difference between the current closing price and a short moving average, normalized by this adjusted volatility.
The oversold condition is validated when momentum exceeds a specific level.
For the buy order to be triggered, the volume, momentum and volatility criteria must be validated.
SELLING LOGIC :
• Volume : Similar to the buy logic, the volume criteria is validated when current volume is higher than previous volumes.
• Momentum & Volatility : Volatility is measured using the adjusted ATR indicator, similar to the buy logic.
An overbought condition is validated when normalized momentum, calculated as the difference between the current closing price and a volatility-adjusted short-period moving average, exceeds a specific level.
• Trend : The general market trend is considered for the sell logic.
The trend criteria is validated when the current moving average is higher than that of the previous period.
For the sell order to be triggered, the volume, momentum, volatility and trend criteria must be validated.
These orders are also adjusted according to what the user defines as buy and sell settings :
🔵 Buying settings
• Quantity per order ($) : Defines the amount in stable coins to be invested for each buy order.
• └> Mult. quantity (x) : Multiplication factor applied to the buy quantity for successive orders, enabling the investment to be increased in the event of a price fall.
Example : If Quantity per order is $200 and Mult. quantity is x2, then the second buy order will be $400, the third buy order will be $800, the fourth buy order will be $1600 ...
After a sell order, the multiplier is cancelled.
Note : If value is set to 1 : Disabled
• └> Max. quantity (x) : Sets a maximum purchase quantity limit, preventing orders from exceeding this amount.
Example : If Quantity per order is $200, Mult. quantity is x2, and Max. quantity is $700, then the second buy order will be $400, the third buy order will be $700, the fourth buy order will be $700 ...
Note : If value is less than Quantity or is set to 0 : Disabled
• └> If Price > Average price : Enable or disable quantity multiplier when current price exceeds average price.
• Min. delay (in days) : Establishes a minimum interval in days between two successive purchases to avoid investing too close together.
Example : By default the time interval for the bot is set to D, so if you set 20 as the value, the bot will wait at least 20 days between buy orders before entering a position.
Note : If value is set to 0 : Disabled
• └> Min. deviation (%) : Defines the minimum price difference in percent to trigger a new purchase after the first.
Note : If value is set to 0 : Disabled
• └> Mult. deviation (x) : Apply a multiplication factor to the price differential for successive buys, progressively increasing the purchase interval.
Example : If Mult. deviation is 10% and Min. deviation is x2, then between the first and second buy orders the minimum deviation will be 10%, between the second and third buy orders the minimum deviation will be 20%, between the third and fourth buy orders the minimum deviation will be 40%...
After a sell order, the multiplier is cancelled.
Note : If value is set to 1 : Disabled
• Display help for these settings : On chart, displays help text about buying settings.
🟢 Selling settings
• Quantity (% position) : Percentage of the position to be sold in each sell order.
Example : If the first buy order is 0.1 BTC and the second buy order is 0.2 BTC, then the position is 0.3 BTC.
If Quantity (% position) is set to 20, then the first sell order will be 0.06 BTC (20% of 0.3 BTC), the second sell order will be 0.048 BTC (20% of 0.24 BTC) ...
(Auto ?) : If this option is enabled, the bot will automatically sell part of your position.
The quantity sold depends on the volatility of the last 30 days : the higher the volatility, the more it sells, and the lower the volatility, the less it sells.
The minimum sale defined is 10%, while the maximum sale will not exceed 50%.
• └> Min. deviation (%) : Minimum percentage of price deviation to trigger a sale.
Example : If Average price of BTC is 30 000 USDT and Min. deviation is 10%, then the first sell order will be at least 33 000 USDT, the second sell order will be at least 36 300 USDT ...
Note : If value is set to 0 : Disabled
(Auto ?) : If this option is activated, the bot automatically determines the sell minimum deviation percentage.
The deviation set depends on the volatility of the last 30 days : the higher the volatility, the higher the deviation, and the lower the volatility, the lower the deviation.
A start and end date defines when the script should generate buy and sell positions :
📆 Date settings
• Start date : Indicate the script launch date (If it’s a new launch, you must choose today’s date before creating your TradingView alert).
• End date : Enter the date on which you want the script to stop.
Other parameters can be configured to fine-tune buys and sells :
⏲️ Trading session settings
• Days : Allows you to select the specific days on which the script will be active, offering the possibility of excluding certain days.
🏛️ Exchange settings
• Fees (%) : Indicate the percentage fee applied by the exchange platform on each transaction.
• Price spread (%) : Specifies the price spread to be considered for realistic order adjustment.
🤖 Bot settings
• Add to Position ? : Allows tokens to be manually added to the position when the script is launched.
• └> How much ? (Base) : Number of tokens to add.
• └> Cost ? ($) : Stable coins amount of addition to position.
These settings are included in the calculation when an order is triggered.
Advanced visual customization options can be modified :
🎨 Visual settings
• TradingView Theme : Choose between a light or dark theme for the bot interface.
• Panel : Enables or disables the display of the information panel on the graph, and modifies its size and alignment.
• Positions : Show or hide buy and sell position labels on the chart, and modify their size and appearance (several display modes : basic, simple, advanced).
• Average price : Enables or disables the display of the average price line and modifies its size and color.
• Simulator : Enables or disables the ATH percentage-based simulator line and modifies its size and color.
• Trading session : Displays or hides the background of specified trading sessions.
• Hide warning messages ? : Hide or show warning messages on graph.
A profit simulator can be configured :
🕹️ Simulator settings
• Price (% ATH) : Determines a percentage of the token's ATH to simulate potential gains if the token reaches this price level again.
Users can also activate buying and selling alerts in the settings :
🤖 Bot settings
• START THE BOT ? » ALERTS ON : REAL MODE : Enable or disable the bot to execute real orders based on alerts.
• Mode FULL Auto ? : Enables the Mode FULL Auto, requiring additional configuration for connection to exchange APIs.
• └> Password FULL Auto : Password required to activate the Mode FULL Auto.
By activating FULL Auto Mode with TradingView's webhook system, the user can connect the script to the APIs of compatible exchanges, and receive notifications of buy and sell orders by e-mail, Telegram or Discord.
On the chart, a panel displays a variety of information, and also a backtesting / result of the script.
Here is a list of elements displayed by the panel :
💻 Informations panel
General :
• Pair
• Exchange
• └> Fees
• └> Price spread
• Period
• Start date
• End date
• Trading days
Buying
• Quantity per order
• └> Mult. quantity
• └> Max. quantity
• └> If Price > Average price
• └> Min. deviation
• └> Mult. deviation
• Min. delay (in days)
Selling
• Quantity (% position)
• └> Min. deviation
Exchange
• Next buy
• Next sell
Backtesting / Results
• No. of buys
• No. of sells
• Average price
• Actual position
• Actual net profit
• └> Simulator
• Last buy
• Last sell
🌌 About default settings
Default settings are defined as an example.
Above in the description, you will find details of each setting.
Here's a description of how user-defined setting categories affect the script's buy and sell positions :
📆 Date : Determines between which time ranges buy and sell positions are generated.
⏲️ Trading session : Exclude selected days disables buy positions on deselected days.
🕹️ Simulator : Does not affect buying and selling. It is for information purposes only.
🏛️ Exchange : Fees should be as close as possible to your exchange and price spread depends on your tolerance. This affects buy and sell position.
🔵 Buy : Depending on your investment capacity and risk management, these settings have an impact on buy positions.
🟢 Sell : These settings determine profit-taking. This has an impact on sell positions.
🎨 Visual : Does not affect buy and sell positions. For information only.
🤖 Bot : This part is mainly used to use the script with TradingView alerts. Only the 'Add to position' option affects buy and sell positions.
Once you've set all your settings for the script, you can view the backtesting displayed in the panel on the chart.
🌌 How to use it ?
To summarize how to use this script successfully, please follow these steps :
1. First, choose a cryptocurrency pair (e.g. BTC/USDT).
2. Set a start date (preferably today's date if it's your first launch) and an end date.
3. According on your preferences, you can choose specific trading days, or default to all days of the week.
4. Depending on your exchange, you can set fees and a price spread.
5. Then, based on your portfolio management and investment capabilities, define buy and sell parameters.
6. You can set the bot's appearance on the chart.
7. Once you have configured your settings, you can choose a simulation price.
8. Finally, to activate TradingView Alerts, check the box START THE BOT ? ALERTS ON : REAL MODE.
🌌 Overview
Here's a preview of the script with a few screenshots :
BTC/USDT • Basic display
SOL/USDT • Simple display
XRP/USDT • Advanced display
MATIC/USDT • Light theme
Script settings
🌌 Why do I have to pay ?
BotDCA uses advanced indicators and complex calculations to identify buying and selling opportunities.
With TradingView's alert system, it automates your investment strategy, eliminating the need for constant manual analysis and constant market monitoring.
This saves you precious time.
With adjustable buy and sell settings, you can customize the script to suit your risk tolerance and investment objectives.
This flexibility adds considerable value, allowing you to optimize the script to suit your situation.
Paid access ensures that you benefit from ongoing support and updates, which are essential for maintaining the script's effectiveness.
🌌 Disclaimer
This script is provided for educational purposes only and should not be construed as investment advice.
Users should be aware that trading in the financial markets involves risks, and that past performance of a script does not guarantee future results.
It is strongly recommended that you carry out a detailed analysis and consider your financial situation and risk tolerance before committing yourself to trading/investing.
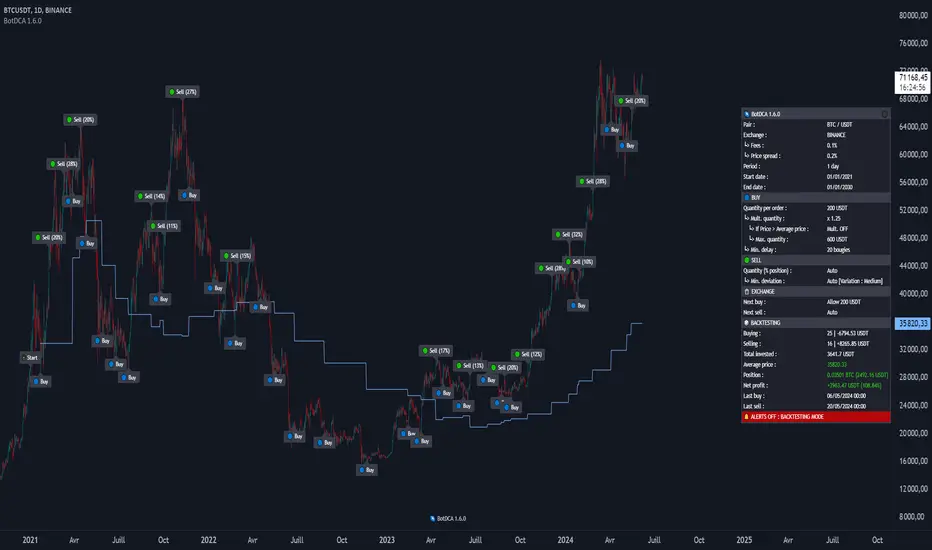
[blackcat] L5 Alchemy Gold (ALGOLD)" L5 Alchemy Gold (ALGOLD)" indicator is a trend-following indicator that blends volume and price data to create a MACD-like oscillator, aiming to address the lagging issue typical in price-only indicators. The integration of leading volume information with lagging price data is a smart approach to create more timely signals. Additionally, incorporating a volatility filter to reduce false signals during sideways markets is a thoughtful enhancement.
It is shaping up to be quite comprehensive. It includes:
- An adaptive filter for smoothing price and volume data.
- A volatility filter based on Average True Range (ATR).
- A trigger moving average for generating smoothed price information.
- An ALMA (Arnaud Legoux Moving Average) for further filtering of price and volume.
- A divergence detector to identify potential trend reversals.
Entry Criteria : A composite crossover and crossunder of the fast and slow lines of the ALGOLD oscillator.
Exit Criteria : A crossover and crossunder of the fast and slow lines of the ALGOLD oscillator, but using a lower time frame for more sensitivity.
The input parameters of " L5 Alchemy Gold (ALGOLD)" indicator, are categorized into three groups:
Group 1, Alchemy Setting:
Alchemy Sharpness (Default: 7) - Controls the sharpness of the adaptive filter.
Alchemy Period (Default: 55) - Determines the smoothness of the oscillator.
Group 2, DVATAR Setting:
DVATR Length (Default: 11) - Sets the period length for the DVATR, similar to ATR's Length.
DVATR Threshold (Default: 0.07) - Adjusts sensitivity for sideways market detection.
Smooth Length (Default: 21) - Smoothens the DVATR output, balancing with volatility detection.
Group 3, Divergence Setting:
Parameters like Pivot Lookback, Max/Min of Lookback Range - Sets the sensitivity for divergence detection.
Options to enable or disable plots for various types of divergence (Bullish, Hidden Bullish, Bearish, Hidden Bearish).
" L5 Alchemy Gold (ALGOLD)" indicator are vivid and intuitive:
Candle Bar Color :
Gradient color changes to indicate trend strength, with warmer colors for bullish and cooler colors for bearish trends.
Line Colors and Shapes :
Green color represents the fast line, red for the slow line.
Crosses of these lines signal entries (triangles) and exits (cross shapes).
A band is created between these lines, filled with green for uptrends and red for downtrends.
Histogram :
Red histogram for above 0 and uptrend.
Blue histogram for above 0 and retracement.
Green histogram for below 0 and downtrend.
Yellow histogram for below 0 and bounce-up.