The Flower - Multiple Strategy Options in OneStrategy Overview
This strategy code currently includes four separate strategies to be used to either aid in discretionary trading or to be used algorithmically through the third-party system Profitview (profitview.app). Support for Pineconnector for use with MetaTrader 4 is in the works. The strategies have been designed with cryptocurrency trading in mind, however, the fundamentals apply to other assets.
The four strategies currently included are labeled “TSI Cross” (the default setting), “Oscillator Bands”, “Scalping”, and “McG/MA Cross”. Detailed information for each independent strategy can be found below, including sample settings configurations for each. A dropdown menu to select the strategy can be found under the “Strategy Options” set of settings under the Input tab of the strategy settings menu.
Additionally, the option to receive only long or short signals can be found alongside the Strategy Choice menu.
Take profit, stop loss, and trailing percentages are also included, found at the bottom of the Input tab under “TT and TTP” as well as “Stop Loss”. Make sure to understand the TP/SL ratio that you desire before use, as the desired hit rate/profitability percentage will be affected accordingly.
The only visuals associated with the strategy are two McGinley Dynamic lines, red (slow length) and green (fast length). These are relevant to the McGinley Cross strategy, but can be used alongside the other strategies if desired.
When viewing the backtesting data in the TradingView Strategy Tester, ensure that “use bar magnifier” is activated. This option can be found in the Properties tab of the strategy settings menu.
Profitview Settings
If you wish to utilize Profitview’s automation system, find the included “Profitview Settings” under the Input tab of the strategy settings menu. If not, skip this section entirely as it can be left blank. Options will be “OPEN LONG TITLE”, “OPEN SHORT TITLE”, “CLOSE LONG TITLE”, and “CLOSE SHORT TITLE”. If you wished to trade SOL, for example, you would put “SOL LONG”, “SOL SHORT”, “SOL CLOSE LONG”, and “SOL CLOSE SHORT” in these areas. Within your Profitview extension, ensure that your Alerts all match these titles. A sample of our Profitview syntax can be found below.
To set an alert for use with Profitview, go to the “Alerts” tab in TradingView, then create an alert. Make sure that your desired asset and timeframe are currently displayed on your screen when creating the alert. Under the “Condition” option of the alert, select the strategy, then select the expiration time. If using TradingView Premium, this can be open-ended. Otherwise, select your desired expiration time and date. This can be updated whenever desired to ensure the strategy does not expire. Under “Alert actions”, nothing necessarily needs to be selected unless so desired. Leave the “Alert name” option empty. For the “Message”, delete the generated message and replace it with {{strategy.order.alert_message}} and nothing else.
Strategy Choices
As mentioned above, this strategy code contains four separate strategy options. A detailed breakdown of each follows below:
Total Strength Index (TSI) Cross
This strategy option is the default choice. The main signal involved in this strategy is a crossover or crossunder of the TSI value line and TSI signal line, however, there are a few other signals involved in the creation of a long or short entry. In addition to the TSI, the strategy includes an Average Directional Index (ADX) threshold value, Jurik Volatility Bands (JVB), a Stoch RSI threshold, and an oscillator of choice in conjunction with a threshold of 0. This oscillator choice can be selected under the “Signal Options” menu in the Input tab of the strategy settings. The default oscillator is the Detrended Price Oscillator (DPO), though the option for Chande Momentum (CMO) or Rate of Change (RoC) are both viable for this strategy.
Individual settings for these can be found in the Input tab under “Oscillator Settings” (TSI, Stoch RSI, DPO, CMO, ROC), “Band/Channel Settings” (Jurik Volatility Bands Length/Smoothing), and “Directional Settings” (ADX Smoothing Long, DI Length Short, ADX Threshold).
Sample settings for SOLUSDT using the 20M timeframe:
- Oscillator Settings -- DPO Length (21), DPO *not* centered, RSI (Stoch) Length (4), Stochastic Length (4), TSI Long Length (25), TSI Short Length (13), TSI Signal Length (13), K (3), D (3)
- Band/Channel Settings -- Jurik Volatility Bands Length (25), Jurik Volatility Bands Smoothing (5)
- Directional Settings – JVB Price Threshold (0), ADX Smoothing Long (5), DI Length Short (5), ADX Threshold (23)
- Take Profit/Stop Loss – 0.85% TP, 0.005% TTP, 1.3% SL
Oscillator Bands
This strategy involves the usage of bands or channels that use oscillators as a source input. The main signal for this strategy derives from a cross of the band or channel and a hline of 0. Additionally, this includes a “Directional Filter” and a “MA Filter”. The selections for all of these can be found in the “Signal Options” section of the Input tab.
First option is for Oscillator Choice and includes DPO, CMO, ROC, RSI, TSI, and the Jurik price line. The individual settings for these can be found in the “Oscillator Settings” section. Different channels can be selected for the upper or lower bands, though it is not necessary for them to differ. These current options include Bollinger Bands and Jurik Volatility Bands, the individual settings for each found in the “Band/Channel Settings” section. Next is the MA Filter, of which you can select SMA, EMA, SMMA, WMA, VWMA, KAMA, JMA, or McGinley Dynamic. All options for these settings can be found in the “MA Filter Settings” section. Lastly, the Directional Filters can be selected for either direction like the upper/lower band selection. These filters include the ADX, Bull-Bear Power (BBP), Parabolic SAR (PSAR), or Jurik.
Sample settings for WAVESUSDT using the 20M timeframe:
- Oscillator Choice – DPO (Length – 30, uncentered)
- Upper and Lower Band – JVB Upper/Lower (Jurik Volatility Bands Length – 25; Smoothing – 10)
- MA Filter – VWMA – (MA Length – 40; Source – Open)
- Directional Filter – ADX (ADX Smoothing Long – 14; DI Length Short – 5; ADX Threshold – 22)
- Take Profit/Stop Loss – 0.85% TP, 0.005% TTP, 1.3% SL
Scalping
This strategy heavily relies on the usage of Parabolic SAR, accompanied by a “Directional Filter” (as discussed in the previous section) other than PSAR. This strategy can provide a higher frequency of trades as opposed to the other strategies available, however, it comes with slightly higher risk inherently. A riskier take profit/stop loss spread is recommended here, though risk should always be managed. The settings required for this strategy are all found under the “Directional Settings” section of the strategy inputs.
Sample settings for NEARUSDT using the 20M timeframe:
- Directional Filter set to ADX
- Directional Settings – ADX Smoothing Long (5), DI Length Short (5), ADX Threshold (22), PSAR Start Value (0.02), PSAR Increment (0.005), PSAR Max Value (0.15), PSAR Source (Close)
- Take Profit/Stop Loss – 0.75% TP, 0.005% TTP, 1.5% SL
McGinley Cross
This strategy revolves around the crossing of two McGinley Dynamic lines of varying lengths alongside an ADX filter as well as a DPO filter. McGinley is used as opposed to a standard moving average cross strategy as it adjusts for shifts in market speed and can better gauge market trends. The McGinley length settings can be found with the “MA Filter” settings, labeled as Fast Length and Slow Length. The fast length number should be smaller than the slow length.
Sample settings for SOLUSDT using the 20M timeframe:
- Oscillator Settings – DPO Length (30), uncentered
- MA Filter Settings – McGinley Fast Length (4), McGinley Slow Length (21)
- Take Profit/Stop Loss – 0.85% TP, 0.005% TTP, 1.4% SL
Comprehensive Settings List
Date and Time: From date and to date, adjustable for backtesting purposes.
Signal Options:
Oscillator Choices: Chande Momentum Oscillator (CMO), Detrended Price Oscillator (DPO), Rate of Change (ROC), Relative Strength Index (RSI), True Strength Index (TSI), Jurik Volatility Bands Priceline (JVB) – *** for use with TSI Cross or Oscillator Bands strategies only ***
Upper and Lower Band/Channel Choices: Bollinger Bands (BB) or Jurik Volatility Bands (JVB) -- *** for use with Oscillator Bands strategy only ***
MA/McG Filter: SMA, EMA, RMA, WMA, VWMA, Kaufmann MA, Jurik MA, McGinley Dynamic -- *** for use with Oscillator Bands strategy only ***
Directional Filter Long/Short: Average Directional Index (ADX), Bull/Bear Power (BBP), Parabolic SAR (PSAR), Jurik -- *** for use with Oscillator Bands strategy only ***
Profitview Settings: *** For use with ProfitView extension only, otherwise ignore ***
Oscillator Settings: *** For use with TSI Cross, Oscillator Bands, and McGinley Cross strategies ***
CMO Length, CMO Source – for Chande Momentum Oscillator
DPO Length, DPO Centered – for Detrended Price Oscillator
RoC Length, RoC Source – for Rate of Change
RSI Length, RSI MA Length – for Relative Strength Index
RSI (Stoch) Length, Stochastic Length, Stoch RSI Source, K, D – for Stochastic RSI
TSI Long Length, TSI Short Length, TSI Signal Length – for True Strength Index
Band/Channel Settings: *** For use with Oscillator Bands strategy ***
Jurik Volatility Bands Length, Jurik Volatility Bands Smoothing – for Jurik Volatility Bands
Bollinger Band Length, Bollinger Band Multiplier – for Bollinger Bands
Directional Settings: *** For use with Scalping and Oscillator Bands strategies ***
JVB Price Threshold – for Jurik Volatility as a directional setting
ADX Smoothing Long, DI Length Short, ADX Threshold – for Average Directional Index
PSAR Start Value, PSAR Increment, PSAR Max Value, PSAR Source – for Parabolic SAR
MA Filter Settings: *** For use with Oscillator Bands and McGinley Cross strategies ***
McGinley Fast/Slow Length – for McGinley Dynamic
MA Length, MA Source, MA Offset – for any other moving average
TP and TTP / Stop Loss: *** For use with ALL strategies ***
Long/Short Take Profit % -- for standard take profit settings
Enable Trailing, Trailing Take Profit % -- for trailing settings
Stop Loss % -- for standard stop loss settings; trailing can be enabled or disabled for stop loss
Disclaimers:
Some open-source code has been included -- Jurik Volatility Bands (by "ProValueTrader") and Trailing Take Profit/Stop Loss code (by jason5480). Additional code was used from the TradingView built-ins.
These strategies do NOT guarantee future returns. Apply caution in trading regardless of discretionary or algorithmic. Understand the concepts of risk/reward and the intricacies of each strategy choice before utilizing them in your personal trading.
Invites to the strategy will only be disseminated to those with express consent and knowledge of the invite prior to the action itself.
Cerca negli script per "algo"

GT 5.1 Strategy═════════════════════════════════════════════════════════════════════════
█ OVERVIEW
People often look an indicator in their technical analysis to enter a position. We may also need to look at the signals of one or more indicators to verify the signals given by some indicators. In this context, I developed a strategy to test whether it really works by choosing some of the indicators that capture trend changes with the same characteristics. Also, since the subject is to catch the trend change, I thought it would be right to include an indicator using the heikin ashi logic. By averaging and smoothing the market noise, Heiken Ashi makes it easier to detect the direction of the trend helps to see possible reversal points on the chart. However, it should be noted that Heiken Ashi is a lagging indicator.
I picked 5 different indicators (but their purpose are similar) and combined them to produce buy and sell signals based on your choice(not repaint). First of all let's get some information about our indicators. So you will understand me why i picked these indicators and what is the meaning of their signals.
1 — Coral Trend Indicator by LazyBear
Coral Trend Indicator is a linear combination of moving averages, all obtained by a triple or higher order exponential smoothing. The indicator comes with a trend indication which is based on the normalized slope of the plot. the usage of this indicator is simple. When the color of the line is green that means the market is in uptrend. But when the color is red that means the market is in downtrend.
As you see the original indicator it is simple to find is it in uptrend or downtrend.
So i added a code to find when the color of the line change. When it turns green to red my script giving sell signals, when it turns red to green it gives buy signals.
I hide the candles to show you more clearly what is happening when you choose only Coral Strategy. But sometimes it is not enough only using itself. Even if green dots turn to red it continues in uptrend. So we need a to look another indicator to approve our signal.
2 — SSL channel by ErwinBeckers
Known as the SSL , the Semaphore Signal Level channel is an indicator that combines moving averages to provide you with a clear visual signal of price movement dynamics. In short, it's designed to show you when a price trend is forming. This indicator creates a band by calculating the high and low values according to the determined period. Simply if you decide 10 as period, it calculates a 10-period moving average on the latest 10 highs. Calculate a 10-period moving average on the latest 10 lows. If the price falls below the low band, the downtrend begins, if the price closes above the high band, the uptrend begins. Lets look the original form of indicator and learn how it using.
If the red line is below and the green band is above, it means that we are in uptrend, and if it is on the opposite side, it means that we are in downtrend. Therefore, it would be logical to enter a position where the trend has changed. So i added a code to find when the crossover has occured.
As you see in my strategy, it gives you signals when the trend has changed. But sometimes it is not enough only using this indicator itself. So lets look 2 indicator together in one chart.
Look circle SSL is saying it is in downtrend but Coral is saying it has entered in uptrend. if we just look to coral signal it can misleads us. So it can be better to look another indicator for validating our signals.
3 — Heikin Ashi RSI Oscillator by JayRogers
The Heikin-Ashi technique is used by technical traders to identify a given trend more easily. Heikin-Ashi has a smoother look because it is essentially taking an average of the movement. There is a tendency with Heikin-Ashi for the candles to stay red during a downtrend and green during an uptrend, whereas normal candlesticks alternate color even if the price is moving dominantly in one direction. This indicator actually recalculates the RSI indicator with the logic of heikin ashi. Due to smoothing, the bars are formed with a slight lag, reflecting the trend rather than the exact price movement. So lets look the original version to understand more clearly. If red bars turn to green bars it means uptrend may begin, if green bars turn to red it means downtrend may begin.
As you see HARSI giving lots of signal some of them is really good but some of them are not very well. Because it gives so much signals Now i will change time period and lets look same chart again.
Now results are better because of heikin ashi's logic. it is not suitable for day traders, it gives more accurate result when using the time period is longer. But it can be useful to use this indicator in short time periods using with other indicators. So you may catch the trend changes more accurately.
4 — MACD DEMA by ToFFF
This indicator uses a double EMA and MACD algorithm to analyze the direction of the trend. Though it might seem a tough task to manage the trades with the help of MACD DEMA once you know how the proper way to interpret the signal lines, it will be an easy task.
This indicator also smoothens the signal lines with the time series algorithm which eventually makes the higher time frame important. So, expecting better results in the lower time frame can result in big losses as the data reading from the MACD DEMA will not be accurate. In order to understand the function of this indicator, you have to know the functions of the EMA also.
The exponential moving average tends to give more priority to the recent price changes. So, expecting better results when the volatility is very high is a very risky approach to trade the market. Moreover, the MACD has some lagging issues compared to the EMA, so it is super important to use a trading method that focuses on the higher time frame only. What does MACD 12 26 Close 9 mean? When the DEMA-9 crosses above the MACD(12,26), this is considered a bearish signal. It means the trend in the stock – its magnitude and/or momentum – is starting to shift course. When the MACD(12,26) crosses above the DEMA-9, this is considered a bullish signal. Lets see this indicator on Chart.
When the blue line crossover red line it is good time to buy. As you see from the chart i put arrows where the crossover are appeared.
When the red line crossover blue line it is good time to sell or exit from position.
5 — WaveTrend Oscillator by LazyBear
This is a technical indicator that creates high and low bands between two values. It then creates a trend indicator that draws waves with highs and lows within these boundaries. WaveTrend is a widely used indicator for finding direction of an asset.
Calculation period: number of candles used to calculate WaveTrend, defaults to 10. Averaging period: number of candles used to average WaveTrend, defaults to 21.
As you see in chart when the lines crossover occured my strategy gives buy or sell signals.
═════════════════════════════════════════════════════════════════════════
█ HOW TO USE
I hope you understand how the indicators I mentioned above work and what they are used for. Now, I will explain in detail how to use the strategy I have created.
When you enter the settings section, you will see 5 types of indicators. If you want to use the signals of the indicators, simply tick the box next to the indicators. Also, under each option there is an area where you can set the "lookback". This setting is a field that will make the signals overlap when you select more than one option. If you are going to trade with only one option, you should make sure that this field is 0. Otherwise, it may continue to generate as many signals as you choose.
Lets see in chart for easy understanding.
As you see chart, if i chose only HARSI with lookback 0 (HARSI and CORAL should be 1 minumum because of algorithm-we looking 1 bar before, others 0 because we are looking crossovers), it will give signals only when harsı bar's color changed. But when i changed Lookback as 7 it will be like this in chart.
Now i will choose 2 indicator with settings of their lookback 0.
As you see it will give signals when both of them occurs same time. But HARSI is an indicator giving very early signal so we can enter position 5-6 bars after the first bar color change. So i will change HARSI Lookback settings as 7. Lets look what happens when we use lookback option.
So it wil be useful to change lookback settings to find best signals in each time period and in each symbol. But it shouldnt be too high. Because you can be late to catch trend's starting.
this is an image of MACD and WAVE trend used and lookback option are both 6.
Now lets see an example with 3 options are chosen with lookback option 11-1-5
Now lets talk about indicators settings. After strategy options you will see each indicators settings, you can change their settings as you desired. So each indicators signal will be changed according to your adjustment.
I left strategy options with default settings. You can change it manually as if you want.
═════════════════════════════════════════════════════════════════════════
█ LIMITATIONS: Don't rely on non-standard charts results. For example Heikin Ashi is a technical analysis method used with the traditional candlestick chart.Heikin Ashi vs. Candlestick Chart: The decisive visual difference between Heikin Ashi and the traditional chart is that Heikin Ashi flattens the traditional candlestick chart using a modified formula.
The primary advantage of Heikin Ashi is that it makes the chart more reader-friendly and helps users identify and analyze trends .
Because Heikin Ashi provides averaged price information rather than real-time price and reacts slowly to volatility — not suitable for scalpers and high-frequency traders. I added HARSI indicator as a supportive signal because it is useful with using CORAL and SSL channel indicators. If you change your candle types to Heikin Ashi , your profit will change in good way but dont rely on it.
═════════════════════════════════════════════════════════════════════════
█ THANKS:
Special thanks to authors of the scripts that i used.
@LazyBear and @ErwinBeckers and @JayRogers and @ToFFF
═════════════════════════════════════════════════════════════════════════
█ DISCLAIMER
Any trade decisions you make are entirely your own responsibility.

Longbithello Traders !
Inspired by the indicator Range Filter Buy and Sell 5min by guikroth , namely calculation and works price movement range filter .
And Inspired by the indicator by the indicator VuManChu Cipher B + Divergences by vumanchu namely calculation and working out divergences and convergences , i was inspired to create a strategy .
This is indicator - strategy - ( Longbit ) - aggregate and my modification indicators : Range Filter Buy and Sell 5min by guikroth , VuManChu Cipher B + Divergences by vumanchu , and diferent exponential moving average .
The strategy - ( Longbit ) works on the basis of the price movement range filter , first a smooth average price range is calculated for the basis of the filter and multiplied by a specified amount by indicator Range Filter Buy and Sell 5min by guikroth , and some calculations working out divergences and convergences by indicator VuManChu Cipher B + Divergences by vumanchu . And diferent exponential moving averages for zones Bull / Bear trend for trend trading , and using take and diferent stop loss : algo , user or percentage .
Thus, using my strategy, we get the best entry point to open trades after confirming divergences
example in the picture
or
And when these trend signals are much stronger
example in the picture
Actual Version recommended used for BTCUSDC / BTCUSDT 4 hours time frame and used default settings and stop loss - algo , take profit 6 %
example in the picture
But it can also be used on all time frame with these settings: MaxMin3 Data Sampling period 6 Range Multiplier 2 and Take profit 2.3 % , stop loss algo
DISCLAIMER: This informational planning script / strategy is strictly for individual use and educational purposes only. This is not financial or investment advice. Investments are always made at your own risk and are based on your personal judgement. I am not responsible for any losses you may incur.
Привет, Трейдеры ! Вдохновленный индикатором Range Filter Buy and Sell 5min by guikroth , а именно работой и вычеслением диапазона фильтра движения цены . А также вдохновленный индикатором VuManChu Cipher B + Divergences by vumanchu, а именно дивергенций и конвергенций , я был вдохновлен создать эту стратегию
Эта тратегия - (Longbit) - это совокупность индикаторов : Range Filter Buy and Sell 5min by guikroth , VuManChu Cipher B + Divergences by vumanchu, и разние виды экспоненциальных средних .
Стратегия - (Longbit) работает на основе фильтра диапазона изменения цен, сначала рассчитывается гладкий средней диапазон цен для базы фильтра и умножается на оговоренную сумму по индикатору Range Filter Buy and Sell 5min by guikroth модифицированой версии , а также некоторые расчеты вычислений дивергенций и конвергенции по показателю индикатора VuManChu Cipher B+ Divergences by vumanchu. И различные экспоненциальные среднее и их зон для определения тенденции либо трендов для торговли по тренду , и с использованием стоп лоса : алго, пользовательский или процентный .
Таким образом, используя мою стратегию, мы получим лучшую точку для открытия сделок после подтверждения дивергенций или конвергенций
А когда эти сигналы по тренду они намного сильнее на рисунке , примеры на картинках выше
Рекомендуемую для 4-часового тм BTCUSDC/BTCUSDT , и работать с помощью algo stop loss , и take в 6 % с настройками по умолчанию , но можно также на использовать на всех тм с такой вот настройкой :
Данные МакМин3
Sampling period 6
Range Multiplier 2
Примеры на картинках выше
Предупреждаю : Эта стратегия информационного планирования предназначен исключительно для индивидуального пользования и образовательных целей. Это не финансовая или инвестиционная консультация. Инвестиции всегда осуществляются на собственном риске и основываются на вашем личном суждении. Я не отвечаю за потери, которые вы можете понести.

MY_TRENDThe MY_TREND strategy is designed to work with cryptocurrencies and stocks.
The optimal working timeframe is 1 - 4 hours.
The search for trading zones and main entry points is based on the Donchian channel using the author's filtering by pinning.
To avoid manipulations in the market, the algorithm monitors the level of the price relative to the global trend and thus filters out a large part of the false signals.
If the price fixes above the trend line, we expect an upward movement, and if it fixes below, we expect a downward movement.
In addition, in the settings it is possible to use additional trend entries, as well as aggressive trading.
To do this, in the area of action of the main trend, built on the basis of the Donchian channel, a local trend is formed at the moving average price of the asset.
--------------------------------------------
📗 Algorithm for selecting optimal parameters:
--------------------------------------------
1. Disable the use of takes and stops, and set up the setup (described below) so that the back test readings are positive and have growing dynamics.
Pay attention to the level of drawdown and the percentage of correct trades.
2. Enable the use of a stop line, and select the most optimal stop parameters so that the drawdown level on the back test is acceptable for you.
3. Enable the use of takes and select the most optimal take for your strategy.
4. Select the type of trade (described below) and make sure that the back test readings are acceptable to you.
5. By default, the strategy uses a trading commission of 0.04% (standard for crypto futures), but for stocks it should be set in accordance with the commissions of your broker.
-------------------------------------
💹 SETUP SETTINGS:
-------------------------------------
Setup_length - distance for calculating and evaluating volatility in the Donchian channel.
For an older timeframe, it is better to lower the value, otherwise we may get a delay in the reaction of the trend to the price movement.
Setup_mult - multiplier to smooth out the reaction of the trend in the Donchian channel.
For an older TF, it is better to increase the value in order to avoid false entry signals.
Selecting the type of trade:
BASED - gives trading signals only when the basic trend changes (trading without additional entry signals).
IN_TREND - gives BASED trading signals and additional signals on the underlying trend, using the ADD SMA as a local trend indicator.
AGRESSIVE - gives BASED trading signals and additional signals on the underlying trend, when the price falls below the ADD SMA local trend line.
ADD SMA length - SMA period to form a local trend within the underlying Donchian trend (values in the range of 3-9 should be used to get a fast response).
This setting is relevant for IN_TREND and AGRESSIVE trading types.
-------------------------------------
🟢 TAKE SETTINGS:
-------------------------------------
The strategy has 3 types of take:
ATR - take based on the instrument's volatility value (adjusted by a multiplier).
FIX - take, set as a percentage (set manually).
STDEV - take, based on the calculation of the standard deviation of the price (adjusted by a multiplier and a period).
-------------------------------------
⛔️ STOP SETTINGS:
-------------------------------------
The strategy has 3 types of stops:
ATR - stop based on the instrument's volatility value (adjustable by a multiplier).
FIX - stop specified in percentage (set manually).
TREND - the stop line is equal to the base trend line.
It is possible to turn on the stop line tightening to the level of the price of entry into a position, when the price passes the value of one standard deviation into profit.
-------------------------------------
💡 OTHER USEFUL FEATURES
-------------------------------------
✅ In the strategy, you can enable / disable the use of takes and stop lines.
✅ In the strategy, you can enable / disable the display of the base and local trend lines, and enable the background highlighting of the current trend.
✅ You can choose the direction of trading: long, short or any.
✅ Leverage can be set (x3 by default).
✅ The screen has a compact display of a table with the current strategy settings and the current state (position, takes, stop).
For the convenience of saving your settings, use the standard PrintScreen function.
✅ You can sign the strategy in the Notes field - this is convenient if you place several versions of the MY_TREND strategy on the chart with different settings (for different pairs or for different timeframes).
✅ You can choose the type of alerts - ALERT or BOT.
ALERT - tradingview pop-up trading alerts (you can configure them to be sent to e-mail or to the application).
BOT - trading commands following the Binance/Finandy syntax, designed to be sent to a trading bot using a webhook.
To use alerts, select "Only when the alert() function is called"
✅ 👉 In the strategy settings, each field has hints, to do this, hover over the ⓘ sign
💰 Be sure to follow the risk management when trading!
-------------------------------------
The MY_TREND strategy is private! You can get test access to it for 24 hours.
👉 In order to gain access or ask questions, write to me in private messages or at the contacts indicated in my signature.
-------------------------------------
========================================================================================================
Стратегия MY_TREND предназначена для работы с криптовалютами и акциями.
Оптимальный рабочий таймфрейм 1 - 4 часа.
Поиск торговых зон и основных точек входа производится на базе канала Donchian используя авторскую фильтрацию по закреплению.
Чтобы избежать манипуляций на рынке, алгоритм отслеживает уровень нахождения цены относительно глобального тренда и тем самым фильтрует немалую часть ложных сигналов.
При закреплении цены выше трендовой, мы ожидаем восходящее движение, а при закреплении ниже - нисходящее.
Кроме этого в настройках есть возможность использовать дополнительные входы по тренду, а также агрессивную торговлю.
Для этого в зоне действия основного тренда, построенного на базе канала Donchian, формируется локальный тренд по средней скользящей цены актива.
-----------------------------------------
📗 Алгоритм подбора оптимальных параметров:
-----------------------------------------
1. Отключите использование тейков и стопов, и настройте сетап (ниже подробно описано) так, чтобы показания бэк-теста были положительными и имели растущую динамику.
Обращайте внимание на уровень просадки и процент верных сделок.
2. Включите использование стоп-линии, и подберите наиболее оптимальные параметры стопа так, чтобы уровень просадки на бэк-тесте был для Вас приемлемым.
3. Включите использование тейков и подберите наиболее оптимальный тейк для Вашей стратегии.
4. Выберите тип торговли (ниже описано) и убедитесь в приемлемых для Вас показаниях бэк-теста.
5. По умолчанию в стратегии используется торговая комиссия 0,04% (стандартно для крипто-фьючерсов), но для акций её следует выставить в соответствии с комиссиями Вашего брокера.
-------------------------------------
💹 НАСТРОЙКА СЕТАПА:
-------------------------------------
Setup_length - дистанция для расчета и оценки волатильности в канале Donchian.
Для более старшего ТФ, значение лучше понижать, иначе мы можем получить запаздывание реакции тренда на движение цены.
Setup_mult - множитель, для сглаживания реакции тренда в канале Donchian.
Для более старшего ТФ, значение лучше повышать, чтобы избежать ложных сигналов на вход.
Выбор типа торговли:
BASED - даёт торговые сигналы только при смене базового тренда (торговля без дополнительных сигналов на вход).
IN_TREND - даёт торговые сигналы BASED и дополнительные сигналы по базовому тренду, используя ADD SMA как индикатор локального тренда.
AGRESSIVE - даёт торговые сигналы BASED и дополнительные сигналы по базовому тренду, при просадке цены ниже линии локального тренда ADD SMA.
ADD SMA length - Период SMA для формирования локального тренда внутри базового тренда Donchian (следует использовать значения в диапазоне 3-9, для получения быстрой реакции).
Данная настройка актуальна для типов торговли IN_TREND и AGRESSIVE.
-------------------------------------
🟢 НАСТРОЙКА ТЕЙКОВ:
-------------------------------------
Стратегия имеет 3 типа тейка:
ATR - тейк на базе значения волатильности инструмента (регулируется множителем).
FIX - тейк, заданный в процентах (задаётся вручную).
STDEV - тейк, на базе расчёта стандартного отклонения цены (регулируется множителем и периодом).
-------------------------------------
⛔️ НАСТРОЙКА СТОПА:
-------------------------------------
Стратегия имеет 3 типа стопа:
ATR - стоп на базе значения волатильности инструмента (регулируется множителем).
FIX - стоп, заданный в процентах (задаётся вручную).
TREND - стоп-линия равна базовой линии тренда.
Есть возможность включить подтяжку стоп-линии на уровень цены входа в позицию, при прохождении цены значения одного стандартного отклонения в профит.
-------------------------------------
💡 ПРОЧИЕ ПОЛЕЗНЫЕ ФУНКЦИИ
-------------------------------------
✅ В стратегии можно включить/отключить использование тейков и стоп-линии.
✅ В стратегии можно включить/отключить отображение линии базового и локального тренда, а включить фоновую подкраску текущего тренда.
✅ Можно выбрать направление торговли: лонг, шорт или любое.
✅ Можно установить кредитное торговое плечо (по умолчанию x3).
✅ На экране есть компактное отображение таблицы с текущими настройками стратегии и текущим состоянием (позиция, тейки, стоп).
Для удобства сохранения своих настроек - воспользуйтесь стандартной функцией PrintScreen.
✅ Вы можете подписать стратегию в поле Notes - это удобно, если Вы размещаете на графике несколько версий стратегии MY_TREND с разными настройками (для разных пар или для разных ТФ).
✅ Вы можете выбрать тип оповещений - ALERT или BOT.
ALERT - всплывающие торговые оповещения tradingview (можно настроить их отправку на e-mail или в приложение).
BOT - торговые команды с соблюдением синтаксиса Binance/Finandy, предназначенные для отправки их торговому боту с помощью webhook.
Для использования оповещений выбирайте "Только при вызове функции alert()"
✅ 👉 В настройках стратегии у каждого поля есть подсказки, для этого наведите курсор на знак ⓘ
💰 Обязательно соблюдайте риск-менеджмент при торговле!
-------------------------------------
Стратегия MY_TREND является закрытой! Вы можете получить к ней тестовый доступ на 24 часа.
👉 Для того, чтобы получить доступ или задать вопросы пишите мне в личные сообщения или по контактам, указанным в моей подписи.
-------------------------------------

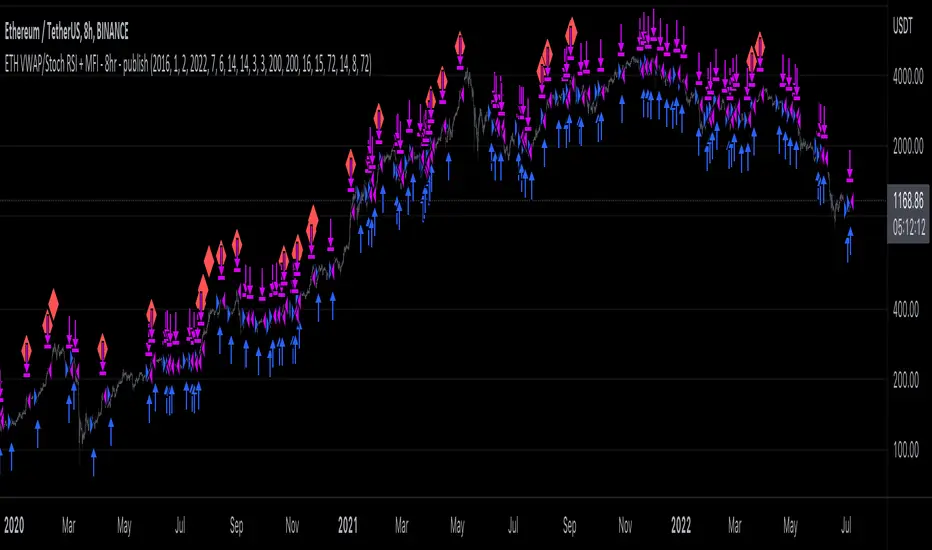
ETH long bot - 8hrThis is a high-latency algorithm, safely running on the Ethereum 8hr chart where it can execute trades on a multi-day timeframe, making it easy to enter and exit large positions and without incurring excessive commission fees.
As a long bot, this script should be ran in markets that are trending upwards. Nonetheless, the operator can be at ease knowing that the script can safely run autonomously during these extended periods. It is shown here performing full-time over a 46 month period, from January 2019 through October 2021, steadily increasing the available capital despite the asset's fluctuations. While the buy and hold return over this time was 714%, the algorithm produced a net profit 4,060%, outperforming the market by over 5.5x. This equates to a 40x return on investment in 4 years.
The strategy behind this algorithm is to always capitalize on significant jumps in the market. This is accomplished by using a simple combination of RSIs:
- One RSI uses VWAP as a source, which is primarily responsible for entering growth trends whenever they begin
- The other is a Stochastic RSI , which is primarily responsible for identifying exhausted periods of growth
These calculations are calibrated so that the bot can jump in and out of trades to improve its position when there isn't significant price action one way or the other, but is then able to remain in positions during uptrends that are backed by volume to achieve maximum gains. This strategy is reflected by the fact that while profitable trades are almost 3 times larger than losing trades, on average, they also last for an average of 6 days, whereas losing trades usually last about 2.
[Sextan] PINEv5 Sextans Backtest Framework V3.3Level: 5
Background
In order to celebrate the breakthrough of 4000 followers of my account, I decided to release the Sextan backtesting framework for free use to help more quantitative traders quickly evaluate any technical indicators.
The version released this time is based on the algorithm framework optimization of the old version, and integrates the new feature in Pine V5: Bar Magnifier. This new feature to make Sextan strategy backtesting even more accurate. FYI.
www.tradingview.com
Backtesting of technical indicators and strategies is the most common way to understand a quantitative strategy. However, the complicated configuration and adaptation work of backtesting many quantitative tools makes many traders who do not understand the code daunted. Moreover, although I have written a lot of strategies,
However, I am still not very satisfied with the backtest configuration and writing efficiency. Therefore, I have been thinking about how to build a backtesting framework that can quickly and easily evaluate the backtesting performance of any indicator with a "long/short entry" indicator, that is, a "simple backtesting tool for dummies". The performance requirements should be stable, and the operation should be simple and convenient. It is best to "copy", "paste", and "a few mouse clicks" to complete the quick backtest and evaluation of a new indicator.
Luckily, I recently realized that TradingView provides an "Indicator on Indicator" feature, which is the perfect foundation for doing "hot swap" backtesting. My basic idea is to use a two-layer design. The first layer is the technical indicator signal source that needs to be embedded, which is only used to provide buy and sell signals of custom strategies; the second layer is the trading system, which is used to receive the output signals of the first layer, and filter the signals according to the agreed specifications. , Take Profit, Stop Loss, draw buy and sell signals and cost lines, define and send custom buy and sell alert messages to mobile phones, social software or trading interfaces. In general, this two-layer design is a flexible combination of "fixed and flexiable", which can meet the needs of most traders to quickly evaluate the performance of a certain technical indicator. The first layer here is flexible. Users can insert their own strategy codes according to my template, and they can draw buy and sell signals and output them to the second layer. The second layer is fixed, and the overall framework is solidified to ensure the stability and unity of the trading system. It is convenient to compare different or similar strategies under the same conditions. Finally, all trading signals are drawn on the chart, and the output strategy returns. test report.
The main function:
The first layer: "{Sextan} Your Indicator Source", the script provides a template for personalized strategy input, and the signal and definition interfaces ensure full compatibility with the second layer. Backtesting is performed stably in the backtesting framework of the layer. The first layer of this script is also relatively simple: enter your script in the highlighted custom script area, and after ensuring the final buy and sell signals long = bool condition, short = bool condition, the design of the first layer is considered complete. Input it into the PINE script editor of TradingView, save it and add it to the chart, you can see the pulse sequence in yellow (buy) and purple (sell) on the sub-picture, corresponding to the main picture, you can subjectively judge that the quality of the trading point of the strategy is good Bad.
Pine v4 your indicator template:
Pine v5 your indicator template:
Pine v4 your MTF indicator template:
Pine v5 your MTF indicator template:
The second layer: "{Sextan} PINEv4 Sextans Backtest Framework". This script is the standardized trading system strategy execution and alarm, used to generate the final report of the strategy backtest and some key indicators that I have customized that I find useful, such as: winning rate , Odds, Winning Surface, Kelly Ratio, Take Profit and Stop Loss Thresholds, Trading Frequency, etc. are evaluated according to the Kelly formula. To use the second layer, first load it into the TrainingView chart, no markers will appear on the chart, since you have not specified any strategy source signals, click on the gear-shaped setting next to the "{Sextan} PINEv4 Sextans BTFW" header button, you can open the backtest settings, the first item is to select your custom strategy source. Because we have added the strategy source to the chart in the previous step, you can easily find an option "{Sextan} Your Indicator Source: Signal" at the bottom of the list, this is the strategy source input we need, select and confirm , you can see various markers on the main graph, and quickly generate a backtesting profit graph and a list of backtesting reports. You can generate files and download the backtesting reports locally. You can also click the gear on the backtest chart interface to customize some conditions of the backtest, including: initial capital amount, currency type, percentage of each order placed, amount of pyramid additions, commission fees, slippage, etc. configuration. Note: The configuration in the interface dialog overrides the same configuration implemented by the code in the backtest script.
How to output charts:
The first layer: "{Sextan} Your Indicator Source", the output of this script is the pulse value of yellow and purple, yellow +1 means buy, purple -1 means sell.
The second layer: PINEv4 Sextans Backtest Framework". The output of this script is a bit complicated. After all, it is the entire trading system with a lot of information:
1. Blue and red arrows. The blue upward arrow indicates long position, the red downward arrow indicates short position, and the horizontal bar at the end of the purple arrow indicates take profit or stop loss exit.
2. Red and green lines. This is the holding cost line of the strategy, green represents the cost of holding a long position, and red represents the cost of holding a short position. The cost line is a continuous solid line and the price action is relatively close.
3. Green and yellow long take profit and stop loss area and green and yellow long take profit and stop loss fork. Once a long position is held, there is a conditional order for take profit and stop loss. The green horizontal line is the long take profit ratio line, and the yellow is the long stop loss ratio line; the green cross indicates the long take profit price, and the yellow cross indicates the long position. Stop loss price. It's worth noting that the prongs and wires don't necessarily go together. Because of the optimization of the algorithm, for a strong market, the take profit will occur after breaking the take profit line, and the profit will not be taken until the price falls.
4. The purple and red short take profit and stop loss area and the purple red short stop loss fork. Once a short position is held, there will be a take profit and stop loss conditional order, the red is the short take profit ratio line, and the purple is the short stop loss ratio line; the red cross indicates the short take profit price, and the purple cross indicates the short stop loss price.
5. In addition to the above signs, there are also text and numbers indicating the profit and loss values of long and short positions. "L" means long; "S" means short; "XL" means close long; "XS" means close short.
TradingView Strategy Tester Panel:
The overview graph is an intuitive graph that plots the blue (gain) and red (loss) curves of all backtest periods together, and notes: the absolute value and percentage of net profit, the number of all closed positions, the winning percentage, the profit factor, The maximum trading loss, the absolute value and ratio of the average trading profit and loss, and the average number of K-lines held in all trades.
Another is the performance summary. This is to display all long and short statistical indicators of backtesting in the form of a list, such as: net profit, gross profit, Sharpe ratio, maximum position, commission, times of profit and loss, etc.
Finally, the transaction list is a table indexed by the transaction serial number, showing the signal direction, date and time, price, profit and loss, accumulated profit and loss, maximum transaction profit, transaction loss and other values.
Remarks
Free to use but closed source.

AlphaTrend For ProfitViewThis strategy is based on the AlphaTrend indicator by KivancOzbilgic A full description of this algorithm functionality may be found by clicking the linked image above.
Changes and/or additions:
It is now a backtestable strategy
Updated alert trigger logic
Easy integration with ProfitView to use this algorithm for automated trading
When you create an alert, and you are using ProfitView, select " alert() function calls only " as the condition option. If you would rather set your own custom alert message, select " Order fills only " instead.
There is a selectable setting in the options to trigger alert() function calls immediately, that you may use to see what text it will send.

Crypto Spot Market Bot | BacktestHello Friends.
This script is only for long positions.
How does the algorithm work ?
The Relative Momentum Index
Relative Strength İndex
Average Directional Movement İndex
Momentum
When rsi and adx produce signals in the same direction, the rmi indicator confirms the signal. After the Confirmed Signal, the buy-side transaction is entered , the closed according to the % of profit taking and stoploss specified on the algorithm in the entered transaction.
In the spot market, it is possible to make money even in a down trend
All shared charts run within a 1-hour time frame.
Note : The shared backtest results have been shared as of 9/9/2021 by calculating 50% balance and 2 pyramiding methods in an account of 1000 dollars. Keep in mind that this algorithm will want to try to average down in possible worst-case scenarios. 2% - %3take profit levels will provide consecutive gains in the spot market.
How should the adjustments be made?
Value variables should be made according to formula a and formula b values and backtest results. You can increase the frequency of transactions by lowering the adx and rsi values.
Overview :

v1 Automatic Trading Bot | BacktestHello Friends.
We have been working on this script for a long time. Briefly, our scenario works as follows.
This test data includes results as of January 1, 2022 using a balance of $1000 and 10%.
WORKİNG LOGİC :
Relative Strength Index
Directional Movement Index
Relative Momentum Index
Indicators are Blended.
1 conditions are met in the overbought and oversold zone.
If the Directional Movement Index Signal is in the same direction, If all signals are in the same decision, it will be position.
We can set the take profit and stop loss levels on the algorithm as % over the entry price.
HOW TO ADJUST :
Formula a and formula b values are adjusted by increments or decrements of 1 each. these adjustments should be changed according to the time frame and chart layout.
You do not need to intervene in overbought and oversold zones. The Best Values were thus deemed appropriate.
If you still want to intervene, you need to know; When you change the overbought and oversold values, the entry time and risk will increase.
Together with the backtest script we are able to adjust the algorithm to all timeframes.
For example, while these settings are ideal for 5 minutes, it is necessary to change the strenght and formul values for a 15-minute period. This provides a user-specific adjustable strategy.
There are 6 different triggers in total on the alarm version.
Enter a long position.
Long position take profit
Long position stop loss
Enter a Short position.
Short position take profit
Short position stop loss
Currently, one platform is also connected to the binance exchange via an API .
The maximum leverage is set to 5 and a maximum of 5 trades are ordered to enter.
I will post the alarm version soon.
Good Luck Everyone !

Cava Signals Backtesting/VisualizerPLEASE READ THE DESCRIPTION CAREFULLY
Trying this again, as it seems I keep violating the rules unintentionally. Moderator, please forgive me as I try to make this right.
This backtesting/visualizer script was created for me to get a visual idea of the Cava Signals indicator throughout its development time and continuous optimization.
This script is to be used on the 30-minute timeframe on supported markets, and whether I can only publish strategies on regular candles, the indicator is meant to trigger on heikin ashi candles.I understand backtesting on non-regular candles produces unrealistic results, but I emphasize that this script is more for visualization purposes rather than accurate $ amounts from the trades. The signals are used along with a dedicated bot configuration, so part of the strategy is not managed by the script, but by the bot's config.
Some behind the scenes on what we are looking at:
a combination of ema and sma crosses on different time frames (5m, 15m, 30m, 60m and 90m) - we call this the wave trend
a combination of stochastic rsi on different time frames (10m, 30m)
a combination of schaff trend cycles on different time frames (5m, 20m and 30m)
a combination of money flow index on different time frames (10m and 30m)
volume information for each supported market/pair
and a couple of other info particular to each pair
With the above combination of data points, we try to optimize our strategy for an entry, for dca'ing down in case the coin goes down as well as dca'ing up to maximize profit when a coin is going up, take profit levels when we recognize a good time to do so, and of course, a closing level. I would like to emphasize the *visualization* purpose of this script in recognizing lows, highs, and market structure to identify the important levels to signal - this script is NOT to be used for accurate backtesting, but for an idea of the overall performance of when signals are triggered.
Let me try to explain the workflow and icons you see on the chart:
The colored circles on the bottom of the chart are all buy signals; each color corresponds to a particular buy signal, we have a combination of 9 possible situations that would trigger a buy signal. Some would trigger a buy signal only in combination with other buy signals or other indicators within the script. we also display a green upwards arrow below bars when a buy signal is triggered.
The colored arrows pointing down on the top of the chart are close signals. We have a combination of 5 closing criteria each color corresponds to one, just like the buy signals do. We only close a trade in profit. If not in profit, we will look to DCA down.
DCA signals are shown by the green flag above bars. they are signals to DCA up or down depending on the trade being negative or positive. DCA'ing up or down is also managed by the bot's configuration for limits on when to accept the signal.
Take Profit levels are shown by the green diamond above bars and work in conjunction with the bot's config on when to take the signal if at all and other take profit levels. Usually, when we hit the first take profit level we move our stop loss to entry via the bot's take profit safety feature. You can see this call with the close entry named TPS .
The black bars you may see on the chart is to illustrate when the market is extended based on a particular strategy. During this period we will not trigger a buy signal unless there is a huge spike in positive volume .
The green number below the bars is the total positive delta volume on the buy candles.
On the table on the right upper corner, we show some information on the market and performance of the backtesting - for visualization purposes only!
Currently, the script is tailored to work with the following markets/pairs:
Binance Spot: ADA, ALGO, ATOM, AVAX, BNB, BTC , DOT, ETH, LINK, LUNA, MATIC, SOL, VET, XRP, XTZ
Binance Futures: BTC , ETH, ADA, ALGO, ATOM, BNB, COMP, DOT, ENJ , LINK, OCEAN, OMG, SOL, VET, XMR, XRP, XTZ, AVAX, AAVE, DOGE, LTC, LUNA, MKR , NEAR, ONT, RUNE, SUSHI, LTC, XLM , COMP, ONT, THETA, FTM , EGLD , WAVES, ONE, HTN , CHZ , HOT, MANA, CRV , RVN, BAT, ANKR, 1INCH, ALICE, ATA , AXS , CHR , COTI, NKN , RAY, REN, SRM , SXP , TLM
ByBit Inverse Perpetual: BTCUSD , ETHUSD
ByBit Futures: AAVE, ADA, ALGO, AVAX, AXS , BNB, BTC , DOT, ETH, LINK, LTC, MATIC, SOL, SUSHI, UNI , XEM, XRP, XTZ
The chosen pairs are subject to change based on the best-performing assets we are constantly analyzing.
I hope this helps to understand the script, its purpose and ideas. I hope this satisfies the community rules - it was not my intention to break them - if there's anything on the above or the script that still violates the guidelines, please let me know and accept my apologies in advance.
If anyone would like to know more, let me know in the comment section.
Thank you!

alGROWithm Premium - Strategy TesterThe alGROWithm Strategy Tester is a supplement to the original alGROWithm indicator.
Use this strategy to do your own back testing and find the best settings that work for your asset of choice.
█ WHY THIS IS IMPORTANT
Different assets require different settings for optimal results. This strategy script will allow you back test different settings for alGROWithm in order to analyze key metrics such as win rate and P/L. TradingView functionality also enables you to view a high level performance summary and even see every single individual trade made by the algo.
█ BEST PRACTICES
Depending on the asset you are testing, it is very important to update the settings as needed. For example, if you are back testing on US30, you will likely need to increase the starting capital. For other assets, you may also need to change the order size to use the Contracts option.
It is important to decide for yourself which back testing parameter you will weigh more heavily in terms of importance. For example, a day trader may want to use a setting that maximizes win rate rather than profit % since we are humans and not computers. Further, it is highly recommended to utilize all of the rich features that TradingView provides with regards to back testing. For example, using the List of Trades tab, go back to find a failed trade and analyze the trade to see if you actually would have taken it in the moment.
After finding the best sensitivity for your asset, it is important to set that sensitivity value on the non-strategy version of alGROWithm for usage. Changing settings on this version will not carry over to the non-strategy version.
█ DEFAULT SETTINGS
We have set the following default settings on the strategy:
Starting capital: $100k
Order size: 30% of equity
Sell 1/5 of position every Take Profit level

Algonize Pivot Strategy (APS)This study is based on several Price Action parameters of :-
• Pivot Points,
• Higher High and Lower Lows,
• High Low Index ,
• Support and Resistance.
► How To Use This Strategy?
This is a pure scalping strategy and it is advised to use this only with algo trading systems. Due to high trade frequency.
► This Strategy has inbuilt custom time frame backtester, which enables you to test for performance between any date or check for a single day.
► To Create Alerts for algo trading in this strategy simply Check "Activate Algo" from Settings then Create new alert , select your strategy in condition box, and now scroll down to message box and write
{{strategy.order.comment}}
That's it , Just Click on Create Alert Button
Backtest Values Used:-
Initial Capital : 1000000
Order Size (Lots) : 1 (Contract) Lots
Pyramiding : 0 orders
Commission : 0.003%
Sharpe Ratio : 1.741
Profit Factor : 1.174
Test Yourself and give feedback.
PM us to obtain access.

Best strategy for TradingView (fake)Hello everyone! I want to show you this strategy so you don't fall for the tricks of scammers. On TradingView, you can write an algorithm (probably more than one) that will show any profit you want: from 1% to 100,000% in one year (maybe more)! This can be done, for example, using the built-in linebreak () function and several conditions for opening long and short.
I am sure that sometimes scammers show up on TradingView showing their incredible strategies. Will a smart person sell a profitable quick strategy? When a lot of people start using the quick strategy, it stops working. Therefore, no smart person would sell you a quick strategy. It is acceptable to sell slow strategies: several transactions per month - this does not greatly affect the market.
So, don't fall for the tricks of scammers, write quick strategies yourself.
About this strategy, I can say that the linebreak () function does not work correctly in it. Accordingly, the lines are not drawn correctly on the chart. They are drawn in such a way as to show the maximum profit. I watched this algorithm on a 1m timeframe - no lines are drawn in real time. This is a fake!
T3 ICL MACD STRATEGY
Backtested manually and received approx 60% winrate. Tradingview strategy tester is skewed because this program does not specify when to sell at profit target or at a stop loss.
Uses 1 min for entry and a longer time frame for confirmation (5,10,15, etc..) (Not sure what the yellow arrows are in the picture but they can be ignored)
Ideal Long Entry - The algo uses T3 moving average (T3) and the Ichimoku Conversion Line (ICL) to determine when to enter a long or short position. In this case we are going to showcase what causes the algo to alert long. It first checks to see if the the ICL is greater than T3. Once that condition is met T3 must be green in order to enter long and finally the last closing price has to be greater than the ICL. You can use the MACD to further verify a long trend as well!
Ideal Short Entry - The algo uses T3 moving average (T3) and the Ichimoku Conversion Line (ICL) to determine when to enter a long or short position. In this case we are going to showcase what causes the algo to alert short. It first checks to see if the the ICL is less than T3. Once that condition is met T3 must be red in order to enter short and finally the last closing price has to be less than the ICL. You can use the MACD to further verify a long trend as well!

KundaliniThe Kundalini is a technical indicator. Based on algorithm calculations, this indicator extrapolates the previous price for the next bar. Plus addition Multi time frame ATR volatility Reading environment for higher conditions
Here is how Dominator is calculated:
1. The study estimates the price projected for the next bar. The estimated price is based on the algorithm method.
2. The study extrapolates this value to find a projected price change for the next bar.
The resulting extrapolated value is shown as a histogram on a lower subgraph. By default, sections of the histogram where the extrapolated value is increasing are shown in green; sections corresponding to the decreasing value are shown in red.
Note: Value projection is purely mathematical as all calculations are based on algorithm averaging of previous values.
Overlay True
The strategy includes 3 different adjustable levels for the ladder , plus automatic adjustable stop loss and takes profit calculated from your average entry price after each ladder adds.
Adjustable BAcktest Window.
1 long signals
3 ladder long add signals
1 short signals
3 ladder short add signals
1 dynamic stop calculated from your average entry price
1 dynamic take profit calculated from your average entry price
Please Private Msg me if you like more info about the script Full pdf available or if you need access to it
thx for your time and support
Dominator Ladder StrategyThe Dominator is a technical indicator. Based on algorithm calculations, this indicator extrapolates the previous price for the next bar.
Here is how Dominator is calculated:
1. The study estimates the price projected for the next bar. The estimated price is based on the algorithm method.
2. The study extrapolates this value to find a projected price change for the next bar.
The resulting extrapolated value is shown as a histogram on a lower subgraph. By default, sections of the histogram where the extrapolated value is increasing are shown in green; sections corresponding to the decreasing value are shown in red.
Note: Value projection is purely mathematical as all calculations are based on algorithm averaging of previous values.
Note: lower subgraph it's just for you to understand and view the waves during the Strategy process Study it's not included in this strategy.
Overlay True
The strategy includes 3 different adjustable levels for the ladder , plus automatic adjustable stop loss and takes profit calculated from your average entry price after each ladder adds.
Adjustable BAcktest Window.
1 long signals
3 ladder long add signals
1 short signals
3 ladder short add signals
1 dynamic stop calculated from your average entry price
1 dynamic take profit calculated from your average entry price

Detrended Price Oscillator StrategyTHIS IS THE STRATEGY VERSION
What is DPO?
A detrended price oscillator is an oscillator that strips out price trends in an effort to estimate the length of price cycles from peak to peak or trough to trough. Unlike other oscillators, such as the stochastic or moving average convergence divergence (MACD), the DPO is not a momentum indicator. It highlights peaks and troughs in price, which are used to estimate buy and sell points in line with the historical cycle.
(From Investopedia )
Indicator features:
Responds faster than the original code.
Added alternative smoothing algorithms. Defaults to Ehler's Optimum Elliptic filter instead of the orginal SMA
IPOCS - can start printing out data at day 1 instead of waiting for 14 or 20 bars
Dynamic colors
Auto timeframe detection to adjust period/length
How to use:
Buy above zero
Sell below zero
Who is it for?
Long term investors - this is the perfect indicator for those who buy and hold

CLI : micro variations strategyDisclaimer :
This script is exclusively reserved to business customers.
There's no free trial.
For any request, drop us a private message.
_____________________________________________________________
Hello TV community,
Let us present our internal script strategy :
The core algorithm focuses on micro-variations (μ.var feature) calculations.
It has been developed in order to be timeframe independent : as a consequence, μ.var feature will keep a similar value scale amongst timeframes.
Preventing from any lags, the core algorithm detects any minimal and to be considered trend change (signal feature).
It's definitely a great tool for scalpers due to its core feature (micro-variations focused).
Sincerely,
SECURIX
________________________
Risk Warning : The value of your investments can go down as well as up, so you could get back less than you invested. Past performance is no guarantee of future returns.

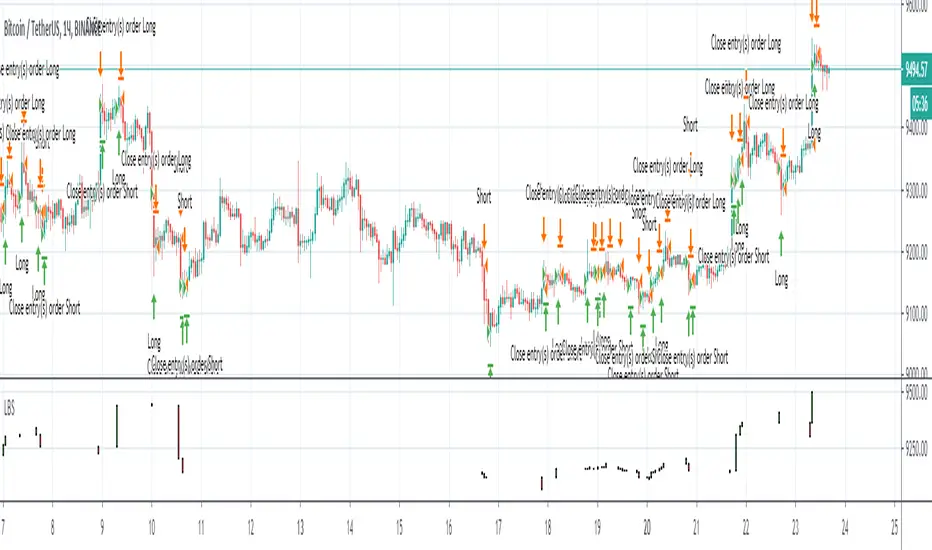
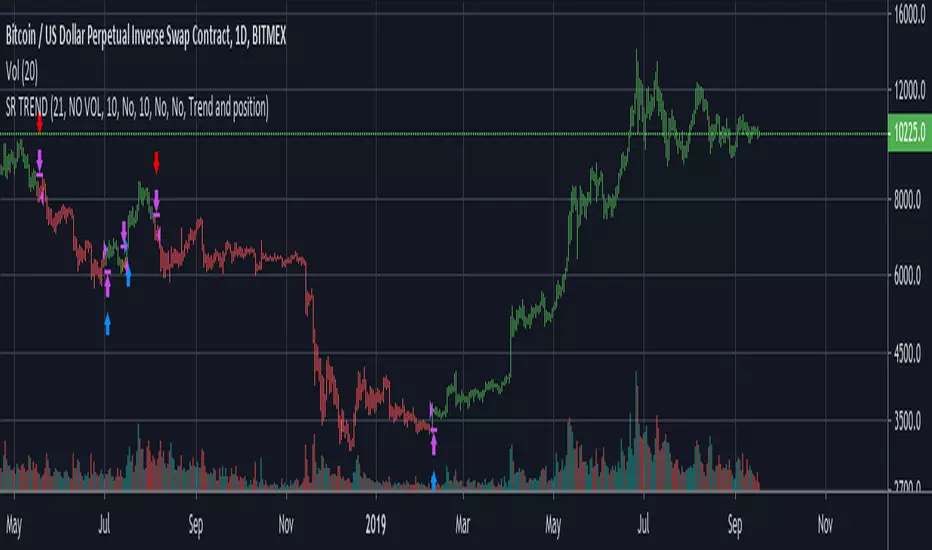
Trend SR based strategyIt is a logical continuation of my Trend SR based indicator
Algo of strategy is next
1)Detect SR levels
2)Calculate separate channels for SR made by highs and lows
3)it takes position if the current SR is breaking and close price is not in opposite channel zone
4)It closes position if prise leave current channel zone or as an option (stoploss) if SR is breaking in an opposite direction
-uses //@version=4
-no volume needed for detecting SR breaking and entering a long position
-volume confirmation of SR breaking may be used in the option section
-volume has an option to use smoothing with MA: SMA, AHMA, VIDYA
-volume has option to use volume pump as confirmation of SR breaking (simple dev function)
-stoploss as option
-uses barstate.isconfirmed (returns true if the script is calculating the last (closing) update of the current bar) for entering position on current bar close
-as an option, all or only current SR levels detected by algo can be plotted
-option to plot SR as a channel - as FILTERED whole SR history, in a long or short position it plots only stoploss level and entering opposite position level, in no position it plots long and short entering levels
It works well on 1D
For using on 4h or lower timeframes - Volume confirmation with VIDYA or AHMA may give better results
For better work especially on LTF algo needs better detection of highs and lows, now it uses fractal filter of last bars
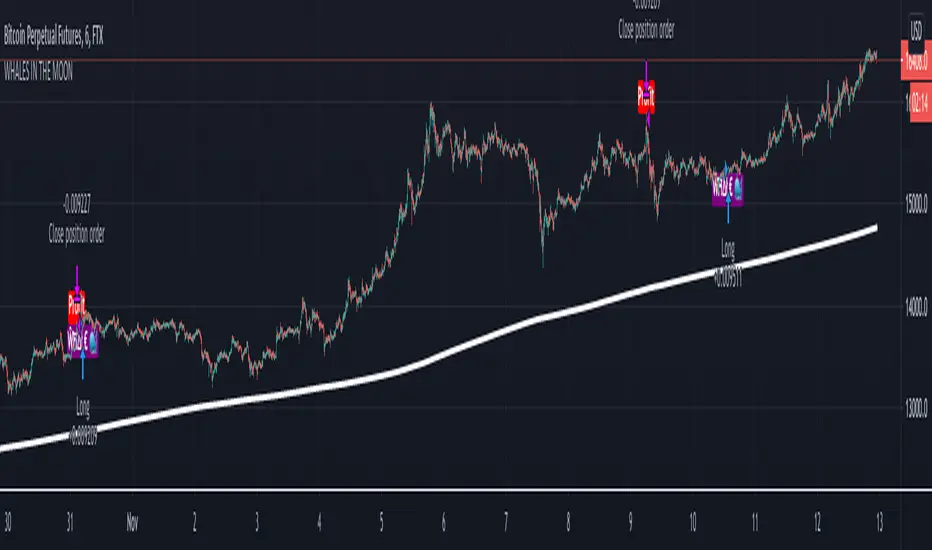
Dompeet Pompeet (Breakout bot)Dompeet Pompeet is my first attempt at a viable swingtrading algo.
It uses volatility and some trend analysis to enter trade when the market is about to breakout or break down. Having a trailing stop locks in profits and prevents runaway losses for low drawdown and 2:1 profit factor.
Settings to use:
BTCUSD or XBTUSD
4hr Timeframe or 2hr or 1hr (not shorter)
Bars window: 13, 16 or 20 bars
Moving average settings: 100/10 EMA to confirm trend
Trade the Trend - check on to only take trades long in a confirmed uptrend (vice versa short), otherwise it will attempt to buy and sell counter trend, which increases profits but also increases loss rate.
Trailing stop, values from 2-5% give the best results.
Take with a pinch of salt, there are some bugs in pine script which are difficult to track down but overall I'm pleased with the idea.

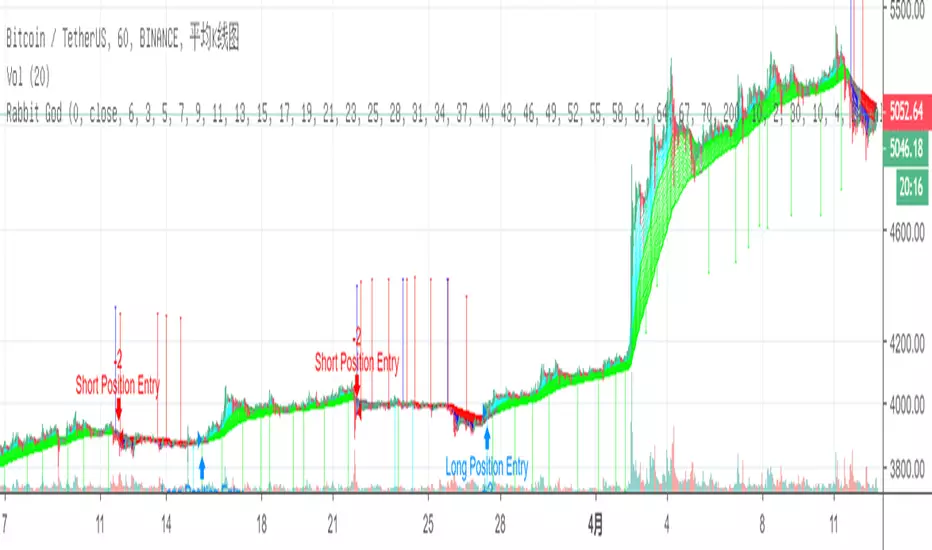
Trend tracking strategy of proprietary traders-RabbitThis is my latest strategy integration. It is a combination of trend tracking strategy and visualization trend. I believe it will bring you a clear trend discrimination and relatively reliable trading signal hints.
(Note: This strategy parameter has special parameter debugging and Optimization for BTC1h/BIANACE Heikin-ashi chart. It works best here. Other trade pairs or parameter versions of investment targets will be published specially if necessary.)
Statement of strategy concept:
The concept of strategy is trend tracking. The formation and continuation of trend is the product of speculation market for thousands of years. There are various strategies including CTA trend strategy, shock regression strategy, grid strategy, Martin strategy, Alpha strategy and so on. These strategies have their own merits just like different schools of Chinese knight-errant. Choose one, a master is not able to do hundreds of tricks, but to practice one trick thousands of times.
Every strategy has its own right and wrong. Trading is not violence, but a process of advancing, retreating, and making profits steadily. Therefore, the use of trend tracking strategy must overcome greed in human nature, profit and loss homology, dare to bear the shock of withdrawal in order to make a big profit when the real trend arrives. (Of course, this strategy has largely avoided filtering shocks, which will be explained later.)
Policy-building instructions:
Any trend tracking strategy can produce good results when there is a trend, so judging whether a trend strategy is good or bad depends on its withdrawal performance when it is shaking. This CTA trend tracking strategy uses Kauffman adaptive algorithm, fractal adaptive dimension, self-research algorithm and other tools, and has largely avoided filtering the signal in the shock without delay to follow the trend.
New version of the note:
The latest version adds the trend drawing of negativity, which can clearly distinguish the rising or falling or oscillating trend. However, the algorithm of strategy signal has no direct relationship with trend color. Trend color helps you to distinguish trend, and point signal helps you to refer to trade. This strategy is only a simple trading signal, risk control, warehouse management also need manual operation.
(Note: This strategy parameter has special parameter debugging and Optimization for BTC1h/BIANACE Heikin-ashi chart. It works best here. Other trade pairs or parameter versions of investment targets will be published specially if necessary.)
Good luck to all of you and a smooth deal.~

Trend tracking strategy of proprietary traders-RabbitThis is my latest strategy integration. It is a combination of trend tracking strategy and visualization trend. I believe it will bring you a clear trend discrimination and relatively reliable trading signal hints.
(Note: This strategy parameter has special parameter debugging and Optimization for BTC1h/BIANACE Heikin-ashi chart. It works best here. Other trade pairs or parameter versions of investment targets will be published specially if necessary.)
Statement of strategy concept:
The concept of strategy is trend tracking. The formation and continuation of trend is the product of speculation market for thousands of years. There are various strategies including CTA trend strategy, shock regression strategy, grid strategy, Martin strategy, Alpha strategy and so on. These strategies have their own merits just like different schools of Chinese knight-errant. Choose one, a master is not able to do hundreds of tricks, but to practice one trick thousands of times.
Every strategy has its own right and wrong. Trading is not violence, but a process of advancing, retreating, and making profits steadily. Therefore, the use of trend tracking strategy must overcome greed in human nature, profit and loss homology, dare to bear the shock of withdrawal in order to make a big profit when the real trend arrives. (Of course, this strategy has largely avoided filtering shocks, which will be explained later.)
Policy-building instructions:
Any trend tracking strategy can produce good results when there is a trend, so judging whether a trend strategy is good or bad depends on its withdrawal performance when it is shaking. This CTA trend tracking strategy uses Kauffman adaptive algorithm, fractal adaptive dimension, self-research algorithm and other tools, and has largely avoided filtering the signal in the shock without delay to follow the trend.
Additional notes for the new version:
The latest integrated version has increased the visualization of trends. It can clearly distinguish the trend of ups and downs or consolidation shocks based on chart color. However, trading signals are not calculated according to color changes, but the visualization helps you identify trends and signals help you to refer to sales.
This is only a simple trading signal strategy, and the other warehouse management and risk control need manual completion operation.
(Note: This strategy parameter has special parameter debugging and Optimization for BTC1h/BIANACE Heikin-ashi chart. It works best here. Other trade pairs or parameter versions of investment targets will be published specially if necessary.)
Good luck to all of you and a smooth deal.~
Readjusting Alpha (RA-1)The basis for this algorithm is an EMA 50/200 crossover protocol with one significant difference: it readjusts (or "learns") whether the original EMA crossover strategy is profitable based on its past performance and flips the conditions accordingly. The result is improved performance on relatively all timeframes in all statistical categories. There are options for long- and short-only trigger conditions. This algorithm is by invite only. If you have any questions about the algorithm, feel free to contact me.
Happy trades,
Sim
