[FXAN] 71 Cygni Algorithm (Scalping)⚜️ FXAN CYGNI INDICATORS ORIGINALITY
Originality comes from proprietary formula we use to measure the relationship between Volume and Price Volatility in relation to overall current market positioning in developing Volume Profile and multiple custom period Volume Profiles. We combine that with our own approach to measure price velocity in correlation to average daily/weekly/monthly ranges of the given market.
The relationship between current volume and price volatility gives us information about how much the volume that is currently coming into the market affects the price movement (volatility) and which side is more dominant/involved in the market (Buyers/Sellers). We call this the "Volume Impact" factor.
This information is then compared in relation to the overall current market positioning in developing Volume Profile and Multiple custom period Volume Profiles. We have created a rating system based on current price positioning in relation to the Volume Profile. Volume profile consists of different volume nodes, high volume nodes where we consider market interest to be high (a lot of transactions - High Volume) and low volume nodes where we consider market interest to be low (not a lot of transactions - Low Volume). We call this the current "Market Interest" factor.
We combine this information with our own approach to measure price velocity in correlation to the higher-timeframe price ranges. Calculation is done by measuring current ranges of market movement in correlation to average daily/weekly/monthly ranges. We call this "Price Velocity" factor.
This approach was applied to develop key components of our Tradingview Indicators, we've simplified some of the calculations and made them easy to use by programming them to display buying/selling volume pressure with colors.
In addition to our own proprietary formulas and criterias to measure volume impact on price, we've also used an array of indicators that measure the percentage change in volume over custom specified periods of time, including custom period ranged Volume Profile, Developing VA, Accumulation/Distribution (A/D Line), Volume Rate of Change (VROC), Volume Price Trend (VPT) - all of them with of course fine-tuned settings to fit the purpose in the overall calculation.
Reasons for multiple indicator use:
Custom period ranged Volume Profiles: To determine current interest of market participants. Used for "Market Interest"
Developing VA: To determine current fair price of the market (value area). Used for "Market Interest".
Accumulation/Distribution (A/D Line): Helping to gauge the strength of buying and selling pressure. Used for "Volume Impact"
Volume Rate of Change (VROC): To give us information about percentage change in volume. Used for "Volume Impact"
Volume Price Trend (VPT): To help identify potential trends. Used for "Volume Impact".
Average True Range (ATR): Used for measuring volatility. Used for "Volume Impact" and "Price Velocity".
Average Daily Range (ADR): Used for measuring average market price movement. Used for "Price Velocity".
How it all works together:
"Volume Impact" factor tells us the influence of incoming market volume on price movement. This information alongside the overall market positioning information derived from "Market Interest" factor combined with information about speed and direction relative to higher-timeframe price ranges frin "Price Velocity.
This is the basis of our proprietary developed Volume Dynamics analysis approach
"Volume Impact" x "Market Interest" x "Price Velocity"
Combining this factors together gives a good overall understanding of which side is currently more involved in the market to gauge the direction ("Volume Impact"), where the market is currently positioned to gauge the context ("Market Interest") and what the current market's momentum to improve the timing of our trades ("Price Velocity"). This increases our probabilities for successful trades, executed with good timing.
To simplify - our indicators will always analyze the volume behind every price movement and rate those movements based on the relationship between movement distance and volume behind it through an array of criterias and rate them.
Colors displayed by the indicators will be a result of that, suggesting which side of the market (Buyers or sellers) is currently more involved in the market, aiming to increase the probabilities for profitable trades. With the help of our indicators you have deep volume analysis behind price movements done without looking at anything else then indicator components.
🔷 OVERVIEW
Cygni 71 Algorithm is a TradingView indicator designed for short-term trading (scalping) and enhancing the precision of your entries/exits based on a higher timeframe market context. It analyzes the underlying volume behind market movements and colors the candles with the help of the Heiken-Ashi methodology to provide a clearer perspective on the market's potential direction and intentions.
🔷 KEY FEATURES
▊ Candle Coloring
▊ Upper Colored Bar
▊ Lower Colored Bar
🔷 HOW DOES IT WORK?
□ Candles will color in reference to the Heiken ashi "average bar" methodology, which uses a modified formula based on two-period averages. This way, you can observe the normal candlesticks with less noise as colors will suggest the most likely direction where the market might be heading.
□ Upper Colored Bar analyzes daily volume dynamics in the market's price action by referencing the daily average price weighted by volume. If the market is bullish, you’ll see the green bars, and if the market is bearish, the bars will color red.
□ Lower Colored Bar analyzes volume dynamics and the market's price action every few second and minute intervals by referencing average price weighted by volume. This makes it much more sensitive than the Upper Colored Bar. If the market is bullish, you’ll see the green bars, and if the market is bearish, the bars will color red.
🔷 HOW TO USE IT?
□ In general, we look for areas where all components are in sync. These are valid trading signals (refer to the usage example below).
□ If all components are not in sync, we should look for at least two of them to be in sync while one of them must be Upper Colored Bar.
□ Candle Colors: Looking for longs when the candles are green and looking for shorts when the colors are red
□ Upper Colored Bar: The most important component of this indicator is that we favor trading in the direction suggested by this component. Additional confirmation of other components is a bonus. The green color suggests a bullish market, trading long. Red color suggests bearish market, trading short.
□ Lower Colored Bar: This should not be used on its own but always combined with at least one of the other components due to its sensitivity. Colors are indicating longs when green and shorts when red.
🔷 COMBINING THE COMPONENTS
Each component of the indicator serves it's own purpose and analyzes the market from it's own perspective and with its own custom settings and formulas. The calculation of the individual component is done independently from other components. Once all of them align, we're able to execute trades with an edge as it signals that different aspects of volume and price analysis line up for the trading opportunity.
- Candle Colors are used for improving the timing of your entries/exits based on market structure
- Upper Colored Bar is used for determining the favorable direction of the market based on Daily Volume Dynamics.
- Lower Colored Bar used for determining the favorable direction of the market based on Second/Minute/3-minute Volume Dynamics.
It's important to combine the components to increase the probability of success - here's how you should look for a trade:
1. Assess the current most favorable market direction by referencing the Upper Colored bar, look for longs if it’s green and for shorts if it’s red
2. Look for the Candle Colors to align with the Upper Colored bar, look for longs if it’s green and for shorts if it’s red
3. Look for short-time frame volume dynamics to align with your entries, by referencing the Lower Colored Bar - look for longs if it’s green and for shorts if it’s red.
A valid example of the trade would be:
- Upper Colored Bar is green, indicating the favorable trading directions is long
- Lower Colored Bar is green, indicating the favorable trading directions is long
- Candle Colors are green, indicating the market structure is favorable to enter your positions
📊 USAGE EXAMPLE
Cerca negli script per "algo"

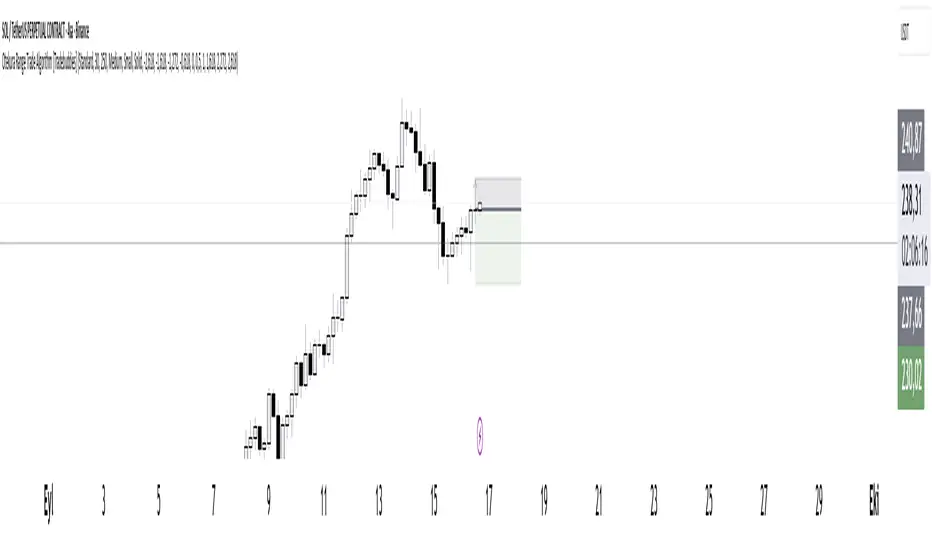
Otekura Range Trade Algorithm [Chain Hood]The Range Trade Algorithm calculates the levels for Monday.
On the chart you will see that the Monday levels will be marked as 1 0 -1.
The M High level calculates Monday's high close and plots it on the screen.
M Low calculates the low close of Monday and plots it on the screen.
The coloured lines on the screen are the points of the range levels formulated with fibonacci values.
The indicator has its own Value table. The prices of the levels are written.
Potential Range breakout targets tell prices at points matching the fibonacci values. These are Take profit or reversal points.
Buy and Sell indicators are determined by the range breakout.
Users can set an alarm on the indicator and receive direct notification with their targets when a new range occurs.
Fib values are multiplied by range values and create an average target according to the price situation. These values represent an area. Breakdown targets show that the target is targeted until the area.
Alpha Cloud Algo Risk Reward CalculatorAlpha Cloud Algo Risk Reward Calculation Usage
This indicator helps users manage their positions by allowing them to set customizable take profit and stop loss levels. It helps investors better understand the risk and reward levels of their positions.
Indicator Settings:
Language: Choose the language of the indicator (currently only Turkish is available).
Position Type: Choose either a long or short position option.
Entry Price: Enter the price at which the position will be opened.
Risk Percentage (%): Specify the percentage you are willing to risk in the trade.
Take Profit Type: Choose an option to determine your take profit level as a ratio or price.
Take Profit Value: Enter your take profit level (depending on whether it is a ratio or price type).
Stop Loss Type: Choose an option to determine your stop loss level as a ratio or price.
Stop Loss Value: Enter your stop loss level (depending on whether it is a ratio or price type).
Leverage: Enter the amount of leverage you will use in the trade.
Investment Amount ($): Enter the amount of investment you have allocated for the trade.
Main Capital ($): Enter the amount of your available main capital.
Usage of the Indicator:
After filling in the indicator settings, the take profit and stop loss levels and labels will appear on the chart. The labels also show the amount of risk and reward, in addition to the levels.
The Stop Loss label contains the following information:
Stop Loss level
Total loss amount (in dollars)
Percentage risked (as a percentage of your main capital)
This indicator is designed to speed up the decision-making process and help investors more effectively evaluate potential risks. It allows investors to apply risk management strategies more effectively while trading.
Turkish Language
Alpha Cloud Algo Risk Reward Hesaplama Kullanımı
Bu gösterge, kullanıcıların pozisyonlarını yönetmelerine yardımcı olmak amacıyla özelleştirilebilir kar al ve stop loss seviyeleri belirlemelerini sağlar. Gösterge, yatırımcıların pozisyonlarındaki risk ve ödül seviyelerini daha iyi anlamalarına yardımcı olur.
Göstergenin Ayarları:
Dil: Göstergenin dilini seçin (şu anda sadece Türkçe mevcuttur).
Pozisyon Türü: Uzun (Long) veya kısa (Short) pozisyon seçeneklerinden birini belirleyin.
Giriş Fiyatı: Pozisyonun açılacağı fiyatı girin.
Risk Oranı (%): İşlemde riske atmak istediğiniz yüzdeyi belirleyin.
Kar Al Tipi: Kar al seviyenizi oran veya fiyat olarak belirlemek için seçeneklerden birini seçin.
Kar Al Değeri: Kar al seviyenizi girin (oran veya fiyat türüne bağlı olarak).
Stop Loss Tipi: Stop loss seviyenizi oran veya fiyat olarak belirlemek için seçeneklerden birini seçin.
Stop Loss Değeri: Stop loss seviyenizi girin (oran veya fiyat türüne bağlı olarak).
Kaldıraç: İşlemde kullanacağınız kaldıraç miktarını girin.
Yatırım Miktarı ($): İşlem için ayırdığınız yatırım miktarını girin.
Ana Para ($): Kullanılabilir ana paranızın miktarını girin.
Göstergenin Kullanımı:
Göstergenin ayarlarını doldurduktan sonra, grafik üzerinde belirtilen kar al ve stop loss seviyeleri ile etiketler görünecektir. Etiketler, seviyelerin yanı sıra risk ve ödül miktarlarını da gösterir.
Stop Loss etiketi aşağıdaki bilgileri içerir:
Stop Loss seviyesi
Toplam kayıp miktarı (dolar cinsinden)
Riske atılan yüzde (ana paranızın yüzdesi olarak)
Bu gösterge, yatırımcıların karar verme sürecini hızlandırmalarına ve potansiyel riskleri daha iyi değerlendirmelerine yardımcı olmak için tasarlanmıştır. Yatırımcıların, işlem yaparken risk yönetimi stratejilerini daha etkin bir şekilde uygulamalarına olanak tanır.

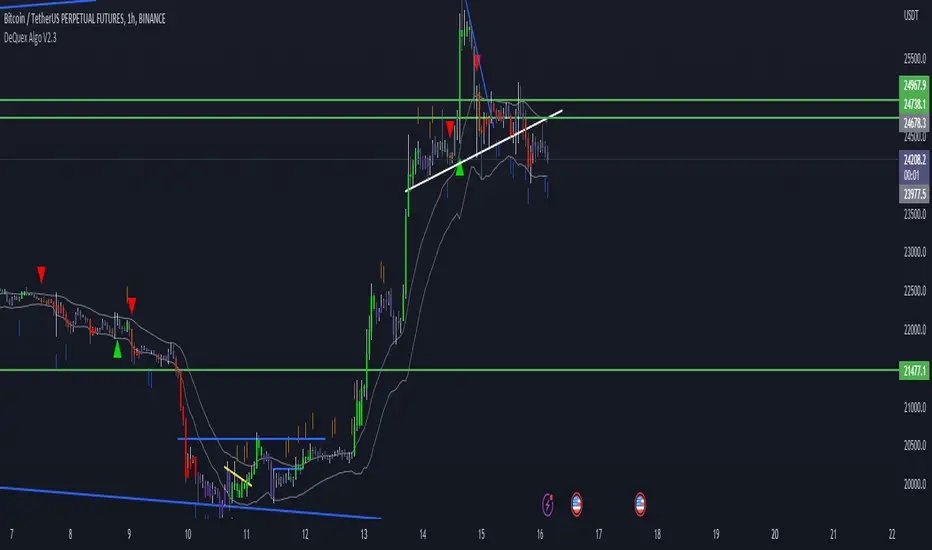
DeQuex Algo V2The DeQuex Algo V2 script is an advanced technical analysis tool that provides traders with a powerful set of features to help them identify potential trading opportunities in the market. The script is based on the widely used Moving Average Convergence Divergence (MACD) indicator, which is known for its ability to identify changes in trend direction.
The script has several input parameters that can be customized to meet the specific needs of each trader. This flexibility makes it a great tool for traders of all skill levels, from beginners to advanced traders. By adjusting the input parameters, traders can fine-tune the script to their preferred trading style and risk tolerance.
One of the key features of the DeQuex Algo V2 script is its ability to generate buy and sell signals based on MACD crosses. These signals are generated when the MACD line crosses above or below the signal line, indicating a potential change in trend direction. The script also includes options to display trend signals, which can be helpful in identifying the strength of the current trend.
In addition to the MACD indicator, the script also includes a dynamic support and resistance level calculation based on the basis and deviation of the price, as well as volume trend analysis using On Balance Volume (OBV). These features can be used to identify key levels of support and resistance, as well as determine the overall trend direction of the market. This information can be used to make more informed trading decisions and improve the chances of success in the market.
Overall, this script is powerful tool that can be used to help traders identify potential trading opportunities in the market. By using this script in conjunction with other technical analysis tools and fundamental analysis, traders can make more informed trading decisions and increase their chances of success.
Here are the main features of the script:
Moving Average Convergence Divergence (MACD) indicator: The script is based on the MACD indicator, which is widely used by traders to identify changes in trend direction. The script generates buy and sell signals based on MACD crosses, indicating potential changes in trend direction.
Customizable input parameters: The script has several input parameters that can be customized to meet the specific needs of each trader. This includes the sensitivity of the MACD indicator, the source of the price data, the smoothing period, the type of moving average to use, and the display options for trend signals and price bars.
Trend signals: The script includes options to display trend signals, which can be helpful in identifying the strength of the current trend. This can help traders determine whether to enter a trade or wait for a better opportunity.
Dynamic support and resistance levels: The script includes a dynamic support and resistance level calculation based on the basis and deviation of the price. This can help traders identify key levels of support and resistance, which can be used to determine potential entry and exit points.
Volume trend analysis: The script uses On Balance Volume (OBV) to determine the volume trend in the market. This can be used to identify potential changes in trend direction and to confirm the strength of the current trend.
Alert system: The script includes an alert system that can notify traders when a buy or sell signal is generated. This can be helpful for traders who are not able to monitor the market at all times.
kali algo trade Hodl/swing/scalpThis algo proposes several elements:
- Trend indicator (bottom)
- Divergence label
- Supertrend label
- EMA
- Danger zone WMC overbought/overbuy
- Background color red/green for buy zone sell zone
It can be used for scalping, swing trading or finding buy zones/ sell zones for long term positions.
In the case of short term positions, remember to look for trend confirmation on higher periods. The trend indicator can help you.
The red and green background color areas are found by the following indicator:
- MFI
- RSI
- StochRSI
- ema
- W%R_21e13
This indicator offers different and automated parameters depending on the time interval displayed.
Buy zones are more optimized than the sell zones.
In my opinion, this is the most important tool in the whole algo
With this algo you can quickly switch from one currency to another and adapt the timeframe to find the best configuration.

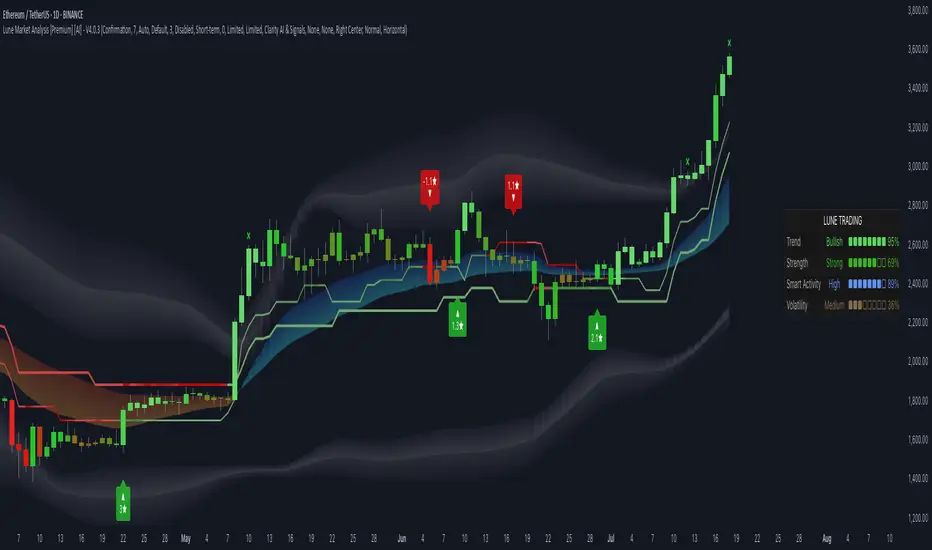
Lune Market Analysis Premium- Version 0.9 -
Lune Algo was developed and built by Lune Trading, utilizing years of their trading expertise. This indicator works on all stocks, cryptos, indices, forex, futures , currencies, ETF's, energy and commodities. All the tools and features you need to assist you on your trading journey. Best of all, Lune Algo is easy to use and many of our tools and strategies have been thoroughly backtested thousands of times to ensure that users have the best experience possible.
Overview
Trade Dashboard—Provides information about the current market conditions, Such as if the market is trending up or down, how much volatility is in the market and even displays information about the current signal.
Trade Statistics—This tool gives you a breakdown of the Statistics of the current selected strategy based on backtests. It tells you the percentage of how often a Take Profit or Stop Loss was hit within a specific time period. Risk and Trade management is very important in trading, and can be the difference between a winning and losing strategy. So we believe that this was mandatory.
Current Features:
Advanced Buy and Sell Signals
Exclusive built-in Strategies
Lune Confidence AI
EK Clouds
Reversal Bands
Vray (Volume Ray)
Divergence Signals
Reversal Signals
Support/Resistance Zones
Built-in Themes
Built-in Risk Management system (take profit/stop loss)
Trade Statistics
Trade Assistance
Trade Dashboard
Advanced Settings
+ More coming soon, Big plans!
Features Breakdown:
Lune Confirmation—Used to help you confirm your trades and trend direction. It uses unique calculations, and its settings can be adjusted to allow traders to adapt the settings to fit their trading style.
Lune Confidence AI—All strategies are equipped with our exclusive built-in Confidence AI. This feature tells you how much confluence there is in a trade. It uses a rating system where signals are given a number from 0 to 5. A rating of 0 indicates that there is not a lot of confluence or confidence in the signal, while a rating of 5 indicates that there is a lot of confidence in the trade. This feature is not perfect and will be improved overtime.
Support/Resistance Zones—Calculates the most important support/resistance levels based on how many times a level has been used as support or resistance. Traders also refer to these as supply and demand zones and key levels.
EK Clouds—Used to further help you confirm trend and was optimized to also be used as support and resistance. This feature is powered by custom moving averages.
Reversal Bands—An optimized and improved version of the infamous Bollinger Bands. When price action takes place within the Reversal Bands it usually indicates that the current symbol is overextended and a reversal is possible.
Vray—Also Known as "Volume Ray", Assists you in better visualizing volume. This helps you find key levels and areas of support that you wouldn't be able to see otherwise. It helps you trade like the institutions.
This indicator's signals DO NOT REPAINT.
If you are using this script you acknowledge past performance is not necessarily indicative of future results and there are many more factors that go into being a profitable trader.
[Fedra Algotrading LR + TTP Indicator Lite]How it works?
- It calculates the linear regression of the last X candles and define a range based on a linear regression deviation (represented by the 3 parallel lines over the last candle).
-Open trades based on the breakout of the deviation of the linear regression (represented by the yellow triangle).
-Advanced trend filter to not open trades against the trend consist in 2 SMA cross and and a few other conditions, including sptionally super trend (Represented by the red and green background).
-Percentage take profit (represented by the horizontal green line. configurable)
-Percentage stop loss (represented by the horizontal red line. Configurable
-Break even when a trade has already opened and there is a change of trend. Calculated in 1.5% when the price is under the yellow SMA.
Alerts in each case to receive notifications (BUY & SELL, TP BE SL).
Added labels with entry price and PnL of each closed trade to facilitate optimization

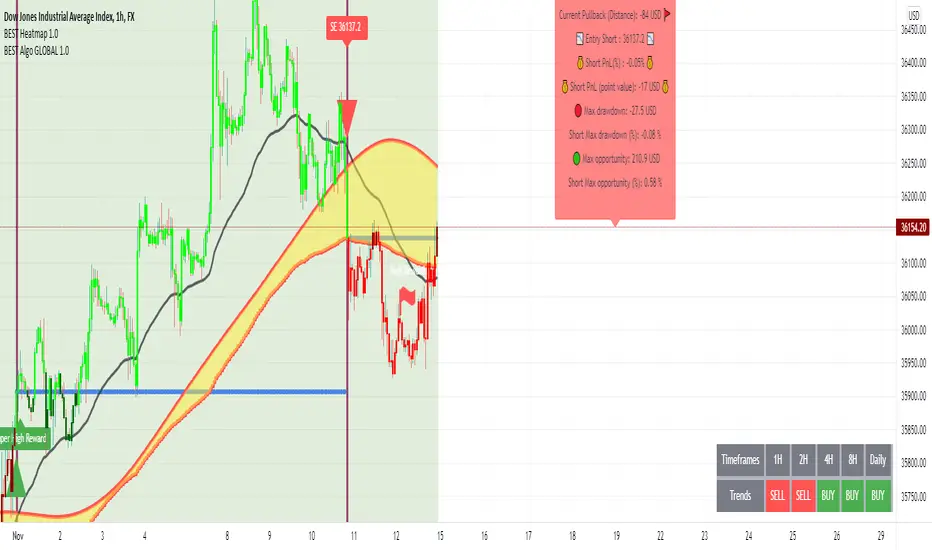
BEST Algo HeatmapHello traders
How to access?
Offered to all the current customers
To be used alongside the BTI Algo Global script.
Heatmap
This heatmap screens the BTI Algo Global signals across different timeframes.
The screened timeframes are for now: m1/m2/m5/m15/m30/H1/H2/H4/H8/Daily
The trends are based on the triangle primary signals
Limitations
- I could only access the last 20K loaded candles, then you might see a blank case for the screened high timeframes when you're loading the screener on a low timeframe chart.
Example: a 1-minute chart with the screener might struggle sometimes to display the 4H/8H/Daily data
- What to do then?
I found a hack.
Just load the chart on a much higher timeframe and you should be able to see the latest timeframes from the heatmap
If any questions, please let me know
Dave
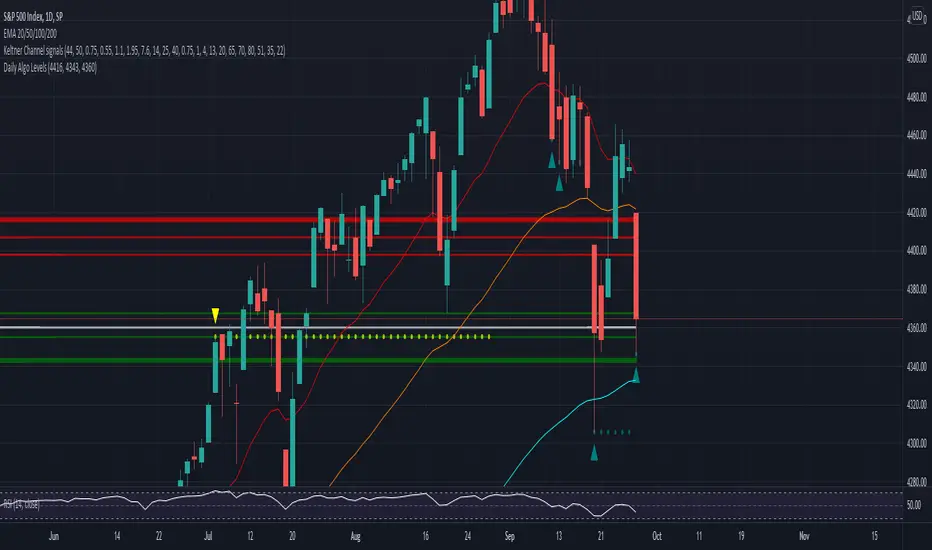
Daily Algo LevelsQuickly plot stoo's algo levels. Gives option to expand range based on algo error formula. Gives option to display suggested entry points.
Trendsurfer - A new type of moving average algorithmUsing a new type of lag reducing moving average algorithm, this indicator adapts it's sensitivity based on the strength of the trend and the volatility of the asset.
In doing so, signals can be given extremely fast during favorable market conditions. False signals can still appear, so visual confirmation/judgement is required before taking a trade.
The indicator:
Trend Bias Moving average . Thick green and orange line shows us trend bias.
- If the moving average is green, then the average price level is above the moving average = overall bullish conditions.
- As the moving average draws closer to price, or is straight, conditions are changing
- If the moving average is orange, then the average price level is below the moving average = overall bearish conditions.
Dual lag reduced instantaneous moving average.
This moving average is adaptive and fast, and will give buy and sell signals on crossover with price (EMA 6).
Buy and sell signals are shown visually using up and down arrow.
IMPORTANT: To filter out false signals, check other MA's like the 50 period hull moving average (dotted plot) for visual confirmation.
Furthermore, Significant support and resistance levels can be found on the right, shown as dotted horizontal lines. The importance of these levels is calculated based on the strength of the support/rejection, the volume, and the amount of times resistance and support was tested.
The location of the nearest moving averages below and above is also included as further potential support and resistance.
What to watch out for a good entry
- Watch for price to break out of the gray zone, and/or successfully retest it for a great entry.
Make your own decisions and never solely rely on a tool that should only be giving you an "indication".
Happy Trading,
MM

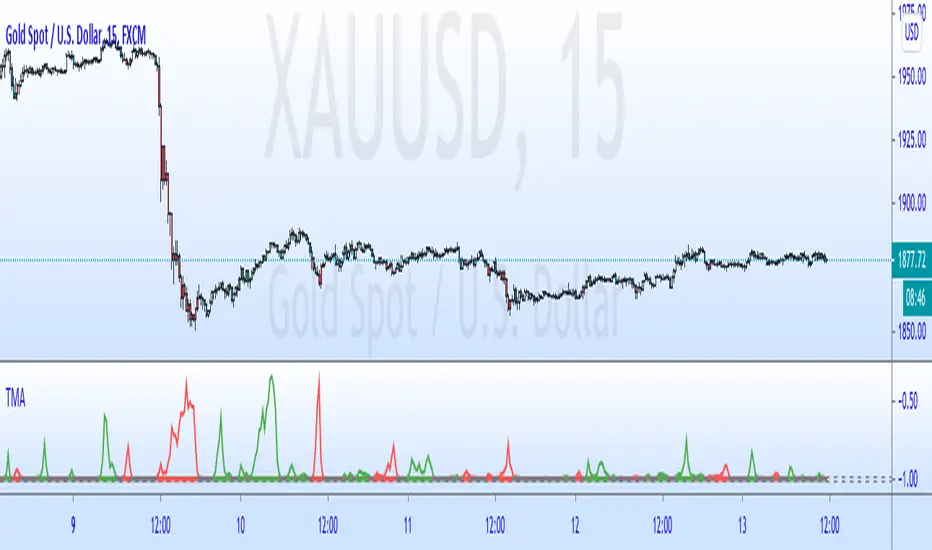
Trend Momentum AlgorithmThis algorithm comes from 2 inverse fisher transforms of a williams %R. After experimenting. I found that this is useful to understand the momentum of chart.
If green, only look for buy opportunities, if red, look for sells. If gray, look for whatever the previous colour was.
Can be useful with divergence. I'd look at a lower timeframe for confirmation (if divergence suggests turning bearish look for red on a lower timeframe. Be aware of the momentum on the timeframe above)
I put a tolerance filer on to help remove any smaller spikes. The larger the tolerance the less inaccuracies you will have but see the start of an new trend later.
This is a fun tool. Enjoy
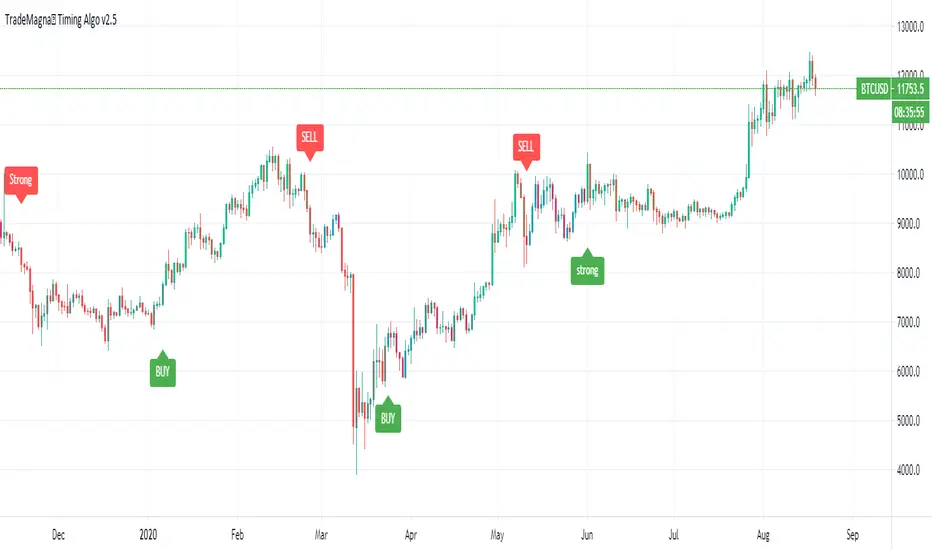
TradeMagna™ Timing Algo V2.5Over the years we've come up with three of the most profound problems that most traders struggle with:
1- when to take profits?!
2- how to hold my winning positions without overly thinking?
3- how can I get a trading system without conflicting indicators?
What makes TradeMagna Algo very unique is that it emphasizing the act of taking profit and be steady for the next position, and when you have a winning position it will let you keep it without overly thinking about closing it every while!
The main features you will find in our TradeMagna Algo V2 are standard buy&sell signals, strong signals, and candlestick coloring. All of these features don’t contradict each other but otherwise complement each other in an unprecedented way to be used as a complete trading system!
TradeMagna algo can identify synchronized trends “trend periods” and unsynchronized trends “ranging periods” when taking profits happens through range breakouts and multiple indicators working together under the hood without contradicting each other. Strong signals (Green or Red "Strong" tags) will trigger when either standard signals turned strong "synchronized", or when a new trend signal has triggered from purple candles.
When you get purple candles, it means to take profit and be steady for the next signal to trigger, or "be cautious" in your current position if the last triggered signal was strong.
Trend identifying strategies typically fails when markets are ranging and triggers many false signals, and to overcome this as best as possible, our purple candles indicate when strong signals may not be heading in the right direction; and that's what we mean by "be cautious" in your position...
Strong signals are the only signals for entering long or short positions and all standard buy and sell signals activate purple candles until it gets synchronized, so then it's safe to trade.
TradeMagna can be used on any market, and you can use either standard candlesticks, Heikin Ashi Candles (recommended), or TradeMagna Noise Removal (highly recommended) for spotting trends better as a swing trader.
Our strategy is ideally used for swing traders on higher timeframes such as 4H, 12H, 1D, 2D, 3D, 1W, and even on very high timeframes with good past results such as 1M, 3M on instruments like Bitcoin, currencies, Gold, or the S&P500, etc...
per our disclaimer on our website, if you are using this script you acknowledge that past performance is not necessarily indicative of future results, and no script can 100% guarantee success in trading.
You can use the link below to visit our website and gain access to the script.
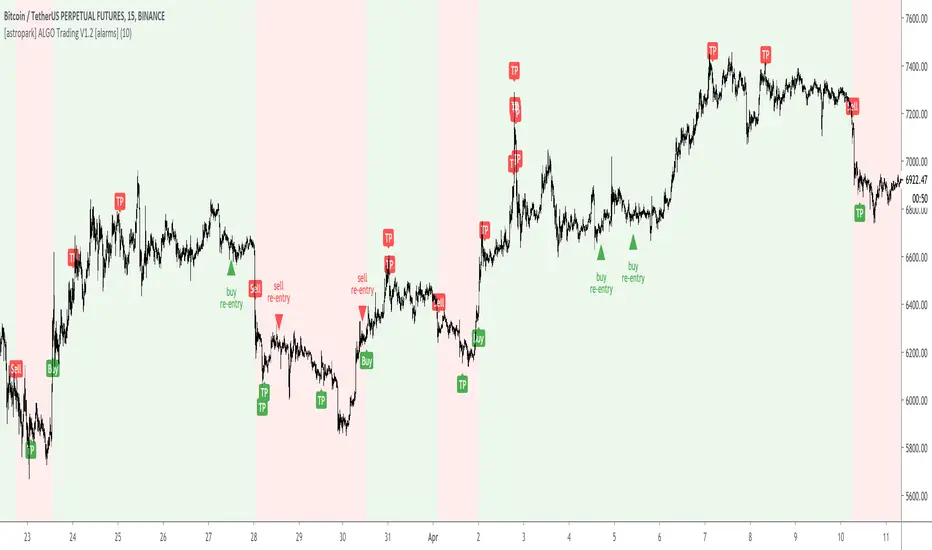
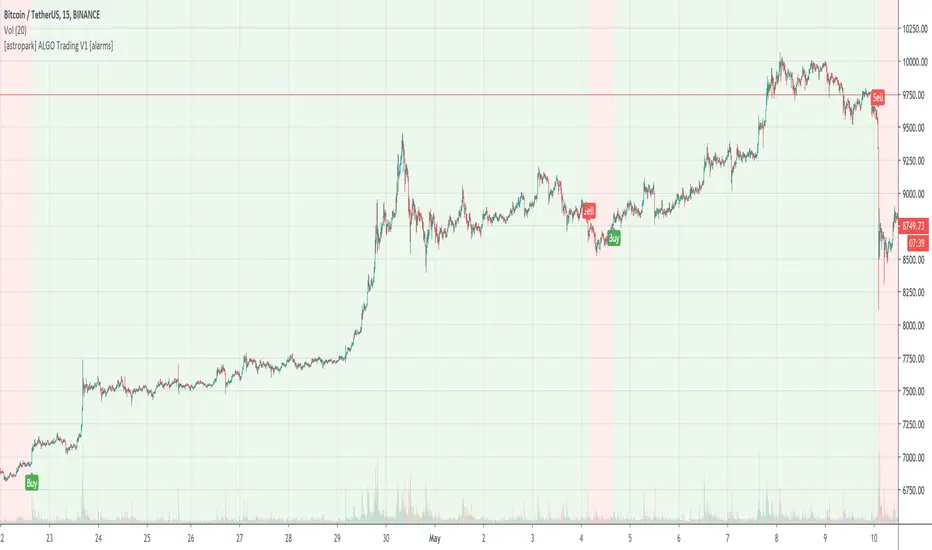
[astropark] ALGO Trading V1.2 [alarms]Dear Followers,
today another awesome Swing and Scalping Trading Strategy indicator : the upgraded version of ALGO Trading V1 for Binance Bitcoin PERP on 15m timeframe!
It is runnable on a bot , just write me in order to help you do it.
If you are a scalper or you are a swing trader, you will love suggested entries for fast and long-lasting profit.
Keep in mind that a proper trailing stop strategy and risk management and money management strategies are very important (DM me if you need any clarification on these points).
This strategy has the following options:
enable/disable signals on chart
enable/disable bars and background coloring based on trend
enable/disable a Filter Noise option, which reduces overtrading
enable/disable a Trailing Stop option
enable/disable/config a Take Profit option, with Re-Entry
enable/disable a secret Smart Close Option which may improve profit on your chart (again, check it on you chart if it helps or not)
This strategy only trigger 1 buy (where to start a long trade) or 1 sell (for short trade). If you enable Take Profit / Stop Loss option, consider that many TP can be triggered before trend reversal, so take partial profit on every TP an eventually buy/sell back lower/higher on RE-ENTRY signal to maximize your profit.
This is not the "Holy Grail", so use proper money and risk management strategies.
This indicator will let you set all alerts you need in order to get notified whenever a new signal is triggered.
To check its backtesting, you should use the strategy version, that you can find by searching for "ALGO Trading V1.2" or here below:
You can check out previous ALGO Trading V1 indicator here below:
This is a premium indicator , so send me a private message in order to get access to this script.
FUNCTION: Goertzel algorithm -- DFT of a specific frequency binThis function implements the Goertzel algorithm (for integer N).
The Goertzel algorithm is a technique in digital signal processing (DSP) for efficient evaluation of the individual terms of the discrete Fourier transform (DFT).
In short, it measure the power of a specific frequency like one bin of a DFT, over a rolling window (N) of samples.
Here you see an input signal that changes frequency and amplitude (from 7 bars to 17). I am running the indicator 3 times to show it measuring both frequencies and one in between (13). You can see it very accurately measures the signals present and their power, but is noisy in the transition. Changing the block len will cause it to be more responsive but noisier.
Here is a picture of the same signal, but with white noise added.
If you have a cycle you think is present you could use this to test it, but the function is designed for integration in to more complicated scripts. I think power is best interrupted on a log scale.
Given a period (in bars or samples) and a block_len (N in Goertzel terminology) the function returns the Real (InPhase) and Quadrature (Imaginary) components of your signal as well as calculating the power and the instantaneous angle (in radians).
I hope this proves useful to the DSP folks here.

[astropark] ALGO Trading V2 [alarms]Dear Followers,
today another awesome Swing and Scalping Trading Strategy indicator, runnable on a bot , which works great on many timeframes (ones between 1h and 1D are suggested, but just write me in order to help you find correct settings).
It must be said that this strategy works even better on 1m Renko chart!
If you are a scalper or you are a swing trader, you will love suggested entries for fast and long-lasting profit.
Keep in mind that a proper trailing stop strategy and risk management and money management strategies are very important (DM me if you need any clarification on these points).
This is not an evolution of "ALGO Trading V1" or "ALGO Trading V3" , but a twin sister of them. Search them on TradingView to know them better.
Here you can find ALGO Trading V1
This strategy has the following options:
enable/disable signals on chart
enable/disable bars and background coloring based on trend
enable/disable a "filter noise" option , which try to reduce overtrading (you can easily check it on backtesting)
enable/disable a Take Profit / Stop Loss option (you can easily check it on backtesting too)
enable/disable a secret SmartOption which may improve profit on your chart (again, check it on you chart if it helps or not)
This strategy only trigger 1 buy or 1 sell. If you enable Take Profit / Stop Loss option, consider that many TP can be triggered before trend reversal, so take partial profit on every TP an eventually buy/sell back lower/higher to maximize your profit.
This script will let you set all notifications you may need in order to be alerted on each triggered signals.
The one for backtesting purpose can be found by searching for the astropark's "ALGO Trading V2" and then choosing the indicator with "strategy" suffix in the name, or you can find here below
Strategy results are calculated on the time window from January 2018 to now, so on more than 2 years, using 1000$ as initial capital and working at 1x leverage (so no leverage at all! If you like to use leverage, be sure to use a safe option, like 3x or 5x at most in order to have liquidation price very far).
This is not the "Holy Grail", so use a proper risk management strategy.
This is a premium indicator , so send me a private message in order to get access to this script.

[astropark] ALGO Trading V1 [alarms]Dear Followers,
today another awesome Swing and Scalping Trading Strategy indicator, runnable on a bot , which works great on Low Timeframes (1h is suggested) but also on even lower ones (till 15m) and on higher ones (no further than 1D), just write me in order to help you find correct settings).
It must be said that this strategy works even better on 1m Renko chart!
If you are a scalper or you are a swing trader, you will love suggested entries for fast and long-lasting profit.
Keep in mind that a proper trailing stop strategy and risk management and money management strategies are very important (DM me if you need any clarification on these points).
This is not an evolution of "ALGO Trading V2" or "ALGO Trading V3" , but a twin sister of them. Search them on TradingView to know them better.
This strategy has the following options:
enable/disable signals on chart
enable/disable bars and background coloring based on trend
enable/disable a "filter noise" option , which try to reduce overtrading (you can easily check it on backtesting)
enable/disable a Take Profit / Stop Loss option (you can easily check it on backtesting too)
enable/disable a secret SmartOption which may improve profit on your chart (again, check it on you chart if it helps or not)
This strategy only trigger 1 buy or 1 sell. If you enable Take Profit / Stop Loss option, consider that many TP can be triggered before trend reversal, so take partial profit on every TP an eventually buy/sell back lower/higher to maximize your profit.
This script will let you set all notifications you may need in order to be alerted on each triggered signals.
The one for backtesting purpose can be found by searching for the astropark's "ALGO Trading V1" and then choosing the indicator with "strategy" suffix in the name, or you can find here below
Strategy results are calculated on the time window from January 2019 to now, so on more than 1 year, using 1000$ as initial capital and working at 1x leverage (so no leverage at all! If you like to use leverage, be sure to use a safe option, like 3x or 5x at most in order to have liquidation price very far).
This is not the "Holy Grail", so use a proper risk management strategy.
This is a premium indicator , so send me a private message in order to get access to this script.
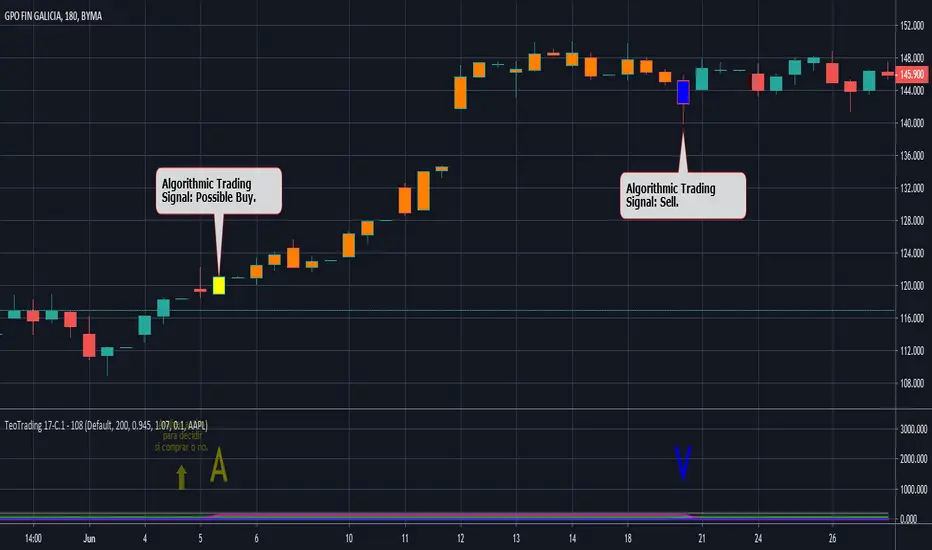
TeoTrading 17-C.1 - 108. Algorithmic Trading Long Signals.This indicator mark patterns that were successful in the past, based on Algorithmic Trading and backtesting.
This Script is for Private Use.
It was designed for Long Signals.
Was developed and tested with Argentinians and Nasdaq stocks.
Includes Real Time Stastistics.
No purchase recommendations are given. The user must do their own analysis to decide whether to buy.
"A" signal is to make the Analysis. Here the user will see a Yellow Candle.
"V" signal is to Sell. Here the user will see:
- A Green Candle: Sell with Gain using a fixed Stop Gain.
- A Blue Candle: Sell with Gain using a dynamic (variable) Stop Gain.
- A Fuchsia Candle: Sell with lost.
The Orange Candle indicates that a trade is open.
The user can filter by differents types of moving averages using input parameters.
Includes Alerts.
TeoTrading 17 - 106. Long Signals based on Algorithmic TradingThis indicator mark patterns that were successful in the past, based on Algorithmic Trading and backtesting.
This Script is for Private Use.
It was designed for Long Signals. Was developed and tested with o group of stocks:
- Argentine Stocks of different sectors: Bank, Energy and Industry.
- Nasdaq technology stocks.
- Petroleum.
Includes Real Time Stastistics.
No purchase recommendations are given. The user must do their own analysis to decide whether to buy.
"A" signal is to make the Analysis. Here the user will see a Yellow Candle.
"V" signal is to Sell. Here the user will see:
- A Green Candle: Sell with Gain using a fixed Stop Gain.
- A Blue Candle: Sell with Gain using a dynamic (variable) Stop Gain.
- A Fuchsia Candle: Sell with lost.
The Orange Candle indicates that a trade is open.
Includes Alerts.
Enabled users will obtain a complete manual.

Alerts on OnePunch Algo StudyIn this study you will be able to get alerts based on the OnePunch Algo Strategy Version 1 and 2.
How To Use:
Open Alerts and Pick Alerts on OnePunch Algo Study option.
For buy alerts, pick Buy Signal option
For sell alerts, pick Sell Signal option
Simple as that. This script will provide buying and selling alerts to your email and mobile app notifications.

Automatic Monthly Pivots with built-in Fibonacci LevelsClassic Floor Trader Pivots (algorithm decision points) with color segmented Fibonacci levels plotted in real-time Enjoy! Multi-variable Time Frame Pivots with Custom fib levels is in works.

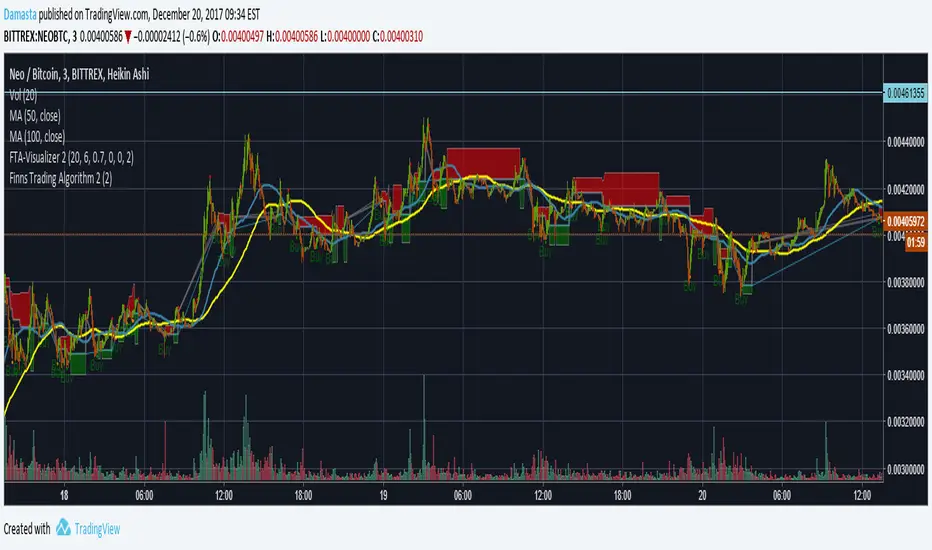
FTA 2Hello there,
What you see here is V2 of FTA .
First of all some keypoints to it:
-It uses Gunbot
-Many Microtrades on a bullish market
-Even make Profit on Sideway & wavy downtrends
-Double up to infinity
-Controlled downtrend averaging
-Visualizer available allowing visible emulation of the Script & Gunbot trading together.
-More Features & Optimization still to come!
It has the same core as V1 but a few big changes/additions.
As I don't want to force these changes on to everyone I made an additional version.
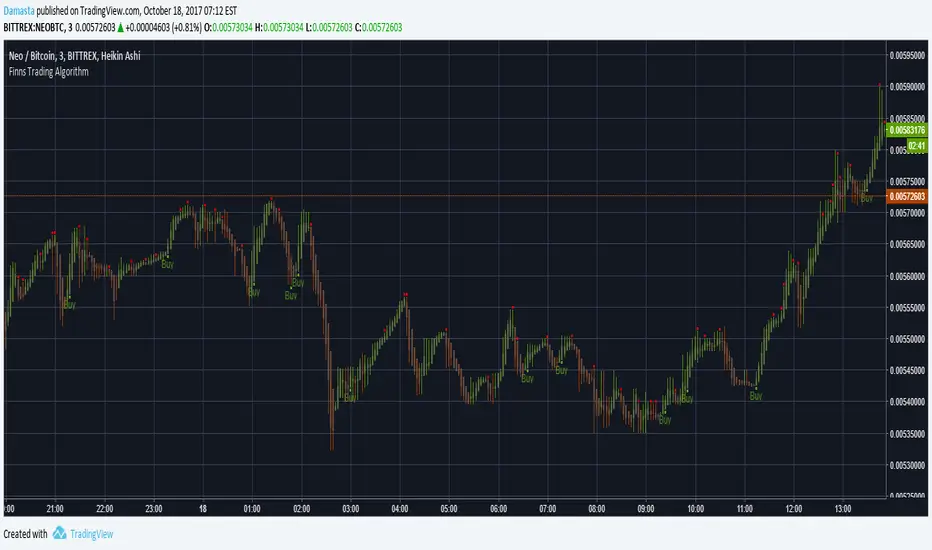
Finns Trading Algorithm AlertsHello there,
I have developed a Microprofit Script for Tradingview and would like to introduce you to it.
First of all some keypoints to it:
-It uses Gunbot
-Many Microtrades on a bullish market
-Even make Profit on Sideway & wavy downtrends
-Double up to infinity
-Controlled downtrend averaging
-Visualizer available allowing visible emulation of the Script & Gunbot trading together.
-More Features & Optimization still to come!
AI ALGO SETUP by A+AI ALGO SETUP by A+.
This Setup helps the Intraday Trader have an Edge in the Market
