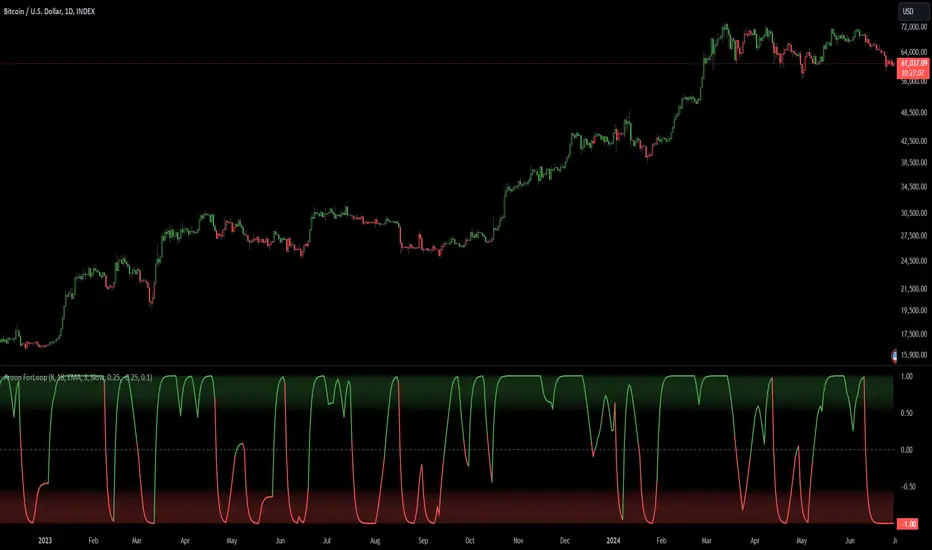
RSI / Stoch / SRSI / MFI / Aroon Overlay [SigmaDraconis]Combines 4 popular indicators (RSI, Stoch, SRSI, MFI) and 1 peculiar one (Aroon) in 1 for those who want to save indicators but not only.
This is an evolution of my (simpler) "RSI / Stoch / Stoch RSI (SRSI) Overlay " that you can find on my scripts.
Added bands for oversold/overbought areas (70/30 common for RSI and 80/20 for SRSI and MFI), as well as a middle 50 horizontal line.
Neutral bands around 55-45 added as well that can be hidden for less clutter. I also recommend a more transparent coloring for these since Pine script doesn't allow default transparency for horizontal lines.
By default only RSI and Stoch are activated, you can activate Aroon, MFI and SRSI on the inputs window.
Some extra notes:
* RSI, Stoch and MFI can help to strengthen one's decision as well as Aroon to predict a possible trend reversal, SRSI can show when RSI has high probability of being topped or bottomed when oversold/overbought but don't forget to look at volume and how the trend progresses that can keep SRSI above 80 or below 20 while RSI and price continues to trend, divergences are most helpful here to find possible reversal areas.
* This chart depicts some interesting divergences, as well as Stoch tops and bottoms and confluences between RSI/MFI and Stoch on some over-extended tops and bottoms that shown being good reversal zones.
RSI resistances are shown as well, failing to break above 60 or the neutral zone (this is a bearish BTC trend chart after all) or failing to gain support to break up certain levels (RSI notes a more bullish trend when consistently above 60 and more bearish below 40).
If you like it and use it to profit, please tip me below :)
Tip jars:
BTC: 15nMBiEGVrdGcu9C1h6QRcTNRvugHkqrMQ
ETH: 0xC33845946c48B61fBCbEA0367ec2238CaF2b73bc
BTS: sigma-draconis
Cerca negli script per "aroon"

AroonThe Aroon line in this indicator is an average between the 2 original Aroon lines.
Green = Buy
Purple = Sell

Aroon ForLoop [InvestorUnknown]Overview
The Aroon ForLoop indicator is designed to calculate an array of Aroon values over a range of lengths, providing trend signals based on various moving averages. It offers flexibility with different signal modes and visual customizations.
User Input
Start Length (a) and End Length (b): Defines the range for calculating Aroon values.
MA Type (maType) and MA Length (c): Selects the moving average type (EMA, SMA, WMA, VWMA, TMA) and its length.
Calculation Source (s): Specifies the data source for calculations.
Signal Mode (sigmode): Offers options like Fast, Slow, Thresholds Crossing, and Fast Threshold to generate signals.
Thresholds: Configures long and short thresholds for signal generation.
Visualization Options: Customizes bull and bear colors, and enables/disables bar coloring.
Alert Settings: Chooses whether to wait for bar close for alert confirmation.
Signal Calculation
Signal Mode (sigmode): Determines the type of signal generated by the indicator. Options are "Fast", "Slow", "Thresholds Crossing", and "Fast Threshold".
1. Slow: is a simple crossing of the midline (0).
2. Fast: positive signal depends if the current MA > MA or MA is above 0.99, negative signals comes if MA < MA or MA is below -0.99.
3. Thresholds Crossing: simple ta.crossover and ta.crossunder of the user defined threshold for Long and Short.
4. Fast Threshold: signal changes if the value of Aroon MA changes by more than user defined threshold against the current signal
col1 = MA > 0 ? colup : coldn
var color col2 = na
if MA > MA or MA > 0.99
col2 := colup
if MA < MA or MA < -0.99
col2 := coldn
var color col3 = na
if ta.crossover(MA,longth)
col3 := colup
if ta.crossunder(MA,shortth)
col3 := coldn
var color col4 = na
if (MA > MA + fastth)
col4 := colup
if (MA < MA - fastth)
col4 := coldn
color col = na
if sigmode == "Slow"
col := col1
if sigmode == "Fast"
col := col2
if sigmode == "Thresholds Crossing"
col := col3
if sigmode == "Fast Threshold"
col := col4
else
na
Visualization Settings
Bull Color (colup): The color used to indicate bullish signals.
Bear Color (coldn): The color used to indicate bearish signals.
Color Bars (barcol): Option to color the bars based on the signal.
Custom Function
AroonForLoop: Calculates Aroon values over the specified range, determines the trend, and averages the results using the chosen moving average type.
AroonForLoop(a, b, c) =>
var SignalArray = array.new_float(b - a + 1, 0.0)
for x = 0 to (b - a)
len = a + x
upper = 100 * (ta.highestbars(high, len + 1) + len)/len
lower = 100 * (ta.lowestbars(low, len + 1) + len)/len
trend = upper > lower ? 1 : -1
array.set(SignalArray, x, trend)
Avg = array.avg(SignalArray)
float MA = switch maType
"EMA" => ta.ema(Avg, c)
"SMA" => ta.sma(Avg, c)
"WMA" => ta.wma(Avg, c)
"VWMA" => ta.vwma(Avg, c)
"TMA" => ta.trima(Avg, c)
=>
runtime.error("No matching MA type found.")
float(na)
Important Considerations
Fast Responses: The Aroon ForLoop indicator is designed for quick identification of trend changes, making it ideal for fast-paced trading environments.
Moving Average Types: Supports various MA types (EMA, SMA, WMA, VWMA, TMA) for adaptable smoothing of trend signals.
Combination with Other Indicators: For more reliable signals, use this indicator in conjunction with other technical indicators.
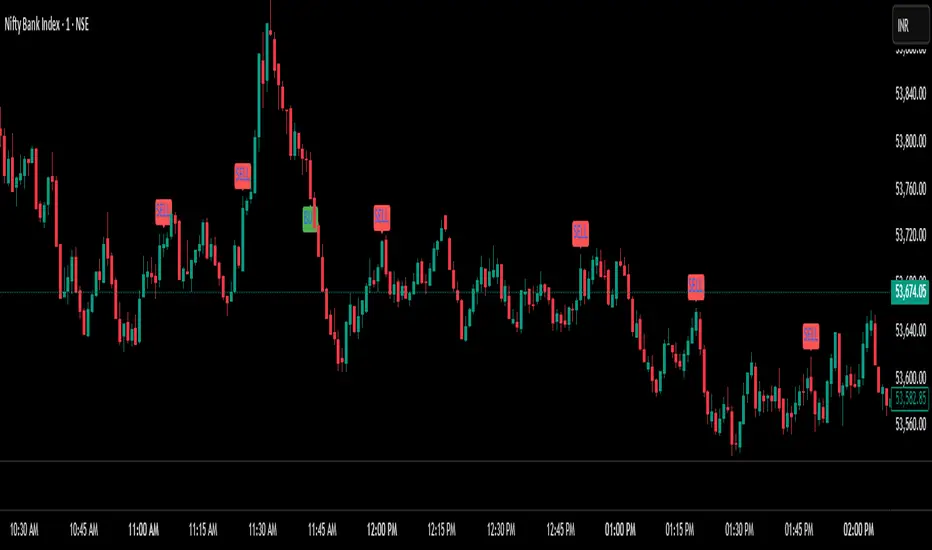
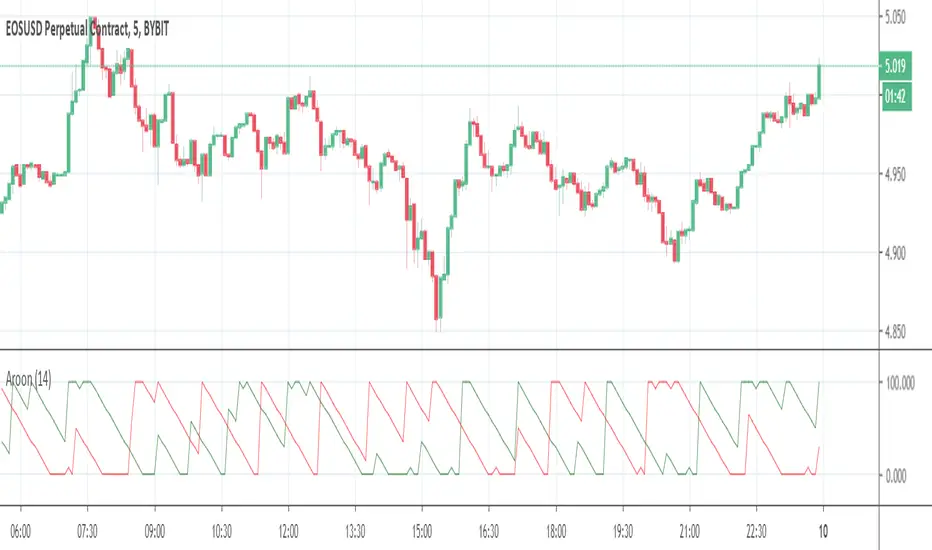
Aroon Buy & Sell (Custom TFs)Here's a detailed explanation of your Pine Script titled "Aroon Buy & Sell (Custom TFs)":
🧠 Strategy Overview:
This script generates buy and sell signals using the Aroon indicator across two different timeframes:
* One for detecting the primary trend (Trend Timeframe)
* One for confirming precise entry signals (Signal Confirmation Timeframe)
📊 Key Components:
1. User Inputs
* trendTF: The timeframe used to determine overall trend direction (e.g., 5-minute).
* signalTF: The faster timeframe for confirming trade signals (e.g., 1-minute).
* aroonLength: Lookback period for the Aroon calculation (default 14).
* cooldownPeriod: Number of bars to wait before allowing a new signal.
2. Aroon Calculation Function
Calculates Aroon Up and Aroon Down values using the number of bars since the highest high and lowest low.
3. Multi-Timeframe Aroon Values
Uses request.security to compute Aroon values on both trendTF and signalTF.
4. Trend Detection
* A bullish trend is defined when Aroon Up crosses above Aroon Down on the trend timeframe.
* A bearish trend is defined when Aroon Down crosses above Aroon Up.
5. Signal Logic
* Buy Signal: When the overall trend is bullish and Aroon Down = 100 on the signal timeframe.
* Sell Signal: When the trend is bearish and Aroon Up = 100 on the signal timeframe.
6. Cooldown Mechanism
Prevents back-to-back signals by enforcing a cooldown (e.g., 20 bars) after each buy/sell.
7. Signal Plotting & Alerts
Plots buy/sell signals directly on the chart and supports alerts for automation.
📈 Visual Output:
* BUY label below the bar when buy conditions are met.
* SELL label above the bar when sell conditions are met.
🔔 Alerts:
Two alertconditions are defined to trigger alerts whenever a buy or sell signal occurs.
Aroon VariantArron Variant is based on the original Arron but with a twist, Arron Variant measures the difference between highs and lows over a time period, opposed to the original Arron who measures the time (bars) between highs and lows over a time period.
Also added a few optional moving averages like EMA, HMA and JMA. (Default JMA - Jurik Moving Average)
===== Color Explained =====
Bright Green: Column is above zero and ascending or equal from previous column. (Stronger uptrend)
Darker Green: Column is above zero and descending or equal from previous column. (Weakening uptrend)
Bright Red: Column is below zero and descending or equal from previous column. (Stronger downtrend)
Darker Green: Column is below zero and ascending or equal from previous column. (Weakening downtrend)
==== Notes =====
Support different multi time frames (recommended to use higher time frames than chart time frame to avoid unrealistic results)
Bar colors are disabled by default.
For other coders: Using Latest Pinescript color framework (Link in code)
Like if you Like and Follow me for upcoming indicators/strategies: www.tradingview.com

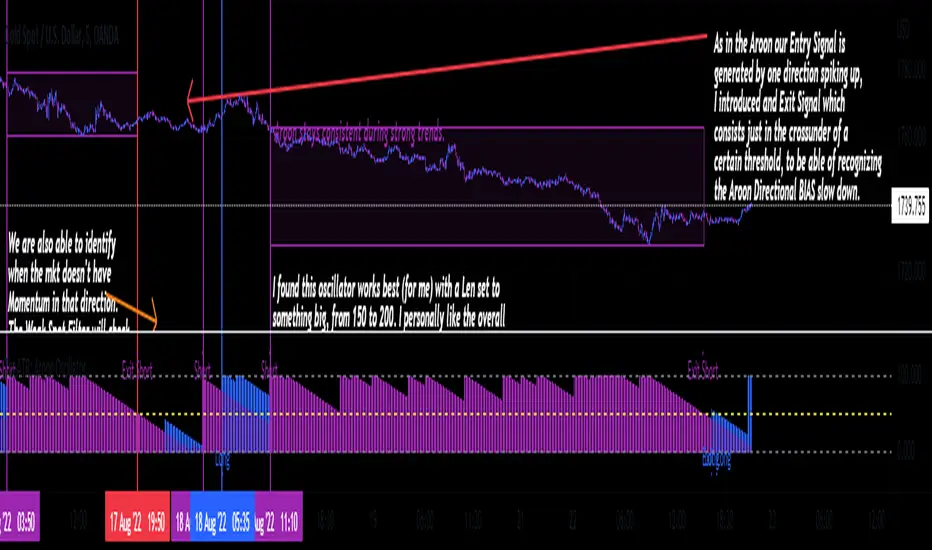
TheATR: Aroon Oscillator.Aroon Oscillator (AO).
The Aroon Oscillator, was developed by Tushar Chande, in 1995, to highlight the start of a new trend and to measure trend strength.
I re-branded a bit the whole thing, If you are familiar with how this Oscillator usually is, you are going to notice the differences.
Aroon Oscillator Components.
1 - Aroon Up -> Bullish Directional Component, highlighted in blue.
2 - Aroon Down -> Bearish Directional Component, highlighted in purple.
We also have the Oscillators static thresholds, which are:
- 0 Line.
- 100 Line.
- Exit Signal Line Level.
How to read the Aroon Oscillator.
The AO main goal, is to identify the trend from its first stages, to then come up with how strong that trend is.
So, classic interpretation for the AO would be:
-Aroon Up>Aroon Down = Bull Scenario.
-Aroon Up
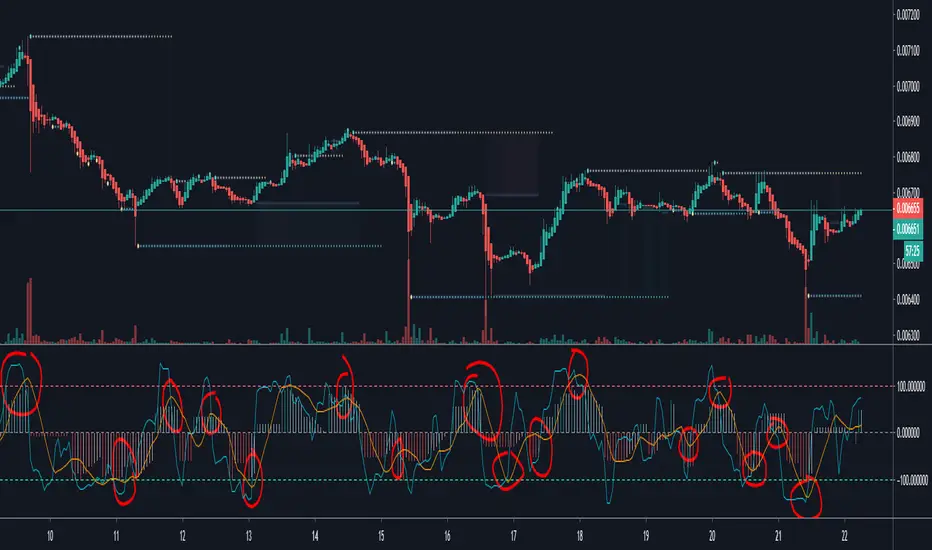
Aroon Histogram + CMO [ChuckBanger]This is a combination of Aroon and Chande Momentum Oscillator . I made a histogram of Aroon , aqua line is Chande Momentum and the orange line are a simple moving average of Chande Momentum as a signal line.
One strategy you can use this for is to buy or sell when the signal line crosses the CM line or you can buy and sell when CM line is highest or lowest
You should also study how the indicators work separately:
Aroon Oscillator
www.investopedia.com
Chande Momentum Oscillator
www.investopedia.com
Aroon OscillatorThis indicator is aimed towards people who like Aroon.
The indicator produces the same signals as Aroon, but presents them in columns.
Enjoy guys!

Aroon and ASH strategy - ETHERIUM [IkkeOmar]Intro:
This post introduces a Pine Script strategy, as an example if anyone needs a push to get started. This example is a strategy on ETH, obviously it isn't a good strategy, and I wouldn't share my own good strategies because of alpha decay. This strategy combines two technical indicators: Aroon and Absolute Strength Histogram (ASH).
Overview:
The strategy employs the Aroon indicator alongside the Absolute Strength Histogram (ASH) to determine market trends and potential trade setups. Aroon helps identify the strength and direction of a trend, while ASH provides insights into the strength of momentum. By combining these indicators, the strategy aims to capture profitable trading opportunities in Ethereum markets. Normally when developing strats using indicators, you want to find some good indicators, but you NEED to understand their strengths and weaknesses, other indicators can be incorporated to minimize the downs of another indicator. Try to look for synergy in your indicators!
Indicator settings:
Aroon Indicator:
- Two sets of parameters are used for the Aroon indicator:
- For Long Positions: Aroon periods are set to 56 (upper) and 20 (lower).
- For Short Positions: Aroon periods are set to 17 (upper) and 55 (lower).
Absolute Strength Histogram (ASH):
ASH is calculated with a length of 9 bars using the closing price as the data source.
Trading Conditions:
The strategy incorporates specific conditions to initiate and exit trades:
Start Date:
Traders can specify the start date for backtesting purposes.
Trade Direction:
Traders can select the desired trade direction: Long, Short, or Both.
Entry and Exit Conditions:
1. Long Position Entry: A long position is initiated when the Aroon indicator crosses over (crossover) the lower Aroon threshold, indicating a potential uptrend.
2. Long Position Exit: A long position is closed when the Aroon indicator crosses under (crossunder) the lower Aroon threshold.
3. Short Position Entry: A short position is initiated when the Aroon indicator crosses under (crossunder) the upper Aroon threshold, signaling a potential downtrend.
4. Short Position Exit: A short position is closed when the Aroon indicator crosses over (crossover) the upper Aroon threshold.
Disclaimer:
THIS ISN'T AN OPTIMAL STRATEGY AT ALL! It was just an old project from when I started learning pine script!
The backtest doesn't promise the same results in the future, always do both in-sample and out-of-sample testing when backtesting a strategy. And make sure you forward test it as well before implementing it!

Aroon RSI Logic — Customizable + No-Trade RSI ZoneThis indicator — **“Aroon RSI Logic — Customizable + No-Trade RSI Zone”** — is designed to help traders identify high-probability turning points in the market by combining **trend momentum (Aroon)** with **relative strength dynamics (RSI)**, while also protecting against emotional or impulsive trading through structured filters and psychological safeguards.
---
### 🧠 **Concept Overview**
At its core, the system balances **trend confirmation** with **momentum moderation**. It seeks to enter trades only when technical alignment suggests both exhaustion of a recent move and early signs of a potential reversal — while filtering out market noise and emotionally driven trades in neutral or extreme conditions.
This design encourages **discipline**, **patience**, and **objectivity**, three of the most critical psychological traits of successful traders.
---
### 📊 **Core Components**
#### 1. **Aroon Structure Awareness**
The Aroon indicator measures how recently price has reached a new high or low within a specific period, reflecting trend strength and potential exhaustion.
* When **Aroon Down** approaches the predefined target level, it suggests the market has not made new lows for several bars — an early indication that bearish momentum may be fading.
* Conversely, when **Aroon Up** nears the target, bullish strength may be waning.
This mechanism trains the trader’s mind to **look for transitions** — moments when dominant sentiment begins to lose control.
---
#### 2. **RSI Momentum Confirmation**
The RSI (Relative Strength Index) and its smoothed version act as dual filters to confirm emotional extremes and trend shifts in momentum.
* When RSI significantly diverges from its smoothed version, it often reflects **emotional spikes** or **unsustainable acceleration**.
* The system only allows trades when the RSI difference remains within a defined limit, fostering entries during **balanced, rational phases** of the market rather than moments of panic or euphoria.
This approach supports **emotional discipline**, discouraging entries when crowd psychology dominates decision-making.
---
#### 3. **No-Trade RSI Zone**
A critical safeguard is the **“No-Trade Zone”**, defined by specific RSI thresholds.
When RSI is too low (oversold) or too high (overbought), traders are often tempted to act impulsively — either out of fear or greed.
By preventing entries during these phases, the indicator helps traders **avoid psychological traps** such as:
* Chasing reversals prematurely.
* Getting caught in continuation moves driven by crowd emotion.
It reinforces a mindset of **restraint** and **selective participation**.
---
#### 4. **Time-Based Discipline Filter**
The session filters allow trading only within designated market hours (for example, morning and afternoon sessions).
This enforces **structured activity**, reducing exposure to low-volume, erratic periods when decision fatigue or overtrading tendencies often arise.
It mirrors the behavior of professional traders who work within time-framed playbooks rather than emotional impulses.
---
### 🟢 **Buy Logic**
Buy opportunities arise when:
* Downward momentum (Aroon Down) weakens near the target level,
* RSI behavior supports balanced momentum or mild recovery, and
* Emotional extremes are absent.
This combination reflects a **calm, data-driven reversal environment**, ideal for contrarian but controlled entries.
---
### 🔴 **Sell Logic**
Sell signals appear when:
* Upward momentum (Aroon Up) softens around the target,
* RSI confirms slowing bullish pressure, and
* Market sentiment shows fatigue without panic.
It aligns with a **psychologically sound exit or shorting scenario**, avoiding reactionary decisions.
---
### 🧩 **Psychological Philosophy**
This tool isn’t just a signal generator — it’s a **trader’s behavioral framework**.
By combining structured logic, volatility filters, and emotional control zones, it helps cultivate:
* **Patience** to wait for qualified setups.
* **Confidence** to act when all conditions align.
* **Detachment** from impulsive market movements.
It transforms trading from a reactive habit into a **strategic execution process** rooted in logic and emotional balance.
---

Aroon ADX/DIUnified trend-strength (ADX/DI) + trend-age (Aroon) with centered scaling, gated signals, regime tints, and a compact readout.
What is different about this script:
- Purpose-built mashup of ADX/DI tells trend strength and side, while Aroon Oscillator tracks trend emergence/aging. Combining them into a scaled chart creates a way to separate “strong-but-late” trends from “newly-emerging” ones.
- Unified scale: Centering the maps into a common +/- 100 range so all lines are directly comparable at a glance (no units mismatch or fumbling with scales).
- Signal quality gating: DI cross signals can be gated by minimum ADX so crosses in chop are filtered out.
- Regime context: Background tints show low-strength chop, developing, and strong regimes using your ADX thresholds.
- Operator-focused UI: Clean fills, color-blind palette, and a two-column table summarizing DI+, DI−, ADX, Aroon, and a plain-English Bias/Trend status.
How it works:
- DI+/DI−/ADX: Wilder’s DI is smoothed; DX → ADX via SMA smoothing.
- Aroon Oscillator: highlights new highs/lows frequency to infer trend
- Centering: Maps DI/ADX from 5-95 and ±100, with your Midpoint controlling where “0” sits in raw mode.
- Signals:
- Bullish/Bearish DI crosses, optionally allowed only when ADX ≥ Min.
- ADX crosses of your Low/High thresholds.
- Aroon crosses of 0, +80, −80 (fresh trend thresholds).
- Display aids: Optional fill between DI+/DI−; thin guides for thresholds; single-pane table summary.
How to use:
- For this to be useful, centering should stay on, modify ADX Low/High and monitor DI crosses with ADX.
- Interpretations:
Bias: DI+ above DI− = bull; below = bear.
Strength level: ADX < Low = chop, Low–High = developing, > High = strong.
Freshness: Aroon > +80 or crossing up 0 suggests new or continued bull push; < −80 or crossing down 0 suggests new or continued bear push.
- Alerts: Use built-ins for DI crosses, ADX regime changes, and Aroon thresholds.

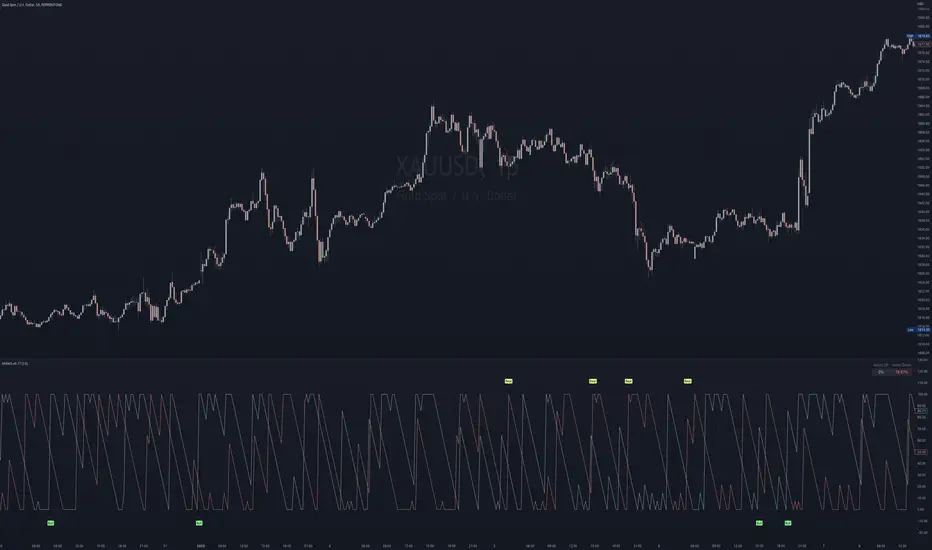
Aroon with RSI Confirmation (92.86%)This script is an analytical tool designed to identify moments in market behavior when price momentum is shifting. It does this by combining two concepts: **Aroon Levels** (to measure trend maturity) and **RSI Slope Behavior** (to measure short-term momentum pressure).
**Functional Concept (Professional Description)**
The indicator examines when either the *Aroon Up* or *Aroon Down* value reaches approximately **92.86%**, which statistically represents a phase where price has recently made an extreme high or low relative to the selected period. This level suggests the trend is nearing a point of *decision*—either continuation or exhaustion.
At the same time, the script analyzes the **relationship between the RSI and its smoothed average**. The difference between the two reflects whether momentum is accelerating in the current direction or slowing. A small difference indicates **market stability**, while whether RSI is positioned above or below the smoothed line indicates **who has control**—buyers or sellers.
By requiring both conditions to align, the script filters out random noise and highlights moments where **trend structure and momentum sentiment converge**.
* **Buy Signal:** Occurs when the market has recently formed a significant low (Aroon Down ≈ 92.86) and buyers begin to regain control (RSI crosses above its smoothed value with low volatility).
* **Sell Signal:** Occurs when the market has recently reached a significant high (Aroon Up ≈ 92.86) and sellers begin to dominate (RSI slips below its smoothed value with low volatility).
---
**Psychological Interpretation**
Markets are driven by cycles of **attention**, **emotion**, and **participation**.
This script targets moments when:
1. **Price has made a meaningful extreme** (a recent new high or low).
This is where crowd sentiment is often strongest—either euphoria near highs or pessimism near lows.
2. **Traders are reassessing direction**, shown by momentum flattening (small RSI difference).
This reveals that participants are hesitating, watching, and waiting.
The market is effectively *thinking*.
3. **Control shifts subtly**, when RSI moves relative to its smoothed trend.
This indicates that early, informed participation is beginning to form—before the broader crowd reacts.
In psychological terms, the script highlights the **transitional turning points** where:
* Fear begins to weaken and confidence returns (buy setup), or
* Confidence begins to crumble and caution emerges (sell setup).
These are the earliest moments when market sentiment **changes hands**, often preceding visible trend reversals. The indicator is not reacting to outcomes—it is observing the underlying shift in **decision-making pressure** among market participants.
---
In essence, this tool identifies **behavioral inflection points**—where the market transitions from one emotional state to the next—providing traders with signals grounded in both structural trend positioning and real-time crowd momentum behavior.

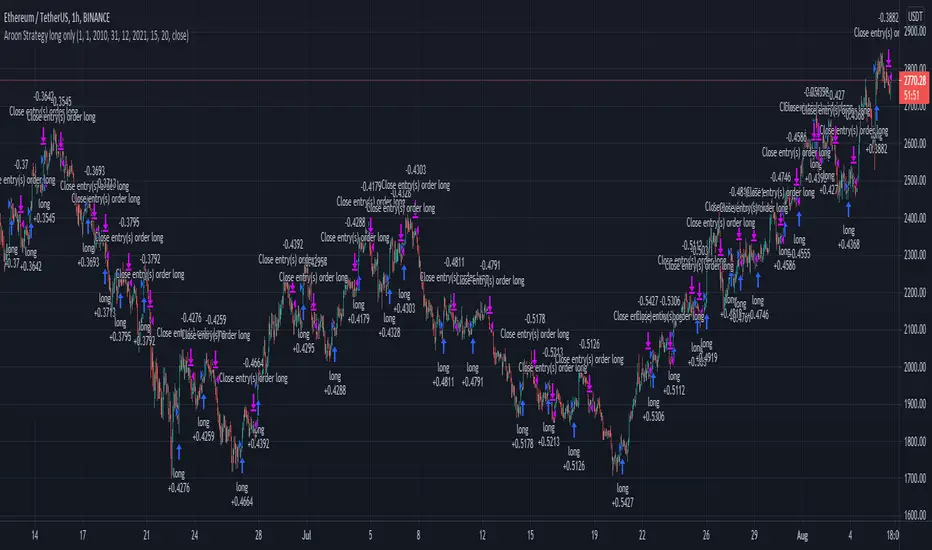
Aroon Strategy long onlyThis is a simple long only strategy made of Aroon and Least Square moving average.
The rules are simple:
Long entry = crossover of upper part with the lower part from aroon and close of the candle is above the moving average
Long exit = crossunder of upper part with the lower part from aroon and close of the candle is below the moving average
IF you have any questions let me know !
Aroon Indicator New with Middle Line @ BashiThis Indicator Includes 50 , 30 and 70 Line which you can use for determine the trend strongness.

Aroon Crossing Alerts This script sends alerts when the aroon lines cross each other, the messages are in Spanish.
Time Price IndicatorIntroduction
There are already several indicators who measure the time behavior relative to price, the most well know being the Aroon indicator published by Tushar Chande. I propose an alternative indicator TPI who tend to create less whipsaw's at the cost of small reactivity.
The Indicator
The TPI is in a range of 0.5/-0.5 and is no different than the Aroon indicator when it come to signal generation, when the upper line (in blue) crossover the lower line (in orange) the indicator generate a buy signal, when the lower line cross under the upper line a sell signal is generated.
Comparison
The Aroon indicator tend to use more information which involve more reactivity but more uncertainty as well.
Aroon and TPI with both length = 50. White lines represent signals where the Aroon and my proposed indicator react at the same time, the red line show a whipsaw and the green line show a signal generated faster by the Aroon.
Here is a more pertinent exemple
Aroon reacted to price range which at the end involved many whipsaw, the TPI however stayed on a sell signal and did not reacted to this price range. The cost to avoid so many whipsaw was a reactivity of 7 bars back when the sell signal of the TPI was generated.
A statistic of the signal numbers generated by both indicator is shown below
The blue line show the number of signals generated by the Aroon indicator and in orange the number generated by the TPI with both length = 14. Aroon generated 410 while the TPI generated 288 signals.
Conclusion
The Aroon indicator and TPI can both generate a signal at the same time or with a small period deviation with the ability of the TPI to avoid some whipsaw.

APEX - Aroon / Aroon Oscillator [v1]Simple Script that combines Aroon and Aroon Oscillator with MTF functionality for APEX.
Aroon
The Aroon also know as Aroon Up/Down will help you determine the trend of the asset of if the asset is ranging. The indicator consists of two lines the AroonDown and the Aroon Up.When Aroon Up reaches 100, a new uptrend may have begun. If it remains persistently between 70 and 100, and the Aroon-Down remains between 0 and 30, then a new uptrend is underway.If the Aroon-Up crosses above the Aroon-Down, then a new uptrend may start soon. Conversely, if Aroon-Down crosses above the Aroon-Up, then a new downtrend may start soon. When Aroon-Up reaches 100, a new uptrend may have begun. If it remains persistently between 70 and 100, and the Aroon-Down remains between 0 and 30, then a new uptrend is underway.
Aroon Oscillator
The Aroon Oscillator is the difference between Aroon-Up and Aroon-Down. These two indicators are usually plotted together for easy comparison, but chartists can also view the difference between these two indicators with the Aroon Oscillator. This indicator fluctuates between -100 and +100 with zero as the middle line. An upward trend bias is present when the oscillator is positive, while a downward trend bias exists when the oscillator is negative.

Configurable BB+RSI+Aroon strategy backtest for binary optionsI wanted to share this strategy that I use myself for binary options trading. After trading binary options for several years I have learned that every single day is unique... assets behave differently every single day. So, when I start the day I want to know which is the optimum combination of parameters in my indicators that will give me the signals I want during the day and I get that by doing a quick backtest of the parameters combination in a specific asset that same day. When trading Binary Options I usually do 3 or 4 trades max per day and, yes, there are moments in which even with the right backtest data the signals fail (I strongly believe that there is no strategy that guarantees 100% success in any type of trade, and this one here is not an exception - but has worked well with some assets). So, here is my contribution to improve your productivity by automating a bit that backtesting part.
How this script works?
It is a simple price crossunder / crossover Bollinger Bands (BB) with a confirmation from RSI overbought / oversold signals and a fast Aroon. You will see the BB plotted with its confirmations:
(1) a blue circle that plots in the chart when the price is coming back inside the channel (within the Bollinger Bands)
(2) an orange square that plots in the chart when the RSI is coming back from the overbought or oversold areas
(3) a triangle that could be red or green depending on the Aroon confirmation: Red if Aroon Down is crossing down Aroon Up or green if vice versa.
The strategy will call for long (Call) if:
(1) the price is crossing over the lower band of the Bollinger Bands, coming back inside the channel
(2) Aroon Up is crossing or has crossed above Aroon Down
(3) RSI is crossing over the oversold limit
Consequently, the strategy will call for a short (Put) if:
(1) the price is crossing down the upper band of the Bollinger Bands, coming back inside the channel
(2) Aroon Down is crossing or has crossed below Aroon Up
(3) RSI is crossing under the overbought limit
You can configure:
1. Aroon length (keep it as fast as possible: 3, 4 or 5 are recommended values)
2. The point where Aroon Up and Aroon Down cross to make the signal valid (50 is by default. It could also be 25 or 75)
3. The RSI length
4. RSI Overbought and Oversold limits (they do not need to be symmetric: you can use 29 and 93, for example)
5. Bollinger Bands length and standard deviation
6. Number of bars to keep your option open. Depending on the timeframe used, this will determine the time you will keep your binary option open. If you are in a 1 min chart and keep this parameter in 3, then you will need to configure your binary option to expire in 3 minutes.
How to evaluate your backtest?
In Binary Options you only need the success rate, so what I do is that when I am manually updating the parameters I keep my strategy tester window open checking the winning trades vs losing trades ratio ("Percent Profitable"). I personally will only keep an asset monitored looking for signals that day if the Percent Profitable on the backtest of the same day is above 80%.
Regarding the code: it is open, public and free. No need to ask for permission if you want to copy+paste and use it in whole or parts.
Happy pip hunting!
-marco

Arron Meter With Alerts [Skiploss]Arron Meter With Alerts is an indicator to identify the trend, and a meter shows the percentage of AroonUP and AroonDown.
Alert Settings
It will be part of a display of bullish and bearish signals by using the condition of the upper line cross lower line and HMA 200 cross under/over EMA 12, and also upper/lower line must be higher than 70%
[blackcat] L2 Aroon13Level 2
Background
The Aroon indicator developed by Tushar Chanand indicates whether there is a trend price or is located in a trading area.
Function
Classical Aroon can also show the beginning of a new trend, its strength and expectation of changes from trade areas to trends. This is a traditional aroon indicator with length == 13, which exhibit good performance.
Remarks
Feedbacks are appreciated.

Zig Zag + Aroon StrategyBelow is a trading strategy that combines the Zig Zag indicator and the Aroon indicator. This combination can help identify trends and potential reversal points.
Zig Zag and Aroon Strategy Overview
Zig Zag Indicator:
The Zig Zag indicator helps to identify significant price movements and eliminates smaller fluctuations. It is useful for spotting trends and reversals.
Aroon Indicator:
The Aroon indicator consists of two lines: Aroon Up and Aroon Down. It measures the time since the highest high and the lowest low over a specified period, indicating the strength of a trend.
Strategy Conditions
Long Entry Conditions:
Aroon Up crosses above Aroon Down (indicating a bullish trend).
The Zig Zag indicator shows an upward movement (indicating a potential continuation).
Short Entry Conditions:
Aroon Down crosses above Aroon Up (indicating a bearish trend).
The Zig Zag indicator shows a downward movement (indicating a potential continuation).
Exit Conditions:
Exit long when Aroon Down crosses above Aroon Up.
Exit short when Aroon Up crosses above Aroon Down.

Trend Deviation strategy - BTC [IkkeOmar]Intro:
This is an example if anyone needs a push to get started with making strategies in pine script. This is an example on BTC, obviously it isn't a good strategy, and I wouldn't share my own good strategies because of alpha decay.
This strategy integrates several technical indicators to determine market trends and potential trade setups. These indicators include:
Directional Movement Index (DMI)
Bollinger Bands (BB)
Schaff Trend Cycle (STC)
Moving Average Convergence Divergence (MACD)
Momentum Indicator
Aroon Indicator
Supertrend Indicator
Relative Strength Index (RSI)
Exponential Moving Average (EMA)
Volume Weighted Average Price (VWAP)
It's crucial for you guys to understand the strengths and weaknesses of each indicator and identify synergies between them to improve the strategy's effectiveness.
Indicator Settings:
DMI (Directional Movement Index):
Length: This parameter determines the number of bars used in calculating the DMI. A higher length may provide smoother results but might lag behind the actual price action.
Bollinger Bands:
Length: This parameter specifies the number of bars used to calculate the moving average for the Bollinger Bands. A longer length results in a smoother average but might lag behind the price action.
Multiplier: The multiplier determines the width of the Bollinger Bands. It scales the standard deviation of the price data. A higher multiplier leads to wider bands, indicating increased volatility, while a lower multiplier results in narrower bands, suggesting decreased volatility.
Schaff Trend Cycle (STC):
Length: This parameter defines the length of the STC calculation. A longer length may result in smoother but slower-moving signals.
Fast Length: Specifies the length of the fast moving average component in the STC calculation.
Slow Length: Specifies the length of the slow moving average component in the STC calculation.
MACD (Moving Average Convergence Divergence):
Fast Length: Determines the number of bars used to calculate the fast EMA (Exponential Moving Average) in the MACD.
Slow Length: Specifies the number of bars used to calculate the slow EMA in the MACD.
Signal Length: Defines the number of bars used to calculate the signal line, which is typically an EMA of the MACD line.
Momentum Indicator:
Length: This parameter sets the number of bars over which momentum is calculated. A longer length may provide smoother momentum readings but might lag behind significant price changes.
Aroon Indicator:
Length: Specifies the number of bars over which the Aroon indicator calculates its values. A longer length may result in smoother Aroon readings but might lag behind significant market movements.
Supertrend Indicator:
Trendline Length: Determines the length of the period used in the Supertrend calculation. A longer length results in a smoother trendline but might lag behind recent price changes.
Trendline Factor: Specifies the multiplier used in calculating the trendline. It affects the sensitivity of the indicator to price changes.
RSI (Relative Strength Index):
Length: This parameter sets the number of bars over which RSI calculates its values. A longer length may result in smoother RSI readings but might lag behind significant price changes.
EMA (Exponential Moving Average):
Fast EMA: Specifies the number of bars used to calculate the fast EMA. A shorter period results in a more responsive EMA to recent price changes.
Slow EMA: Determines the number of bars used to calculate the slow EMA. A longer period results in a smoother EMA but might lag behind recent price changes.
VWAP (Volume Weighted Average Price):
Default settings are typically used for VWAP calculations, which consider the volume traded at each price level over a specific period. This indicator provides insights into the average price weighted by trading volume.
backtest range and rules:
You can specify the start date for backtesting purposes.
You can can select the desired trade direction: Long, Short, or Both.
Entry and Exit Conditions:
LONG:
DMI Cross Up: The Directional Movement Index (DMI) indicates a bullish trend when the positive directional movement (+DI) crosses above the negative directional movement (-DI).
Bollinger Bands (BB): The price is below the upper Bollinger Band, indicating a potential reversal from the upper band.
Momentum Indicator: Momentum is positive, suggesting increasing buying pressure.
MACD (Moving Average Convergence Divergence): The MACD line is above the signal line, indicating bullish momentum.
Supertrend Indicator: The Supertrend indicator signals an uptrend.
Schaff Trend Cycle (STC): The STC indicates a bullish trend.
Aroon Indicator: The Aroon indicator signals a bullish trend or crossover.
When all these conditions are met simultaneously, the strategy considers it a favorable opportunity to enter a long trade.
SHORT:
DMI Cross Down: The Directional Movement Index (DMI) indicates a bearish trend when the negative directional movement (-DI) crosses above the positive directional movement (+DI).
Bollinger Bands (BB): The price is above the lower Bollinger Band, suggesting a potential reversal from the lower band.
Momentum Indicator: Momentum is negative, indicating increasing selling pressure.
MACD (Moving Average Convergence Divergence): The MACD line is below the signal line, signaling bearish momentum.
Supertrend Indicator: The Supertrend indicator signals a downtrend.
Schaff Trend Cycle (STC): The STC indicates a bearish trend.
Aroon Indicator: The Aroon indicator signals a bearish trend or crossover.
When all these conditions align, the strategy considers it an opportune moment to enter a short trade.
Disclaimer:
THIS ISN'T AN OPTIMAL STRATEGY AT ALL! It was just an old project from when I started learning pine script!
The backtest doesn't promise the same results in the future, always do both in-sample and out-of-sample testing when backtesting a strategy. And make sure you forward test it as well before implementing it!
Furthermore this strategy uses both trend and mean-reversion systems, that is usually a no-go if you want to build robust trend systems .
Don't hesitate to comment if you have any questions or if you have some good notes for a beginner.

A Multi 10 indicatorREAD NOTE BEFORE APPLYING or you may think indicator doesnt work.
This indicator is a revise of another i made and contains 10 Optional Indicators allowing you to load more then 3 indicators at once if you so choose and dont pay for the platform!
Hopefully someone will find use for this script besides me :) I dont suggest turning all on at once because it
will not look right. Alot will overlap if you wish but i only use the Session and trend bar at once in
conjuction with a Oscillator setting like MacD , RSI , Stoch , Aroon or CCI .
In the chart you see i only have a few indicators active ENJOY!!
---------- NOTE ----------- ( Everything is OFF by default and indicator SHOULD show up BLANK when loaded) ------------ NOTE -------------
(Can turn EVERYTHING on AND change any values in the format tab once indicator loads)
NY session, Aussie session, Asian session, and Europe market sessions.
MacD Split Colored , aroon oscillator
CCI Oscillator , classic aroon
RSI Oscillator , Elliot wave
Stoch RSI Oscillator
Aroon Oscillator
My own Trend bar
---------- NOTE ----------- ( Everything is OFF by default and indicator SHOULD show up BLANK when loaded) ------------ NOTE -------------
(Can turn EVERYTHING on AND change any values in the format tab once indicator loads) CODE probably looks messey but this is something i made for me so i didnt really care lol
