Super momentum DBSISuper momentum DBSI: The Ultimate Guide
1. What is this Indicator?
The Super momentum DBSI is a "Consensus Engine." Instead of relying on a single line (like an RSI) to tell you where the market is going, this tool calculates 33 distinct technical indicators simultaneously for every single candle.
It treats the market like a democracy. It asks 33 mathematical "voters" (Momentum, Trend, Volume, Volatility) if they are Bullish or Bearish.
If 30 out of 33 say "Buy," the score is high (Yellow), and the trend is extremely strong.
If only 15 say "Buy," the score is low (Teal), and the trend is weak or choppy.
2. Visual Guide: How to Read the Numbers
The Scores
Top Number (Bears): Represents Selling Pressure.
Bottom Number (Bulls): Represents Buying Pressure.
The Colors (The Traffic Lights)
The colors are your primary signal. They tell you who is currently winning the war.
🟡 YELLOW (Dominance):
This indicates the Winning Side.
If the Bottom Number is Yellow, Bulls are in control.
If the Top Number is Yellow, Bears are in control.
🔴 RED (Weakness):
This appears on the Top. It means Bears are present but losing.
🔵 TEAL (Weakness):
This appears on the Bottom. It means Bulls are present but losing.
3. Trading Strategy
Scenario A: The "Strong Buy" (Long Entry)
The Setup: You are looking for a shift in momentum where Buyers overwhelm Sellers.
Watch the Bottom Number: Wait for it to turn Yellow.
Confirm Strength: Ensure the score is above 15 and rising (e.g., 12 → 18 → 22).
Check the Top: The Top Number should be Red and low (below 10).
Trigger: Enter on the candle close.
Scenario B: The "Strong Sell" (Short Entry)
The Setup: You are looking for Sellers to crush the Buyers.
Watch the Top Number: Wait for it to turn Yellow.
Confirm Strength: Ensure the score is above 15 and rising.
Check the Bottom: The Bottom Number should be Teal and low.
Trigger: Enter on the candle close.
Scenario C: The "No Trade Zone" (Choppy Market)
The Setup: The market is confused.
Visual: Top is Red, Bottom is Teal.
Meaning: NOBODY IS WINNING. There is no Yellow number.
Action: Do not trade. This usually happens during lunch hours, weekends, or right before big news. This filter alone will save you from many false breakouts.
4. What is Inside? (The 33 Indicators)
To give you confidence in the signals, here is exactly what the script is checking:
Group 1: Momentum (Oscillators)
Detects if price is moving fast.
RSI (Relative Strength Index)
CCI (Commodity Channel Index)
Stochastic
Williams %R
Momentum
Rate of Change (ROC)
Ultimate Oscillator
Awesome Oscillator
True Strength Index (TSI)
Stoch RSI
TRIX
Chande Momentum Oscillator
Group 2: Trend Direction
Detects the general path of the market.
13. MACD
14. Parabolic SAR
15. SuperTrend
16. ALMA (Moving Average)
17. Aroon
18. ADX (Directional Movement)
19. Coppock Curve
20. Ichimoku Conversion Line
21. Hull Moving Average
Group 3: Price Action
Detects where price is relative to averages.
22. Price vs EMA 20
23. Price vs EMA 50
24. Price vs EMA 200
Group 4: Volume & Force
Detects if there is money behind the move.
25. Money Flow Index (MFI)
26. On Balance Volume (OBV)
27. Chaikin Money Flow (CMF)
28. VWAP (Intraday)
29. Elder Force Index
30. Ease of Movement
Group 5: Volatility
Detects if price is pushing the outer limits.
31. Bollinger Bands
32. Keltner Channels
33. Donchian Channels
5. Pro Tips for Success
Don't Catch Knives: If the Bear score (Top) is Yellow and 25+, do not try to buy the dip. Wait for the Yellow score to break.
Exit Early: If you are Long and the Yellow Bull score drops from 28 to 15 in one candle, TAKE PROFIT. The momentum has died.
Use Higher Timeframes: This indicator works best on 15m, 1H, and 4H charts. On the 1m chart, it may be too volatile.
Cerca negli script per "aroon"

BTC Supply in Profits and Losses (BTCSPL) [AlgoAlpha]Description:
🚨The BTC Supply in Profits and Losses (BTCSPL) indicator, developed by AlgoAlpha, offers traders insights into the distribution of INDEX:BTCUSD addresses between profits and losses based on INDEX:BTCUSD on-chain data.
Features:
🔶Alpha Decay Adjustment: The indicator provides the option to adjust the data against Alpha Decay, this compensates for the reduction in clarity of the signal over time.
🔶Rolling Change Display: The indicator enables the display of the rolling change in the distribution of Bitcoin addresses between profits and losses, aiding in identifying shifts in market sentiment.
🔶BTCSPL Value Score: The indicator optionally displays a value score ranging from -1 to 1, traders can use this to carry out strategic dollar cost averaging and reverse dollar cost averaging based on the implied value of bitcoin.
🔶Reversal Signals: The indicator gives long-term reversal signals denoted as "▲" and "▼" for the price of bitcoin based on oversold and overbought conditions of the BTCSPL.
🔶Moving Average Visualization: Traders can choose to display a moving average line, allowing for better trend identification.
How to Use ☝️ (summary):
Alpha Decay Adjustment: Toggle this option to enable or disable Alpha Decay adjustment for a normalized representation of the data.
Moving Average: Toggle this option to show or hide the moving average line, helping traders identify trends.
Short-Term Trend: Enable this option to display the short-term trend based on the Aroon indicator.
Rolling Change: Choose this option to visualize the rolling change in the distribution between profits and losses.
BTCSPL Value Score: Activate this option to show the BTCSPL value score, ranging from -1 to 1, 1 implies that bitcoin is extremely cheap(buy) and -1 implies bitcoin is extremely expensive(sell).
Reversal Signals: Gives binary buy and sell signals for the long term

Risk Reward Optimiser [ChartPrime]█ CONCEPTS
In modern day strategy optimization there are few options when it comes to optimizing a risk reward ratio. Users frequently need to experiment and go through countless permutations in order to tweak, adjust and find optimal in their data.
Therefore we have created the Risk Reward Optimizer.
The Risk Reward Optimizer is a technical tool designed to provide traders with comprehensive insights into their trading strategies.
It offers a range of features and functionalities aimed at enhancing traders' decision-making process.
With a focus on comprehensive data, it is there to help traders quickly and efficiently locate Risk Reward optimums for inbuilt of custom strategies.
█ Internal and external Signals:
The script can optimize risk to reward ratio for any type of signals
You can utilize the following :
🔸Internal signals ➞ We have included a number of common indicators into the optimizer such as:
▫️ Aroon
▫️ AO (Awesome Oscillator)
▫️ RSI (Relative Strength Index)
▫️ MACD (Moving Average Convergence Divergence)
▫️ SuperTrend
▫️ Stochastic RSI
▫️ Stochastic
▫️ Moving averages
All these indicators have 3 conditions to generate signals :
Crossover
High Than
Less Than
🔸External signal
▫️ by incorporating your own indicators into the analysis. This flexibility enables you to tailor your strategy to your preferences.
◽️ How to link your signal with the optimizer:
In order to be able to analysis your signal we need to read it and to do so we would need to PLOT your signal with a defined value
plot( YOUR LONG Condition ? 100 : 0 , display = display.data_window)
█ Customizable Risk to Reward Ratios:
This tool allows you to test seven different customizable risk to reward ratios , helping you determine the most suitable risk-reward balance for your trading strategy. This data-driven approach takes the guesswork out of setting stop-loss and take-profit levels.
█ Comprehensive Data Analysis:
The tool provides a table displaying key metrics, including:
Total trades
Wins
Losses
Profit factor
Win rate
Profit and loss (PNL)
This data is essential for refining your trading strategy.
🔸 It includes a tooltip for each risk to reward ratio which gives data for the:
Most Profitable Trade USD value
Most Profitable Trade % value
Most Profitable Trade Bar Index
Most Profitable Trade Time (When it occurred)
Position and size is adjustable
█ Visual insights with histograms:
Visualize your trading performance with histograms displaying each risk to reward ratio trade space, showing total trades, wins, losses, and the ratio of profitable trades.
This visual representation helps you understand the strengths and weaknesses of your strategy.
It offers tooltips for each RR ratio with the average win and loss percentages for further analysis.
█ Dynamic Highlighting:
A drop-down menu allows you to highlight the maximum values of critical metrics such as:
Profit factor
Win rate
PNL
for quick identification of successful setups.
█ Stop Loss Flexibility:
You can adjust stop-loss levels using three different calculation methods:
ATR
Pivot
VWAP
This allows you to align risk-reward ratios with your preferred risk tolerance.
█ Chart Integration:
Visualize your trades directly on your price chart, with each trade displayed in a distinct color for easy tracking.
When your take-profit (TP) level is reached , the tool labels the corresponding risk-reward ratio for that specific TP, simplifying trade management.
█ Detailed Tooltips:
Tooltips provide deeper insights into your trading performance. They include information about the most profitable trade, such as the time it occurred, the bar index, and the percentage gain. Histogram tooltips also offer average win and loss percentages for further analysis.
█ Settings:
█ Code:
In summary, the Risk Reward Optimizer is a data-driven tool that offers traders the ability to optimize their risk-reward ratios, refine their strategies, and gain a deeper understanding of their trading performance. Whether you're a day trader, swing trader, or investor, this tool can help you make informed decisions and improve your trading outcomes.

Multi indicators tableThis is a comprehensive trading tool that presents an overview of the market in a tabular format. It consists of five distinct categories of trading indicators : Volatility, Trend, Momentum, Reversal, and Volume. Each category includes a series of indicators that are widely used in the trading communauty.
The Volatility category includes the Average True Range (ATR) and Bollinger Bands indicators. The Trend category comprises the Average Directional Index (ADX), four Exponential Moving Averages (EMAs), Aroon, Parabolic SAR, and the Supertrend. The Momentum category includes the Stochastic Relative Strength Index (StochRSI), Money Flow Index (MFI), Williams %R, Relative Strength Index (RSI), and Commodity Channel Index (CCI). The Reversal category includes Parabolic SAR, Moving Average Convergence Divergence (MACD), and PP Supertrend. Finally, the Volume category includes the Volume Exponential Moving Average (EMA) indicator.
The indicators states are easily readable, the indicator case is colored based on his actual state. A bullish color (green by default), a bearish color (red by default),
a very bullish color (dark green by default), a very bearish color (dark red by default) and a neutral color (gray by default) displayed when the indicator doesn't give us a clear signal. Some indicators do not have a very bullish or very bearish state. Concerning volatility indicators, the bullish color indicates high volatility, the bearish color indicates low volatility, and the neutral color indicates normal volatility.
Most of the indicators displayed in the table are customizable, and traders can choose to hide the categories they don't want to use. The Indicator provides a quick and easily readable view on the market and allows traders to reduce the number of indicators on their chart making it lighter and more readable.

Normalized Oscillators Spider Chart [LuxAlgo]This indicator displays a spider chart overlaid on the user’s current chart allowing the visualization of information given by various normalized oscillators. It is possible to customize the spider chart by hiding certain oscillators from within the settings which removes their corresponding spokes from the chart.
Users can control the length settings of each oscillator individually or use a global length setting that applies to every oscillator. An additional meter element is displayed and aims to give the overall sentiment returned by the oscillators. This can also be used to gauge whether the market is trending or ranging.
This is a relatively simple application of a spider chart but can prove to be useful to some users.
1. Settings
RSI: Displays the Relative Strength Index spoke on the spider chart, includes the length setting on the right of the toggle.
%K: Displays the Stochastic Oscillator "%K" spoke on the spider chart, includes the length setting on the right of the toggle.
COR: Displays the Correlation Oscillator spoke on the spider chart, includes the length setting on the right of the toggle.
MFI: Displays the Money Flow Index oscillator spoke on the spider chart, includes the length setting on the right of the toggle.
WPR: Displays the Williams Percent Rank oscillator spoke on the spider chart, includes the length setting on the right of the toggle.
%UP: Displays the percentage of upward variations spoke on the spider chart, includes the length setting on the right of the toggle.
CMO: Displays the Chande Momentum Oscillator spoke on the spider chart, includes the length setting on the right of the toggle.
AOS: Displays the Aroon oscillator spoke on the spider chart, includes the length setting on the right of the toggle.
Global Oscillators Length: Determines whether all oscillators should use the same length settings, determined by the setting on the right of the toggle.
1.1 Style Settings
Spider Chart Length: Determines the horizontal width of the spider chart.
Spider Chart Offset: Offset between the most recent bar and the left extremity of the spider chart.
2. Usage
A spider chart can be a very useful visualization tool when it comes to seeing the individual characteristics of various variables at the same time.
Here, the tool can give a general sentiment on the direction of the trend without adding each indicator to your chart. It is also possible to determine when an oscillator is considered overbought or oversold with this indicator.
The dashed line represents the central value for each oscillator.
Disabling any of the oscillators from the settings will return a spider chart using fewer spokes.
The script also displays a meter that can be used to determine the overall sentiment given by all oscillators. This metric is based on the average value between each oscillator. An overall sentiment closer to 50 would indicate a ranging market.

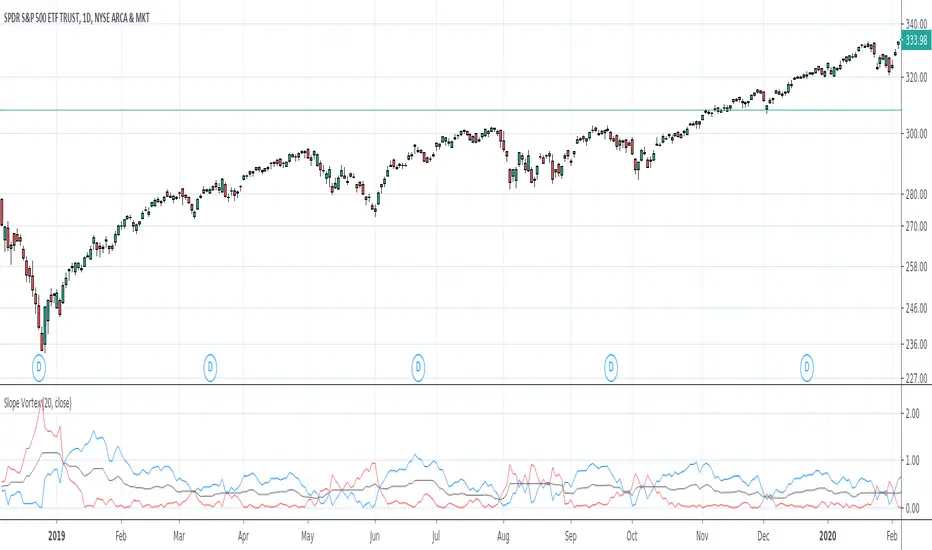
Slope VortexI stumbled upon creating this and thought it was cool and worth sharing. If anyone has ever dabbled with the Aroon or Vortex Indicators, there is some similarity to how it can be used visually.
The indicator basically takes two slopes from the trailing time period you indicate- one from the highest point in that time period, and one from the lowest point. It then plots both.
Here are some of the ways I think this indicator can be used--
Crossover This is the most obvious way, visually. If the blue line crosses under the red, an uptrend has ended or is testing support here. The opposite can be used as well. When the blue line crosses above the red an uptrend is starting or it is testing resistance.
Trending or Ranging If the two bands are moving away from each other/increasing the width between them, there is definite trending action going on. If the two are very narrow or keep crossing each other, whatever symbol you're looking at is likely ranging or consolidating. The black "midpoint" line can also be used to help identify-- if this line is moving up, regardless of if the blue or red band is above, the trend has momentum; if it is going down or flat the previous trend is either slowing greatly or we are ranging.
Support & Resistance Crosses can identify meaningful support and resistance. Having both lines kiss or get very close to the black midpoint line but not cross can also indicate S/R or confirm trend strength.
Here are some snippets of examples I outlined-
I purposely kept this indicator as clean and simple as possible for publication. But I already have tinkered around with taking the output and putting it through the likes of RSI, Stoch, etc. and I think the outcomes are pretty intriguing as well for something so simple. I think dropping the length too much makes it too noisy, so 20, 50, 100 look most useful.

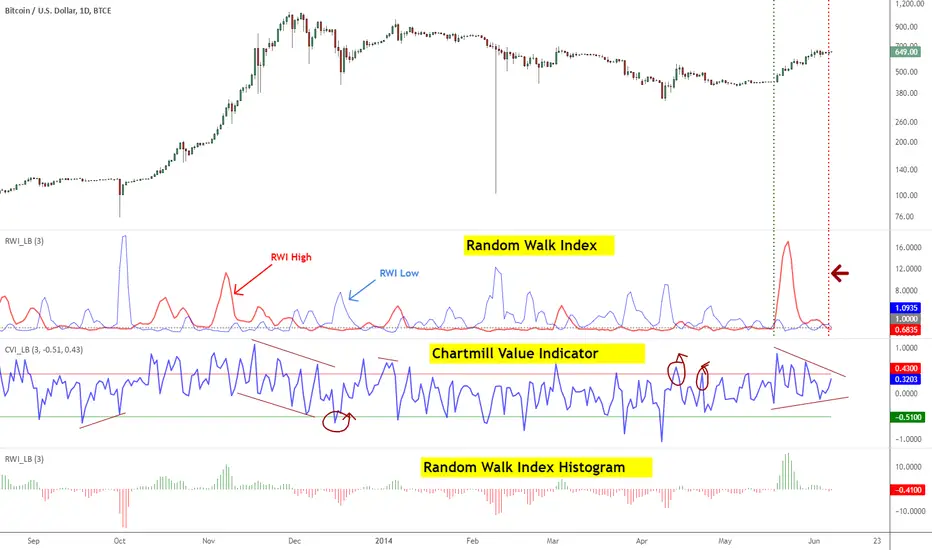
Indicators: Chartmill Value Indicator & Random Walk IndexChartMill Value Indicator & Modified ChartMill Value Indicator :
-------------------------------
Developed by Dirk Vandycke, CVI tracks how far the price spread is from its MA. Since MA keeps increasing even when price consolidates or stalls, it is very difficult for the deviation from a moving average to remain in the overbought or oversold regions for extended periods, which represents a significant improvement over other oscillators such as the RSI and Stochastic indicators.
However, a simple price spread from a moving average would not be comparable across all securities, which would preclude us from using the spread in systematic strategies. Fortunately, Mr.Vandycke addresses this problem by dividing the spread by the average true range, which is dependent on both the price level and volatility of the underlying security.
There is a variation of CVI called Modified CVI, which does time normalization of ATR (not the MA). This indicator supports displaying "Modified CVI" too. Check the options page.
This indicator is best used with other oscillators, to confirm signals. Zero line (in this case, "1" line since the gray line is drawn at the value of 1) crossovers should also be considered as signals.
I suggest tuning the OB/OS levels to match your instrument (usually it is around 0.5/-0.5 range).
More info:
www.traders.com
Random Walk Index
-------------------------
RWI is used to determine if an issue is trending or in a random trading range (like ADX/Aroon). It attempts to do this by first determining an issue's trading range. The next step is to calculate a series of RWI indexes for the maximum look-back period. The largest index move in relation to a random walk is used as today's index.
Michael Poulos, inventor of RWI, recommends 2 to 7 for the short-term time frames and 8-64 for long terms. An issue is trending higher if the long term RWI of highs is greater than 1, while a downtrend is indicated if the long term RWI of lows is greater than 1.
Below are some more rules developed by Mr.Poulos:
- Enter a long (or close short) when the long-term RWI of the highs is greater than 1 and the short-term RWI of lows peaks above 1
- Enter short (or close long) when the long-term RWI of the lows is greater than 1 and the short-term RWI of highs peaks above 1
More info:
- tradingsim.com
For displaying only the histogram (as shown in the bottom pane), select "ShowOnlyHistogram" in the options page.