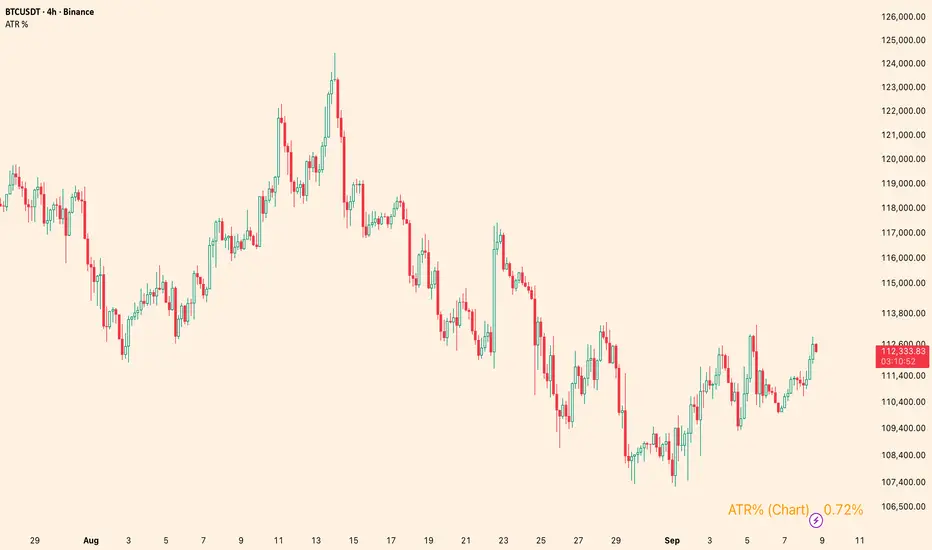
ATR %Overview
Shows the Average True Range (ATR) as a percentage of a chosen price basis. Useful for a quick, apples-to-apples view of current volatility across symbols and timeframes. The value is displayed in a clean table at the bottom-right of the chart.
What it shows
Basis can be: Close, EMA(len), SMA(len), or VWAP.
Data timeframe can be the Chart timeframe or a Daily aggregation.
Inputs
ATR length (len) – ATR lookback.
Percent basis – Close / EMA / SMA / VWAP.
Data timeframe – Chart (uses the current chart TF) or Daily (computes ATR and basis from daily data).
Decimals – number of decimal places to display.
Text / Background / Frame colors – customize the table appearance.
Notes
In Daily mode, ATR and basis are taken from daily data and update on daily close.
VWAP is available only in Chart mode (Daily + VWAP will show n/a by design).
The script overlays the chart but does not plot lines—only a compact info box.
Use cases
Compare volatility across coins/stocks quickly using ATR% instead of raw ATR.
Switch basis to match your style (e.g., EMA for trend-aware scaling, VWAP for intraday context).
Set Daily to track higher-timeframe volatility while trading lower TFs.
Disclaimer
For educational purposes only. Not financial advice. Trading involves risk.
Cerca negli script per "atr"
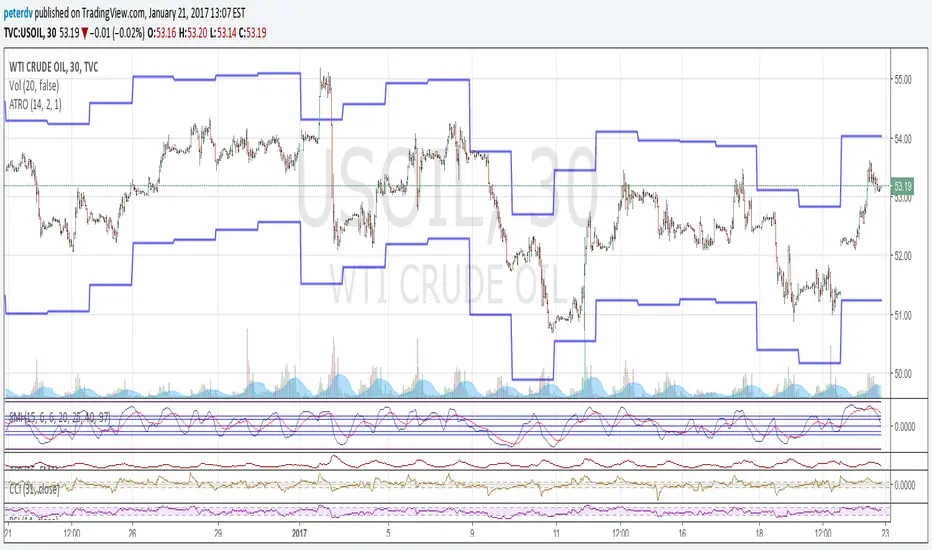
Average True Range OverlayPlots ATR calculated on a daily basis as an overlay on the current chart.
Implemented using the builtin atr function.
ATR is a volatility indicator
originally developed by J. Welles Wilder, Jr. for commodities:
New Concepts in Technical Trading Systems. Greensboro, NC: Trend Research. ISBN 978-0-89459-027-6.
The range of a day's trading is simply R = high − low.
The true range extends it to yesterday's closing price if it was outside of today's range:
TR = max
The average true range is an N-day smoothed moving average of the TR values.
A first stab at a sensible stop loss level might be 3*ATR below recent peak.
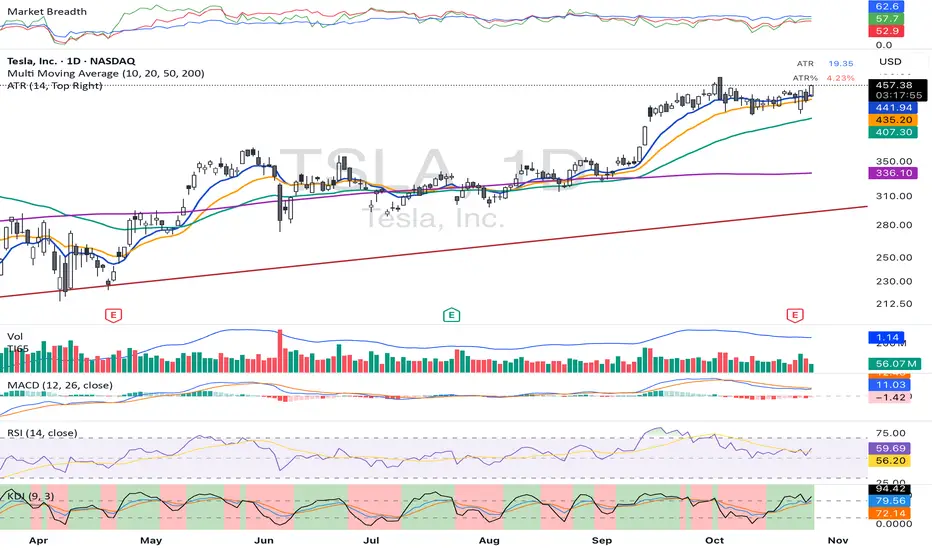
ATRThis script displays the Average True Range (ATR) value and the ATR as a percentage of the current closing price directly on the main chart as a clean table, with no lines or plots. It allows users to easily monitor both absolute volatility and its relative magnitude, making comparisons across different assets intuitive. The display position is customizable, offering flexibility for personal chart layouts. Ideal for traders seeking quick volatility insights, risk management guidance, or portfolio-wide comparisons.
ATR %plot ATR as percentage relative to close price and also shows normal ATR value in datawindow without printing it

Average True Range BandDraws bounds on the last candle showing the potential movement range basing on the ATR value.

ATR Strength Index~~~~~~~ATRRSI~~~~~~~~~
Understanding the ATR Strength IndexThe "ATR Strength Index" (ATR SI) is a custom technical indicator derived by applying the calculation methodology of the Relative Strength Index (RSI) to the values of the Average True Range (ATR).
While the standard RSI measures the momentum of price changes, the ATR SI measures the momentum of volatility itself, as represented by the ATR.It is important to note that this is not a standard, widely recognised indicator like the traditional RSI or ATR.
It's a custom construction designed to provide a different perspective on market dynamics – specifically, the speed and magnitude of changes in volatility.
How it is Calculated
The calculation of the ATR Strength Index follows the same steps as the standard RSI, but the input data is the ATR value for each period, rather than the price.Let ATRi be the Average True Range value for the current period i.Let ATRi−1 be the Average True Range value for the previous period i−1.Calculate the period-over-period change in ATR:ΔATRi=ATRi−ATRi−1Separate ATR Gains and ATR Losses:If ΔATRi>0, then ATR,Gaini=ΔATRi and ATR,Lossi=0.If ΔATRi<0, then ATR,Gaini=0 and ATR,Lossi=∣ΔATRi∣.If ΔATRi=0, then ATR,Gaini=0 and ATR,Lossi=0.Calculate the Smoothed Average ATR Gain and Average ATR Loss over a specified lookback period (let's call this the "RSI Length" or n).
This typically uses a smoothing method similar to Wilder's original RSI calculation (a modified moving average or exponential moving average).Average,ATR,Gainn=Smoothed Average of ATR,Gain over n periodsAverage,ATR,Lossn=Smoothed Average of ATR,Loss over n periodsCalculate the ATR Relative Strength (ATR RS):ATR,RSn=Average,ATR,LossnAverage,ATR,GainnCalculate the ATR Strength Index:ATR,SIn=100−1+ATR,RSn100The resulting index oscillates between 0 and 100, just like the standard RSI.
How to Use It
Interpreting the ATR Strength Index focuses on the momentum of volatility rather than price momentum:High Values (e.g., above 70): Indicate that volatility (as measured by ATR) has been increasing rapidly over the chosen period.
This could suggest a market transitioning from a period of low volatility to high volatility, potentially preceding or accompanying strong directional price moves or increased choppiness.Low Values (e.g., below 30): Indicate that volatility has been decreasing rapidly.
This could suggest a market transitioning from high volatility to low volatility, potentially entering a period of consolidation or ranging price action.Midline (50): Represents a balance between increasing and decreasing volatility momentum.Divergence: You could potentially look for divergence between the ATR value itself and the ATR Strength Index. For example, if ATR is making higher highs but the ATR SI is making lower highs, it might suggest that while volatility is still increasing, the speed of that increase is slowing down. The interpretation and reliability of such divergence would need careful testing.
This indicator is best used as a supplementary tool to gain insight into the underlying volatility dynamics of the market, rather than as a primary signal generator for price direction.
It can help in understanding the current market environment – whether volatility is picking up or dying down – which can inform the suitability of different trading strategies (e.g., trend-following strategies might be more effective when volatility momentum is high, while range-bound strategies might suit periods of low volatility momentum).
Uniqueness
The ATR Strength Index is unique because it applies a momentum oscillator's logic (RSI) to a volatility indicator's output (ATR).Standard RSI: Focuses on the directional force of price movements.Standard ATR: Measures the amount of volatility, regardless of direction.ATR Strength Index: Measures the speed and direction of change in volatility.
It provides a perspective that neither the standard RSI nor ATR offers on their own – a quantified measure of how quickly the market's choppiness or range is expanding or contracting. This can be valuable for traders who incorporate volatility analysis into their decision-making process.In summary, the ATR Strength Index is a custom indicator that adapts the RSI calculation to measure the momentum of volatility, offering a unique view on market dynamics by showing how rapidly volatility is increasing or decreasing.

ATR - Asymmetric Turbulence Ribbon🧭 Asymmetric Turbulence Ribbon (ATR)
The Asymmetric Turbulence Ribbon (ATR) is an enhanced and reimagined version of the standard Average True Range (ATR) indicator. It visualizes not just raw volatility, but the structure, momentum, and efficiency of volatility through a multi-layered visual approach.
It contains two distinct visual systems:
1. A zero-centered histogram that expresses how current volatility compares to its historical average, with intensity and color showing speed and conviction
2. A braided ribbon made of dual ATR-based moving averages that highlight transitions in volatility behavior—whether volatility is expanding or contracting
The name reflects its purpose: to capture asymmetric, evolving turbulence in market behavior, through structure-aware volatility tracking.
_______________________________________________________________
🔧 Inputs (Fibonacci defaults)
ATR Length
Lookback period for ATR calculation (default: 13)
ATR Base Avg. Length
Moving average period used as the zero baseline for histogram (default: 55)
ATR ROC Lookback
Number of bars to measure rate of change for histogram color mapping (default: 8)
Timeframe Override
Optionally calculate ATR values from a higher or fixed timeframe (e.g., 1D) for macro-volatility overlay
Show Ribbon Fill
Toggles colored fill between ATR EMA and HMA lines
Show ATR MAs
Toggles visibility of ATR EMA and HMA lines
Show Crossover Markers
Shows directional triangle markers where ATR EMA and HMA cross
Show Histogram
Toggles the entire histogram display
_______________________________________________________________
📊 Histogram Component: Volatility Energy Profile
The histogram shows how far the current ATR is from its moving average baseline, centered around zero. This lets you interpret volatility pressure—whether it's expanding, contracting, or preparing to reverse.
To complement this, the indicator also plots the raw ATR line in aqua. This is the actual average true range value—used internally in both the histogram and ribbon calculations. By default, it appears as a slightly thicker line, providing a clear reference point for comparing historical volatility trends and absolute levels.
Use the baseline ATR to:
- Compare real-time volatility to previous peaks or troughs
- Monitor how ATR behaves near histogram flips or ribbon crossovers
- Evaluate volatility phases in absolute terms alongside relative momentum
The ATR line is particularly helpful for users who want to keep tabs on raw volatility values while still benefiting from the enhanced visual storytelling of the histogram and ribbon systems.
Each histogram bar is colored based on the rate of change (ROC) in ATR: The faster ATR rises or falls, the more intense the color. Meanwhile, the opacity of each bar is adjusted by the effort/result ratio of the price candle (body vs. range), showing how much price movement was achieved with conviction.
Color Interpretation:
🔴 Red
Strong volatility expansion
Market entering or deepening into a volatility burst
Seen during breakouts, panic moves, or macro shock events
Often accompanied by large real candle bodies
🟠 Orange
Moderate volatility expansion
Heating up phase, often precedes breakouts
Common in strong trending environments
Signals tightening before acceleration
🟡 Yellow
Mild volatility increase
Transitional state—energy building, not yet exploding
Appears in early trend development or pullbacks
🟢 Green
Mild volatility contraction
ATR cooling off
Seen during consolidation, reversion, or range balance
Good time to assess upcoming directional setups
🔵 Aqua
Moderate compression
Volatility is clearly declining
Signals consolidation within larger structure
Pre-breakout zones often form here
🔵 Deep Blue
Strong volatility compression
Market is coiling or dormant
Can signal upcoming squeeze or fade environment
Often followed by sharp expansion
Opacity scaling:
Brighter bars = efficient, directional price action (strong bodies)
Faded bars = indecision, chop, absorption, or wick-heavy structure
Together, color and opacity give a 2D view of market volatility: Hue = the type and direction of volatility
Opacity = the quality and structure behind it
Use this to gauge whether volatility is rising with conviction, fading into neutrality, or compressing toward breakout potential.
_______________________________________________________________
🪡 Ribbon Component: Volatility Rhythm Structure
The ribbon overlays two moving averages of ATR:
EMA (yellow) – faster, more reactive
HMA (orange) – smoother, more rhythmic
Their relationship creates the ribbon logic:
Yellow fill (EMA > HMA)
Short-term volatility is increasing faster than the longer-term rhythm
Signals active expansion and engagement
Orange fill (HMA > EMA)
Volatility is decaying or leveling off
Suggests possible exhaustion, pullback, or range
Crossover triangle markers (optional, off by default to avoid clutter) identify the moment of shift in volatility phase.
The ribbon reflects the shape of volatility over time—ideal for mapping cyclical energy shifts, transitional states, and alignment between current and average volatility.
_______________________________________________________________
📐 Strategy Application
Use the Asymmetric Turbulence Ribbon to:
- Detect volatility expansions before breakouts or directional runs
- Spot compression zones that precede structural ruptures
- Visually separate efficient moves from noisy market activity
- Confirm or fade trade setups based on underlying energy state
- Track the volatility environment across multiple timeframes using the override
_______________________________________________________________
🎯 Ideal Timeframes
Designed to function across all timeframes, but particularly powerful on intraday to daily ranges (1H to 1D)
Use the timeframe override to anchor your chart in higher-timeframe volatility context, like daily ATR behavior influencing a 1H setup.
_______________________________________________________________
🧬 Customization Tips
- Increase ATR ROC Lookback for smoother color transitions
- Extend ATR Base Avg Length for more macro-driven histogram centering
- Disable the histogram for ribbon-only rhythm view
- Use opacity and color shifts in the histogram to detect stealth energy builds
- Align ATR phases with structure or order flow tools for high-quality setups

$TUBR: Stop Loss IndicatorATR-Based Stop Loss Indicator for TradingView by The Ultimate Bull Run Community: TUBR
**Overview**
The ATR-Based Stop Loss Indicator is a custom tool designed for traders using TradingView. It helps you determine optimal stop loss levels by leveraging the Average True Range (ATR), a popular measure of market volatility. By adapting to current market conditions, this indicator aims to minimize premature stop-outs and enhance your risk management strategy.
---
**Key Features**
- **Dynamic Stop Loss Levels**: Calculates stop loss prices based on the ATR, providing both long and short stop loss suggestions.
- **Customizable Parameters**: Adjust the ATR period, multiplier, and smoothing method to suit your trading style and the specific instrument you're trading.
- **Visual Aids**: Plots stop loss lines directly on your chart for easy visualization.
- **Alerts and Notifications** (Optional): Set up alerts to notify you when the price approaches or hits your stop loss levels.
---
**Understanding the Indicator**
1. **Average True Range (ATR)**:
- **What It Is**: ATR measures market volatility by calculating the average range between high and low prices over a specified period.
- **Why It's Useful**: A higher ATR indicates higher volatility, which can help you set stop losses that accommodate market fluctuations.
2. **ATR Multiplier**:
- **Purpose**: Determines how far your stop loss is placed from the current price based on the ATR.
- **Example**: An ATR multiplier of 1.5 means the stop loss is set at 1.5 times the ATR away from the current price.
3. **Smoothing Methods**:
- **Options**: Choose from RMA (default), SMA, EMA, WMA, or Hull MA.
- **Effect**: Different smoothing methods can make the ATR more responsive or smoother, affecting where the stop loss is placed.
---
**How the Indicator Works**
- **Long Stop Loss Calculation**:
- **Formula**: `Long Stop Loss = Close Price - (ATR * ATR Multiplier)`
- **Purpose**: For long positions, the stop loss is set below the current price to protect against downside risk.
- **Short Stop Loss Calculation**:
- **Formula**: `Short Stop Loss = Close Price + (ATR * ATR Multiplier)`
- **Purpose**: For short positions, the stop loss is set above the current price to protect against upside risk.
- **Plotting on the Chart**:
- **Green Line**: Represents the suggested stop loss level for long positions.
- **Red Line**: Represents the suggested stop loss level for short positions.
---
**How to Use the Indicator**
1. **Adding the Indicator to Your Chart**:
- **Step 1**: Copy the PineScript code of the indicator.
- **Step 2**: In TradingView, click on **Pine Editor** at the bottom of the platform.
- **Step 3**: Paste the code into the editor and click **Add to Chart**.
- **Step 4**: The indicator will appear on your chart with the default settings.
2. **Adjusting the Settings**:
- **ATR Period**:
- **Definition**: Number of periods over which the ATR is calculated.
- **Adjustment**: Increase for a smoother ATR; decrease for a more responsive ATR.
- **ATR Multiplier**:
- **Definition**: Factor by which the ATR is multiplied to set the stop loss distance.
- **Adjustment**: Increase to widen the stop loss (less likely to be hit); decrease to tighten the stop loss.
- **Smoothing Method**:
- **Options**: RMA, SMA, EMA, WMA, Hull MA.
- **Adjustment**: Experiment to see which method aligns best with your trading strategy.
- **Display Options**:
- **Show Long Stop Loss**: Toggle to display or hide the long stop loss line.
- **Show Short Stop Loss**: Toggle to display or hide the short stop loss line.
3. **Interpreting the Indicator**:
- **Long Positions**:
- **Action**: Set your stop loss at the value indicated by the green line when entering a long trade.
- **Short Positions**:
- **Action**: Set your stop loss at the value indicated by the red line when entering a short trade.
- **Adjusting Stop Losses**:
- **Trailing Stops**: You may choose to adjust your stop loss over time, moving it in the direction of your trade as the ATR-based stop loss levels change.
4. **Implementing in Your Trading Strategy**:
- **Risk Management**:
- **Position Sizing**: Use the stop loss distance to calculate your position size based on your risk tolerance.
- **Consistency**: Apply the same settings consistently to maintain discipline.
- **Combining with Other Indicators**:
- **Enhance Decision-Making**: Use in conjunction with trend indicators, support and resistance levels, or other technical analysis tools.
- **Alerts Setup** (If included in the code):
- **Purpose**: Receive notifications when the price approaches or hits your stop loss level.
- **Configuration**: Set up alerts in TradingView based on the alert conditions defined in the indicator.
---
**Benefits of Using This Indicator**
- **Adaptive Risk Management**: By accounting for current market volatility, the indicator helps prevent setting stop losses that are too tight or too wide.
- **Minimize Premature Stop-Outs**: Reduces the likelihood of being stopped out due to normal price fluctuations.
- **Flexibility**: Customizable settings allow you to tailor the indicator to different trading instruments and timeframes.
- **Visualization**: Clear visual representation of stop loss levels aids in quick decision-making.
---
**Things to Consider**
- **Market Conditions**:
- **High Volatility**: Be cautious as ATR values—and thus stop loss distances—can widen, increasing potential losses.
- **Low Volatility**: Tighter stop losses may increase the chance of being stopped out by minor price movements.
- **Backtesting and Optimization**:
- **Historical Analysis**: Test the indicator on past data to evaluate its effectiveness and adjust settings accordingly.
- **Continuous Improvement**: Regularly reassess and fine-tune the parameters to adapt to changing market conditions.
- **Risk Per Trade**:
- **Alignment with Risk Tolerance**: Ensure the stop loss level keeps potential losses within your acceptable risk per trade (e.g., 1-2% of your trading capital).
- **Emotional Discipline**:
- **Stick to Your Plan**: Avoid making impulsive changes to your stop loss levels based on emotions rather than analysis.
---
**Example Usage Scenario**
1. **Setting Up a Long Trade**:
- **Entry Price**: $100
- **ATR Value**: $2
- **ATR Multiplier**: 1.5
- **Calculated Stop Loss**: $100 - ($2 * 1.5) = $97
- **Action**: Place a stop loss order at $97.
2. **During the Trade**:
- **Price Increases to $105**
- **ATR Remains at $2**
- **New Stop Loss Level**: $105 - ($2 * 1.5) = $102
- **Action**: Move your stop loss up to $102 to lock in profits.
---
**Final Tips**
- **Documentation**: Keep a trading journal to record your trades, stop loss levels, and observations for future reference.
- **Education**: Continuously educate yourself on risk management and technical analysis to enhance your trading skills.
- **Support**: Engage with trading communities or seek professional advice if you're unsure about implementing the indicator effectively.
---
**Conclusion**
The ATR-Based Stop Loss Indicator is a valuable tool for traders looking to enhance their risk management by setting stop losses that adapt to market volatility. By integrating this indicator into your trading routine, you can improve your ability to protect capital and potentially increase profitability. Remember to use it as part of a comprehensive trading strategy, and always adhere to sound risk management principles.
---
**How to Access the Indicator**
To start using the ATR-Based Stop Loss Indicator, follow these steps:
1. **Obtain the Code**: Copy the PineScript code provided for the indicator.
2. **Create a New Indicator in TradingView**:
- Open TradingView and navigate to the **Pine Editor**.
- Paste the code into the editor.
- Click **Save** and give your indicator a name.
3. **Add to Chart**: Click **Add to Chart** to apply the indicator to your current chart.
4. **Customize Settings**: Adjust the input parameters to suit your preferences and start integrating the indicator into your trading strategy.
---
**Disclaimer**
Trading involves significant risk, and it's possible to lose all your capital. The ATR-Based Stop Loss Indicator is a tool to aid in decision-making but does not guarantee profits or prevent losses. Always conduct your own analysis and consider seeking advice from a financial professional before making trading decisions.

ATR for Aggregated Bars (2 Bars)Range Bar ATR Indicator: Detailed Description and Usage Guide
This script is a custom indicator designed specifically for Range Bar charts , tailored to help traders understand and navigate market conditions by utilizing the Average True Range (ATR) concept. The indicator adapts the traditional ATR to work effectively with Range Bar charts, where bars have a fixed range rather than being time-based.
How It Works
1. ATR Calculation on Range Bars :
- Unlike time-based charts, Range Bar charts focus on price movement within a fixed range.
- The indicator calculates ATR by pairing consecutive bars, treating every two bars as a single unit . This pairing ensures that the ATR reflects price movement effectively on Range Bar charts.
2. Short and Long Period ATR Values :
- The script displays two ATR values :
- A short-period ATR , calculated over a smaller number of paired bars.
- A long-period ATR , calculated over a larger number of paired bars.
- These values provide a dynamic view of both recent and longer-term market volatility.
Why Use This Indicator?
The primary goal is to provide a meaningful adaptation of the ATR indicator for Range Bar charts, allowing traders to make informed decisions similar to using ATR on traditional time-based charts.
Key Applications
Determine a Better Custom Range :
- Analyze the ATR values to choose an optimal range size for Range Bar charts, ensuring better alignment with market conditions.
Assess Market Volatility :
- Rising volatility : When the short-period ATR value is higher than the long-period value, it signals increasing volatility.
- Decreasing volatility : When the short-period ATR value is lower, it indicates declining volatility.
Risk and Stop Loss Management :
- Use the higher ATR value (e.g., the long-period ATR) to calculate minimum stop loss levels. Multiply the ATR by 1.5 or 2 to set a safe buffer against market fluctuations.
How to Use It
1. Add the script to a Range Bar chart.
2. Configure the short and long ATR periods to suit your trading style and preferences.
3. Observe the displayed ATR values:
- Use these values to analyze market conditions and adapt your strategy accordingly.
4. Apply insights from the ATR values for:
- Determining custom Range Bar settings.
- Evaluating volatility trends.
- Setting effective risk parameters like stop loss levels.
Benefits
- Provides a tailored ATR tool for Range Bar charts, addressing the unique challenges of fixed-range trading.
- Offers both short-term and long-term perspectives on volatility.
- Enhances decision-making for range settings, volatility analysis, and risk management.
This indicator bridges the gap between traditional ATR indicators and the specific needs of Range Bar chart users, making it a versatile tool for traders.

ATR Regime Study [CHE] ATR Regime Study — ATR percentile regimes with clear bands, table and live label
Summary
This study classifies volatility into five regimes by converting ATR into a percentile rank over a rolling window, plotted on a standardized scale between zero and one hundred. Colored bands mark regime thresholds, while a compact table and an optional label report the current percentile and regime. The standardized scale makes symbols and timeframes easier to compare than raw ATR values. Implemented in Pine v6 as a separate pane (overlay set to false), it is a context tool to adapt tactics and risk handling to the prevailing volatility environment.
Motivation: Why this design?
Raw ATR varies with price scale and asset characteristics, which makes regime comparison inconsistent and leads to poor transfer of settings across symbols and timeframes. The core idea is to transform ATR into a percentile rank within a user-defined lookback, then map it into discrete regimes. This yields a stable, interpretable context signal that shifts slower than raw ATR while still responding to genuine volatility changes.
What’s different vs. standard approaches?
Reference baseline: Traditional ATR plots or ATR bands using fixed multipliers.
Architecture differences:
Percentile ranking of ATR within a rolling window.
Five discrete regimes with fixed thresholds at ninety, seventy, thirty, and ten.
Visual fills between thresholds plus a live table and a last-bar label.
Practical effect: You read a single normalized line between zero and one hundred with consistent thresholds. This improves cross-asset comparison and makes regime shifts obvious at a glance.
How it works (technical)
The script computes ATR over a configurable length, then converts that series to a percentile rank over a configurable number of bars. The percentile is naturally scaled and limited between zero and one hundred. That value is mapped to one of five regimes: above ninety (Extreme), between seventy and ninety (Elevated), between thirty and seventy (Normal), between ten and thirty (Calm), and below ten (Squeeze). Horizontal guide lines mark the thresholds, and fills shade the regions. A table is created once and updated on each bar to show regime definitions and highlight the current row. An optional label on the last bar displays the current percentile and regime. No higher-timeframe requests are used, so repaint risk is limited to normal live-bar fluctuation until the bar closes.
Parameter Guide
ATR length — Effect: Controls how fast ATR reacts to new ranges. Default: fourteen. Trade-offs/Tips: Increase to reduce noise in choppy markets; decrease to react faster during regime changes.
Percentile window (bars) — Effect: Number of bars used for the percentile ranking. Default: two hundred fifty-two. Trade-offs/Tips: Larger windows stabilize the percentile but slow adaptation after structural regime shifts; smaller windows adapt faster but may flip more often.
Table › Show — Effect: Toggles the regime overview table. Default: enabled. Trade-offs/Tips: Disable on constrained layouts to reduce visual clutter.
Table › Position — Effect: Anchors the table in a chart corner. Default: Top Right. Trade-offs/Tips: Choose a corner that avoids overlapping other panels or drawings.
Label › Show — Effect: Toggles a last-bar label with current percentile and regime. Default: enabled. Trade-offs/Tips: Useful for quick reads; disable if it obscures other annotations.
Reading & Interpretation
The white line shows ATR percentile between zero and one hundred. Crossing above seventy signals an elevated volatility environment; above ninety indicates event-driven extremes. Between thirty and seventy represents typical conditions. Between ten and thirty indicates calm conditions that often suit mean reversion. Below ten reflects compression, where breakout probability often increases. The colored bands visually reinforce these ranges. The table summarizes regime definitions and highlights the current state. The last-bar label mirrors the current percentile and regime for quick inspection.
Practical Workflows & Combinations
Trend following: Prefer continuation tactics when the percentile holds in the Normal or Elevated bands and structure confirms higher highs and higher lows. Consider wider stops and partial position sizing as percentile rises.
Mean reversion: Favor fades in Calm regimes within defined ranges; use structure filters and time-of-day constraints to avoid low-liquidity whipsaws.
Breakout preparation: Track compressions below ten; plan entries only with structure confirmation and risk caps, since compressions can persist.
Multi-asset/Multi-TF: Defaults travel well on daily charts. For intraday, reduce the percentile window to align with session dynamics. Combine with trend or market structure tools for confirmation.
Behavior, Constraints & Performance
Repaint/confirmation: The percentile updates during live bars and stabilizes on close; closed bars do not repaint.
security/HTF: Not used. If you add higher-timeframe aggregation externally, account for standard repaint caveats.
Resources: Declared maximum bars back is two thousand; limits for lines and labels are five hundred each. A short loop updates the table rows; arrays are used for table content only.
Known limits: Regime boundaries are fixed; assets with persistent volatility shifts may require window retuning. Low-liquidity periods and gaps can produce abrupt percentile changes. ATR is direction-agnostic and should be paired with trend or structure context.
Sensible Defaults & Quick Tuning
Start with ATR length fourteen and percentile window two hundred fifty-two on daily charts.
Too many flips: Increase ATR length or increase the percentile window.
Too sluggish: Decrease the percentile window or reduce ATR length.
Intraday noise: Keep ATR length moderate and reduce the window to a session-appropriate size; optionally hide the label to declutter.
Compressed markets: Maintain defaults but rely more on structure and volume filters before acting.
What this indicator is—and isn’t
This is a volatility regime context layer that standardizes ATR into interpretable regimes. It is not a complete trading system, not predictive, and not a stand-alone entry signal. Use it alongside structure analysis, confirmation tools, and disciplined risk management.
Disclaimer
The content provided, including all code and materials, is strictly for educational and informational purposes only. It is not intended as, and should not be interpreted as, financial advice, a recommendation to buy or sell any financial instrument, or an offer of any financial product or service. All strategies, tools, and examples discussed are provided for illustrative purposes to demonstrate coding techniques and the functionality of Pine Script within a trading context.
Any results from strategies or tools provided are hypothetical, and past performance is not indicative of future results. Trading and investing involve high risk, including the potential loss of principal, and may not be suitable for all individuals. Before making any trading decisions, please consult with a qualified financial professional to understand the risks involved.
By using this script, you acknowledge and agree that any trading decisions are made solely at your discretion and risk.
Best regards and happy trading
Chervolino

ATR Future Movement Range Projection
The "ATR Future Movement Range Projection" is a custom TradingView Pine Script indicator designed to forecast potential price ranges for a stock (or any asset) over short-term (1-month) and medium-term (3-month) horizons. It leverages the Average True Range (ATR) as a measure of volatility to estimate how far the price might move, while incorporating recent momentum bias based on the proportion of bullish (green) vs. bearish (red) candles. This creates asymmetric projections: in bullish periods, the upside range is larger than the downside, and vice versa.
The indicator is overlaid on the chart, plotting horizontal lines for the projected high and low prices for both timeframes. Additionally, it displays a small table in the top-right corner summarizing the projected prices and the percentage change required from the current close to reach them. This makes it useful for traders assessing potential targets, risk-reward ratios, or option strategies, as it combines volatility forecasting with directional sentiment.
Key features:
- **Volatility Basis**: Uses weekly ATR to derive a stable daily volatility estimate, avoiding noise from shorter timeframes.
- **Momentum Adjustment**: Analyzes recent candle colors to tilt projections toward the prevailing trend (e.g., more upside if more green candles).
- **Time Horizons**: Fixed at 1 month (21 trading days) and 3 months (63 trading days), assuming ~21 trading days per month (excluding weekends/holidays).
- **User Adjustable**: The ATR length/lookback (default 50) can be tweaked via inputs.
- **Visuals**: Green/lime lines for highs, red/orange for lows; a semi-transparent table for quick reference.
- **Limitations**: This is a probabilistic projection based on historical volatility and momentum—it doesn't predict direction with certainty and assumes volatility persists. It ignores external factors like news, earnings, or market regimes. Best used on daily charts for stocks/ETFs.
The indicator doesn't generate buy/sell signals but helps visualize "expected" ranges, similar to how implied volatility informs option pricing.
### How It Works Step-by-Step
The script executes on each bar update (typically daily timeframe) and follows this logic:
1. **Input Configuration**:
- ATR Length (Lookback): Default 50 bars. This controls both the ATR calculation period and the candle count window. You can adjust it in the indicator settings.
2. **Calculate Weekly ATR**:
- Fetches the ATR from the weekly timeframe using `request.security` with a length of 50 weeks.
- ATR measures average price range (high-low, adjusted for gaps), representing volatility.
3. **Derive Daily ATR**:
- Divides the weekly ATR by 5 (approximating 5 trading days per week) to get an equivalent daily volatility estimate.
- Example: If weekly ATR is $5, daily ATR ≈ $1.
4. **Define Projection Periods**:
- 1 Month: 21 trading days.
- 3 Months: 63 trading days (21 × 3).
- These are hardcoded but based on standard trading calendar assumptions.
5. **Compute Base Projections**:
- Base projection = Daily ATR × Days in period.
- This gives the total expected movement (range) without direction: e.g., for 3 months, $1 daily ATR × 63 = $63 total range.
6. **Analyze Candle Momentum (Win Rate)**:
- Counts green candles (close > open) and red candles (close < open) over the last 50 bars (ignores dojis where close == open).
- Total colored candles = green + red.
- Win rate = green / total colored (as a fraction, e.g., 0.7 for 70%). Defaults to 0.5 if no colored candles.
- This acts as a simple momentum proxy: higher win rate implies bullish bias.
7. **Adjust Projections Asymmetrically**:
- Upside projection = Base projection × Win rate.
- Downside projection = Base projection × (1 - Win rate).
- This skews the range: e.g., 70% win rate means 70% of the total range allocated to upside, 30% to downside.
8. **Calculate Projected Prices**:
- High = Current close + Upside projection.
- Low = Current close - Downside projection.
- Done separately for 1M and 3M.
9. **Plot Lines**:
- 3M High: Solid green line.
- 3M Low: Solid red line.
- 1M High: Dashed lime line.
- 1M Low: Dashed orange line.
- Lines extend horizontally from the current bar onward.
10. **Display Table**:
- A 3-column table (Projection, Price, % Change) in the top-right.
- Rows for 1M High/Low and 3M High/Low, color-coded.
- % Change = ((Projected price - Close) / Close) × 100.
- Updates dynamically with new data.
The entire process repeats on each new bar, so projections evolve as volatility and momentum change.
### Examples
Here are two hypothetical examples using the indicator on a daily chart. Assume it's applied to a stock like AAPL, but with made-up data for illustration. (In TradingView, you'd add the script to see real outputs.)
#### Example 1: Bullish Scenario (High Win Rate)
- Current Close: $150.
- Weekly ATR (50 periods): $10 → Daily ATR: $10 / 5 = $2.
- Last 50 Candles: 35 green, 15 red → Total colored: 50 → Win Rate: 35/50 = 0.7 (70%).
- Base Projections:
- 1M: $2 × 21 = $42.
- 3M: $2 × 63 = $126.
- Adjusted Projections:
- 1M Upside: $42 × 0.7 = $29.4 → High: $150 + $29.4 = $179.4 (+19.6%).
- 1M Downside: $42 × 0.3 = $12.6 → Low: $150 - $12.6 = $137.4 (-8.4%).
- 3M Upside: $126 × 0.7 = $88.2 → High: $150 + $88.2 = $238.2 (+58.8%).
- 3M Downside: $126 × 0.3 = $37.8 → Low: $150 - $37.8 = $112.2 (-25.2%).
- On the Chart: Green/lime lines skewed higher; table shows bullish % changes (e.g., +58.8% for 3M high).
- Interpretation: Suggests stronger potential upside due to recent bullish momentum; useful for call options or long positions.
#### Example 2: Bearish Scenario (Low Win Rate)
- Current Close: $50.
- Weekly ATR (50 periods): $3 → Daily ATR: $3 / 5 = $0.6.
- Last 50 Candles: 20 green, 30 red → Total colored: 50 → Win Rate: 20/50 = 0.4 (40%).
- Base Projections:
- 1M: $0.6 × 21 = $12.6.
- 3M: $0.6 × 63 = $37.8.
- Adjusted Projections:
- 1M Upside: $12.6 × 0.4 = $5.04 → High: $50 + $5.04 = $55.04 (+10.1%).
- 1M Downside: $12.6 × 0.6 = $7.56 → Low: $50 - $7.56 = $42.44 (-15.1%).
- 3M Upside: $37.8 × 0.4 = $15.12 → High: $50 + $15.12 = $65.12 (+30.2%).
- 3M Downside: $37.8 × 0.6 = $22.68 → Low: $50 - $22.68 = $27.32 (-45.4%).
- On the Chart: Red/orange lines skewed lower; table highlights larger downside % (e.g., -45.4% for 3M low).
- Interpretation: Indicates bearish risk; might prompt protective puts or short strategies.
#### Example 3: Neutral Scenario (Balanced Win Rate)
- Current Close: $100.
- Weekly ATR: $5 → Daily ATR: $1.
- Last 50 Candles: 25 green, 25 red → Win Rate: 0.5 (50%).
- Projections become symmetric:
- 1M: Base $21 → Upside/Downside $10.5 each → High $110.5 (+10.5%), Low $89.5 (-10.5%).
- 3M: Base $63 → Upside/Downside $31.5 each → High $131.5 (+31.5%), Low $68.5 (-31.5%).
- Interpretation: Pure volatility-based range, no directional bias—ideal for straddle options or range trading.
In real use, test on historical data: e.g., if past projections captured actual moves ~68% of the time (1 standard deviation for ATR), it validates the volatility assumption. Adjust the lookback for different assets (shorter for volatile cryptos, longer for stable blue-chips).

+ ATR Table and BracketsHi, all. I'm back with a new indicator—one I firmly believe could be one of the most valuable indicators you keep in your indicator toolshed—based around true range.
This is a simple, streamlined indicator utilizing true range and average true range that will help any trader with stoploss, trailing stoploss, and take-profit placement—things that I know many traders use average true range for. It could also be useful for trade entries as well, depending on the trader's style.
Typically, most traders (or at least what I've seen recommended across websites, video tutorials on YouTube, etc.) are taught to simply take the ATR number and use that, and possibly some sort of multiplier, as your stoploss and take-profit. This is fine, but I thought that it might be possible to dive a bit deeper into these values. Because an average is a combination of values, some higher, some lower, and we often see ATR spikes during periods of high volatility, I thought wouldn't it be useful to know what value those ATR spikes are, and how do they relate to the ATR? Then I thought to myself, well, what about the most volatile candle within that ATR (the candle with the greatest true range)? Couldn't knowing that value be useful to a trader? So then the idea of a table displaying these values, along with the ATR and the ATR times some multiplier number, would be a useful, simple way to display this information. That's what we have here.
The table is made up of two columns, one with the name of the metric being measured, and the other with its value. That's it. Simple.
As nice as this was, I thought an additional, great, and perhaps better, way to visualize this information would be in the form of brackets extending from the current bar. These are simply lines/labels plotted at the price values of the ATR, ATR times X, highest ATR, highest ATR times X, and highest TR value. These labels supply the actual values of the ATR, etc., but may also display the price if you should choose (both of these values are toggleable in the 'Inputs' section of the indicator.). Additionally, you can choose to display none of these labels, or all five if you wish (leaves the chart a bit cluttered, as shown in the image below), though I suspect you'll determine your preferences for which information you'd like to see and which not.
Chart with all five lines/labels displayed. I adjusted the ATRX value to 3 just to make the screenshot as legible as possible. Default is set to 1.5. As you can see, the label doesn't show the multiplier number, but the table does.
Here's a screenshot of the labels showing the price in addition to the value of the ATR, set to "Previous Closing Price," (see next paragraph for what that means) and highest TR. Personally, I don't see the value in the displaying the price, but I thought some people might want that. It's not available in the table as of now, but perhaps if I get enough requests for it I will add it.
That's basically it, but one last detail I need to go over is the dropdown box labeled "Bar Value ATR Levels are Oriented To." Firstly, this has no effect on Highest ATR, Highest ATRX, and Highest TR levels. Those are based on the ATR up to the last closed candle, meaning they aren't including the value of the currently open candle (this would be useless). However, knowing that different traders trade different ways it seemed to me prudent to allow for traders to select which opening or closing value the trader wishes to have the ATR brackets based on. For example, as someone who has consumed much No Nonsense Forex content I know that traders are urged to enter their trades in the last fifteen minutes of the trading day because the ATR is unlikely to change significantly in that period (ATR being the centerpiece of NNFX money management), so one of three selections here is to plot the brackets based on the ATR's inclusion of this value (this of course means the brackets will move while the candle is still open). The other options are to set the brackets to the current opening price, or the previous closing price. Depending on what you're trading many times these prices are virtually identical, but sometimes price gaps (stocks in particular), so, wanting your brackets placed relative to the previous close as opposed to the current open might be preferable for some traders.
And that's it. I really hope you guys like this indicator. I haven't seen anything closely similar to it on TradingView, and I think it will be something you all will find incredibly handy.
Please enjoy!

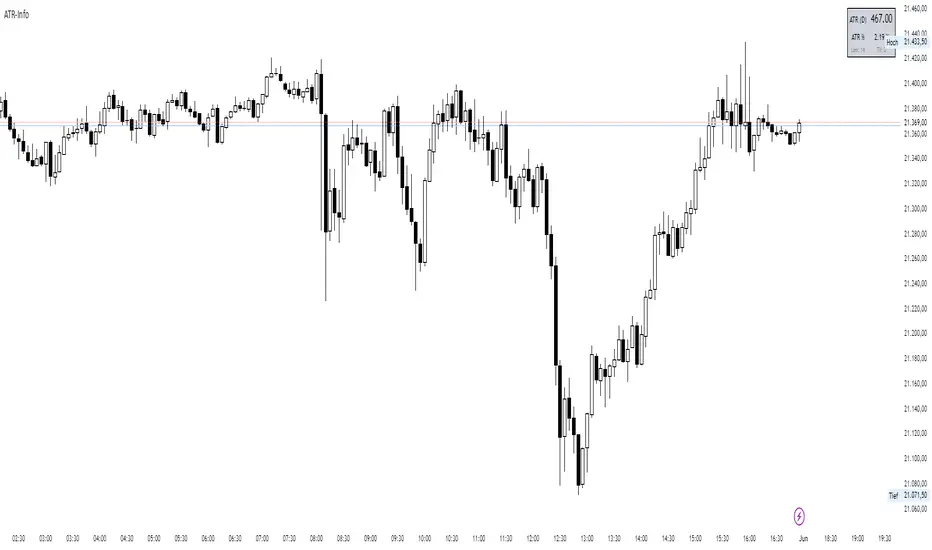
ATR-InfoWHAT IT SHOWS
- ATR (): Average True Range of the chosen timeframe, printed with the instrument’s native tick precision (format.mintick).
- ATR % PRICE: ATR divided by the latest close, multiplied by 100 – the range as a percentage of current price.
- LEN / TF: The ATR length and timeframe you selected (shown in small print).
INPUTS
- ATR Length (default 14)
- ATR Timeframe (for example 60, D, W)
- Design settings: table position, font size, colours, border
EXAMPLES
BTC-USD: price 67 800, ATR 2 450, ATR % 3.6
NQ E-Mini: price 18 230, ATR 355, ATR % 1.9
CL WTI: price 76.40, ATR 2.10, ATR % 2.8
EUR-USD: price 1.0860, ATR 0.0075, ATR % 0.69
USE CASES
Volatility-adjusted stops: place your stop roughly one ATR beyond the entry price.
Position sizing: money at risk divided by ATR gives the number of contracts or coins.
Market selection: trade assets only when their ATR % sits in your preferred range.
Strategy filter: trigger entries or exits only when ATR % crosses a chosen threshold.
LIMITS
ATR is descriptive; it does not predict future moves.
Illiquid symbols may show exaggerated ATR spikes.
ATR % ignores differing session lengths (24/7 crypto versus exchange-traded hours).
ATR Levels and Zones with Signals📌 ATR Levels and Zones with Signals – User Guide Description
🔹 Overview
The ATR Levels and Zones with Signals indicator is a volatility-based trading tool that helps traders identify:
✔ Key support & resistance levels based on ATR (Average True Range)
✔ Buy & Sell signals triggered when price enters key ATR zones
✔ Breakout confirmations to detect high-momentum moves
✔ Dynamic Stop-Loss & Take-Profit suggestions
Unlike traditional ATR bands, this indicator creates layered ATR zones based on multiple ATR multipliers, allowing traders to gauge volatility and risk-adjust their trading strategies.
🔹 How It Works
🔸 The script calculates a baseline SMA (Simple Moving Average) of the price.
🔸 ATR (Average True Range) is then used to create six dynamic price levels above & below the baseline.
🔸 These levels define different risk zones—higher levels indicate increased volatility and potential trend exhaustion.
📈 ATR Zones Explained
🔹 Lower ATR Levels (Buying Opportunities)
📉 Lower Level 1-2 → Mild Oversold Zone (Potential trend continuation)
📉 Lower Level 3-4 → High Volatility Buy Zone (Aggressive traders start scaling in)
📉 Lower Level 5-6 → Extreme Oversold Zone (High-Risk Reversal Area)
🔹 If price enters these lower zones, it may indicate a potential buying opportunity, especially if combined with trend reversal confirmation.
🔹 Upper ATR Levels (Selling / Take Profit Zones)
📈 Upper Level 1-2 → Mild Overbought Zone (Potential pullback area)
📈 Upper Level 3-4 → High Volatility Sell Zone (Aggressive traders start scaling out)
📈 Upper Level 5-6 → Extreme Overbought Zone (High-Risk for Reversal)
🔹 If price enters these upper zones, it may indicate a potential selling opportunity or trend exhaustion, especially if momentum slows.
🔹 Sensitivity Modes
🔹 Aggressive Mode (More Frequent Signals) → Triggers buy/sell signals at Lower/Upper Level 3 & 4
🔹 Conservative Mode (Stronger Confirmation) → Triggers buy/sell signals at Lower/Upper Level 5 & 6
📌 Choose the mode based on your trading style:
✔ Scalpers & short-term traders → Use Aggressive Mode
✔ Swing & trend traders → Use Conservative Mode for stronger confirmations
🚀 How to Use the Indicator
🔹 For Trend Trading:
✅ Buy when price enters the lower ATR zones (especially in uptrends).
✅ Sell when price enters the upper ATR zones (especially in downtrends).
🔹 For Breakout Trading:
✅ Breakout Buy: Price breaks above Upper ATR Level 3 → Momentum entry for trend continuation
✅ Breakout Sell: Price breaks below Lower ATR Level 3 → Momentum short opportunity
🔹 Stop-Loss & Take-Profit Suggestions
🚨 Stop-Loss: Suggested at Lower ATR Level 6 (for longs) or Upper ATR Level 6 (for shorts)
🎯 Take-Profit: Suggested at Upper ATR Level 3 (for longs) or Lower ATR Level 3 (for shorts)
🔹 Why This Indicator is Unique
✔ Multiple ATR layers for better risk-adjusted trading decisions
✔ Combines ATR-based zones with SMA trend confirmation
✔ Both aggressive & conservative trading modes available
✔ Includes automatic stop-loss & take-profit suggestions
✔ Breakout signals for momentum traders
📢 Final Notes
✅ Free & open-source for the TradingView community!
⚠ Risk Warning: Always confirm signals with other confluences (trend, volume, support/resistance) before trading.
📌 Developed by: Maddog Blewitt
📩 Feedback & improvements are welcome! 🚀

ATR Overlay with Trailing Flip [ask2maniish]📘 ATR Overlay with Trailing Flip
🔍 Overview
The ATR Overlay with Trailing Flip is a dynamic, visually-enhanced overlay indicator designed to assist traders in trend detection, trailing stop management, and volatility-based decision making. It leverages the Average True Range (ATR) with optional dynamic multipliers, filters, and alerts to enhance trade execution precision.
⚙️ Features Summary
✅ Static & dynamic ATR multiplier
✅ Customizable trailing stop logic
✅ Volume & Bollinger Band filters
✅ Buy/Sell label signals with alerts
✅ ATR bands with color fill
✅ Optional candle coloring based on trend
✅ Table showing current ATR multiplier
✅ Fully customizable visual controls
🔧 User Inputs
📘 Info Panel
ATR Usage Guide
Tooltip with trading-style recommendations:
Scalping: ATR 5–10, Intraday: ATR 10–14 , Swing: ATR 14–21 , Position: ATR 21–50
📊 Visual Elements
📈 Plots
Upper/Lower ATR Bands
ATR Fill Zone
Dynamic Trailing Stop Line
🕯 Candle Coloring
Candles colored green (uptrend) or red (downtrend)
Wick coloring matches body
🏷 Signal Labels
"BUY" below candle when trend flips up
"SELL" above candle when trend flips down
📊 Table (Top Right)
Displays current multiplier value:
If static: Static: x.x
If dynamic: percentage format based on ATR ratio
🔔 Alerts
Two alert conditions:
Flip to Long → "📈 ATR flip to LONG"
Flip to Short → "📉 ATR flip to SHORT"
Sound can be enabled for real-time feedback.
🧠 Best Practices
Combine this tool with support/resistance or order flow indicators
Use dynamic ATR during volatile periods for better adaptability
Filter signals in ranging markets with BBand Width Filter
For scalping, reduce ATR period and multiplier for tighter risk
🛠️ Customization Tips
Adjust trailingPeriod for tighter/looser stops
Use color inputs to match your charting theme
Disable features (labels/fill) to declutter chart

ATR with Donchian Channels and SMAsThis script combines the Average True Range (ATR), Donchian Channels, and Simple Moving Averages (SMAs) to provide a comprehensive tool for volatility and trend analysis.
Key Components:
ATR Calculation: The ATR is used to measure market volatility. It is calculated as a moving average of the true range over a specified length, which you can customize using different smoothing methods: RMA, SMA, EMA, or WMA. ATR helps identify periods of high and low volatility, giving insights into potential breakout or consolidation phases in the market.
Donchian Channels on ATR: The Donchian Channels are calculated based on the highest and lowest values of the ATR over a user-defined period. The upper and lower bands provide a volatility range, and the middle line represents the average of the two. This can help visualize the range of market volatility and detect possible trend reversals or continuations.
SMAs on ATR: Two Simple Moving Averages (SMA) are applied to the ATR values. These SMAs act as a smoothed version of the ATR, providing additional insight into volatility trends. By adjusting the length of these SMAs, you can track short-term and long-term volatility movements, helping in decision-making for potential entries and exits.
Inputs:
ATR Length: Set the length for calculating the ATR.
Smoothing Method: Choose from RMA, SMA, EMA, or WMA for smoothing the ATR calculation.
Donchian Channel Length: Set the length for calculating the highest and lowest ATR values for Donchian Channels.
SMA Lengths: Two adjustable lengths for applying SMAs to the ATR.
Visualization:
ATR Plot: The ATR is plotted in red, allowing you to see the market's volatility at a glance.
Donchian Channels: Blue lines represent the upper and lower bands, while the green line represents the middle line of the Donchian Channels, helping you visualize the volatility range.
SMAs: Two SMAs (green and orange) are plotted to smooth out the ATR and identify trends in volatility.
Use Cases:
Breakout Detection: High ATR values breaking out of the Donchian Channels may signal increased volatility and a potential breakout.
Trend Analysis: SMAs on ATR help smooth volatility trends, aiding in determining if the market is entering a more volatile or stable period.
Stop-Loss Placement: ATR and Donchian Channels can be used to set dynamic stop-loss levels based on market volatility.
This script is versatile and can be used across different asset classes, such as stocks, forex, crypto, and commodities. It is especially useful for traders who want to incorporate volatility into their trading strategies for better risk management and trend detection.
ATR PivotsThe "ATR Pivots" script is a technical analysis tool designed to help traders identify key levels of support and resistance on a chart. The indicator uses various metrics such as the Average True Range (ATR), Daily True Range ( DTR ), Daily True Range Percentage (DTR%), Average Daily Range (ADR), Previous Day High ( PDH ), and Previous Day Low ( PDL ) to provide a comprehensive picture of the volatility and movement of a security. The script also includes an EMA cloud and 200 EMA for trend identification and a 1-minute ATR scalping strategy for traders to make informed trading decisions.
ATR Detail:-
The ATR is a measure of the volatility of a security over a given period of time. It is calculated by taking the average of the true range (the difference between the high and low of a security) over a set number of periods. The user can input the number of periods (ATR length) to be used for the ATR calculation. The script also allows the user to choose whether to use the current close or not for the calculation. The script calculates various levels of support and resistance based on the relationship between the security's range ( high-low ) and the ATR. The levels are calculated by multiplying the ATR by different Fibonacci ratios (0.236, 0.382, 0.5, 0.618, 0.786, 1.000) and then adding or subtracting the result from the previous close. The script plots these levels on the chart, with the -100 level being the most significant level. The user also has an option to choose whether to plot all Fibonacci levels or not.
DTR and DTR% Detail:-
The Daily True Range Percentage (DTR%) is a metric that measures the daily volatility of a security as a percentage of its previous close. It is calculated by dividing the Daily True Range ( DTR ) by the previous close. DTR is the range between the current period's high and low and gives a measure of the volatility of the security on a daily basis. DTR% can be used as an indicator of the percentage of movement of the security on a daily basis. In this script, DTR% is used in combination with other metrics such as the Average True Range (ATR) and Fibonacci ratios to calculate key levels of support and resistance for the security. The idea behind using DTR% is that it can help traders to better understand the daily volatility of the security and make more informed trading decisions.
For example, if a security has a DTR% of 2%, it suggests that the security has a relatively low level of volatility and is less likely to experience significant price movements on a daily basis. On the other hand, if a security has a DTR% of 10%, it suggests that the security has a relatively high level of volatility and is more likely to experience significant price movements on a daily basis.
ADR:-
The script then calculates the ADR (Average Daily Range) which is the average of the daily range of the security, using the formula (Period High - Period Low) / ATR Length. This gives a measure of the average volatility of the security on a daily basis, which can be useful for determining potential levels of support and resistance .
PDH /PDL:-
The script also calculates PDH (Previous Day High) and PDL (Previous Day Low) which are the High and low of the previous day of the security. This gives a measure of the previous day's volatility and movement, which can be useful for determining potential levels of support and resistance .
EMA Cloud and 200 EMA Detail:-
The EMA cloud is a technical analysis tool that helps traders identify the trend of the market by comparing two different exponential moving averages (EMAs) of different lengths. The cloud is created by plotting the fast EMA and the slow EMA on the chart and filling the space between them. The user can input the length of the fast and slow EMA , and the script will calculate and plot these EMAs on the chart. The space between the two EMAs is then filled with a color that represents the trend, with green indicating a bullish trend and red indicating a bearish trend . Additionally, the script also plots a 200 EMA , which is a commonly used long-term trend indicator. When the fast EMA is above the slow EMA and the 200 EMA , it is considered a bullish signal, indicating an uptrend. When the fast EMA is below the slow EMA and the 200 EMA , it is considered a bearish signal, indicating a downtrend. The EMA cloud and 200 EMA can be used together to help traders identify the overall trend of the market and make more informed trading decisions.
1 Minute ATR Scalping Strategy:-
The script also includes a 1-minute ATR scalping strategy that can be used by traders looking for quick profits in the market. The strategy involves using the ATR levels calculated by the script as well as the EMA cloud and 200 EMA to identify potential buy and sell opportunities. For example, if the 1-minute ATR is above 11 in NIFTY and the EMA cloud is bullish , the strategy suggests buying the security. Similarly, if the 1-minute ATR is above 30 in BANKNIFTY and the EMA cloud is bullish , the strategy suggests buying the security.
Inside Candle:-
The Inside Candle is a price action pattern that occurs when the current candle's high and low are entirely within the range of the previous candle's high and low. This pattern indicates indecision or consolidation in the market and can be a potential sign of a trend reversal. When used in the 15-minute chart, traders can look for Inside Candle patterns that occur at key levels of support or resistance. If the Inside Candle pattern occurs at a key level and the price subsequently breaks out of the range of the Inside Candle, it can be a signal to enter a trade in the direction of the breakout. Traders can also use the Inside Candle pattern to trade in a tight range, or to reduce their exposure to a current trend.
Risk Management:-
As with any trading strategy, it is important to practice proper risk management when using the ATR Pivots script and the 1-minute ATR scalping strategy. This may include setting stop-loss orders, using appropriate position sizing, and diversifying your portfolio. It is also important to note that past performance is not indicative of future results and that the script and strategy provided are for educational purposes only.
In conclusion, the "ATR Pivots" script is a powerful tool that can help traders identify key levels of support and resistance , as well as trend direction. The additional metrics such as DTR , DTR%, ADR, PDH , and PDL provide a more comprehensive picture of the volatility and movement of the security, making it easier for traders to make better trading decisions. The inclusion of the EMA cloud and 200 EMA for trend identification, and the 1-minute ATR scalping strategy for quick profits can further enhance a trader's decision-making process. However, it is important to practice proper risk management and understand that past performance is not indicative of future results.
Special thanks to satymahajan for the idea of clubbing Average True Range with Fibonacci levels.

ATR Daily (Classic vs Robust, NY-Fix, Spike Control)📘 What this indicator does
This tool provides an advanced view of daily market volatility by comparing two versions of the Average True Range (ATR):
• Classic ATR — standard Wilder smoothing
• Robust ATR — uses median-based filtering and spike-control logic to reduce distortion from abnormal candles
Both values are calculated using daily data aligned to the New York trading session, so volatility resets at the same moment each institutional trading day begins. This keeps readings consistent across crypto, forex and stocks, even on intraday charts.
⚙️ How it works (in simple terms)
The script evaluates each True Range (TR) value relative to a median-based threshold:
• Abnormally large ranges are either clamped to a limit or excluded from updating ATR
• A hard cap prevents single spikes from inflating the entire indicator
• The result is a smoother and more realistic representation of daily volatility
This allows ATR to reflect typical market behaviour instead of rare one-off events.
📊 What appears on the chart
• Two daily ATR lines (Classic and Robust)
• Histogram showing the percentage of daily range already completed
• Red bars when price exceeds 100% of daily ATR
• A data table with volatility metrics
• Background highlights on days with extreme values
💡 How traders can use it
• Identify when a market has already completed most of its typical daily move
• Compare Classic vs Robust ATR to spot news-driven distortion
• Use Robust ATR for more stable stop-loss and take-profit logic
• Track volatility expansion or contraction across sessions
⚙️ Key settings
Setting Purpose
ATR period Standard smoothing length (default 14)
Robust mode Clamp, Freeze or Off
MAD multiplier Sensitivity to outliers
Cap × median(TR) Maximum allowed spike size
Base for passed ATR Which ATR is used to measure daily %
Freeze weekends Keeps ATR unchanged on Sat/Sun
🧩 Unique concept
Unlike typical ATR indicators, this one combines robust statistics (median + MAD) with session-based fixation. ATR values update only once per New York session, creating stable volatility measurements that match institutional timing.
🔒 Source code
The script is published with protected source code to preserve its statistical structure and prevent unauthorized modification.
🧭 Summary
ATR Daily (Classic vs Robust, NY-Fix) provides a clearer and more reliable view of daily volatility.
It helps determine whether the market is still in the early phase of its daily range or already exhausted.

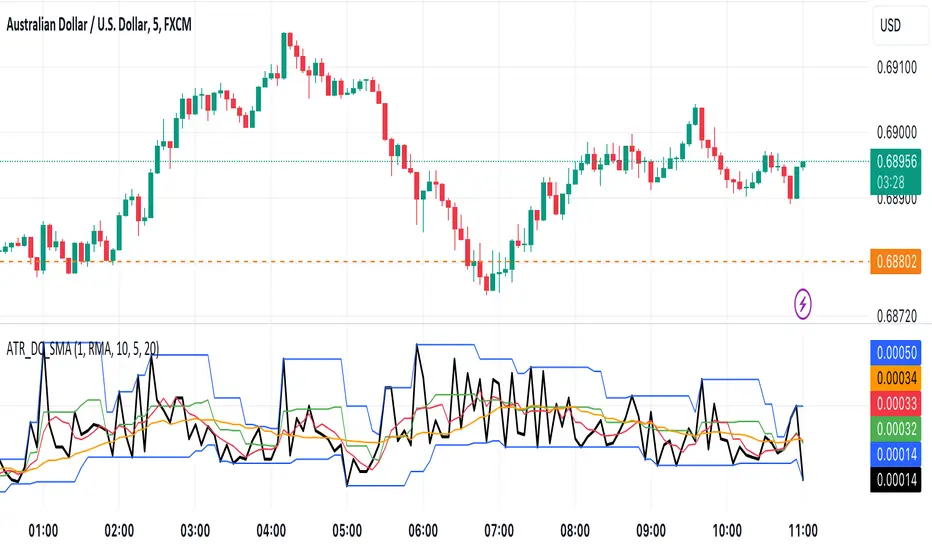
ATR x Trend x Volume SignalsATR x Trend x Volume Signals is a multi-factor indicator that combines volatility, trend, and volume analysis into one adaptive framework. It is designed for traders who use technical confluence and prefer clear, rule-based setups.
🎯 Purpose
This tool identifies high-probability market moments when volatility structure (ATR), momentum direction (CCI-based trend logic), and volume expansion all align. It helps filter out noise and focus on clean, actionable trade conditions.
⚙️ Structure
The indicator consists of three main analytical layers:
1️⃣ ATR Trailing Stop – calculates two adaptive ATR lines (fast and slow) that define volatility context, trend bias, and potential reversal points.
2️⃣ Trend Indicator (CCI + ATR) – uses a CCI-based logic combined with ATR smoothing to determine the dominant trend direction and reduce false flips.
3️⃣ Volume Analysis – evaluates volume deviations from their historical average using standard deviation. Bars are highlighted as medium, high, or extra-high volume depending on intensity.
💡 Signal Logic
A Buy Signal (green) appears when all of the following are true:
• The ATR (slow) line is green.
• The Trend Indicator is blue.
• A bullish candle closes above both the ATR (slow) and the Trend Indicator.
• The candle shows medium, high, or extra-high volume.
A Sell Signal (red) appears when:
• The ATR (slow) line is red.
• The Trend Indicator is red.
• A bearish candle closes below both the ATR (slow) and the Trend Indicator.
• The candle shows medium, high, or extra-high volume.
Only one signal can appear per ATR trend phase. A new signal is generated only after the ATR direction changes.
❌ Exit Logic
Exit markers are shown when price crosses the slow ATR line. This behavior simulates a trailing stop exit. The exit is triggered one bar after entry to prevent same-bar exits.
⏰ Session Filter
Signals are generated only between the user-defined session start and end times (default: 14:00–18:00 chart time). This allows the trader to limit signal generation to active trading hours.
💬 Practical Use
It is recommended to trade with a fixed risk-reward ratio such as 1 : 1.5. Stop-loss placement should be beyond the slow ATR line and adjusted gradually as the trade develops.
For better confirmation, the Trend Indicator timeframe should be higher than the chart timeframe (for example: trading on 1 min → set Trend Indicator timeframe to 15 min; trading on 5 min → set to 1 hour).
🧠 Main Features
• Dual ATR volatility structure (fast and slow)
• CCI-based trend direction filtering
• Volume deviation heatmap logic
• Time-restricted signal generation
• Dynamic trailing-stop exit system
• Non-repainting logic
• Fully optimized for Pine Script v6
📊 Usage Tip
Best results are achieved when combining this indicator with additional technical context such as support-resistance, higher-timeframe confirmation, or market structure analysis.
📈 Credits
Inspired by:
• ATR Trailing Stop by Ceyhun
• Trend Magic by Kivanc Ozbilgic
• Heatmap Volume by xdecow

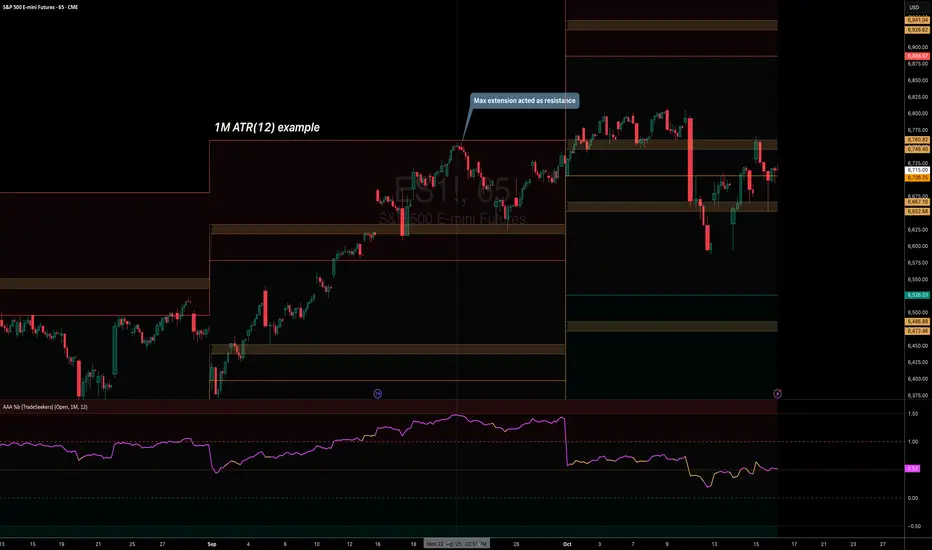
ATR Anchored Range %b by TradeSeekersAll time highs got you spooked to enter with no levels in sight?
Stuck in a multi-week range and wondering where the heck the pivots are!?
Wondering if you're longing the top or shorting the potential bottom and about to get smoked, sending you back to burger flipping?!
Fret not trading friends!
I've been crafting the ultimate map for scalpers, slingers, swingers, swindlers, swashbucklers -and traders too.
Why should I care about this, what's an ATR!?
Nearly any trader that's entered the markets has heard of ATR, perhaps even taken a stab at trying to calculate the flux capacity of a weekly ATR on a lower timeframe. Continually calculating things manually sucks!
Ok, so you haven't heard of ATR? It's the average true range... what's the true range!? It's simply the low subtracted from the high (high - low) of any given candle.
How is ATR useful?
The theory is simple, if the ATRs on the daily timeframe for a stock are 5, then traders may have a reasonable expectation that any day in the near future the stock will mostly move +/- 5 pts. This +/- 5 can be used as a possible daily high and low for traders to use.
But ATR changes as time passes, with every billionaire X post, viral cat meme, fed announcement or government shutdown the market makes it's move. This means without this tool, traders need to run the standard lame (sorry) ATR indicator and then hand draw a bunch of important levels (barf).
I'm convinced and ready to join the ATR army, what do I do?
Glad to have you aboard sailor, slap this indicator on your layout - it'll initially display a bottom panel, say nice things to it.
Usage
The lower panel provides a %b plot representative of the current price relative to the timeframe and period ATR. (Defaults to 1D timeframe and 20 - 20 trading days in a month yo)
This %b plot is a map for price against the key ATR based levels and resets each time the timeframe change occurs.
Keep reading! (maybe grab a snack, you're doing great)
If you want to see what the indicator sees, how it maths the math, open the settings and check the "overlay" option... it's amazing, I know.
Main base of operations
This will be the gray area between first red and green lines, imagine this is a future candle for the timeframe anchored. The red would represent the candle high (red means stop/overbought), and the green would represent the candle low (green means go/oversold).
Regardless of the timeframe anchored, this area always represents the area the ATR indicates will be the building area of the current candle being formed. Traders should expect most of the trading to occur within this area.
The mid line
Don't diddle in the middle, this by default is the open price and it's the ultimate bias filter for bull or bear riders.
Extension areas
Beyond the gray area is the extension zone, this provides a whole ATR from the mid line to the extension.
Assembling a trade plan
There are just a couple of key concepts to master in order to become the ultimate ATR samurai warrior, capable of slicing through even the messiest liquidity.
Above the midline and holding, but still within the gray area? Could be a great long entry with targets to upper levels. The same holds true for below open and holding while still being within the lower gray area.
As price makes it's ascension or decline towards the ends of the initial gray ATR range, consider managing trades here. If it's suspected, due to a strong hold of the midline, that the range low or high is the midline, then continue to manage trades towards the extension zones.
Timeframes and periods oh my
The tooltips already provide some hints, but not everyone goes around clicking and hovering everything in sight (maybe I'm the only one that does that?).
There's a thoughtful approach to the default values, I like to consider the big market participants with my day trades, swings trades and beyond.
By default I've chosen the daily timeframe and a period of 20, one for each trading day of the calendar month.
It's no large leap to consider alternatives, what about 1W timeframe and a period of 4 (1 month) or 52 (1 year)?
The possibilities are nearly infinite, comment on any particular favorite combos.
An Italian Special Bonus!!!
...sorry, it's not pizza....
First, did you know the famous Italian Fibonacci's real name was actually Leonardo? I'm not sure how I feel about that. Fun fact, my ancestors are Italian.
Alright, you may have guessed that the special bonus is the mythical Fibonacci inspired "Golden Pocket", maybe it's a foreshadowing of your pockets - one can only hope.
Use this feature to show the commonly referenced Fibonacci levels within each major ATR range. I've seen some totally mathematical epic-ness with these hence the addition.
Once key ATR levels have been hit look for reversals back to golden pockets (you tricksy hobbits) for potential entry back towards the prior hit ATR level.
The %b turns gold if you have the feature enabled and of course the overlay displays them also, how fun!
Final thoughts
I hope you have as much fun using this indicator as I do, it has brought much joy to my trading experience. If you don't have fun with it, well I hope you had fun reading about it at least.
100% human crafted and darn proud of it
- SyntaxGeek
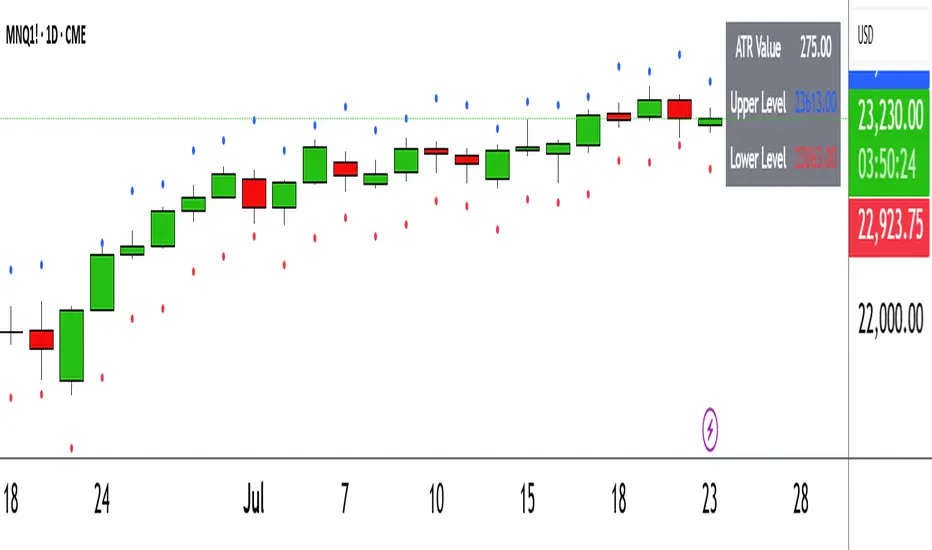
ATR Circle PlotTitle: ATR Circle Plot
Short Title: ATR Circle Plot
Description:
ATR Circle Plot is a dynamic overlay indicator that visualizes volatility-based levels around the open price of each bar, using the Average True Range (ATR). It plots two customizable levels—Upper and Lower ATR—calculated by multiplying the ATR by a user-defined factor (default: 1.0) and adding/subtracting it from the open price. These levels are displayed as colored circles on the chart, ideal for identifying potential breakout or stop-loss zones. A movable table summarizes the ATR value, Upper Level, and Lower Level with tick precision, and a new toggleable label feature displays these values directly on the chart for quick reference.
Perfect for traders in volatile markets like forex, futures, or stocks, this indicator helps set risk parameters or spot key price levels. Users can adjust the ATR timeframe, length, multiplier, table position, and circle colors to suit their strategy. The optional chart labels enhance usability by overlaying ATR metrics at the latest price levels, reducing the need to check the table during fast-moving markets.
Key Features:
Plots Upper and Lower ATR levels as colored circles around the open price.
Toggleable table (top/bottom, left/right) showing ATR and level values in ticks.
Optional chart labels for ATR, Upper, and Lower levels, toggleable via input.
Customizable ATR length, multiplier, timeframe, and colors for flexibility.
Lightweight and compatible with any chart timeframe.
How to Use:
Add the indicator to your chart and adjust the ATR length, multiplier, and timeframe as needed. Enable/disable the table or labels based on your preference. Use the Upper and Lower ATR levels as dynamic support/resistance or stop-loss guides. For example, place stops beyond the Upper/Lower levels or target breakouts when price crosses them. Combine with trend or momentum indicators for a robust setup.
Note: Leave the ATR Timeframe input empty to use the chart’s timeframe, or specify a higher timeframe (e.g., “D” for daily) for broader volatility context. Ensure your chart’s tick size aligns with the asset for accurate table values.
Tags: ATR, volatility, support resistance, stop loss, table, labels, breakout
Category: Volatility
Rolling ATR Momentum - EnhancedATR Rolling Momentum Indicator – User Manual
---
🔍 Overview
The ATR Rolling Momentum Indicator is a dynamic volatility tool built on the Average True Range (ATR). It not only tracks increasing or decreasing momentum but also provides early warnings and confirmation signals for potential breakout moves. It’s especially powerful for futures and options traders looking to align with expanding price action.
---
📊 Core Components
✅ ATR Delta (Rolling ATR)
- Definition: Difference between current ATR and past ATR (user-defined lookback).
- Use: Tells whether volatility is expanding (positive delta) or contracting (negative delta).
- Visual: Green line for rising momentum, red for declining.
🟣 ATR Delta Slope
- Definition: Measures acceleration in momentum.
- Use: Helps identify early signs of breakout buildup.
- Visual: Purple line. Watch for slope turning up from below.
🟡 Volatility Squeeze (Yellow Dot)
- Definition: Current ATR is significantly lower than its 20-period average.
- Use: Indicates the market is coiling—possible breakout ahead.
🔼 Momentum Start (Green Triangle)
- Definition: ATR Delta slope turns from negative to positive.
- Use: Early warning to prepare for volatility expansion.
🔷 Breakout Confirmation (Blue Label Up)
- Definition: ATR Delta exceeds its high of the last 10 candles.
- Use: Confirms volatility breakout—trade opportunity if direction aligns.
🟩/🟥 Background Color
- Green Background: Momentum rising (positive ATR delta)
- Red Background: Momentum falling (negative ATR delta)
- Yellow Tint: Active squeeze zone
---
✅ How to Use It (Futures/Options Focus)
Step-by-Step:
1. Squeeze Detected (Yellow Dot) → Stay alert. Market is coiling.
2. Green Triangle Appears → Momentum is starting to rise.
3. Background Turns Green → Confirmed rising momentum.
4. Blue Label Appears → Confirmed breakout (enter trade if trend aligns).
Directional Bias:
- Use your main chart setup (price action, EMAs, trendlines, etc.) to decide direction (Call or Put, Long or Short).
- ATR Momentum only tells you how strong the move is—not which way.
---
⚙️ Inputs & Settings
- ATR Period: Default 14 (core volatility measure)
- Rolling Lookback: Used to calculate delta (default 5)
- Slope Length: Used to measure acceleration (default 3)
- Squeeze Factor: Default 0.8 — lower = more sensitive squeeze detection
- Breakout Lookback: Checks ATR delta against last X bars (default 10)
---
🧠 Pro Tips
- Works great when paired with EMA stacks, price structure, or breakout patterns.
- Avoid taking trades based only on squeeze or momentum—combine with chart confirmation.
- If background turns red after a breakout, it may be losing momentum—book partials or tighten stops.
---
🧭 Ideal For:
- Nifty/BankNifty Futures
- Option directional trades (call/put buying)
- Index scalping and momentum swing setups
---
Use this tool as your volatility compass—it won't tell you where to go, but it'll tell you when the wind is strong enough to move fast.
End of Manual

ATR and Moving AverageUsing ATR and Moving Average: A Technical Analysis Strategy
The Average True Range (ATR) and the Moving Average are two important technical analysis tools that can be used together to identify trading opportunities in the market. In this article, we will explore how to use these two tools and how the crossover between them can indicate changes in the market.
What is ATR?
The Average True Range (ATR) is a measure of the volatility of an asset, which calculates the average true range of an asset over a period of time. The true range is the difference between the closing price and the opening price of an asset, or the difference between the closing price and the highest or lowest price of the day. ATR is an important measure of volatility, as it helps to identify the magnitude of price fluctuations of an asset.
What is Moving Average?
The Moving Average is a technical analysis tool that calculates the average price of an asset over a period of time. The Moving Average can be used to identify trends and price patterns, and is an important tool for traders. There are different types of Moving Averages, including the Simple Moving Average (SMA), the Exponential Moving Average (EMA), and the Weighted Moving Average (WMA).
Crossover between ATR and Moving Average
The crossover between ATR and Moving Average can be an important indicator of changes in the market. When ATR crosses above the Moving Average, it may indicate that the volatility of the asset is increasing and that the price may be about to rise. This occurs because ATR is increasing, which means that the true range of the asset is increasing, and the Moving Average is being surpassed, which means that the price is rising.
On the other hand, when ATR crosses below the Moving Average, it may indicate that the volatility of the asset is decreasing and that the price may be about to fall. This occurs because ATR is decreasing, which means that the true range of the asset is decreasing, and the Moving Average is being surpassed, which means that the price is falling.
Trading Strategies
There are several trading strategies that can be used with the crossover between ATR and Moving Average. Some of these strategies include:
Buying when ATR crosses above the Moving Average, with the expectation that the price will rise.
Selling when ATR crosses below the Moving Average, with the expectation that the price will fall.
Using the crossover between ATR and Moving Average as a filter for other trading strategies, such as trend analysis or pattern recognition.
In summary, the crossover between ATR and Moving Average can be an important indicator of changes in the market, and can be used as a technical analysis tool to identify trading opportunities. However, it is important to remember that no trading strategy is foolproof, and that it is always important to use a disciplined approach and manage risk adequately.
