ATR 3x Multiplier StrategyBeta version
Volatility and Candle Spikes in Trading
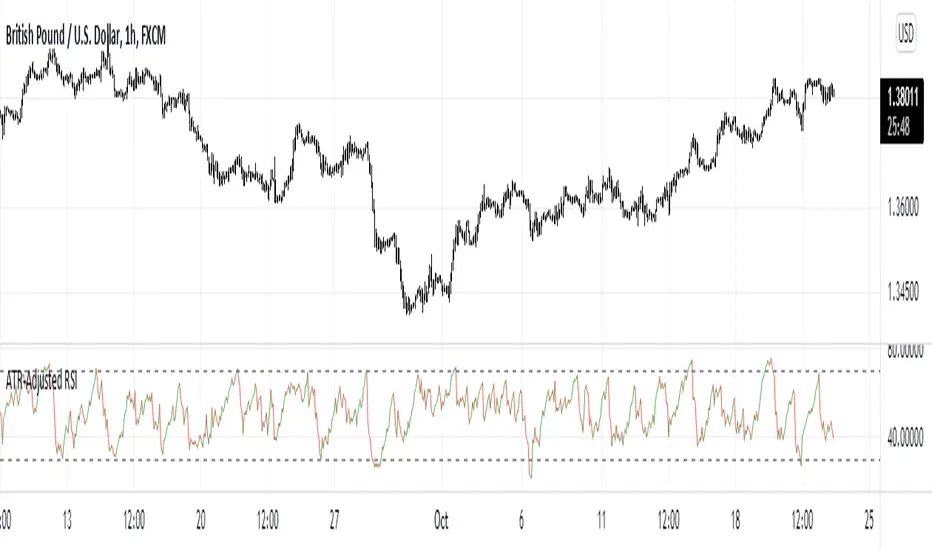
Volatility
Volatility refers to the degree of variation in the price of a financial asset over time. It measures how much the price fluctuates and is often associated with risk and uncertainty in the market. High volatility means larger price swings, while low volatility indicates more stable price movements.
Key aspects of volatility:
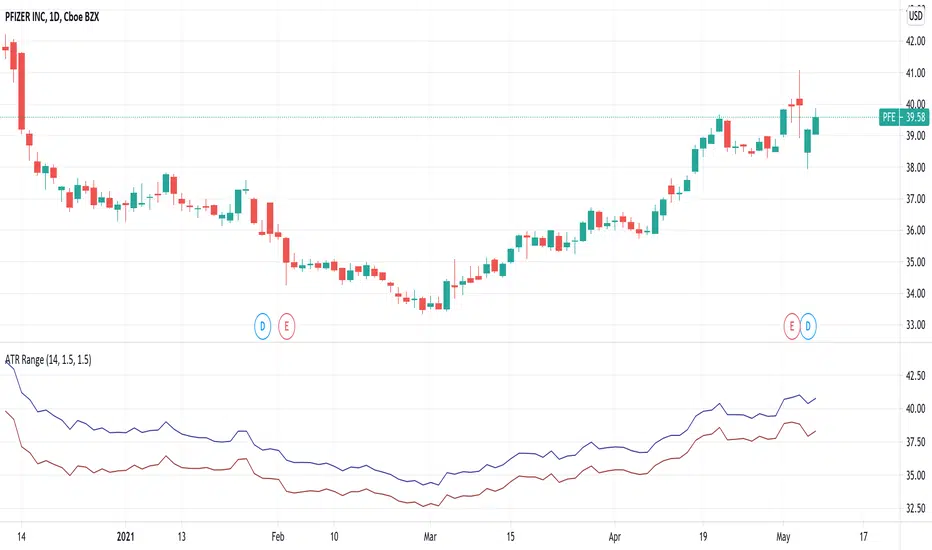
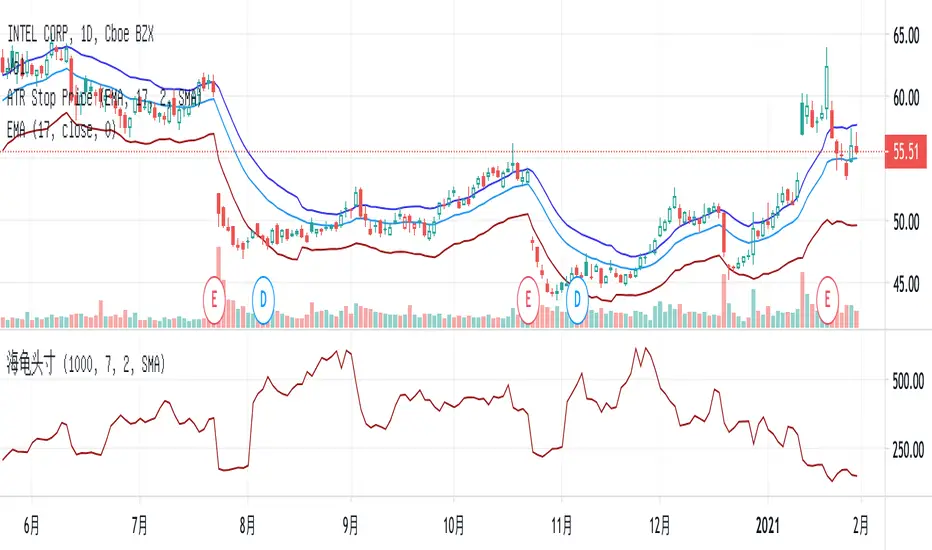
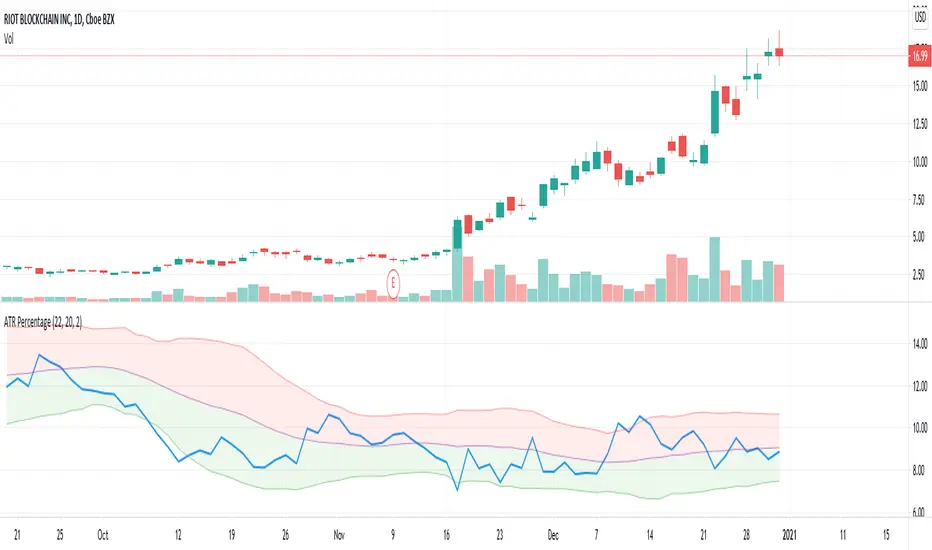
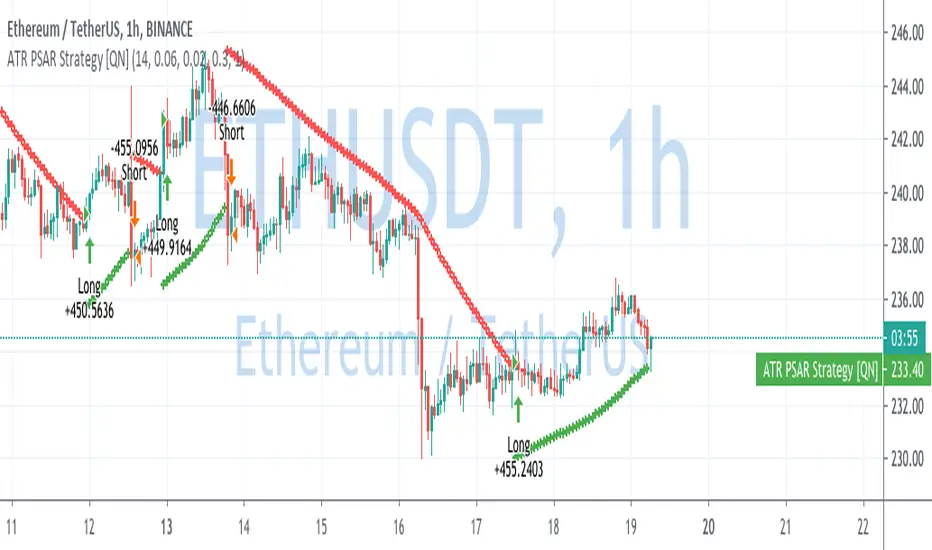
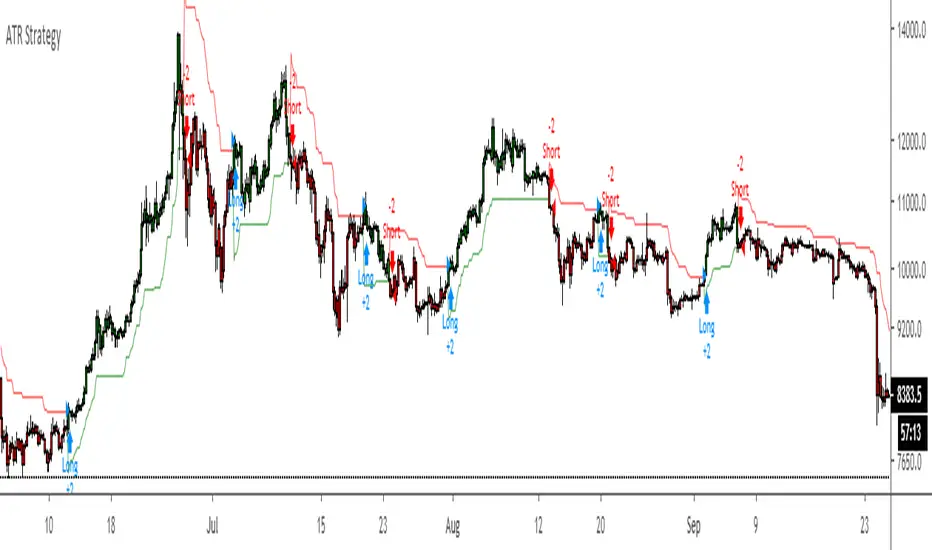
Measured using indicators like Average True Range (ATR), Bollinger Bands, and Implied Volatility (IV).
Influenced by factors such as market news, economic events, and liquidity.
Higher volatility increases both risk and potential profit opportunities.
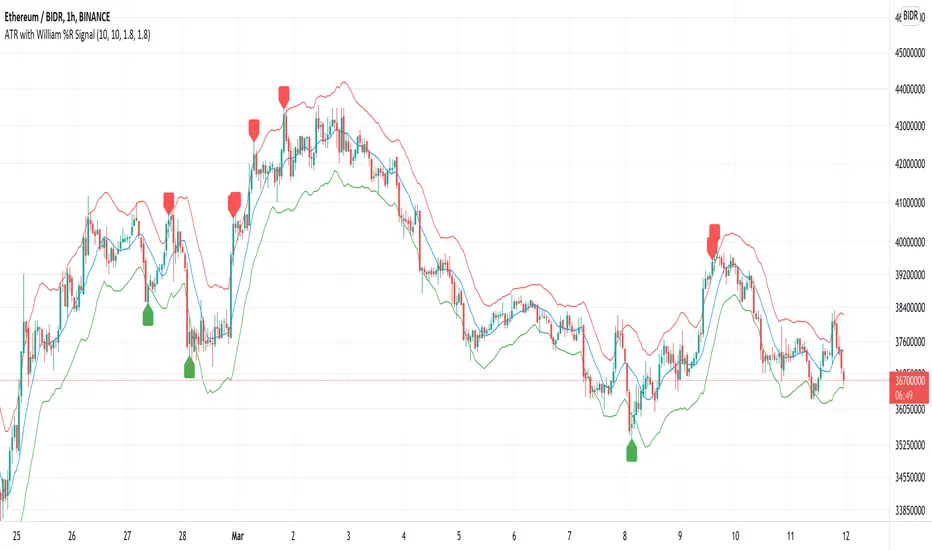
Candle Spikes
A candle spike (or wick) refers to a sudden price movement that forms a long shadow or wick on a candlestick chart. These spikes can indicate strong buying or selling pressure, liquidity hunts, or stop-loss triggers.
Types of candle spikes:
Bullish Spike (Long Lower Wick): Indicates buyers rejected lower prices, pushing the price higher.
Bearish Spike (Long Upper Wick): Suggests sellers rejected higher prices, pushing the price lower.
Stop-Loss Hunt: Market makers may trigger stop-losses by creating artificial spikes before reversing the price.
News-Induced Spikes: Economic data releases or unexpected events can cause sudden price jumps.
Understanding volatility and candle spikes can help traders manage risk, spot entry/exit points, and avoid false breakouts. 🚀📈
Indicatore Pine Script®