Adaptive Pivot (HLC3)SUMMARY:
Standard Pivot (HLC3) with ATR leeway added to make it adaptive to market volatility.
DESCRIPTION:
Adaptive Pivot is an indicator utilizing the simplicity of HLC3 Pivots as a turning point (and sometimes a trend indicator) while addressing it's fixed and inflexible nature.
Because the indicator is just a single line in the chart, the price may go near it but never touch it. Or it can go pass through it and never retest it again. In an attempt to lessen these from occurring, we can combine pivots with average true range (ATR). This is the specific formula I applied in this indicator:
>Upper Pivot = HLC3 + ATR
>Lower Pivot = HLC3 - ATR
This creates a kind of a range or cloud around the Pivot, making it possibly a more accurate indicator for market turning points.
ADJUSTABLE PARAMETERS:
The usual ATR parameters are included in this indicator:
>ATR_Length = input(14, title="ATR Length", minval=1)
>ATR_Smoothing = input(title="ATR Smoothing", defval="RMA", options="RMA", "SMA", "EMA", "WMA")
Added to the usual ones is this:
>ATR_Multiplier = input(1, title="ATR Multiplier", minval=0.1)
which modifies the extent of the ATR (similar to Chandelier Exit) as it is added/subtracted from the pivot values.
Pivot’s timeframe is also adjustable:
>Pivot_Timeframe = input("3M", title='Pivot Resolution')
Note: I did not lock the type to input.resolution to allow for more possible timeframes.
OTHER PARAMETERS
Indicator color will change to green when the open is above the HLC3 Pivot and change to red when the reverse is true.
Cerca negli script per "atr"
ORB + INMERELO ADR + ATRThis indicator provides **two completely different but complementary lines of information** for intraday traders:
# **1. The ORB Line (ADR-Based Context Line)**
The ORB portion of the script focuses on **range expansion** relative to typical daily behavior.
### **What it measures**
* **20-day ADR (Average Daily Range)**
* **Today’s range as a % of ADR**
* **How much of the average range has been “used”** by the time you’re considering an Opening Range Breakout
### **Why it matters for ORB trading**
Successful ORBs thrive when:
* **ADR used% is low** (green) → plenty of fuel left for expansion
* **ADR used% is moderate** (orange) → breakout still possible but less explosive
* **ADR used% is high** (red) → breakout attempts often fail or reverse
### **What the indicator gives you**
A clean, color-coded readout of:
* ADR
* Today’s range
* Used%
* A simple green/orange/red evaluation of ORB quality
This allows a trader to quickly judge whether **conditions favor ORB continuation or mean-reversion reversal**—without manually calculating ranges or switching charts.
---
# **2. The INMERELO Line (ATR Stretch + MA Interaction)**
The INMERELO portion of the script is built around **mean-reversion mechanics**:
the market tends to revert back toward the **first daily MA it crosses under**.
### **How it determines the active MA**
At the start of each session, the script waits for price to cross under:
* **EMA10**
* **EMA21**
* **SMA50**
Whichever MA is crossed first becomes the **active MA** for the day.
If no cross has occurred yet, the indicator shows the **nearest MA**, so traders know exactly what the likely “INMERELO magnet” will be.
### **What it measures**
* **Stretch from the active MA (in ATR units)**
* **20-day ATR regime direction (expanding or contracting)**
* **Daily MA context: E10, E21, or S50**
### **Why it matters for INMERELOs**
This provides:
* The **target MA**
* The **distance to that MA in ATRs**
* A color-coded stretch score:
* **0.6–1.2 ATR** → prime INMERELO zone (Green)
* Moderately stretched → Orange
* Overstretched or dead zone → Red
An up/down arrow shows whether **volatility is expanding or compressing**, which affects expected retrace behavior.
### **What the indicator gives you**
All INMERELO data is displayed in a second compact line:
* Stretch to MA
* Active MA label (E10/E21/S50)
* ATR regime arrow
This allows fast identification of high-probability **mean-reversion trades back to the MA**.
---
# **Summary**
This indicator shows:
### **Line 1 → ORB Context (ADR)**
* Is the stock setup for a powerful breakout?
* How much ADR is left?
* Are you early (good) or late (risky)?
### **Line 2 → INMERELO Context (ATR + MA Stretch)**
* Which MA is in control today (EMA10, EMA21, or SMA50)?
* How many ATRs away from that MA are we?
* Is volatility expanding or contracting?
* Is this a clean INMERELO setup or not?
Together, these two lines give traders the **two most important intraday lenses**:
**range expansion (ORB)** and **mean reversion (INMERELO)**—updated every bar, without clutter.

Volume Order Block Scanner [BOSWaves]Volume Order Block Scanner - Dynamic Detection of High-Volume Supply and Demand Zones
Overview
The Volume Order Block Scanner introduces a refined approach to institutional zone mapping, combining volume-weighted order flow, structural displacement, and ATR-based proportionality to identify regions of aggressive participation from large entities.
Unlike static zone mapping or simplistic body-size filters, this framework dynamically evaluates each candle through a multi-layer model of relative volume, candle structure, and volatility context to isolate genuine order block formations while filtering out market noise.
Each identified zone represents a potential institutional footprint, defined by significant volume surges and efficient body-to-ATR relationships that indicate purposeful positioning. Once mapped, each order block is dynamically adjusted for volatility and tracked throughout its lifecycle - from creation to mitigation to potential invalidation - producing an evolving liquidity map that adapts with price.
This adaptive behavior allows traders to visualize where liquidity was absorbed and where it remains unfilled, revealing the structural foundation of institutional intent across timeframes.
Theoretical Foundation
At its core, the Volume Order Block Scanner is built on the interaction between volume displacement and structural imbalance. Traditional order block systems often rely on fixed candle formations or simple engulfing logic, neglecting the fundamental driver of institutional activity: volume concentration relative to volatility.
This framework redefines that approach. Each candle is filtered through two comparative ratios:
Relative Volume Ratio (RVR) - the candle’s volume compared to its rolling average, confirming genuine transactional surges.
Body-ATR Ratio (BAR) - a measure of displacement efficiency relative to recent volatility, ensuring structural strength.
Only when both conditions align is an order block validated, marking a displacement event significant enough to create a lasting imbalance.
By embedding this logic within a volatility-adjusted environment, the system maintains scalability across asset classes and volatility regimes - equally effective in crypto, forex, or index markets.
How It Works
The Volume Order Block Scanner operates through a structured multi-stage process:
Displacement Detection - Identifies candles whose body and volume exceed dynamic thresholds derived from ATR and rolling volume averages. These represent the origin points of institutional aggression.
Zone Construction - Each qualified candle generates an order block with ATR-proportional dimensions to ensure consistency across instruments and timeframes. The zone includes two regions: Body Zone (the precise initiation point of displacement) and Wick Imbalance (the residual inefficiency representing unfilled liquidity).
Lifecycle Tracking - Each zone is continuously monitored for market interaction. Reactions within a defined window are classified as respected, mitigated, or invalidated, giving traders a data-driven sense of ongoing institutional relevance.
Volume Confirmation Layer - Reinforces signal integrity by ensuring that all detected blocks correspond with meaningful increases in transactional activity.
Temporal Decay Control - Zones that remain untested beyond a set period gradually lose visual and analytical weight, maintaining chart clarity and contextual precision.
Interpretation
The Volume Order Block Scanner visualizes how institutional participants interact with the market through zones of accumulation and distribution.
Bullish order blocks denote demand imbalances where price displaced upward under high volume; bearish order blocks signify supply regions formed by concentrated selling pressure.
Price revisiting these areas often reflects institutional re-entry or liquidity rebalancing, offering actionable insights for both continuation and reversal scenarios.
By continuously monitoring interaction and expiry, the framework enables traders to distinguish between active institutional footprints and historical liquidity artifacts.
Strategy Integration
The Volume Order Block Scanner integrates naturally into advanced structural and order-flow methodologies:
Liquidity Mapping : Identify high-volume regions that are likely to influence future price reactions.
Break-of-Structure Confirmation : Validate BOS and CHOCH signals through aligned order block behavior.
Volume Confluence : Combine with BOSWaves volume or momentum indicators to confirm real institutional intent.
Smart-Money Frameworks : Utilize order block retests as precision entry zones within SMC-based setups.
Trend Continuation : Filter zones in line with higher-timeframe bias to maintain directional integrity.
Technical Implementation Details
Core Engine : Dual-filter mechanism using Relative Volume Ratio (RVR) and Body-ATR Ratio (BAR).
Volatility Framework : ATR-based scaling for cross-asset proportionality.
Zone Composition : Body and wick regions plotted independently for visual clarity of imbalance.
Lifecycle Logic : Real-time monitoring of reaction, mitigation, and invalidation states.
Directional Coloring : Distinct bullish and bearish shading with adjustable transparency.
Computation Efficiency : Lightweight structure suitable for multi-timeframe or multi-asset environments.
Optimal Application Parameters
Timeframe Guidance:
5m - 15m : Reactive intraday zones for short-term liquidity engagement.
1H - 4H : Medium-term structures for swing or intraday trend mapping.
Daily - Weekly : Macro accumulation and distribution footprints.
Suggested Configuration:
Relative Volume Threshold : 1.5× - 2.0× average volume.
Body-ATR Threshold : 0.8× - 1.2× for valid displacement.
Zone Expiry : 5 - 10 bars for intraday use, 15 - 30 for swing/macro contexts.
Parameter optimization should be asset-specific, tuned to volatility conditions and liquidity depth.
Performance Characteristics
High Effectiveness:
Markets exhibiting clear displacement and directional flow.
Environments with consistent volume expansion and liquidity inefficiencies.
Reduced Effectiveness:
Range-bound markets with frequent false impulses.
Low-volume sessions lacking institutional participation.
Integration Guidelines
Confluence Framework : Pair with structure-based BOS or liquidity tools for validation.
Risk Management : Treat active order blocks as contextual areas of interest, not guaranteed reversal points.
Multi-Timeframe Logic : Derive bias from higher-timeframe blocks and execute from refined lower-timeframe structures.
Volume Verification : Confirm each reaction with concurrent volume acceleration to avoid false liquidity cues.
Disclaimer
The Volume Order Block Scanner is a quantitative mapping framework designed for professional traders and analysts. It is not a predictive or guaranteed system of profit.
Performance depends on correct configuration, market conditions, and disciplined risk management. BOSWaves recommends using this indicator as part of a comprehensive analytical process - integrating structural, volume, and liquidity context for accurate interpretation.

MTRADE ATR SL FINDERAverage True Range Stop Loss Finder (ATR)
This indicator automatically calculates dynamic stop-loss levels based on market volatility using the Average True Range (ATR) formula.
It provides both Long and Short stop levels derived from ATR values and adapts them in real time as volatility changes.
🔍 Features
Adjustable ATR Length (default: 20)
Four smoothing methods: RMA, SMA, EMA, WMA
Configurable Multiplier (default: 1.5× ATR)
Real-time High (Short Stop) and Low (Long Stop) lines on the chart
A clean on-chart table displaying:
ATR value
High stop level (H)
Low stop level (L)
— all shown with 7-decimal precision for accurate readings
⚙️ Use Cases
Volatility-based stop-loss and take-profit placement
Risk management and trailing-stop automation
Intraday and swing trading systems using ATR-driven exits
🧠 Technical Details
Built in Pine Script v5
Supports up to 7 decimal precision (precision=7)
Works as an overlay, displaying ATR bands directly on price action
Fully customizable colors and smoothing logic
by fiyatherseydir

Market Pressure Differential (MPD) [SharpStrat]Market Pressure Differential (MPD)
Concept & Purpose
The Market Pressure Differential (MPD) is a proprietary indicator designed to measure the internal balance of buying and selling pressure directly on the price chart.
Unlike standard momentum or trend indicators, MPD analyzes the structural behavior of each candle—its body, wicks, and overall range—to determine whether the market is dominated by expansion (buying aggression) or contraction (selling absorption).
This indicator provides a visual overlay of market pressure that adapts dynamically to volatility, helping traders see real-time shifts in participation intensity without using oscillators.
In simple terms:
When MPD expands upward → buyer pressure dominates.
When MPD contracts downward → seller pressure dominates.
Calculation Overview
MPD uses a structural candle formula to compute directional pressure:
Body Ratio = (Close − Open) / (High − Low)
Wick Differential = (Lower Wick − Upper Wick) / (High − Low)
Raw Pressure = (Body Ratio × Body Weight) + (Wick Differential × Wick Weight)
Then it applies:
EMA smoothing (to stabilize short-term noise)
Standard deviation normalization (to maintain consistent scaling)
ATR projection (to adapt the signal visually to volatility)
This produces the MPD projection line and the pressure ribbon, drawn directly on the main chart.
Customizable Inputs
Users can adjust color schemes, EMA smoothing length, ATR parameters, normalization length, and body/wick weighting to adapt the indicator’s sensitivity and aesthetic to different markets or chart themes.
How to Use
The Market Pressure Differential (MPD) visualizes the real-time balance between buying and selling pressure. It should be used as a contextual bias tool, not a standalone signal generator.
The white line represents the MPD projection, showing how market pressure evolves in real time based on candle structure and volatility.
The red line represents the ATR envelope, which defines the market’s expected volatility range.
MPD reacts quickly to candle structure, so trend bias is based on how its projection behaves relative to the ATR envelope:
Above the ATR band → positive pressure and bullish bias.
Below the ATR band → negative pressure and bearish bias.
Hovering near the ATR band → neutral or indecisive conditions.
The MPD percentage in the label represents the normalized strength of pressure relative to recent volatility.
Positive % = buying dominance.
Negative % = selling dominance.
Higher absolute values = stronger momentum compared to volatility.
To trade with MPD:
Watch candle colors and the projection line — green or positive % shows buyer control, red or negative % shows seller control.
Note transitions above or below the ATR level for early signs of momentum shifts.
Combine MPD signals with price structure, key levels, or volume for confirmation.
This helps reveal which side controls the market and whether that pressure is strong enough to overcome typical volatility.
Disclaimer
It introduces a novel structural–pressure approach to visualizing market dynamics.
For educational and analytical purposes only; this does not constitute financial advice.

Grand Master's Candlestick Dominance (ATR Enhanced)### Grand Master's Candlestick Dominance (ATR Enhanced)
**Overview**
Unleash the ancient wisdom of Japanese candlestick charting with a modern twist! This comprehensive Pine Script v5 strategy and indicator scans for over 75 classic and advanced candlestick patterns (bullish, bearish, and neutral), assigning dynamic strength scores (1-10) to each for precise signal filtering. Enhanced with Average True Range (ATR) for volatility-aware body size validation, it dominates the markets by combining timeless pattern recognition with robust confirmation layers. Whether used as a backtestable strategy or visual indicator, it empowers traders to spot high-probability reversals, continuations, and indecision setups with surgical accuracy.
Inspired by Steve Nison's *Japanese Candlestick Charting Techniques*, this tool elevates pattern analysis beyond basics—think Hammers, Engulfing patterns, Morning Stars, and rare gems like Abandoned Baby or Concealing Baby Swallow—all consolidated into intelligent arrays for real-time averaging and prioritization.
**Key Features**
- **Extensive Pattern Library**:
- **Bullish (25+ patterns)**: Hammer (8.0), Bullish Engulfing (10.0), Morning Star (7.0), Three White Soldiers (9.0), Dragonfly Doji (8.0), and more (e.g., Rising Three, Unique Three River Bottom).
- **Bearish (25+ patterns)**: Hanging Man (8.0), Bearish Engulfing (10.0), Evening Star (7.0), Three Black Crows (9.0), Gravestone Doji (8.0), and exotics like Upside Gap Two Crows or Stalled Pattern.
- **Neutral/Indecision (34+ patterns)**: Doji variants (Long-Legged, Four Price), Spinning Tops, Harami Crosses, and multi-bar setups like Upside Tasuki Gap or Advancing Block.
Each pattern includes duration tracking (1-5 bars) and ATR-adjusted body/shadow criteria for relevance in volatile conditions.
- **Smart Confirmation Filters** (All Toggleable):
- **Trend Alignment**: 20-period SMA (customizable) ensures entries align with the prevailing trend; optional higher timeframe (e.g., Daily) MA crossover for multi-timeframe confluence.
- **Support/Resistance (S/R)**: Pivot-based levels with 0.01% tolerance to confirm bounces or breaks.
- **Volume Surge**: 20-period volume MA with 1.5x spike multiplier to validate momentum.
- **ATR Body Sizing**: Filters small bodies (<0.3x ATR) and long bodies (>0.8x ATR) for context-aware pattern reliability.
- **Follow-Through**: Ensures post-pattern confirmation via bullish/bearish closes or closes beyond prior bars.
Minimum average strength (default 7.0) and individual pattern thresholds (5.0) prevent weak signals.
- **Entry & Exit Logic**:
- **Long Entry**: Bullish average strength ≥7.0 (outweighing bearish), uptrend, volume spike, near support, follow-through, and HTF alignment.
- **Short Entry**: Mirror for bearish dominance in downtrends near resistance.
- **Exits**: Bearish/neutral shift, or fixed TP (5%) / SL (2%)—pyramiding disabled, 10% equity sizing.
- Backtest range: Jan 1, 2020 – Dec 31, 2025 (editable). Initial capital: $10,000.
- **Interactive Dashboard** (Top-Right Panel):
Real-time insights including:
- Market phase (e.g., "Bullish Phase (Avg Str: 8.2)"), active pattern (e.g., "BULLISH: Bullish Engulfing (Str: 10.0, Bars: 2)"), and trend status.
- Strength breakdowns (Bull/Bear/Neutral counts & averages).
- Filter status (e.g., "Volume: ✔ Spike", "ATR: Enabled (L:0.8, S:0.3)").
- Backtest stats: Total trades, win rate, streak, and last entry/exit details (price & timestamp).
Toggle mode: Strategy (live trades) or Indicator (signals only).
- **Advanced Alerts** (15+ Toggleable Types):
Set up via TradingView's "Any alert() function call" for bar-close triggers:
- Entry/Exit signals with strength & pattern details.
- Strong patterns (≥2 bullish/bearish), neutral indecision, volume spikes.
- S/R breakouts, HTF reversals, high-confidence singles (≥8.0 strength).
- Conflicting signals, MA crossovers, ATR volatility bursts, multi-bar completions.
Example: "STRONG BULLISH PATTERN detected! Strength: 9.5 | Top Pattern: Three White Soldiers | Trend: Up".
**Customization & Usage Tips**
- **Inputs Groups**: Strategy toggles, confirmations, exits, backtest dates, and 15+ alert switches—all intuitively grouped.
- **Optimization**: Tune min strengths for aggressive (lower) or conservative (higher) trading; enable/disable filters to suit your style (e.g., disable S/R for scalping).
- **Best For**: Forex, stocks, crypto on 1H–Daily charts. Test on historical data to refine TP/SL.
- **Limitations**: No external data installs; relies on built-in TA functions. Patterns are probabilistic—combine with your risk management.
Master the candles like a grandmaster. Deploy on TradingView, backtest relentlessly, and let dominance begin! Questions? Drop a comment.
*Version: 1.0 | Updated: September 2025 | Credits: Built on Pine Script v5 with nods to Nison's timeless techniques.*

Daily Buy/Sell Triggers + ATR TargetsThis tool gives you a once-per-day, objective ATR map: Buy Trigger above the open, Sell Trigger below the open, clean ATR targets, and FULL ATR extremes. It’s designed for clarity, precision, and zero intraday repainting so you can plan the session and execute with confidence.
This indicator prints a new, static grid of intraday levels every New York 18:00 (end of the NY trading day). The grid is anchored at the day’s open and spaced by the Daily ATR so you get tick-precise Buy Trigger, Sell Trigger, intermediate ATR targets, and the FULL ATR bounds for the session.
The levels act as objective support/resistance and intraday measuring sticks for continuation, mean-reversion, and range expansion trades.
What you see on the chart
A thin midline at the Daily Open (anchor).
Green lines above, red lines below, spaced at your chosen ATR multiples.
Text at the far right for:
Buy trigger
Sell trigger
FULL ATR (both sides)
Intermediate targets are unlabeled to keep the chart clean (they’re still tradable S/R).
HMA Crossover + ATR + Curvature (Long & Short)📏 Hull Moving Averages (Trend Filters)
- fastHMA = ta.hma(close, fastLength)
- slowHMA = ta.hma(close, slowLength)
These two HMAs act as dynamic trend indicators:
- A bullish crossover of fast over slow HMA signals a potential long setup.
- A bearish crossunder triggers short interest.
⚡️ Curvature (Acceleration Filter)
- curv = ta.change(ta.change(fastHMA))
This calculates the second-order change (akin to the second derivative) of the fast HMA — effectively the acceleration of the trend. It serves as a filter:
- For long entries: curv > curvThresh (positive acceleration)
- For short entries: curv < -curvThresh (negative acceleration)
It helps eliminate weak or stagnating moves by requiring momentum behind the crossover.
📈 Volatility-Based Risk Management (ATR)
- atr = ta.atr(atrLength)
- stopLoss = atr * atrMult
- trailStop = atr * trailMult
These define your:
- Initial stop loss: scaled to recent volatility using ATR and atrMult.
- Trailing stop: also ATR-scaled, to lock in gains dynamically as price moves favorably.
💰 Position Sizing via Risk Percent
- capital = strategy.equity
- riskCapital = capital * (riskPercent / 100)
- qty = riskCapital / stopLoss
This dynamically calculates the position size (qty) such that if the stop loss is hit, the loss does not exceed the predefined percentage of account equity. It’s a volatility-adjusted position sizing method, keeping your risk consistent regardless of market conditions.
📌 Execution Logic
- Long Entry: on bullish HMA crossover with rising curvature.
- Short Entry: on bearish crossover with falling curvature.
- Exits: use ATR-based trailing stops.
- Position is closed when trend conditions reverse (e.g., bearish crossover exits the long).
This framework gives you:
- Trend-following logic (via HMAs)
- Momentum confirmation (via curvature)
- Volatility-aware execution and exits (via ATR)
- Risk-controlled dynamic sizing
Want to get surgical and test what happens if we use curvature on the difference between HMAs instead? That might give some cool insights into trend strength transitions.

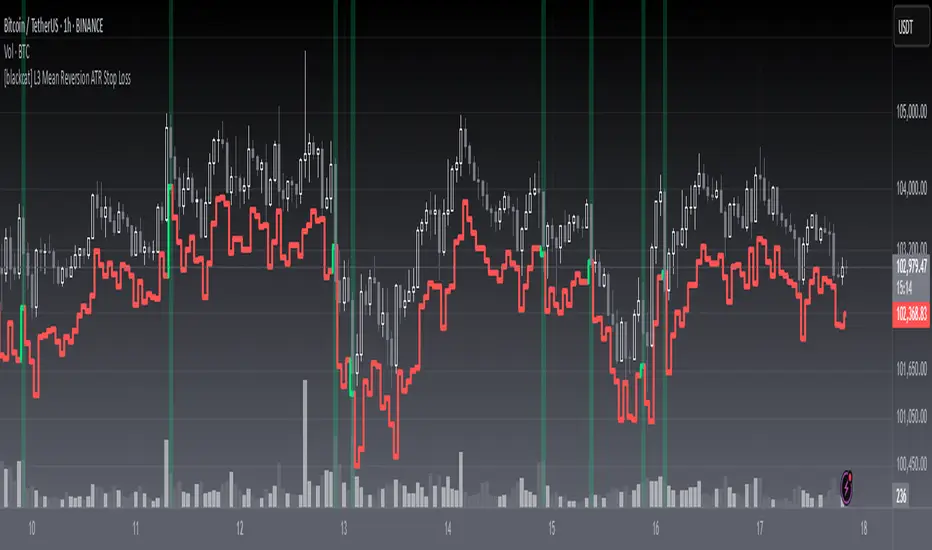
[blackcat] L3 Mean Reversion ATR Stop Loss OVERVIEW
The L3 Mean Reversion ATR Stop Loss indicator is meticulously crafted to empower traders by offering statistically-driven stop-loss levels that adapt seamlessly to evolving market dynamics. By harmoniously blending mean reversion concepts with Advanced True Range (ATR) metrics, it delivers a robust framework for managing risks more effectively. 🌐 The primary objective is to furnish traders with intelligent exit points grounded in both short-term volatility assessments and long-term trend evaluations.
Key highlights encompass:
• Dynamic calculation of Z-scores to evaluate deviations from established means
• Adaptive stop-loss pricing leveraging real-time ATR measurements
• Clear visual cues enabling swift decision-making processes
TECHNICAL ANALYSIS COMPONENTS
📉 Z-SCORE CALCULATION
Measures how many standard deviations an asset's current price lies away from its average
Facilitates identification of extreme conditions indicative of impending reversals
Utilizes simple moving averages and standard deviation computations
📊 STANDARD DEVIATION MEASUREMENT
Quantifies dispersion of closing prices around the mean
Provides insights into underlying price distribution characteristics
Crucial for assessing potential volatility levels accurately
🕵️♂️ ADAPTIVE STOP-LOSS DETECTION
Employs ATR as a proxy for prevailing market volatility
Modulates stop-loss placements dynamically responding to shifting trends
Ensures consistent adherence to predetermined risk management protocols
INDICATOR FUNCTIONALITY
🔢 Core Algorithms
Integrate Smooth Moving Averages (SMAs) alongside standardized deviation formulas
Generate precise Z-scores reflecting true price deviations
Leverage ATR-derived multipliers for fine-grained stop-loss adjustments
🖱️ User Interface Elements
Interactive plots displaying real-time stop-loss markers
Context-sensitive color coding enhancing readability
Background shading indicating proximity to stop-level activations
STRATEGY IMPLEMENTATION
✅ Entry Conditions
Confirm bullish/bearish setups validated through multiple confirmatory signals
Ensure alignment between Z-score readings and broader trend directions
Validate entry decisions considering concurrent market sentiment factors
🚫 Exit Mechanisms
Trigger exits upon hitting predefined ATR-based stop-loss thresholds
Monitor continuous breaches signifying potential trend reversals
Execute partial/total closes contingent upon cumulative loss limits
PARAMETER CONFIGURATIONS
🎯 Optimization Guidelines
Period Length: Governs responsiveness versus smoothing trade-offs
ATR Length: Dictates the temporal scope for volatility analysis
Stop Loss ATR Multiplier: Tunes sensitivity towards stop-trigger activations
💬 Customization Recommendations
Commence with baseline defaults; iteratively refine parameters
Evaluate impacts independently prior to combined adjustments
Prioritize minimizing erroneous trigger occurrences first
Sustain balanced risk-reward profiles irrespective of chosen settings
ADVANCED RISK MANAGEMENT
🛡️ Proactive Risk Mitigation Techniques
Enforce strict compliance with pre-defined maximum leverage constraints
Mandatorily apply trailing stop-loss orders conforming to script outputs
Allocate positions proportionately relative to available capital reserves
Conduct periodic reviews gauging strategy effectiveness rigorously
⚠️ Potential Pitfalls & Solutions
Address frequent violations arising during heightened volatility phases
Manage false alerts warranting manual interventions judiciously
Prepare contingency plans mitigating margin call possibilities
Continuously assess automated system reliability amidst fluctuating conditions
PERFORMANCE AUDITS & REFINEMENTS
🔍 Critical Evaluation Metrics
Assess win percentages consistently across diverse trading instruments
Calculate average profit ratios per successful execution
Measure peak drawdown durations alongside associated magnitudes
Analyze signal generation frequencies revealing hidden patterns
📈 Historical Data Analysis Tools
Maintain comprehensive records capturing every triggered event
Compare realized profits/losses against backtested simulations
Identify recurrent systematic errors demanding corrective actions
Implement iterative refinements bolstering overall efficacy steadily
PROBLEM SOLVING ADVICE
🔧 Frequent Encountered Challenges
Unpredictable behaviors emerging within thinly traded markets
Latency issues manifesting during abrupt price fluctuations
Overfitted models yielding suboptimal results post-extensive tuning
Inaccuracies stemming from incomplete or delayed data inputs
💡 Effective Resolution Pathways
Exclude low-liquidity assets prone to erratic movements
Introduce buffer intervals safeguarding major news/event impacts
Limit ongoing optimization attempts preventing model degradation
Verify seamless connectivity ensuring uninterrupted data flows
USER ENGAGEMENT SEGMENT
🤝 Community Contributions Welcome
Highly encourage active participation sharing experiences & recommendations!
THANKS
A heartfelt acknowledgment extends to all developers contributing invaluable insights about adaptive stop-loss strategies using statistical measures! ✨
Horizontal ATR LinesDisclaimer:
This script was generated using OpenAI’s ChatGPT. I take no responsibility for the correctness, performance, or financial impact of this indicator. Use it at your own risk and discretion.
This indicator draws horizontal ATR-based levels from the last closed candle on a user-selected timeframe. It is designed for traders who want to visualize realistic volatility zones for setting dynamic support/resistance, take-profit, or stop-loss levels.
What it does:
Calculates the Average True Range (ATR) using a customizable period and timeframe.
Plots four horizontal lines:
+1 ATR and –1 ATR from the last closed candle’s close
+X ATR and –X ATR, where X is a second custom multiplier
Each level includes a compact label showing:
The price of the level
The percentage distance from the close price
Use cases:
Identify realistic intraday or swing price movement boundaries
Build volatility-aware take-profit and stop-loss zones
Visually track market compression or expansion in context
Customization:
ATR period and timeframe
Two independent ATR multipliers
Custom color settings for each group of levels

[Stop!Loss] ADR Signal ADR Signal - a technical indicator located in a separate window, which displays by default the 80%-level , as well as the 100%-level of the average daily range (ADR) for the last 10 days and compares it with the current intraday range. The indicator helps not only with the use of a mathematical-statistical method to identify a potential reversal at the moment during intraday trading, but can also serves as an effective assistant in risk management.
👉 Basic mechanics of the indicator
Firstly, this indicator tracks the performance of the standard ATR indicator on the daily chart, in other words, ADR (Average Daily Range).
Important ❗️The ATR (Average True Range) indicator was created by J. Welles Wilder Jr. He first introduced ATR in his book "New Concepts in Technical Trading Systems", published in 1978. Wilder developed this indicator to measure market volatility to help traders estimate the range of price movements. This indicator is built into TradingView, more details can be found by link: www.tradingview.com
Like ATR , ADR calculates the average true range for a specified period. In this case, the distance in points from the maximum of each day to its minimum is calculated, after which the arithmetic mean is calculated - this is ADR .
👉 Visualization
ADR Signal is located in a separate window on the chart and has 3 levels:
1) "ADR level" (green line) - the same parameter, the calculations of which are briefly described above. There is 100%-level of ATR on the daily chart (ADR).
2) "Current level" (red line) - this is the current price passage within the day, calculated in points. At the start of a new day, this parameter is reset. Therefore, in the indicator window, this line has sharp drops at the start of a new trading day: "A new trading day - the instrument's power reserve is renewed again".
3) "Signal level" (blue line) - this is an individually customized value that demonstrates a certain part of the ADR parameter.
👉 Inputs
1) - is responsible for the ATR indicator period, the value of which will always be calculated on the daily chart. The default value is "10", that is, ATR is calculated for the last 10 days (not including the current one).
2) - signal level (in %). The default value is "0.8", that is, 80%-level of the ADR parameter (set earlier) is calculated.
👉 Style
1) - by default, this level is colored "blue".
2) - by default, this level is colored "red".
3) - by default, this level is colored "green".
👉 How to use this indicator
Important❗️ The two methods of the use of the ADR Signal indicator described below will be most effective when trading intraday (which is highlighted quite well below), so it is more logical to use the indicator information on time periods H1 and below.
1) Identifying potential reversals during intraday trading:
The ADR Signal indicator can be used as a potential individual reversal strategy.
Important ❗️It should be noted that using it in it without additional confirming analysis tools will be a rather aggressive trading approach. Therefore, it is best to support the entry point in particular with other methods.
In this case, the crossing of the red line (the number of points passed within the current day, that is, from the minimum of the current day to its maximum) and the blue line (color of the Signal level based on the default settings), indicates that the trading instrument has passed 80% (based on the default settings for the "Signal level") of its average distance from the maximum to the minimum over the past 10 days (based on the default settings for the "ADR Length"). Such a situation in the context of the mathematical-statistical approach indicates a probable reversal, since the "power reserve" of this instrument is mostly exhausted, so one can expect with a higher probability, at least, a price stop and possibly a reversal. In case of crossing of the red line and the green one (ADR level), it says again that based on the mathematical-statistical approach, this trading instrument has completely exhausted its intraday "power reserve". In this situation, a stop or reversal of the price will be even more likely.
Of course, using the "Signal level" parameter, one can filter out even more reliable situations for potential price reversals within a day, namely, by specifying, for example, 1.5 in the field of this parameter. Under such conditions, in the case of crossing the red and blue lines (based on the default style settings), to say that the trading instrument has passed 150% of its average distance over the last 10 days (based on the default style settings "ADR length"). In this case, the probability of a stop or reversal of the price increases even more.
2) Use in risk management:
In terms of risk management, this indicator is more applicable to open trades. For example, if one had an open Buy-position (especially if it is an intraday trade) and the price has raised significantly during the day, then the crossing of the red line with the blue line , and especially the red line with the green line , may indicate that the price will most likely stop growing, since the "power reserve" is almost or completely exhausted for this instrument within the current day. In this case, one can, at a minimum, move the trade to breakeven or even partially fix the profit.
We will continue to discuss the methods of using this indicator and strategies based on it here. And we are always waiting for your reactions and feedback on this topic 💬.
Thank you for your support 🚀

RSI Divergence Strategy - AliferCryptoStrategy Overview
The RSI Divergence Strategy is designed to identify potential reversals by detecting regular bullish and bearish divergences between price action and the Relative Strength Index (RSI). It automatically enters positions when a divergence is confirmed and manages risk with configurable stop-loss and take-profit levels.
Key Features
Automatic Divergence Detection: Scans for RSI pivot lows/highs vs. price pivots using user-defined lookback windows and bar ranges.
Dual SL/TP Methods:
- Swing-based: Stops placed a configurable percentage beyond the most recent swing high/low.
- ATR-based: Stops placed at a multiple of Average True Range, with a separate risk/reward multiplier.
Long and Short Entries: Buys on bullish divergences; sells short on bearish divergences.
Fully Customizable: Input groups for RSI, divergence, swing, ATR, and general SL/TP settings.
Visual Plotting: Marks divergences on chart and plots stop-loss (red) and take-profit (green) lines for active trades.
Alerts: Built-in alert conditions for both bullish and bearish RSI divergences.
Detailed Logic
RSI Calculation: Computes RSI of chosen source over a specified period.
Pivot Detection:
- Identifies RSI pivot lows/highs by scanning a lookback window to the left and right.
- Uses ta.barssince to ensure pivots are separated by a minimum/maximum number of bars.
Divergence Confirmation:
- Bullish: Price makes a lower low while RSI makes a higher low.
- Bearish: Price makes a higher high while RSI makes a lower high.
Entry:
- Opens a Long position when bullish divergence is true.
- Opens a Short position when bearish divergence is true.
Stop-Loss & Take-Profit:
- Swing Method: Computes the recent swing high/low then adjusts by a percentage margin.
- ATR Method: Uses the current ATR × multiplier applied to the entry price.
- Take-Profit: Calculated as entry price ± (risk × R/R ratio).
Exit Orders: Uses strategy.exit to place bracket orders (stop + limit) for both long and short positions.
Inputs and Configuration
RSI Settings: Length & price source for the RSI.
Divergence Settings: Pivot lookback parameters and valid bar ranges.
SL/TP Settings: Choice between Swing or ATR method.
Swing Settings: Swing lookback length, margin (%), and risk/reward ratio.
ATR Settings: ATR length, stop multiplier, and risk/reward ratio.
Usage Notes
Adjust the Pivot Lookback and Range values to suit the volatility and timeframe of your market.
Use higher ATR multipliers for wider stops in choppy conditions, or tighten swing margins in trending markets.
Backtest different R/R ratios to find the balance between win rate and reward.
Disclaimer
This script is for educational purposes only and does not constitute financial advice. Trading carries significant risk and you may lose more than your initial investment. Always conduct your own research and consider consulting a professional before making any trading decisions.

Fib BB on VWMA*ATRThis TradingView Pine Script is designed to plot Fibonacci Bollinger Bands on a Volume Weighted Moving Average (VWMA) using the Average True Range (ATR). The script takes a higher timeframe (HTF) approach, allowing traders to analyze price action and volatility from a broader market perspective.
🔹 How It Works
Higher Timeframe Data Integration
Users can select a specific timeframe to calculate the VWMA and ATR.
This allows for a more macro perspective, avoiding the noise of lower timeframes.
Volume Weighted Moving Average (VWMA)
Unlike the Simple Moving Average (SMA), VWMA gives higher weight to price movements with larger volume.
Calculation Formula:
𝑉𝑊𝑀𝐴=∑(𝐶𝑙𝑜𝑠𝑒×𝑉𝑜𝑙𝑢𝑚𝑒) / ∑𝑉𝑜𝑙𝑢𝑚𝑒
Since VWMA accounts for volume, it is more reactive to price zones with high buying or selling activity, making it useful for identifying liquidity zones.
ATR-Based Fibonacci Bollinger Bands
The Average True Range (ATR) is used to measure market volatility.
Instead of standard deviation-based Bollinger Bands, Fibonacci multipliers (2.618, 3.0, 3.414) are applied to ATR.
These bands adjust dynamically with market volatility.
🔹 Key Findings from Exploration
Through testing and analysis, this indicator seems to effectively detect supply and demand zones, particularly at the Fibonacci levels of 2.618 to 3.414.
Price frequently reacts at these bands, indicating that they capture key liquidity zones.
Potential Order Block Detection:
The ends of the Fibonacci Bollinger Bands (especially at 2.618, 3.0, and 3.414) tend to align with order blocks—areas where institutional traders previously accumulated or distributed positions.
This is particularly useful for order flow traders who focus on unfilled institutional orders.
🔹 How to Use This Indicator?
Identifying Order Blocks
When price reaches the upper or lower bands, check if there was a strong reaction (rejection or consolidation).
If price rapidly moves away from a band, that level might be an order block.
Spotting Liquidity Pools
VWMA’s nature enhances liquidity detection since it emphasizes high-volume price action.
If a price level repeatedly touches the band without breaking through, it suggests institutional orders may be absorbing liquidity there.
Trend Confirmation
If VWMA is trending upwards and price keeps rejecting the lower bands, it confirms a strong bullish trend.
Conversely, constant rejection from the upper bands suggests a bearish market.
This script is designed for open-source publication and offers traders a refined approach to detecting order blocks and liquidity zones using Fibonacci-based volatility bands.
📌 한글 설명 (상세 설명)
이 트레이딩뷰 파인스크립트는 거래량 가중 이동평균(VWMA)과 평균 실제 범위(ATR)를 활용하여 피보나치 볼린저 밴드를 표시하는 지표입니다.
또한, 고차 타임프레임(HTF) 데이터를 활용하여 시장의 큰 흐름을 분석할 수 있도록 설계되었습니다.
🔹 지표 작동 방식
고차 타임프레임(HTF) 데이터 적용
사용자가 원하는 타임프레임을 선택하여 VWMA와 ATR을 계산할 수 있습니다.
이를 통해 더 큰 시장 흐름을 분석할 수 있으며, 저타임프레임의 노이즈를 줄일 수 있습니다.
거래량 가중 이동평균(VWMA) 적용
VWMA는 단순 이동평균(SMA)보다 거래량이 많은 가격 움직임에 더 큰 가중치를 부여합니다.
계산 공식:
𝑉𝑊𝑀𝐴=∑(𝐶𝑙𝑜𝑠𝑒×𝑉𝑜𝑙𝑢𝑚𝑒) / ∑𝑉𝑜𝑙𝑢𝑚𝑒
거래량이 많이 발생한 가격 구간을 강조하는 특성이 있어, 시장의 유동성 구간을 더 정확히 포착할 수 있습니다.
ATR 기반 피보나치 볼린저 밴드 생성
ATR(Average True Range)를 활용하여 변동성을 측정합니다.
기존의 표준편차 기반 볼린저 밴드 대신, 피보나치 계수(2.618, 3.0, 3.414)를 ATR에 곱하여 밴드를 생성합니다.
이 밴드는 시장 변동성에 따라 유동적으로 조정됩니다.
🔹 탐구 결과: 매물대 및 오더블록 감지
테스트를 통해 Fibonacci 2.618 ~ 3.414 구간에서 매물대 및 오더블록을 포착하는 경향이 있음을 확인했습니다.
가격이 피보나치 밴드(특히 2.618, 3.0, 3.414)에 닿을 때 반응하는 경우가 많음
VWMA의 특성을 통해 오더블록을 감지할 가능성이 높음
🔹 오더블록(Order Block) 감지 원리
Fibonacci 밴드 끄트머리(2.618 ~ 3.414)에서 가격이 강하게 반응
이 영역에서 가격이 강하게 튀어 오르거나(매수 압력) 급락하는(매도 압력) 경우,
→ 기관들이 포지션을 청산하거나 추가 매집하는 구간일 가능성이 큼.
과거에 대량 주문이 체결된 가격 구간(= 오더블록)일 수 있음.
VWMA를 통한 유동성 감지
VWMA는 거래량이 집중된 가격을 기준으로 이동하기 때문에, 기관 주문이 많이 들어온 가격대를 강조하는 특징이 있음.
따라서 VWMA와 피보나치 밴드가 만나는 지점은 유동성이 높은 핵심 구간이 될 가능성이 큼.
매물대 및 청산 구간 분석
가격이 밴드에 도달했을 때 강한 반등이 나오는지를 확인 → 오더블록 가능성
가격이 밴드를 여러 번 테스트하면서 돌파하지 못한다면, 해당 지점은 강한 매물대일 가능성
🔹 활용 방법
✅ 오더블록 감지:
가격이 밴드(2.618~3.414)에 닿고 강하게 튕긴다면, 오더블록 가능성
해당 지점에서 거래량 증가 및 강한 반등 발생 시 매수 고려
✅ 유동성 풀 확인:
VWMA와 피보나치 밴드가 만나는 구간에서 반복적으로 거래량이 터진다면, 해당 지점은 기관 유동성 구간일 가능성
✅ 추세 확인:
VWMA가 상승하고 가격이 밴드 하단(지지선)에서 튕긴다면 강한 상승 추세
VWMA가 하락하고 가격이 밴드 상단(저항선)에서 거부당하면 하락 추세 지속

Heiken Ashi Supertrend ATR-SL StrategyThis indicator combines Heikin Ashi candle pattern analysis with Supertrend to generate high-probability trading signals with built-in risk management. It identifies potential entries and exits based on specific Heikin Ashi candlestick formations while providing automated ATR-based stop loss management.
Trading Logic:
The system generates long signals when a green Heikin Ashi candle forms with no bottom wick (indicating strong bullish momentum). Short signals appear when a red Heikin Ashi candle forms with no top wick (showing strong bearish momentum). The absence of wicks on these candles signals a high-conviction market move in the respective direction.
Exit signals are triggered when:
1. An opposite pattern forms (red candle with no top wick exits longs; green candle with no bottom wick exits shorts)
2. The ATR-based stop loss is hit
3. The break-even stop is activated and then hit
Technical Approach:
- Select Heiken Ashi Canldes on your Trading View chart. Entried are based on HA prices.
- Supertrend and ATR-based stop losses use real price data (not HA values) for trend determination
- ATR-based stop losses automatically adjust to market volatility
- Break-even functionality moves the stop to entry price once price moves a specified ATR multiple in your favor
Risk Management:
- Default starting capital: 1000 units
- Default risk per trade: 10% of equity (customizable in strategy settings)
- Hard Stop Loss: Set ATR multiplier (default: 2.0) for automatic stop placement
- Break Even: Configure ATR threshold (default: 1.0) to activate break-even stops
- Appropriate position sizing relative to equity and stop distance
Customization Options:
- Supertrend Settings:
- Enable/disable Supertrend filtering (trade only in confirmed trend direction)
- Adjust Factor (default: 3.0) to change sensitivity
- Modify ATR Period (default: 10) to adapt to different timeframes
Visual Elements:
- Green triangles for long entries, blue triangles for short entries
- X-marks for exits and stop loss hits
- Color-coded position background (green for long, blue for short)
- Clearly visible stop loss lines (red for hard stop, white for break-even)
- Comprehensive position information label with entry price and stop details
Implementation Notes:
The indicator tracks positions internally and maintains state across bars to properly manage stop levels. All calculations use confirmed bars only, with no repainting or lookahead bias. The system is designed for swing trading on timeframes from 1-hour and above, where Heikin Ashi patterns tend to be more reliable.
This indicator is best suited for traders looking to combine the pattern recognition strengths of Heikin Ashi candles with the trend-following capabilities of Supertrend, all while maintaining disciplined risk management through automated stops.

PlanDeFi: Adaptive Trend Ribbons [ATR+RSI]#### **Overview**
The **Crypto Half-Trend Pro ** is a trend-following indicator designed to identify bullish and bearish market conditions using a combination of **moving averages, volatility adjustments, and dynamic ATR bands**. This enhanced version improves on the traditional Half-Trend system by incorporating **EMA smoothing, volatility-based adjustments, and additional fakeout/reversal detection mechanisms**.
#### **Key Features**
✅ **Trend Detection:**
- Uses a combination of fast and slow moving averages (EMA/SMA) to determine trend direction.
- Implements **Hull Moving Average (HMA)** smoothing for better trend visualization.
✅ **Dynamic ATR Bands:**
- Adjusts bands based on market volatility using **RSI-based ATR multipliers**.
- Helps identify potential **breakouts and trend reversals**.
✅ **Fakeout & Reversal Detection:**
- Detects potential **fake breakouts** by analyzing price action against extended ATR bands.
- Identifies **early reversal signals** using price crossovers and volume confirmation.
✅ **Customizable Alerts & Visuals:**
- Built-in **buy & sell signals** for trend confirmation.
- Color-coded bullish/bearish trend lines and **fakeout warnings**.
- **TradingView alerts** for trend shifts and reversals.
#### **How It Works**
🔹 The indicator calculates a **smoothed trend line** using a Hull Moving Average on dynamic price levels.
🔹 ATR bands expand/contract dynamically based on **market volatility** to improve signal accuracy.
🔹 Trend direction is confirmed when price crosses the trend line **with volume confirmation**.
🔹 **Fakeouts** are detected when price temporarily exceeds extended bands but fails to hold momentum.
🔹 **Reversal signals** are generated when price breaks back into the ATR zone with volume spikes.
#### **How to Use It**
- 📈 **Buy Signal:** When price breaks above the trend line, confirmed by volume and crossover signals.
- 📉 **Sell Signal:** When price breaks below the trend line with confirmed bearish conditions.
- 🚨 **Reversal Warning:** If price sharply re-enters the ATR zone with volume confirmation, expect a potential trend shift.
- 🛑 **Fakeout Alert:** If price temporarily breaks resistance but closes back inside, it may be a false move.
#### **Ideal For**
✔️ Crypto & Forex traders looking for **dynamic trend signals**
✔️ Swing traders wanting to **avoid fakeouts & catch reversals**
✔️ Traders seeking a **customizable, volatility-adjusted trend system**
🚀 **Try PlanDeFi: Adaptive Trend Ribbons today and improve your trend analysis!**

HMA Gaussian Volatility AdjustedOverview
The "HMA Gaussian Volatility Adjusted" indicator introduces a unique combination of HMA smoothing with a Gaussian filter and two components to measure volatility (Average True Range (ATR) and Standard Deviation (SD)). This tool provides traders with a stable and accurate measure of price trends by integrating a Gaussian Filter smoothed using HMA with a customized calculation of volatility. This innovative approach allows for enhanced sensitivity to market fluctuations while filtering out short-term price noise.
Technical Composition and Calculation
The "HMA Gaussian Volatility Adjusted" indicator incorporates HMA smoothing and dynamic standard deviation calculations to build upon traditional volatility measures.
HMA & Gaussian Smoothing:
HMA Calculation (HMA_Length): The script applies a Hull Moving Average (HMA) to smooth the price data over a user-defined period, reducing noise and helping focus on broader market trends.
Gaussian Filter Calculation (Length_Gaussian): The smoothed HMA data is further refined by putting it into a Gaussian filter to incorporate a normal distribution.
Volatility Measurement:
ATR Calculation (ATR_Length, ATR_Factor): The indicator incorporates the Average True Range (ATR) to measure market volatility. The user-defined ATR multiplier is applied to this value to calculate upper and lower trend bands around the Gaussian, providing a dynamic measure of potential price movement based on recent volatility.
Standard Deviation Calculation (SD_Length): The script calculates the standard deviation of the price over a user-defined length, providing another layer of volatility measurement. The upper and lower standard deviation bands (SDD, SDU) act as additional indicators of price extremes.
Momentum Calculation & Scoring
When the indicator signals SHORT:
Diff = Price - Upper Boundary of the Standard Deviation (calculated on a Gaussian filter).
When the indicator signals LONG:
Diff = Price - Upper Boundary of the ATR (calculated on a Gaussian filter).
The calculated Diff signals how close the indicator is to changing trends. An EMA is applied to the Diff to smooth the data. Positive momentum occurs when the Diff is above the EMA, and negative momentum occurs when the Diff is below the EMA.
Trend Detection
Trend Logic: The indicator uses the calculated bands to identify whether the price is moving within or outside the standard deviation and ATR bands. Crosses above or below these bands, combined with positive/negative momentum, signals potential uptrends or downtrends, offering traders a clear view of market direction.
Features and User Inputs
The "HMA Gaussian Volatility Adjusted" script offers a variety of user inputs to customize the indicator to suit traders' styles and market conditions:
HMA Length: Allows traders to adjust the sensitivity of the HMA smoothing to control the amount of noise filtered from the price data.
Gaussian Length: Users can define the length at which the Gaussian filter is applied.
ATR Length and Multiplier: These inputs let traders fine-tune the ATR calculation, affecting the size of the dynamic upper and lower bands to adjust for price volatility.
Standard Deviation Length: Controls how the standard deviation is calculated, allowing further customization in detecting price volatility.
EMA Confluence: This input lets traders determine the length of the EMA used to calculate price momentum.
Type of Plot Setting: Allows users to determine how the indicator signal is plotted on the chart (Background color, Trend Lines, BOTH (backgroung color and Trend Lines)).
Transparency: Provides users with customization of the background color's transparency.
Color Long/Short: Offers users the option to choose their preferred colors for both long and short signals.
Summary and Usage Tips
The "HMA Gaussian Volatility Adjusted" indicator is a powerful tool for traders looking to refine their analysis of market trends and volatility. Its combination of HMA smoothing, Gaussian filtering, and standard deviation analysis provides a nuanced view of market movements by incorporating various metrics to determine direction, momentum, and volatility. This helps traders make better-informed decisions. It's recommended to experiment with the various input parameters to optimize the indicator for specific needs.

TrendWave VWAP Indicator with ATR-based SignalsThe TrendWave VWAP Indicator with ATR-Based Signals is a robust TradingView tool for traders who prioritize precision and adaptability. This indicator combines the Volume-Weighted Average Price (VWAP) with the Average True Range (ATR) to provide actionable entry and exit signals while dynamically filtering out sideways market conditions. Designed with flexibility in mind, the indicator offers extensive customization options to tailor signals and filtering to individual trading styles.
Key Features and Customizable Settings
VWAP Integration
VWAP offers a volume-weighted benchmark, ideal for tracking price trends in relation to average trading levels. Customization: Traders can enable or disable VWAP functionality via a toggle, allowing easy adjustments based on market conditions or strategy preferences.
ATR-Based Signal Levels
ATR provides volatility-based levels for precise entry and exit points by measuring average price range. Customization: Traders can set the ATR length (default: 14) and the multiplier (default: 1.5) for adjusting sensitivity. A sideways threshold can be set to control the ATR value at which the indicator pauses signals, helping to avoid low-volatility markets.
Signal Cooldown
To reduce noise in choppy conditions, a signal cooldown enforces a minimum number of bars between signals. Customization: The cooldown period (default: 10 bars) can be adjusted to match preferred trading frequency and discipline requirements.
Signal Logic
Long Entry: Activated when price crosses above the VWAP in a trending market. Cooldown applies to avoid consecutive signals.
Long Exit: Triggered when price crosses below the VWAP.
Short Entry: Initiated when price crosses below the VWAP, in non-sideways conditions.
Short Exit: Occurs when price crosses back above the VWAP following a short position.
Visual Indicators
The VWAP is displayed as a line on the chart for easy trend reference. Entry and exit signals are clearly marked with color-coded shapes, enhancing readability without clutter.
Practical Application
The TrendWave VWAP Indicator with ATR-Based Signals provides tailored entries and exits for trending markets. Its customization options make it suitable for traders who require flexibility and precision in varying market conditions. By adjusting VWAP, ATR, and cooldown parameters, users can fine-tune the indicator to suit different trading styles, making it an essential tool for disciplined trading in dynamic markets.

Entropy-Based Adaptive SuperTrendOverview:
Introducing the Entropy-Based Adaptive SuperTrend – a groundbreaking trading indicator designed to adapt dynamically to market conditions using market entropy. This enhanced SuperTrend indicator adjusts its sensitivity according to the level of chaos (or order) in price movements, providing more stable signals during volatile periods and more responsive signals when the market becomes orderly.
Key Features:
Entropy-Adaptive Mechanism: By incorporating an entropy measure, this indicator estimates the degree of unpredictability in the market. During high entropy periods (more chaotic), signals are made less sensitive, while during low entropy periods, the indicator reacts more quickly to price changes.
Adaptive ATR Multiplier: Unlike traditional SuperTrend indicators that use a fixed ATR multiplier, this version calculates a dynamic ATR multiplier based on the entropy score, ensuring more flexibility and adaptability in setting stop levels.
Visual Clarity: The indicator is overlayed on the price chart with customizable visual elements. The bullish and bearish trends are color-coded for ease of use, and optional entry signals ("L" for long and "S" for short) are plotted to clearly mark potential entry opportunities.
Alerts for Key Opportunities : Never miss an opportunity with built-in alerts for buy and sell signals. Traders can easily configure these alerts to be notified instantly when market conditions trigger a new trend.
How It Works:
Entropy Calculation: The entropy of the price data is calculated over a user-defined period, giving an indication of the degree of randomness in the price movements. The result is then smoothed to reduce noise and create a meaningful trend indication.
Dynamic ATR Adjustment: The ATR (Average True Range) multiplier, which controls the distance of the trailing stop, is adjusted based on the entropy score. This allows the SuperTrend line to widen in chaotic times, reducing false signals, while tightening in orderly times, allowing quicker trend captures.
Parameters Explained:
Entropy Settings: Control the sensitivity of entropy calculations, including the look-back period, number of bins for price distribution, and smoothing length.
Adaptive Settings: Adjust how the indicator adapts to different levels of entropy, including the adaptation period and the filtering weight.
SuperTrend Settings : Customize the ATR period and the dynamic multiplier range to fine-tune the trailing stops for your trading style.
Visual Settings: Choose your preferred colors for bullish and bearish trends, and decide if you want the entry labels displayed directly on the chart.
Use Cases:
Swing Traders can utilize the indicator to capture trend reversals while filtering out the noise during high entropy periods.
Intraday Traders can adapt the settings for shorter time frames to benefit from dynamic adjustments that reduce overtrading and false signals.
Risk Management: The entropy-based adaptive feature provides an edge in risk management by reducing sensitivity during times of increased chaos, thus helping to limit unnecessary trades.
How to Use It:
Look for entry labels ("L" for long, "S" for short) to identify potential opportunities.
Use the color-coded trendlines to determine market bias: greenish hue for bullish trends, reddish hue for bearish trends.
Customize the input settings to align with your preferred market timeframe and risk profile.
Alerts & Notifications:
Built-in alerts notify you of significant trend changes. Simply enable these alerts to receive updates when a new long or short opportunity is detected, helping you stay ahead without needing to watch the screen constantly.
Customization Tips:
Longer Timeframes : Increase the Entropy Period to better capture macro trends in high timeframe charts.
Higher Volatility Markets: Increase the ATR Max Multiplier to ensure stops are set farther away during high entropy.
Lower Volatility Markets: Use a lower ATR Base Multiplier and tighter entropy thresholds to capture rapid price movements.
Final Thoughts:
The Entropy-Based Adaptive SuperTrend indicator merges traditional trend-following logic with an adaptive mechanism driven by market entropy, aiming to address the challenges of whipsaws and false signals common in conventional SuperTrend setups. This indicator offers an intelligent and flexible way to track market trends, suitable for both beginners and experienced trade

VIDYA ProTrend Multi-Tier ProfitHello! This time is about a trend-following system.
VIDYA is quite an interesting indicator that adjusts dynamically to market volatility, making it more responsive to price changes compared to traditional moving averages. Balancing adaptability and precision, especially with the more aggressive short trade settings, challenged me to fine-tune the strategy for a variety of market conditions.
█ Introduction and How it is Different
The "VIDYA ProTrend Multi-Tier Profit" strategy is a trend-following system that combines the VIDYA (Variable Index Dynamic Average) indicator with Bollinger Bands and a multi-step take-profit mechanism.
Unlike traditional trend strategies, this system allows for more adaptive profit-taking, adjusting for long and short positions through distinct ATR-based and percentage-based targets. The innovation lies in its dynamic multi-tier approach to profit-taking, especially for short trades, where more aggressive percentages are applied using a multiplier. This flexibility helps adapt to various market conditions by optimizing trade management and profit allocation based on market volatility and trend strength.
BTCUSD 6hr performance
█ Strategy, How it Works: Detailed Explanation
The core of the "VIDYA ProTrend Multi-Tier Profit" strategy lies in the dual VIDYA indicators (fast and slow) that analyze price trends while accounting for market volatility. These indicators work alongside Bollinger Bands to filter trade entries and exits.
🔶 VIDYA Calculation
The VIDYA indicator is calculated using the following formula:
Smoothing factor (𝛼):
alpha = 2 / (Length + 1)
VIDYA formula:
VIDYA(t) = alpha * k * Price(t) + (1 - alpha * k) * VIDYA(t-1)
Where:
k = |Chande Momentum Oscillator (MO)| / 100
🔶 Bollinger Bands as a Volatility Filter
Bollinger Bands are calculated using a rolling mean and standard deviation of price over a specified period:
Upper Band:
BB_upper = MA + (K * stddev)
Lower Band:
BB_lower = MA - (K * stddev)
Where:
MA is the moving average,
K is the multiplier (typically 2), and
stddev is the standard deviation of price over the Bollinger Bands length.
These bands serve as volatility filters to identify potential overbought or oversold conditions, aiding in the entry and exit logic.
🔶 Slope Calculation for VIDYA
The slopes of both fast and slow VIDYAs are computed to assess the momentum and direction of the trend. The slope for a given VIDYA over its length is:
Slope = (VIDYA(t) - VIDYA(t-n)) / n
Where:
n is the length of the lookback period. Positive slope indicates bullish momentum, while negative slope signals bearish momentum.
LOCAL picture
🔶 Entry and Exit Conditions
- Long Entry: Occurs when the price moves above the slow VIDYA and the fast VIDYA is trending upward. Bollinger Bands confirm the signal when the price crosses the upper band, indicating bullish strength.
- Short Entry: Happens when the price drops below the slow VIDYA and the fast VIDYA trends downward. The signal is confirmed when the price crosses the lower Bollinger Band, showing bearish momentum.
- Exit: Based on VIDYA slopes flattening or reversing, or when the price hits specific ATR or percentage-based profit targets.
🔶 Multi-Step Take Profit Mechanism
The strategy incorporates three levels of take profit for both long and short trades:
- ATR-based Take Profit: Each step applies a multiple of the ATR (Average True Range) to the entry price to define the exit point.
The first level of take profit (long):
TP_ATR1_long = Entry Price + (2.618 * ATR)
etc.
█ Trade Direction
The strategy offers flexibility in defining the trading direction:
- Long: Only long trades are considered based on the criteria for upward trends.
- Short: Only short trades are initiated in bearish trends.
- Both: The strategy can take both long and short trades depending on the market conditions.
█ Usage
To use the strategy effectively:
- Adjust the VIDYA lengths (fast and slow) based on your preference for trend sensitivity.
- Use Bollinger Bands as a filter for identifying potential breakout or reversal scenarios.
- Enable the multi-step take profit feature to manage positions dynamically, allowing for partial exits as the price reaches specified ATR or percentage levels.
- Leverage the short trade multiplier for more aggressive take profit levels in bearish markets.
This strategy can be applied to different asset classes, including equities, forex, and cryptocurrencies. Adjust the input parameters to suit the volatility and characteristics of the asset being traded.
█ Default Settings
The default settings for this strategy have been designed for moderate to trending markets:
- Fast VIDYA Length (10): A shorter length for quick responsiveness to price changes. Increasing this length will reduce noise but may delay signals.
- Slow VIDYA Length (30): The slow VIDYA is set longer to capture broader market trends. Shortening this value will make the system more reactive to smaller price swings.
- Minimum Slope Threshold (0.05): This threshold helps filter out weak trends. Lowering the threshold will result in more trades, while raising it will restrict trades to stronger trends.
Multi-Step Take Profit Settings
- ATR Multipliers (2.618, 5.0, 10.0): These values define how far the price should move before taking profit. Larger multipliers widen the profit-taking levels, aiming for larger trend moves. In higher volatility markets, these values might be adjusted downwards.
- Percentage Levels (3%, 8%, 17%): These percentage levels define how much the price must move before taking profit. Increasing the percentages will capture larger moves, while smaller percentages offer quicker exits.
- Short TP Multiplier (1.5): This multiplier applies more aggressive take profit levels for short trades. Adjust this value based on the aggressiveness of your short trade management.
Each of these settings directly impacts the performance and risk profile of the strategy. Shorter VIDYA lengths and lower slope thresholds will generate more trades but may result in more whipsaws. Higher ATR multipliers or percentage levels can delay profit-taking, aiming for larger trends but risking partial gains if the trend reverses too early.

Trend Signals with TP & SL [UAlgo] StrategyThe "Trend Signals with TP & SL Strategy" is a trading strategy designed to capture trend continuation signals while incorporating sophisticated risk management techniques. This strategy is tailored for traders who wish to capitalize on trending market conditions with precise entry and exit points, automatically calculating Take Profit (TP) and Stop Loss (SL) levels based on either Average True Range (ATR) or percentage values. The strategy aims to enhance trade management by preventing multiple simultaneous positions and dynamically adapting to changing market conditions.
This strategy is highly configurable, allowing traders to adjust sensitivity, the ATR calculation method, and the cloud moving average length. Additionally, the strategy can display buy and sell signals directly on the chart, along with visual representation of entry points, stop losses, and take profits. It also features a cloud-based trend analysis using a MACD-driven color fill that indicates the strength and direction of the trend.
🔶 Key Features
Configurable Trend Continuation Signals:
Source Selection: The strategy uses the midpoint of the high-low range as the default source, but it is adjustable.
Sensitivity: The sensitivity of the trend signals can be adjusted using a multiplier, ranging from 0.5 to 5.
ATR Calculation: The strategy allows users to choose between two ATR calculation methods for better adaptability to different market conditions.
Cloud Moving Average: Traders can adjust the cloud moving average length, which is used in conjunction with MACD to provide a visual trend indication.
Take Profit & Stop Loss Management:
ATR-Based or Percent-Based: The strategy offers flexibility in setting TP and SL levels, allowing traders to choose between ATR-based multipliers or fixed percentage values.
Dynamic Adjustment: TP and SL levels are dynamically adjusted according to the selected method, ensuring trades are managed based on real-time market conditions.
Prevention of Multiple Positions:
Single Position Control: To reduce risk and enhance strategy reliability, the strategy includes an option to prevent multiple positions from being opened simultaneously.
Visual Trade Indicators:
Buy/Sell Signals: Clearly displays buy and sell signals on the chart for easy interpretation.
Entry, SL, and TP Lines: Draws lines for entry price, stop loss, and take profit directly on the chart, helping traders to monitor trades visually.
Trend Cloud: A color-filled cloud based on MACD and the cloud moving average provides a visual cue of the trend’s direction and strength.
Performance Summary Table:
In-Chart Statistics: A table in the top right of the chart displays key performance metrics, including total trades, wins, losses, and win rate percentage, offering a quick overview of the strategy’s effectiveness.
🔶 Interpreting the Indicator
Trend Signals: The strategy identifies trend continuation signals based on price action relative to an ATR-based threshold. A buy signal is generated when the price crosses above a key level, indicating an uptrend. Conversely, a sell signal occurs when the price crosses below a level, signaling a downtrend.
Cloud Visualization: The cloud, derived from MACD and moving averages, changes color to reflect the current trend. A positive cloud in aqua suggests an uptrend, while a red cloud indicates a downtrend. The transparency of the cloud offers further nuance, with more solid colors denoting stronger trends.
Entry and Exit Management: Once a trend signal is generated, the strategy automatically sets TP and SL levels based on your chosen method (ATR or percentage). The stop loss and take profit lines will appear on the chart, showing where the strategy will exit the trade. If the price reaches either the SL or TP, the trade is closed, and the respective line is deleted from the chart.
Performance Metrics: The strategy’s performance is tracked in real-time with an in-chart table. This table provides essential information about the number of trades executed, the win/loss ratio, and the overall win rate. This information helps traders assess the strategy's effectiveness and make necessary adjustments.
This strategy is designed for those who seek to engage with trending markets, offering robust tools for entry, exit, and overall trade management. By understanding and leveraging these features, traders can potentially improve their trading outcomes and risk management.
🔷 Related Script
🔶 Disclaimer
Use with Caution: This indicator is provided for educational and informational purposes only and should not be considered as financial advice. Users should exercise caution and perform their own analysis before making trading decisions based on the indicator's signals.
Not Financial Advice: The information provided by this indicator does not constitute financial advice, and the creator (UAlgo) shall not be held responsible for any trading losses incurred as a result of using this indicator.
Backtesting Recommended: Traders are encouraged to backtest the indicator thoroughly on historical data before using it in live trading to assess its performance and suitability for their trading strategies.
Risk Management: Trading involves inherent risks, and users should implement proper risk management strategies, including but not limited to stop-loss orders and position sizing, to mitigate potential losses.
No Guarantees: The accuracy and reliability of the indicator's signals cannot be guaranteed, as they are based on historical price data and past performance may not be indicative of future results.

MTF - Quantum Fibonacci ATR/ADR Levels & Targets**Indicator Overview:**
The *Quantum Fibonacci Wave Mechanics* indicator is a powerful tool designed to help traders identify dynamic support, resistance, and target levels based on the Average True Range (ATR) and Average Daily Range (ADR). This indicator leverages Fibonacci ratios to calculate precise entry and target levels, providing a comprehensive approach to market analysis.
**Key Features:**
- **Dynamic ATR/ADR Levels:** Automatically calculate and plot ATR and ADR-based support and resistance levels, offering insight into market volatility and potential reversal zones.
- **Fibonacci-Based Entry Levels:** Calculate Fibonacci entry levels using the 0.618 ratio, helping traders find optimal points to enter trades.
- **Customizable Target Levels:** Set up to three target levels based on Fibonacci ratios (1.618, 2.618, 3.618), allowing for precise trade management.
- **Stop Loss Lines:** Plot stop loss lines derived from ATR and ADR calculations, ensuring risk is managed effectively.
- **EMA Integration:** Optionally plot an Exponential Moving Average (EMA) line for additional trend confirmation.
- **Customizable Color Settings:** Adjust the colors of all levels and signals to fit your charting preferences.
- **Bar Coloring Based on Signals:** Automatically color bars based on the latest buy or sell signal for easier visual identification.
- **Label Display for Key Levels:** Display labels on the chart for important levels such as entry points, target levels, and stop loss lines.
**How Users Can Benefit:**
This indicator is ideal for traders who want to blend the precision of Fibonacci analysis with the robustness of ATR/ADR calculations. Whether you're a day trader looking for short-term entry points or a swing trader seeking reliable support and resistance levels, this indicator offers a versatile toolset for enhancing your trading decisions.
**Customization Instructions:**
The *Quantum Fibonacci Wave Mechanics* indicator is highly customizable to suit different trading styles and preferences. Below is a guide on how to adjust the settings:
1. **General Settings:**
- **ADR Length:** Define the lookback period for calculating the ADR.
- **EMA Length:** Set the period for the Exponential Moving Average (EMA).
- **Timeframe:** Select the timeframe for which the levels will be calculated (e.g., daily, weekly).
2. **Display Settings:**
- **Show ATR Levels:** Toggle the display of ATR-based support and resistance levels.
- **Show ADR Levels:** Toggle the display of ADR-based support and resistance levels.
- **Show EMA Line:** Toggle the display of the EMA line.
- **Show Stop Loss Lines:** Display stop loss levels derived from ATR and ADR.
- **Show Middle Level Line:** Show the middle level between buy and sell stop loss lines.
- **Show Fibonacci Entry Levels:** Enable the display of Fibonacci-based entry levels.
- **Show Entry Signals:** Plot buy and sell signals based on the crossover of the entry levels.
- **Show Target Levels:** Display up to three target levels for both buy and sell signals.
- **Color Bars Based on Last Signal:** Automatically color bars according to the last signal (buy or sell).
3. **Fibonacci Settings:**
- **Entry Ratio (Fibonacci):** Adjust the Fibonacci ratio used for calculating entry levels (default is 0.618).
- **Target Ratios (Fibonacci):** Set the Fibonacci ratios for up to three target levels (default ratios are 1.618, 2.618, and 3.618).
4. **Color Settings:**
- **Support Levels:** Customize the color of the support lines.
- **Resistance Levels:** Customize the color of the resistance lines.
- **Stop Loss Levels:** Set the color for stop loss lines (default is red).
- **Buy Target Levels:** Set the color for buy target levels (default is white).
- **Sell Target Levels:** Set the color for sell target levels (default is yellow).
5. **Label Display Settings:**
- **Show Labels for The Levels:** Toggle the display of labels for the various levels on the chart.
**Usage Tips:**
- **Combining with Other Indicators:** Use this indicator in conjunction with other technical indicators such as RSI, MACD, or Bollinger Bands to confirm signals.
- **Adjusting to Different Timeframes:** Customize the `timeframeInput` to analyze different market conditions, from intraday to long-term trading.
- **Risk Management:** Utilize the stop loss levels to manage risk effectively, ensuring your trades are protected against adverse market movements.
**Disclaimer:**
*This indicator is provided for educational purposes only and should not be considered financial advice. Trading in financial markets involves risk, and past performance does not guarantee future results. Always conduct your own research and consult with a licensed financial advisor before making any trading decisions. The creator of this indicator is not responsible for any financial losses that may occur from using this tool.*

Double CCI Confirmed Hull Moving Average Reversal StrategyOverview
The Double CCI Confirmed Hull Moving Average Strategy utilizes hull moving average (HMA) in conjunction with two commodity channel index (CCI) indicators: the slow and fast to increase the probability of entering when the short and mid-term uptrend confirmed. The main idea is to wait until the price breaks the HMA while both CCI are showing that the uptrend has likely been already started. Moreover, strategy uses exponential moving average (EMA) to trail the price when it reaches the specific level. The strategy opens only long trades.
Unique Features
Dynamic stop-loss system: Instead of fixed stop-loss level strategy utilizes average true range (ATR) multiplied by user given number subtracted from the position entry price as a dynamic stop loss level.
Configurable Trading Periods: Users can tailor the strategy to specific market windows, adapting to different market conditions.
Double trade setup confirmation: Strategy utilizes two different period CCI indicators to confirm the breakouts of HMA.
Trailing take profit level: After reaching the trailing profit activation level scrip activate the trailing of long trade using EMA. More information in methodology.
Methodology
The strategy opens long trade when the following price met the conditions:
Short-term period CCI indicator shall be above 0.
Long-term period CCI indicator shall be above 0.
Price shall cross the HMA and candle close above it with the same candle
When long trade is executed, strategy set the stop-loss level at the price ATR multiplied by user-given value below the entry price. This level is recalculated on every next candle close, adjusting to the current market volatility.
At the same time strategy set up the trailing stop validation level. When the price crosses the level equals entry price plus ATR multiplied by user-given value script starts to trail the price with EMA. If price closes below EMA long trade is closed. When the trailing starts, script prints the label “Trailing Activated”.
Strategy settings
In the inputs window user can setup the following strategy settings:
ATR Stop Loss (by default = 1.75)
ATR Trailing Profit Activation Level (by default = 2.25)
CCI Fast Length (by default = 25, used for calculation short term period CCI
CCI Slow Length (by default = 50, used for calculation long term period CCI)
Hull MA Length (by default = 34, period of HMA, which shall be broken to open trade)
Trailing EMA Length (by default = 20)
User can choose the optimal parameters during backtesting on certain price chart.
Justification of Methodology
Before understanding why this particular combination of indicator has been chosen let's briefly explain what is CCI and HMA.
The Commodity Channel Index (CCI) is a momentum-based technical indicator used in trading to measure a security's price relative to its average price over a given period. Developed by Donald Lambert in 1980, the CCI is primarily used to identify cyclical trends in a security, helping traders to spot potential buying or selling opportunities.
The CCI formula is:
CCI = (Typical Price − SMA) / (0.015 × Mean Deviation)
Typical Price (TP): This is calculated as the average of the high, low, and closing prices for the period.
Simple Moving Average (SMA): This is the average of the Typical Prices over a specific number of periods.
Mean Deviation: This is the average of the absolute differences between the Typical Price and the SMA.
The result is a value that typically fluctuates between +100 and -100, though it is not bounded and can go higher or lower depending on the price movement.
The Hull Moving Average (HMA) is a type of moving average that was developed by Alan Hull to improve upon the traditional moving averages by reducing lag while maintaining smoothness. The goal of the HMA is to create an indicator that is both quick to respond to price changes and less prone to whipsaws (false signals).
How the Hull Moving Average is Calculated?
The Hull Moving Average is calculated using the following steps:
Weighted Moving Average (WMA): The HMA starts by calculating the Weighted Moving Average (WMA) of the price data over a period square root of n (sqrt(n))
Speed Adjustment: A WMA is then calculated for half of the period n/2, and this is multiplied by 2 to give more weight to recent prices.
Lag Reduction: The WMA of the full period n is subtracted from the doubled n/2 WMA.
Final Smoothing: To smooth the result and reduce noise, a WMA is calculated for the square root of the period n.
The formula can be represented as:
HMA(n) = WMA(WMA(n/2) × 2 − WMA(n), sqrt(n))
The Weighted Moving Average (WMA) is a type of moving average that gives more weight to recent data points, making it more responsive to recent price changes than a Simple Moving Average (SMA). In a WMA, each data point within the selected period is multiplied by a weight, with the most recent data receiving the highest weight. The sum of these weighted values is then divided by the sum of the weights to produce the WMA.
This strategy leverages HMA of user given period as a critical level which shall be broken to say that probability of trend change to the upside increased. HMA reacts faster than EMA or SMA to the price change, that’s why it increases chances to enter new trade earlier. Long-term period CCI helps to have an approximation of mid-term trend. If it’s above 0 the probability of uptrend increases. Short-period CCI allows to have an approximation of short-term trend reversal from down to uptrend. This approach increases chances to have a long trade setup in the direction of mid-term trend when the short-term trend starts to reverse.
ATR is used to adjust the strategy risk management to the current market volatility. If volatility is low, we don’t need the large stop loss to understand the there is a high probability that we made a mistake opening the trade. User can setup the settings ATR Stop Loss and ATR Trailing Profit Activation Level to realize his own risk to reward preferences, but the unique feature of a strategy is that after reaching trailing profit activation level strategy is trying to follow the trend until it is likely to be finished instead of using fixed risk management settings. It allows sometimes to be involved in the large movements. It’s also important to make a note, that script uses HMA to enter the trade, but for trailing it leverages EMA. It’s used because EMA has no such fast reaction to price move which increases probability not to be stopped out from any significant uptrend move.
Backtest Results
Operating window: Date range of backtests is 2022.07.01 - 2024.08.01. It is chosen to let the strategy to close all opened positions.
Commission and Slippage: Includes a standard Binance commission of 0.1% and accounts for possible slippage over 5 ticks.
Initial capital: 10000 USDT
Percent of capital used in every trade: 100%
Maximum Single Position Loss: -4.67%
Maximum Single Profit: +19.66%
Net Profit: +14897.94 USDT (+148.98%)
Total Trades: 104 (36.54% win rate)
Profit Factor: 2.312
Maximum Accumulated Loss: 1302.66 USDT (-9.58%)
Average Profit per Trade: 143.25 USDT (+0.96%)
Average Trade Duration: 34 hours
These results are obtained with realistic parameters representing trading conditions observed at major exchanges such as Binance and with realistic trading portfolio usage parameters.
How to Use
Add the script to favorites for easy access.
Apply to the desired timeframe and chart (optimal performance observed on 2h BTC/USDT).
Configure settings using the dropdown choice list in the built-in menu.
Set up alerts to automate strategy positions through web hook with the text: {{strategy.order.alert_message}}
Disclaimer:
Educational and informational tool reflecting Skyrex commitment to informed trading. Past performance does not guarantee future results. Test strategies in a simulated environment before live implementation

[blackcat] L3 Fibonacci Bands With ATRToday, what I'm going to introduce is a technical indicator that I think is quite in line with the indicator displayed by Tang - Fibonacci Bands with ATR. This indicator combines Bollinger Bands and Average True Range (ATR) to provide insights into market volatility and potential price reversals. Sounds complicated, right? Don't worry, I will explain it to you in the simplest way.
First, let's take a look at how Fibonacci Bands are constructed. They are similar to Bollinger Bands and consist of three lines: upper band, middle band (usually a 20-period simple moving average), and lower band. The difference is that Fibonacci Bands use ATR to calculate the distance between the upper and lower bands and the middle band.
Next is a key factor - ATR multiplier. We need to smooth the ATR using Welles Wilder's method. Then, by multiplying the ATR by a Fibonacci multiplier (e.g., 1.618), we get the upper band, called the upper Fibonacci channel. Similarly, multiplying the ATR by another Fibonacci multiplier (e.g., 0.618 or 1.0) gives us the lower band, called the lower Fibonacci channel.
Now, let's see how Fibonacci Bands can help us assess market volatility. When the channel widens, it means that market volatility is high, while a narrow channel indicates low market volatility. This way, we can determine the market's activity level based on the width of the channel.
In addition, when the price touches or crosses the Fibonacci channel, it may indicate a potential price reversal, similar to Bollinger Bands. Therefore, using Fibonacci Bands in trading can help us capture potential buy or sell signals.
In summary, Fibonacci Bands with ATR is an interesting and practical technical indicator that provides information about market volatility and potential price reversals by combining Bollinger Bands and ATR. Remember, make good use of these indicators and apply them flexibly in trading!
This code is a TradingView indicator script used to plot L3 Fibonacci Bands With ATR.
First, the indicator function is used to define the title and short title of the indicator, and whether it should be overlaid on the main chart.
Then, the input function is used to define three input parameters: MA type (maType), MA length (maLength), and data source (src). There are four options for MA type: SMA, EMA, WMA, and HMA. The default values are SMA, 55, and hl2 respectively.
Next, the moving average line is calculated based on the user's selected MA type. If maType is 'SMA', the ta.sma function is called to calculate the simple moving average; if maType is 'EMA', the ta.ema function is called to calculate the exponential moving average; if maType is 'WMA', the ta.wma function is called to calculate the weighted moving average; if maType is 'HMA', the ta.hma function is called to calculate the Hull moving average. The result is then assigned to the variable ma.
Then, the _atr variable is used to calculate the ATR (Average True Range) value using ta.atr, and multiplied by different coefficients to obtain four Fibonacci bias values: fibo_bias4, fibo_bias3, fibo_bias2, and fibo_bias1.
Finally, the prices of the upper and lower four Fibonacci bands are calculated by adding or subtracting the corresponding Fibonacci bias values from the current price, and plotted on the chart using the plot function.