ORB with ATR Trailing SL [Bluechip Algos]This is a simple ORB (Opening Range Breakout) Indicator that not only signals breakout directions based on the opening session range but also includes trailing stop levels to manage ongoing trades. Instead of regular fixed Stop loss, we use ATR indicator (ATR based SL) to trail the stop loss that might help in maximizing the profitable trades. This helps especially during the trending days where market moves unidirectionally.
About the Indicator
Opening Range Identification: The indicator defines an initial session timeframe and captures the highest and lowest prices during this period.
Breakout Signals: It signals potential entry points when the price crosses these range boundaries.
Trailing Stop Calculation: Customizable trailing stop-loss based on ATR percentage, helping users lock in profits.
Features
Session Customization: User-defined session for setting the opening range.
Entry Signal Customization: Allows configuration for breakouts on either a closing basis or upon touching the level.
Automatic Stop-Loss Adjustments: Dynamic trailing stop levels that adapt to both long and short entries.
Visual Display: Highlights breakout levels and plots lines representing stop-loss levels.
Understanding the Indicator
Range Calculation: After defining the session, the high and low of the session are locked. The high serves as the upper breakout boundary, and the low as the lower boundary.
Signals (Buy and Sell): The indicator uses crossover conditions:
Buy Signal ("B") when price crosses above the ORB high.
Sell Signal ("S") when price crosses below the ORB low.
Trail Stop Calculation: When a signal is triggered, a trailing stop level is set and updates as the trade progresses:
Long positions have a stop-loss based on a percentage below the last closing price.
Short positions have a stop-loss based on a percentage above the last closing price.
Input Parameters
Session Time (ORB Session Time): Start and end times for setting the ORB range.
Signal Configuration: Choice between "CLOSE" (signal on close) or "TOUCH" (signal as soon as level is touched).
ATR Percentage: Sets the percentage for the trailing stop calculation.
Cerca negli script per "atr"
Dynamic RSI Mean Reversion StrategyDynamic RSI Mean Reversion Strategy
Overview:
This strategy uses an RSI with ATR-Adjusted OB/OS levels in order to enhance the quality of it's mean reversion trades. It also incorporates a form of trend filtering in an effort to minimize downside and maximize upside. The backtest has fewer trades, as it uses substantial filtering to enhance trade quality. As you can see, I didn't cherry pick the results, so the results aren't the most beautiful thing you'll see in your life. I did this to ensure nobody gets misled. If you need a higher frequency of trades, consider removing the trend filter or increasing the length of the EMAs used for trend detection.
Features:
Dynamic OB/OS Levels: Uses ATR to adjust overbought and oversold thresholds dynamically, making the RSI more responsive in varying volatility conditions. This approach enhances signal strength by expanding the RSI range in high volatility and tightening it in low volatility.
Mean Reversion Focus: Designed for mean reversion but incorporates a trend-following filter to reduce countertrend trades. When the RSI is high, it often indicates an uptrend, so a trend filter prevents shorting in these cases and the same goes for downtrends and longing.
Trend Filtering: A moving average cross trend filter checks for the trend direction, with the RSI signal line color-coded to reflect trend shifts. Entries occur when the RSI crosses above or below the dynamic thresholds and is not a countertrend trade.
Stop Losses: Stop losses are set based on ATR distance from the entry price, providing volatility-adjusted protection.
Note:
If you're using this strategy on assets with a higher price, remember to increase the initial capital in the strategy settings. Otherwise, the strategy won't generate any (or many) trades and you'll end up with some inaccurate results.
Recommended Use:
Test it on different assets and timeframes. I’ve found the best results with standard RSI inputs, a relatively slow ATR, and a slower MA cross for trend filtering. Thus, the defaults are set that way. If the trend metrics are too slow, you’ll filter out too many good trades while allowing crummy ones; if too fast, most trades may be filtered out. As always, this has a lot of configurability so experiment to find the balance that works for your trading style.

Uptrick: MultiTrend Squeeze System**Uptrick: MultiTrend Squeeze System Indicator: The Ultimate Trading Tool for Precision and Versatility 📈🔥**
### Introduction
The MultiTrend Squeeze System is a powerful, multi-faceted trading indicator designed to provide traders with precise buy and sell signals by combining the strengths of multiple technical analysis tools. This script isn't just an indicator; it's a comprehensive trading system that merges the power of SuperTrend, RSI, Volume Filtering, and Squeeze Momentum to give you an unparalleled edge in the market. Whether you're a day trader looking for short-term opportunities or a swing trader aiming to catch longer-term trends, this indicator is tailored to meet your needs.
### Key Features and Unique Aspects
1. **SuperTrend with Dynamic Adjustments 📊**
- **Adaptive SuperTrend Calculation:** The SuperTrend is a popular trend-following indicator that adjusts dynamically based on market conditions. It uses the Average True Range (ATR) to calculate upper and lower bands, which shift according to market volatility. This script takes it further by combining it with the RSI and Volume filtering to provide more accurate signals.
- **Direction Sensitivity:** The SuperTrend here is not static. It adjusts based on the direction of the previous SuperTrend value, ensuring that the indicator remains relevant even in choppy markets.
2. **RSI Integration for Overbought/Oversold Conditions 💹**
- **RSI Calculation:** The Relative Strength Index (RSI) is incorporated to identify overbought and oversold conditions, adding an extra layer of precision. This helps in filtering out false signals and ensuring that trades are taken only in optimal conditions.
- **Customizable RSI Settings:** The RSI settings are fully customizable, allowing traders to adjust the RSI length and the overbought/oversold levels according to their trading style and market.
3. **Volume Filtering for Enhanced Signal Confirmation 📉**
- **Volume Multiplier:** This unique feature integrates volume analysis, ensuring that signals are only generated when there is sufficient market participation. The Volume Multiplier can be adjusted to filter out weak signals that occur during low-volume periods.
- **Optional Volume Filtering:** Traders have the flexibility to turn the volume filter on or off, depending on their preference or market conditions. This makes the indicator versatile, allowing it to be used across different asset classes and market conditions.
4. **Squeeze Momentum Indicator (SMI) for Market Pressure Analysis 💥**
- **Squeeze Detection:** The Squeeze Momentum Indicator detects periods of market compression and expansion. This script goes beyond the traditional Bollinger Bands and Keltner Channels by incorporating true range calculations, offering a more nuanced view of market momentum.
- **Customizable Squeeze Settings:** The lengths and multipliers for both Bollinger Bands and Keltner Channels are customizable, giving traders the flexibility to fine-tune the indicator based on their specific needs.
5. **Visual and Aesthetic Customization 🎨**
- **Color-Coding for Clarity:** The indicator is color-coded to make it easy to interpret signals. Bullish trends are marked with a vibrant green color, while bearish trends are highlighted in red. Neutral or unconfirmed signals are displayed in softer tones to reduce noise.
- **Histogram Visualization:** The primary trend direction and strength are displayed as a histogram, making it easy to visualize the market's momentum at a glance. The height and color of the bars provide immediate feedback on the strength and direction of the trend.
6. **Alerts for Real-Time Trading 🚨**
- **Custom Alerts:** The script is equipped with custom alerts that notify traders when a buy or sell signal is generated. These alerts can be configured to send notifications through various channels, including email, SMS, or directly to the trading platform.
- **Immediate Reaction:** The alerts are triggered based on the confluence of SuperTrend, RSI, and Volume signals, ensuring that traders are notified only when the most robust trading opportunities arise.
7. **Comprehensive Input Customization ⚙️**
- **SuperTrend Settings:** Adjust the ATR length and factor to control the sensitivity of the SuperTrend. This allows you to adapt the indicator to different market conditions, whether you're trading a volatile cryptocurrency or a more stable stock.
- **RSI Settings:** Customize the RSI length and thresholds for overbought and oversold conditions, enabling you to tailor the indicator to your specific trading strategy.
- **Volume Settings:** The Volume Multiplier and the option to toggle the volume filter provide an additional layer of customization, allowing you to fine-tune the indicator based on market liquidity and participation.
- **Squeeze Momentum Settings:** The lengths and multipliers for Bollinger Bands and Keltner Channels can be adjusted to detect different levels of market compression, providing flexibility for both short-term and long-term traders.
### How It Works: A Deep Dive Into the Mechanics 🛠️
1. **SuperTrend Calculation:**
- The SuperTrend is calculated using the ATR, which measures market volatility. The indicator creates upper and lower bands around the price, adjusting these bands based on the current level of market volatility. The direction of the trend is determined by the position of the price relative to these bands.
- The script enhances the standard SuperTrend by ensuring that the bands do not flip-flop too quickly, reducing the chances of false signals in a choppy market. The direction is confirmed by checking the position of the close relative to the previous band, making the trend detection more reliable.
2. **RSI Integration:**
- The RSI is calculated over a customizable length and compared to user-defined overbought and oversold levels. When the RSI crosses below the oversold level, and the SuperTrend indicates a bullish trend, a buy signal is generated. Conversely, when the RSI crosses above the overbought level, and the SuperTrend indicates a bearish trend, a sell signal is triggered.
- The combination of RSI with SuperTrend ensures that trades are only taken when there is a strong confluence of signals, reducing the chances of entering trades during weak or indecisive market phases.
3. **Volume Filtering:**
- The script calculates the average volume over a 20-period simple moving average. The volume filter ensures that buy and sell signals are only valid when the current volume exceeds a multiple of this average, which can be adjusted by the user. This feature helps filter out weak signals that might occur during low-volume periods, such as just before a major news event or during after-hours trading.
- The volume filter is particularly useful in markets where volume spikes are common, as it ensures that signals are only generated when there is significant market interest in the direction of the trend.
4. **Squeeze Momentum:**
- The Squeeze Momentum Indicator (SMI) adds a layer of market pressure analysis. The script calculates Bollinger Bands and Keltner Channels, detecting when the market is in a "squeeze" — a period of low volatility that typically precedes a significant price move.
- When the Bollinger Bands are inside the Keltner Channels, the market is in a squeeze (compression phase). This is often a precursor to a breakout or breakdown. The script colors the histogram bars black during this phase, indicating a potential for a strong move. Once the squeeze is released, the bars are colored according to the direction of the SuperTrend, signaling a potential entry point.
5. **Integration and Signal Generation:**
- The script brings together the SuperTrend, RSI, Volume, and Squeeze Momentum to generate highly accurate buy and sell signals. A buy signal is triggered when the SuperTrend is bullish, the RSI indicates oversold conditions, and the volume filter confirms strong market participation. Similarly, a sell signal is generated when the SuperTrend is bearish, the RSI indicates overbought conditions, and the volume filter is met.
- The combination of these elements ensures that the signals are robust, reducing the likelihood of entering trades during weak or indecisive market conditions.
### Practical Applications: How to Use the MultiTrend Squeeze System 📅
1. **Day Trading:**
- For day traders, this indicator provides quick and reliable signals that can be used to enter and exit trades multiple times within a day. The volume filter ensures that you are trading during the most liquid times of the day, increasing the chances of successful trades. The Squeeze Momentum aspect helps you catch breakouts or breakdowns, which are common in intraday trading.
2. **Swing Trading:**
- Swing traders can use the MultiTrend Squeeze System to identify longer-term trends. By adjusting the ATR length and factor, you can make the SuperTrend more sensitive to catch longer-term moves. The RSI and Squeeze Momentum aspects help you time your entries and exits, ensuring that you get in early on a trend and exit before it reverses.
3. **Scalping:**
- For scalpers, the quick signals provided by this system, especially in combination with the volume filter, make it easier to take small profits repeatedly. The histogram bars give you a clear visual cue of the market's momentum, making it easier to scalp effectively.
4. **Position Trading:**
- Even position traders can benefit from this indicator by using it to confirm long-term trends. By adjusting the settings to less sensitive parameters, you can ensure that you are only entering trades when a strong trend is confirmed. The Squeeze Momentum indicator will help you stay in the trade during periods of consolidation, waiting for the next big move.
### Conclusion: Why the MultiTrend Squeeze System is a Game-Changer 🚀
The MultiTrend Squeeze System is not just another trading indicator; it’s a comprehensive trading strategy encapsulated within a single script. By combining the power
of SuperTrend, RSI, Volume Filtering, and Squeeze Momentum, this indicator provides a robust and versatile tool that can be adapted to various trading styles and market conditions.
**Why is it Unique?**
- **Multi-Dimensional Analysis:** Unlike many other indicators that rely on a single data point or calculation, this script incorporates multiple layers of analysis, ensuring that signals are based on a confluence of factors, which increases their reliability.
- **Customizability:** The vast range of input settings allows traders to tailor the indicator to their specific needs, whether they are trading forex, stocks, cryptocurrencies, or commodities.
- **Visual Clarity:** The color-coded bars, labels, and signals make it easy to interpret the market conditions at a glance, reducing the time needed to make trading decisions.
Whether you are a novice trader or an experienced market participant, the MultiTrend Squeeze System offers a powerful toolset to enhance your trading strategy, reduce risk, and maximize your potential returns. With its combination of trend analysis, momentum detection, and volume filtering, this indicator is designed to help you trade with confidence and precision in any market condition.

Fibonacci-Only StrategyFibonacci-Only Strategy
This script is a custom trading strategy designed for traders who leverage Fibonacci retracement levels to identify potential trade entries and exits. The strategy is versatile, allowing users to trade across multiple timeframes, with built-in options for dynamic stop loss, trailing stops, and take profit levels.
Key Features:
Custom Fibonacci Levels:
This strategy calculates three specific Fibonacci retracement levels: 19%, 82.56%, and the reverse 19% level. These levels are used to identify potential areas of support and resistance where price reversals or breaks might occur.
The Fibonacci levels are calculated based on the highest and lowest prices within a 100-bar period, making them dynamic and responsive to recent market conditions.
Dynamic Entry Conditions:
Touch Entry: The script enters long or short positions when the price touches specific Fibonacci levels and confirms the move with a bullish (for long) or bearish (for short) candle.
Break Entry (Optional): If the "Use Break Strategy" option is enabled, the script can also enter positions when the price breaks through Fibonacci levels, providing more aggressive entry opportunities.
Stop Loss Management:
The script offers flexible stop loss settings. Users can choose between a fixed percentage stop loss or an ATR-based stop loss, which adjusts based on market volatility.
The ATR (Average True Range) stop loss is multiplied by a user-defined factor, allowing for tailored risk management based on market conditions.
Trailing Stop Mechanism:
The script includes an optional trailing stop feature, which adjusts the stop loss level as the market moves in favor of the trade. This helps lock in profits while allowing the trade to run if the trend continues.
The trailing stop is calculated as a percentage of the difference between the entry price and the current market price.
Multiple Take Profit Levels:
The strategy calculates seven take profit levels, each at incremental percentages above (for long trades) or below (for short trades) the entry price. This allows for gradual profit-taking as the market moves in the trade's favor.
Each take profit level can be customized in terms of the percentage of the position to be closed, providing precise control over exit strategies.
Strategy Backtesting and Results:
Realistic Backtesting:
The script has been backtested with realistic account sizes, commission rates, and slippage settings to ensure that the results are applicable to actual trading scenarios.
The backtesting covers various timeframes and markets to ensure the strategy's robustness across different trading environments.
Default Settings:
The script is published with default settings that have been optimized for general use. These settings include a 15-minute timeframe, a 1.0% stop loss, a 2.0 ATR multiplier for stop loss, and a 1.5% trailing stop.
Users can adjust these settings to better fit their specific trading style or the market they are trading.
How It Works:
Long Entry Conditions:
The strategy enters a long position when the price touches the 19% Fibonacci level (from high to low) or the reverse 19% level (from low to high) and confirms the move with a bullish candle.
If the "Use Break Strategy" option is enabled, the script will also enter a long position when the price breaks below the 19% Fibonacci level and then moves back up, confirming the break with a bullish candle.
Short Entry Conditions:
The strategy enters a short position when the price touches the 82.56% Fibonacci level and confirms the move with a bearish candle.
If the "Use Break Strategy" option is enabled, the script will also enter a short position when the price breaks above the 82.56% Fibonacci level and then moves back down, confirming the break with a bearish candle.
Stop Loss and Take Profit Logic:
The stop loss for each trade is calculated based on the selected method (fixed percentage or ATR-based). The strategy then manages the trade by either trailing the stop or taking profit at predefined levels.
The take profit levels are set at increments of 0.5% above or below the entry price, depending on whether the position is long or short. The script gradually exits the trade as these levels are hit, securing profits while minimizing risk.
Usage:
For Fibonacci Traders:
This script is ideal for traders who rely on Fibonacci retracement levels to find potential trade entries and exits. The script automates the process, allowing traders to focus on market analysis and decision-making.
For Trend and Swing Traders:
The strategy's flexibility in handling both touch and break entries makes it suitable for trend-following and swing trading strategies. The multiple take profit levels allow traders to capture profits in trending markets while managing risk.
Important Notes:
Originality: This script uniquely combines Fibonacci retracement levels with dynamic stop loss management and multiple take profit levels. It is not just a combination of existing indicators but a thoughtful integration designed to enhance trading performance.
Disclaimer: Trading involves risk, and it is crucial to test this script in a demo account or through backtesting before applying it to live trading. Users should ensure that the settings align with their individual risk tolerance and trading strategy.

MACD Trail | Flux Charts💎 GENERAL OVERVIEW
Introducing our new MACD Trail indicator! Moving average convergence/divergence (MACD) is a well-known indicator among traders. It's a trend-following indicator that uses the relationship between two exponential moving averages (EMAs). This indicator aims to use MACD to generate a trail that follows the current price of the ticker, which can act as a support / resistance zone. More info about the process in the "How Does It Work" section.
Features of the new MACD Trail Indicator :
A Trail Generated Using MACD Calculation
Customizable Algorithm
Customizable Styling
📌 HOW DOES IT WORK ?
First of all, this indicator calculates the current MACD of the ticker using the user's input as settings. Let X = MACD Length setting ;
MACD ~= X Period EMA - (X * 2) Period EMA
Then, two MACD Trails are generated, one being bullish and other being bearish. Let ATR = 30 period ATR (Average True Range)
Bullish MACD Trail = Current Price + MACD - (ATR * 1.75)
Bearish MACD Trail = Current Price + MACD + (ATR * 1.75)
The indicator starts by rendering only the Bullish MACD Trail. Then if it's invalidated (candlestick closes below the trail) it switches to Bearish MACD Trail. The MACD trail switches between bullish & bearish as they get invalidated.
The trail type may give a hint about the current trend of the price action. The trail itself also can act as a support / resistance zone, here is an example :
🚩 UNIQUENESS
While MACD is one of the most used indicators among traders, this indicator aims to add another functionality to it by rendering a trail based on it. This trail may act as a support / resistance zone as described above, and gives a glimpse about the current trend. The indicator also has custom MACD Length and smoothing options, as well as various style options.
⚙️ SETTINGS
1. General Configuration
MACD Length -> This setting adjusts the EMA periods used in MACD calculation. Increasing this setting will make MACD more responseive to longer trends, while decreasing it may help with detection of shorter trends.
Smoothing -> The smoothing of the MACD Trail. Increasing this setting will help smoothen out the MACD Trail line, but it can also make it less responsive to the latest changes.

Volumetric Volatility Blocks [UAlgo]The Volumetric Volatility Blocks indicator is designed to identify significant volatility blocks based on price and volume data. It utilizes a combination of the Average True Range (ATR) and Simple Moving Average (SMA) to determine the volatility level and identify periods of heightened market activity. The indicator highlights these volatility blocks, providing traders with visual cues for potential trading opportunities. It differentiates between bullish and bearish volatility by analyzing price movement and volume, offering a nuanced view of market sentiment. This tool is particularly useful for traders looking to capitalize on periods of high volatility and momentum shifts.
🔶 Key Features
Volatility Measurement Length: Controls the period used to calculate the ATR.
Smooth Length of Volatility: Defines the period for the SMA used to smooth the ATR.
Multiplier of SMA: Sets the minimum threshold for the ATR to be considered a "high volatility" block.
Show Last X Volatility Blocks: Determines how many of the most recent volatility blocks are displayed on the chart.
Mitigation Method: Choose between "Close" or "Wick" price to filter volatility blocks based on price action. This helps avoid highlighting blocks broken by the chosen price level.
Volume Info: Displaying the volume associated with each block.
Up/Down Block Color: Sets the color for bullish and bearish volatility blocks.
🔶 Usage
The Volumetric Volatility Blocks indicator visually represents periods of high volatility with blocks on the chart. Green blocks indicate bullish volatility, while red blocks indicate bearish volatility.
Bullish Volatility Blocks: When the ATR surpasses the smoothed ATR multiplied by the set multiplier, and the price closes higher than it opened, a bullish block is formed. These blocks are generally used to identify potential buying opportunities as they indicate upward momentum.
Bearish Volatility Blocks: Conversely, bearish blocks form under the same conditions, but when the price closes lower than it opened. These blocks can signal potential selling opportunities as they highlight downward momentum.
Volume Information: Each block can display volume data, providing insight into the strength of the market movement. The percentage shown on the block indicates the relative volume contribution of that block, helping traders assess the significance of the volatility.
The volume percentages in the Volumetric Volatility Blocks indicator are calculated based on the total volume of the most recent volatility blocks. For each of the most recent volatility blocks, the percentage of the total volume is calculated by dividing the block's volume by the total volume:
🔶 Disclaimer
Use with Caution: This indicator is provided for educational and informational purposes only and should not be considered as financial advice. Users should exercise caution and perform their own analysis before making trading decisions based on the indicator's signals.
Not Financial Advice: The information provided by this indicator does not constitute financial advice, and the creator (UAlgo) shall not be held responsible for any trading losses incurred as a result of using this indicator.
Backtesting Recommended: Traders are encouraged to backtest the indicator thoroughly on historical data before using it in live trading to assess its performance and suitability for their trading strategies.
Risk Management: Trading involves inherent risks, and users should implement proper risk management strategies, including but not limited to stop-loss orders and position sizing, to mitigate potential losses.
No Guarantees: The accuracy and reliability of the indicator's signals cannot be guaranteed, as they are based on historical price data and past performance may not be indicative of future results.

Market Cycle Phases IndicatorOverview
The Market Cycle Phases Indicator is a powerful tool designed to help traders identify and visualize the different phases of market cycles. By distinguishing between Accumulation, Uptrend, Distribution, and Downtrend phases, this indicator provides a clear and color-coded representation of market conditions, aiding in better decision-making and strategy development. It is especially useful for long-term investors to observe and understand market cycles over extended periods. The phases are color-coded for easy identification: Green for Accumulation, Blue for Uptrend, Yellow for Distribution, and Red for Downtrend.
Key Features
Identifies four key market phases: Accumulation, Uptrend, Distribution, and Downtrend
Uses a combination of moving averages and volatility measures
Color-coded background for easy visualization of market phases
Adjustable parameters for moving average length, volatility length, and volatility threshold
Plots the moving average and Average True Range (ATR) for reference
Suitable for both short-term trading and long-term investing
Concepts Underlying the Calculations
The calculations behind the Market Cycle Phases Indicator are straightforward, combining the principles of moving averages and volatility measures:
Moving Average (MA): A simple moving average is used to determine the overall trend direction.
Average True Range (ATR): This measures market volatility over a specified period.
Volatility Threshold: A multiplier is applied to the ATR to distinguish between high and low volatility conditions.
How It Works
The indicator first calculates a moving average (MA) of the closing prices and the Average True Range (ATR) to measure market volatility. Based on the position of the price relative to the MA and the current volatility level, the indicator determines the current market phase:
Accumulation Phase: Price is below the MA, and volatility is low (Green background). This phase often indicates a period of consolidation and potential buying interest before an uptrend.
Uptrend Phase: Price is above the MA, and volatility is high (Blue background). This phase represents a strong upward movement in price, often driven by increased buying activity.
Distribution Phase: Price is above the MA, and volatility is low (Yellow background). This phase suggests a period of consolidation at the top of an uptrend, where selling interest may start to increase.
Downtrend Phase: Price is below the MA, and volatility is high (Red background). This phase indicates a strong downward movement in price, often driven by increased selling activity.
How Traders Can Use It
Traders can use the Market Cycle Phases Indicator to:
Identify potential entry and exit points based on market phase transitions.
Confirm trends and avoid false signals by considering both trend direction and volatility.
Develop and refine trading strategies tailored to specific market conditions.
Enhance risk management by recognizing periods of high and low volatility.
Observe long-term market cycles to make informed investment decisions.
Example Usage Instructions
Add the Market Cycle Phases Indicator to your chart.
Adjust the input parameters as needed:
Base Length: Default is 50.
Volatility Length: Default is 14.
Volatility Threshold: Default is 1.5.
Observe the color-coded background to identify the current market phase
Use the identified phases to inform your trading decisions:
Consider buying during the Accumulation or Uptrend phases.
Consider selling or shorting during the Distribution or Downtrend phases.
Combine with other indicators and analysis techniques for comprehensive market insights.
By incorporating the Market Cycle Phases Indicator into your trading toolkit, you can gain a clearer understanding of market dynamics and enhance your ability to navigate different market conditions, making it a valuable asset for long-term investing.

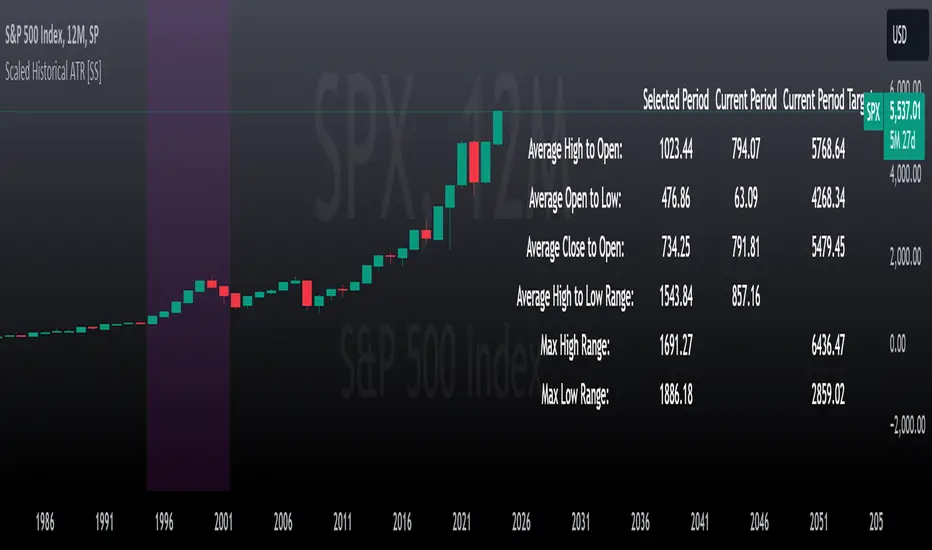
Scaled Historical ATR [SS]Hello again everyone,
This is the Scaled ATR Range indicator. This was done in response to an article/analysis I posted regarding the expected high and range on SPX. I would encourage you to read it here:
Essentially, I took SPX data, scaled it to correct for inflation, then calculated the ATR for Bullish years to get our average range to expect and our close range to expected.
I accomplished this analysis using Excel; however, I figured Pinescript would handle this type of task more elegantly, and I was correct!
This indicator is the result.
What it does:
This indicator permits the analyst to select a historic period in time. The indicator will then scale the period into returns and convert the range to a corrected range based on the current position of the ticker. How it does this is by converting the returns of the historic period selected, then multiplying the returns by the current period open, to ensure that the range amounts are corrected for inflation and natural growth of a ticker.
I say analyst because this indicator is intended to be used by both professional and recreational analysts, to give them an easy way to:
a) Scale historic data and correct it based on the current rate; and
b) Offer insight into a ticker’s ATR and behaviour during bullish and bearish periods.
Prior to this indicator, the only way to do this would be manually or the use of statistical software.
How to use?
The indicator’s use is quite simple. Once launched, the indicator will ask the user to input a timeframe period that the user is interested in assessing. In the main chart above, I chose SPX between 1995 and 2001.
The user can further filter down the data using the settings menu. In the settings menu, there is an option to filter by “All”, “Bullish Periods” or “Bearish Periods”.
Filtering by “All”
Filtering by “All” will include all candles selected within the timeframe. This includes both bearish and bullish candles. It will give you the averaged out range for the entire period of time, including both bearish and bullish instances.
Filtering by “Bullish”
Filtering by “Bullish” will omit any red candles from the analysis. It will only return the ATR ranges for green, bullish candles.
Filtering by “Bearish”
Inverse to filtering by Bullish, if you filter by Bearish, it will only include the red, bearish candles in the analysis.
My suggestion? If you are trying to determine t he likely outcome of a bullish year, filter by Bullish instances. If you want the likely outcome of a bearish year, filter by Bearish.
Other features of the Indicator:
The indicator will display the current period statistics. In the main chart above, you can see that the current ranges for this year are displayed. This allows you to do a side by side comparison of the current period vs. the historic period you are looking at. This can alert you to further upside, further downside and the anticipated close range. It can also alert you to whether or not we are following a similar trajectory as the historical periods you are looking at.
As well, the indicator will list target prices for the current period based on the historical periods you are looking at. This helps to put things into perspective.
Concluding Remarks
And that is the indicator in a nutshell! I encourage you to read the article I linked above to see how you may use it in an analysis. This would be the best example of a real world application of this indicator!
Otherwise, I hope you enjoy and, as always, safe trades!
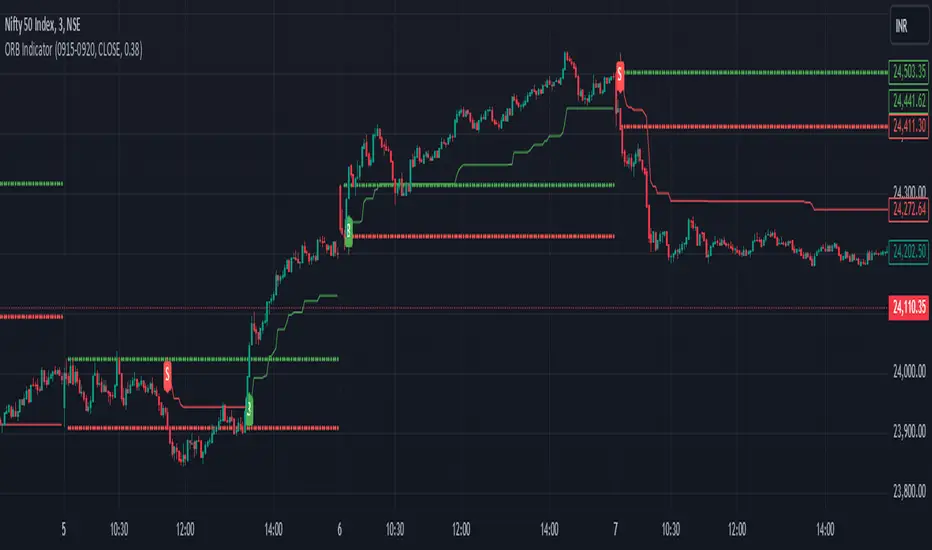
ACD Indicator [TradingFinder] M Fisher Pivots Methodology Signal🔵 Introduction
The book "The Logical Trader" begins with a comprehensive review of the ACD Methodology principles, which include identifying specific price points related to the opening range.
This method allows you to set reference points for trading and use points "A" and "C" for trade entry. You will also learn about the "Pivot Range" and how to combine them with the ACD method to maximize position size and minimize risk.
In this indicator, the strategy is implemented to make it easier to use.
🔵 How to Use
The "ACD" strategy can be applied to various markets such as stocks, commodities, or forex, providing buy and sell signals that allow you to set your price targets and stop losses.
This strategy is based on the assumption that the opening range of trades is statistically significant each day, meaning the initial market fluctuations influence the market until the end of the day.
The ACD trading strategy is known as a breakout strategy and performs best in volatile or strongly trending markets, such as crude oil and stocks.
Some of the rules for using the ACD strategy include the following :
Consider points A and C as reference points and continuously pay attention to these points during trades. These points serve as entry and exit points for trades.
Examine daily and multi-day pivot ranges to analyze market trends. If the price is above the pivots, the trend is upward, and if below the pivots, the trend is downward.
Trading with the ACD strategy in forex is possible using the ACD indicator. This indicator is a technical tool used to measure the balance between supply and demand in the market. By analyzing trading volume and price, this indicator helps traders identify trend strength and suitable entry and exit points.
To use the ACD indicator, consider the following :
Identifying strong trends: The ACD indicator can help you identify strong and stable trends in the market.
Determining entry and exit points: ACD provides buy and sell signals to enter or exit trades at the best possible time.
Bullish Setup :
When the "A up" line is broken, it is advisable to wait for some time to ensure that this is not a "Fake Breakout" and that the price stabilizes above this line.
After entering the trade, the best stop loss you can choose is below the "A down" line. However, it is recommended to test this in backtests to achieve the best results. The suitable reward-to-risk ratio for this strategy is 1, which should also be backtested.
Bearish Setup :
When the "A down" line is broken, it is advisable to wait for some time to ensure that this is not a "Fake Breakout" and that the price stabilizes below this line.
After entering the trade, the best stop loss you can choose is above the "A up" line. However, it is recommended to test this in backtests to achieve the best results. The suitable reward-to-risk ratio for this strategy is 1, which should also be backtested.
🔵 Setting
NDay Pivot Range Period : Using this entry you can specify the number of days to calculate NDay Pivot Range.
Show Daily Pivot Range : Set the Daily Pivot color and displayed or not.
Show NDay Pivot Range : Set the NDay Pivot color and displayed or not.
ATR Period Levels : Determining the period of the ATR indicator, which is used to determine the A and C levels.
Show Tokyo ACD Setup : Set the Tokyo ACD Setup color and displayed or not.
Tokyo Opening Range Time : The amount of time taken to determine the opening range. You can set this number between 5 and 60 minutes.
Tokyo Session : Market start and end time.
A Level Multiplier : The coefficient that is multiplied by ATR to determine the distance of line A up and A down.
C Level Multiplier : The coefficient that is multiplied by ATR to determine the distance of line C up and C down.
The same settings exist for the London and New York sessions.

ATRMonitor: Dynamic ATR and RSI-Based HistogramThe ATRMonitor is a cutting-edge technical indicator designed for traders seeking to harness the combined power of Average True Range (ATR) and Relative Strength Index (RSI) in one intuitive histogram. This innovative tool plots a histogram based on the RSI (6 periods), but with a unique twist: the color of each bar is determined by the relationship between the ATR (6 periods) and its Exponential Moving Average (EMA, 6 periods).
Green Bars: Indicate bullish momentum when the ATR is above its EMA, signaling potential strength in price movements.
Red Bars: Suggest bearish sentiment when the ATR falls below its EMA, potentially indicating weaker price movements.
Ideal for both novice and experienced traders, the ATRMonitor offers a straightforward visualization of market volatility and momentum. It's perfect for various trading styles, including scalping, day trading, and swing trading across diverse markets. Enhance your trading decisions with the ATRMonitor, your go-to tool for a deeper understanding of market dynamics.

Smoothing ATR bandThere are two bands calculated with the ATR and I added "Smoothing" into the script.
Smoothing ATR with multiplier can display two bands above and below the price.
We can ONLY find some ATR bands in Community Scripts with "Basic" setting which is used to set Stop Loss.
And yet , Smoothing ATR with multiplier is capable of making traders manifestly recognize OverBought & OverSold.
FurtherMore, I added a condition with "plotshape", which is "Stop Hunt"
Stop Hunt is an absolutely usual strategy to clean the leverage and it always makes high volatility moves.
When high> above band and close< above band , long signal, it means it had been abundantly bought but the larger traders weren't satisfied; therefore, they quickly sold out to lower the price. The sell condition is on the contrary.
The signals mainly make traders manifestly recognize OverBought & OverSold.

Buyers & Sellers / RangeBuyers & Sellers / Range
Volatility oscillator that measures the relationship of Buying & Selling Pressure to True Range.
In other words, how much % Buyers and Sellers separately occupy the Bar
BSP is a part of Bar Range. Entire bar metrics will always have bigger value than its composite elements (body and wicks).
Since there will be NO chance of BP or SP being more than ATR, their ratio would serve crucial Volatility details.
Hence, we can relate each of them to the overall range.
As a result we have simultaneous measurements of proportions buyers and sellers to the bar.
Default mode shows BP/ATR and SP/ATR mirrored. When one rises, the other falls to compensate.
Buying Pressure / True Range ⬆️🟢 ⬇️🔵
Selling Pressure / True Range ⬆️🔴 ⬇️🟠
They are being averaged in 2 different ways:
Pre-average first, then relate as ratio
Related first, then Averaged
Enable "Preaveraged" to use already averaged BSP and Ranges in ratio instead of averaging the ratio of BSP to individual bar. For example, we're looking BP/ATR, in calculation of buyers / Range it will use "MA(Buying Pressure) / MA(True Range)" instead of "MA(Buying Pressure / True Range)".
Due such calculation, it is going to be more lagging than in off mode. Nevertheless, it reduces noise from the impact of individual bar change.
Second way of noise reduction is enabling "Body / Range"
BSP Body / Range where Bullish & Bearish Body = Buying & Selling Pressure - Relevant Wick
Buying Body = Buying Pressure - Lower Wick
Selling Body = Selling Pressure - Upper Wick
And only then it is divided to ATR.
Note that Balance line differs because body is less than it used to be with wicks. So change in wicks won't play any role in computing the ratio anymore. Thus, signals of their crossings will be more reliable than in default mode.

Volatility Spike EstimatorPlots the Average True Range (ATR), its historical mean, the upper threshold for a volatility spike, and uses background color to show the likelihood of a volatility spike based on the current ATR value.
Green background indicates an increased likelihood of a volatility spike, while red background means a spike might have already occurred or be in progress.
Update: In this version, we added a short-term ATR calculation with an adjustable input parameter, shortTermATRLength. The likelihood of a volatility spike is now estimated based on the short-term ATR instead of the original ATR. This change makes the indicator more sensitive to recent market conditions and can help detect potential volatility spikes more quickly.

Average True Range Refurbished💡 Objective
This script is a rebuild of the pre-existing ATR indicator, with improvements and fine-tuning.
🪄Improvements
1. Normalization option (range 0 to 100)
2. Optional calculation of the ratio between current volatility and average volatility
3. Optional smoothing
4. Show a moving average
5. Show Bollinger Bands with 3 bands
6. Change bar colors according to ATR and Bollinger Bands
📚 Definition
'The Average True Range (ATR) is a tool used in technical analysis to measure volatility. Unlike many of today's popular indicators, the ATR is not used to indicate the direction of price. Rather, it is a metric used solely to measure volatility, especially volatility caused by price gaps or limit moves.'
(TradingView)

Trend #4 - ATR+EMA channelOverview:
This strategy use ATR to take-profit, Red-EMA to stop-loss, Blue-EMA channel to judgment breakout.
This strategy use commission setting is 0.05%, slippage setting is 2 ticks, you can set the appropriate value size in the properties page.
What it does:
This strategy detects when a trend is emerging and buy or sell.
How it does it:
When the price breaks through the blue EMA channel, the trend is judged to be strong in the short term, strategy generates a buy or sell order.
After buying or selling,, if the price moves in the expected direction, uses ATR to determine the appropriate spread to take profit, otherwise use red EMA for stop loss.
How to use it:
Start Date and Stop Date - This parameter adjusts the time range used by the strategy.
Stoploss - This parameter adjusts the stop loss amount after each order is placed.
Blue EMA length - This parameter adjusts the length of the channel.
Blue EMA multy - This parameter adjusts the width of the top and bottom of the channel.
ATR Period - This parameter adjusts the number of candles used by the ATR.
ATR mult - This parameter adjusts the upper and lower widths of the ATR. Lowering this parameter can improve the win rate, but not necessarily the profitability.
Red EMA length - This parameter adjusts the number of candles used by the red EMA .
Long - This switch is used to turn Long position on or off.
Short - This switch is used to turn short position on or off.

Spinn ATR targetNot quite the usual approach to plotting targets on the chart, where the price will come with a given probability.
The indicator draws targets by studying the ATR of the target timeframe. More precisely, this is not exactly an ATR - the price move is taken from the closing price of the previous bar and is calculated both up and down separately.
The settings specify the percentage used to calculate the price move, at which the specified percentage of bars reached this price move in the past.
Simply put, if we set 50% in the settings, this means that a line will be drawn at the level at which the price reached this level in 50% of cases over a given period.
--
Не совсем обычный подход к построению целей на графике, куда цена придет с заданной вероятностью.
Индикатор рисует цели, изучая ATR целевого таймфрейма. Точнее, это не совсем ATR - ход цены берется от цены закрытия предыдущего бара и считается отдельно как вверх, так и вниз.
В настройках задается процент, исходя из которого вычисляется ход цены, при котором заданный процент баров достигал этого хода цены ранее.
Проще говоря, если мы задаем в настройках 50%, то это означает, что будет построена линия на том уровне, на котором цена в 50% случаев за заданный период достигала этого уровня.

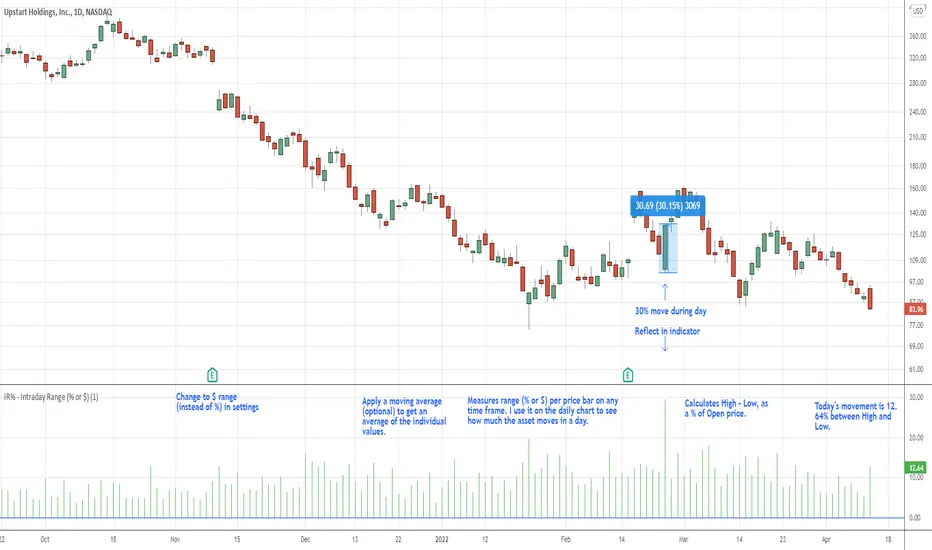
IR% - Intraday Range (% or $)Shows the percentage difference between the High and Low of the price bar expressed as a percent of the Open of that bar. In the settings, you can change to Price Change instead of percent change. This will show the price change between the High and Low for each price bar.
It can be used on any time frame.
I use it on the daily chart . I note the daily figure, and that lets me know how far the price tends to move during a typical day (no gaps included).
If using on another time frame other than the daily, then it is an intrabar calculation, not intraday.
Apply a moving average to it to see the average intraday movement after the open when using a daily chart .
The IR% of a 1-minute chart tells you the price range of that one-minute price bar, and a weekly chart will show the price range of each weekly price bar.
It only measures high to low versus the candle's open price. It does not include gaps between candles, which makes it different than the ATR. ATR is more useful for swing trading, where the trader may be holding through gaps in price, and thus wants to factor them in.
The IR% is useful for day traders because it shows how much a stock tends to move during the day (intraday range), when using a daily chart . ATR is not as effective for this because it includes gaps, which day traders can't generally capitalize on.
If the IR% is fluctuating between 5% and 10% over the last 50 days or so (on the daily chart ), day traders know that AFTER the open, the price is likely to move 5% to 10% from high point to low point. This can help with establishing profit targets, seeking out stocks that tend to move a lot within the day, or avoid these types of stocks if they are undesirable to you. Seek out low IR% stocks if you prefer lower movement during your selected time frame.
A stock may have an ATR% of 5% but ATR doesn't tell us if that movement occurred after the open or includes a gap. Some stocks are prone to gaps. They may gap 4% most days, and then only move 1% during the day. This will still be a 5% ATR%, but most of that movement ISN'T capturable each day. The IR% for this stock would only be 1%, not 5% like the ATR suggests.
I developed this because I like day trading volatile stocks, and I wanted a measure that ONLY includes movement during the day, and doesn't include price gaps in the calculation. Because as a day trader, gaps don't matter to me. I can only make money on what happens during the day, after the open.
It is similar to another indicator called Average Day Range (ADR). Although most ADR calculations are already calculated as an average (so I don't see each individual value) or plots things on the chart. This may be useful for some people, but I wanted to see the data on each price bar, have the option to add a moving average or not, and not have anything plotted on the price chart. It also nice to be able to flip from % to $ dollar movement if desired.
Stairs Gain Strategy - MGI will explain step by step.
1- The position order filtering option is used to filter out duplicate positions.
2- The reason I use an ATR multiplier is to balance the ATR value that differs in instruments.
3- ATR lower limit and ATR upper limit values are to reduce unnecessary transactions and commission expenses in the horizontal market.
4- Strategy take profit and stop loss levels are calculated as percentages. The reason why there is no point account is that it can be used in the stock market.
5- Developer friends can get a more efficient result in forex market instruments by converting this to a point account.
Notice :
Variables are different in each instrument. Therefore, this strategy should be optimized for each instrument used.

CHOPperIt is based on the Choppiness Index indicator. It can show you when the market is in range. If the lines are below the lower band, it can be a strong trend, if it is inside the 2 bands, it is considered to be a choppy market, and if it is crossed down the upper band, it can be a developing trend.
This indicator does not show you the trend direction! This may be used as a confirmation indicator.
The improvements this indicator provides over the original:
It uses ATR instead of just TR (if ATR length is 1, it is the original TR)
It uses my ATRWO (ATR Without Outliers) indicator inside, which can remove extreme highs and lows from calculation. You can tune this by the "ATRWO STDev Mult" parameter. Higher value means more outliers are allowed.
It has 2 lines, one uses ATR(WO) (the blue one), which can be similar to the original Choppiness Index, the other uses standard deviation (the teal one).
The 2 lines can be used together, or you can hide one of them.

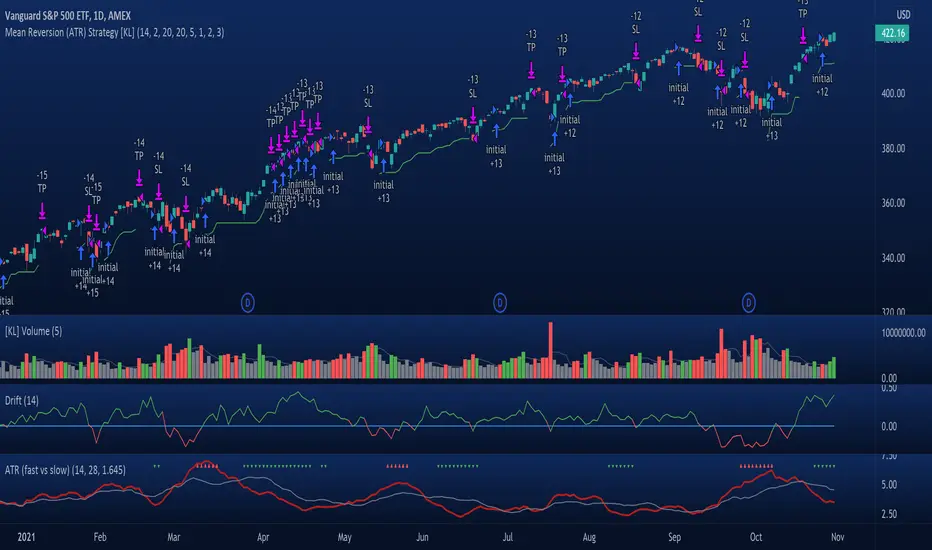
[KL] Mean Reversion (ATR) StrategyThis strategy will enter into a position when price volatility is relative high, betting that price will subsequently trend in a favourable direction.
Hypothesis : During periods of high price volatility, ATR will divert from its moving average by at least +/- one standard deviation. Eventually, ATR will revert back to the mean. However, just knowing the magnitude of increase/decrease of ATR does not give a trend signal, so we need to introduce a model in this script to predict whether the next bars will be up/down.
Trend Prediction : This strategy calculates the expected logarithmic return of the security (the "Drift") and considers prices to be moving in uptrend if the drift curve is upward sloping or if the drift value is positive.
Entry Conditions : Long position is entered when:
(a) ATR has diverted from mean by one standard deviation, and
(b) trend is predicted to move in our favor.
Exit Condition : When trailing stop loss is hit.
Results from backtesting against VOO (1H timeframe):
- approx 46% win rate over 491 trades, on average holding for 20 hours per trade
- price at the beginning of backtest (Jan. 2015) was $187.52, giving holding period return of ~120% had we not sold in between ("HPR of HODL'ing")
- this strategy gained ~159%, exceeding ~120% HPR of HODL'ing
Av3Based on the ANNE EA v3 for MT4. For use on FOREX.
if ATR is greater than ATR average taken from last 5 candles, then market considered as trending, and so Open(0)>Close(1)=buy Open(0)Close(1)=sell Open(0)

Relative ATR by Alejandro PThis is an indicator that expands the usability of ATR into a strong and valuable volatility indicator.
With the Relative ATR you can quickly see when the current market volatility its extremely low, normal or extremely high in relation to the past.
This provides traders with a much more valuable insight as to the current market conditions than normal volatility indicators.
A trader can, for example, decide to filter its strategy to only periods where the ATR is in its lowest percentiles which tells him that the market is unusually "quiet" recently and there may be a big breakout about to happen.
Or a trader can use the filter to avoid getting whipsawed with their strategy by avoiding taking trades when the Relative ATR is at its highest percentiles.

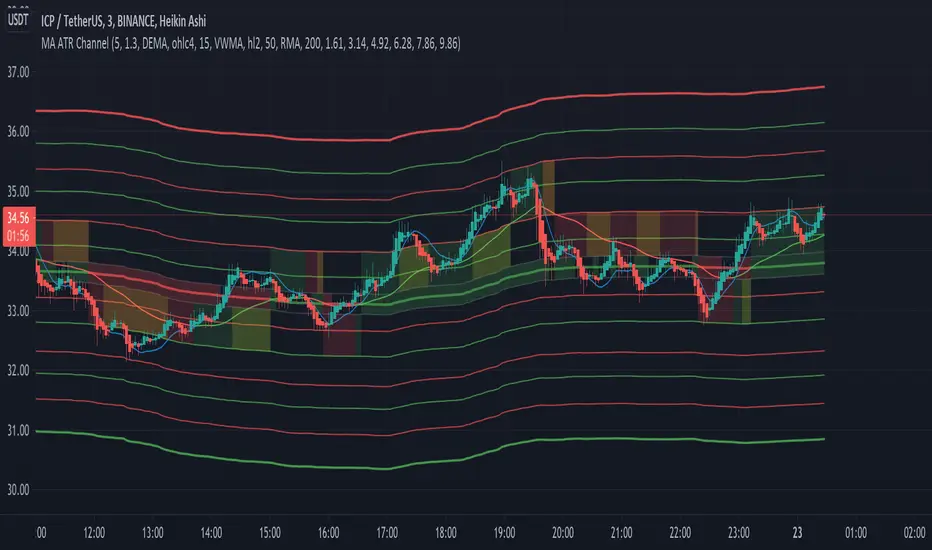
[EG] MA ATR ChannelsGreetings - the aim of this indicator was to code a single indicator with a selectable moving average, so I could examine price relationships to MA's and Average True Range (ATR) bollinger type bands. You can obviously approach this tool in so many different ways so I am going to share first an overview of moving averages and a short overview of how I use this this indicator.
Simple ( SMA ) – A simple average of the past N (length) prices. Just add the price data for each N (bar) and divide the total by N.
Exponential ( EMA ) – An exponential moving average with a greater weight for recent prices. The weighting is exponential. An N-period EMA takes more than N data points into account and gradually dilutes past data’s effect.
Double Exponential ( DEMA ) - Same as an EMA , the Double exponential moving average , or DEMA , is a measure of a security's trending average price that gives the even more weight to recent price data. Aimed to help reduce lag.
Triple Exponential ( TEMA ) - Same as an EMA , the Triple exponential moving average , or TEMA , is a measure of a security's trending average price that gives the even more weight to recent price data than EMA or DEMA . Aimed to help reduce lag.
Weighted ( WMA ) – An average of the past N prices with a linear weighting, again giving greater weight to more recent prices.
Hull ( HMA ) - The Hull Moving Average (developed by Alan Hull) has the purpose of reducing lag, increasing responsiveness while at the same time eliminating noise. It emphasises recent prices over older ones, resulting in a fast-acting yet smooth moving average that can be used to identify the prevailing market trend.
Wilder's (RMA) - Wilder's smoothing is a type of exponential moving average . It takes one parameter, the period n, and price. Larger values for n will have a greater smoothing effect on the input data but will also create more lag. It is equivalent to a 2n-1 Exponential Moving Average . For example, a 10 period Wilder's smoothing is the same as a 19 period exponential moving average .
Symmetrically Weighted ( SWMA ) - Weight distribution starts from median of given period and it's reduced linearly to the sides so the ending and starting point of period have the least weight. It's smooth and fast but reacts late to trend changes on higher lengths (lookback).
Arnaud Legoux ( ALMA ) - Arnaud Legoux Moving Average removes small price fluctuations and enhances trend via applying a moving average twice, once from left to right, and once from right to left and combines both. At the end of this process the phase shift (price lag) commonly associated with moving averages is significantly reduced.
Volume-Weighted ( VWMA ) - A Volume-Weighted Moving Average gives a different weight to each closing price and this weight depends on the volume of that period. For example, the closing price of a day with high volume will have a greater weight on the moving average value.
Volume Weighted Average Price ( VWAP ) - Though not necessarily a MA - Volume-weighted average price ( VWAP ) is a ratio of the cumulative share price to the cumulative volume traded over a given time period and so I thought would be useful as an ATR tool. The VWAP is calculated using the opening price for each day and adjusting in real time right up until the close of the session. Thus, the calculation uses intraday data only.
So what is Average True Range ?
Average True Range is a measure of volatility . It's an area that represents roughly how much you can expect a security to change in price over a time period. Average true range is usually calculated by applying Wilders Smoothing to True Range. If you want regular ATR - use RMA as the input for the ATR. The ATR is then divided into periods based on derivatives of Phi (3.14) and Fibs (0.618, 1.618 etc.) You will notice price bounces off the lines. Look for patterns.
The indicator - consisting of 3 parts:
Price/Fast MA - this is an MA anywhere between 3-20 periods that is reflective of very recent price action. It is red when price is below - and green when above. Recommendations : SMA , EMA , WMA , HMA
Trend/Medium MA - this is a slower MA that you could set anywhere between 30 - 100 periods that is reflective of overall bull/bear market trend depending on both it's direction and whether the Price MA / price is lower or higher. Recommendations: EMA , WMA , VWMA , RMA, ALMA
Average True Range - this is a way to measure and visualise range the price may be capable of in - if it is towards or below the 2.1 multiplier - a bull reversal is more likely and vice versea. The multi's are set to factors of Pi and Fibonacci ratio's. Green channel means bullish, red channel means bearish. Gold means sign of a likely reversal. If the PMA enters the channel - it is likely the reversal is cancelled for a short period more.
Recommendations : RMA, EMA , VWMA , ALMA , SWMA , VWAP
How I use it :
First of all - Consider longs when channel is green - or going to bounce on a support line - and consider shorts based on the opposite. This is not a buy/sell indicator - this is a MAP to PRICE to give reference and meaning to price movements across multiple time frames - very useful when using with a volume indicator and an RSI. I personally use it on the 3m chart but change the TFM to 5 for 15m data.
If you wish to see any other more exotic or interesting MA's added please feel free to request them in the comments ! And thanks for checking out my first indicator