Simple Ema_ATR Strategy HulkTradingSimple EMA strategy, based on ema55+ema21 and ATR(Average True Range) and it enters a deal from ema55 when the other entry conditions are met
Basically long and short conditions
If long:
1) close must be less than open (because we are searching for a pullback)
2) emaFast(21) must be bigger than emaSlow(55) - for a trend detection
3) Difference between emaFast and emaSlow must be greater than ATR(14) - for excluding flat
For short conditions are opposite
Stop levels and take profits, based on ATR multiplier.
You can change it in input field.
I recommended values between 1 and 4, not more.
This strategy was tested on pairs BTCUSDT and ETHUSDT and have a nice results.
Cerca negli script per "atr"

Wavy Tunnel + Trend ATR Buy Sell Signal by PaRnWavy Tunnel + Trend ATR Buy Sell Signal by PaRn
Originality by PaRn
First Combination of Wavy Tunnel + Trend ATR Buy Sell Signal by PaRn
"Buy Sell Signal" is base on Volatility Stop 20, Multiplier 2.5
"Trend Signal" is based on EMA crossover between EMA12(Close) and EMA26(Close)
Take Profit Line is EMA15(Default)
Wavy line Base on EMA34(high,close,low)
Tunnel line Base on EMA144(close),EMA169(close)
Green Candle Bar = "Uptrend"
Red Candle Bar = "Downtrend"
Buy when "Buy" Signal present
Follow Trend till the end of the trend : "Sell" Signal present
Buy More (Optional) = Green Arrow present on Uptrend
How to use Wavy Tunnel + Trend ATR Buy Sell Signal by PaRn
- Wavy Tunnel + Trend Signal can be used in any timeline from 5 Minutes to Weeks
- Price above both Wavy & Tunnel = "Uptrend"
- Green Candle Bar = Uptrend
- Buy when "Buy" Signal present
- Buy More (Optional) = Green Arrow present on Uptrend
- Hold your possition and Follow Trend till the end of the trend : "Sell" Signal present, It's time to sell all position
NOT RECOMMEND TO USE ON SIDEWAY MARKET

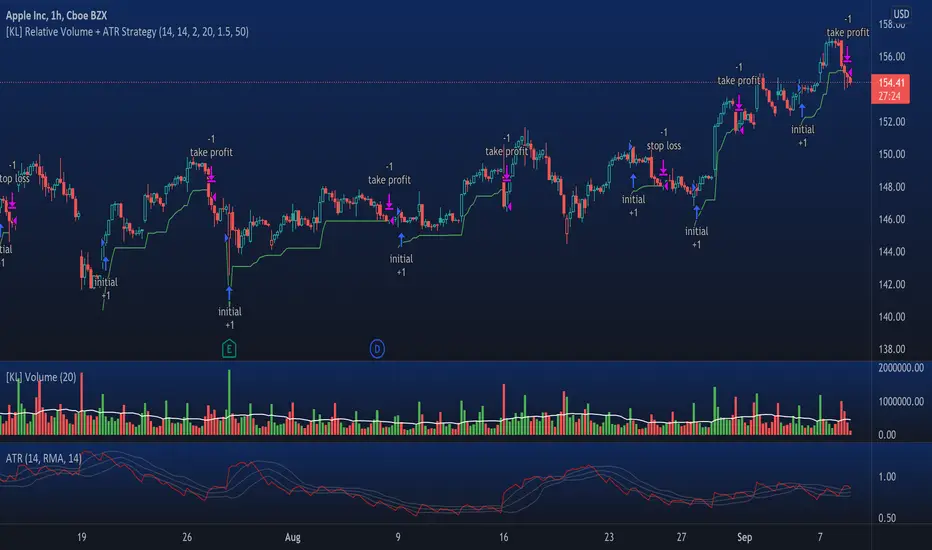
[KL] Relative Volume + ATR StrategyThis strategy will enter into long position when (a) current volume is above the average volume, and when (b) volatility of prices (based on ATR) is relatively low.
Backtested on hourly timeframes, win rates range between 35% to 50% on stocks with positive drifts (i.e. tendency to move upwards). Default setups are as follows:
- Average volume is computed using simple moving average (sma) of 14 periods. By default, 1.4x ratio seems to work well on most large cap stocks. If it's too high, then amount of potential points for entry will decrease. But if it's too low, then this indicator becomes meaningless.
- ATR (for determining volatility), look back period is 14 (following conventions). I have noticed that the profits could change drastically when changed to different values for each individually security. Feel free to experiment around with this parameter.
Other information: This strategy is based off of one of my previous scripts; a script called "Relatively Volume Strategy". The objective of this new script is to simplify the process of determining periods of low volatility. In this new script, we assume prices are consolidating when current ATR is within its moving average value by +/- one standard deviation.
Volume Average / Current Volume / ATR On ChartSimple Study to display volume data and atr value on the chart. It will display the relative volume in percentage, an average volume and the current volume and ATR value for the time resolution.
Thank you to @PriceCatch for the ATR code

Dynamic SMAThis script uses dynamic length to create a different sma type.
The length of the "Dynamic SMA" - "dSMA" can be:
'RSI', 'Stoch', 'ATR', 'MFI' or '%R'
For example 'RSI' -> the length of the sSMA will be the RSI itself
The biggest challenge was:
'Pine cannot determine the referencing length of a series. Try using max_bars_back' error
The writer of 'referencing length of a series' issue gave following solution:
bar_index == 0 ? 4999 : len
or in case of values which don't go above 100:
bar_index == 0 ? 100 : len
This assigns the necessary buffer to the function.
I'm most grateful for the given solution!
These dSMA's can give Support/Resistance levels, also crossovers of different dSMA's can give extra information
Examples:
RSI
ATR (close / atr(len)
Stoch
MFI
%R
"show regular SMA" will show the "SMA" with the same length (with default lighter color)

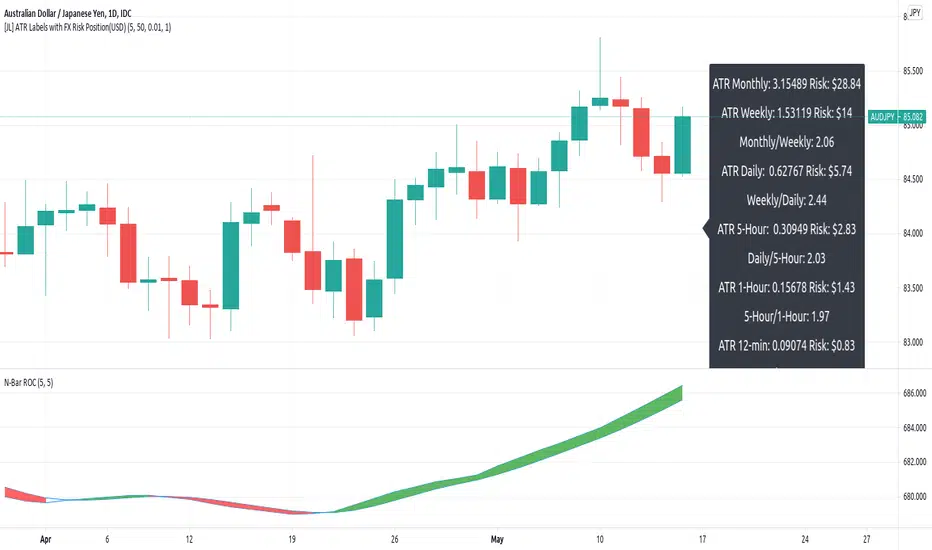
[JL] ATR Labels with FX Risk Position(USD)I always use ATR to set up SL. So I changed ATR Labels to calculate risk dollars based on curency pairs.
I can not update old ATR Labels title. So I publish this new script.
This pip value calculation is based on USD currency.
Advanced Average True RangeThis indicator allows you to improve your stop loss placement. It displays two lines based on the ATR ( Average True Range ), an upper line based on the current price + ATR and a lower line based on the current price - ATR. The ATR is multiplied by 2 but you can change this in the indicator settings.

Daily GAP StatsI did not write the script from scratch but rather started editing code of an existing one. The original code came from a script called GAP DETECTOR by @Asch-
First up: I am a trader, not a programmer and therefore my code most likely is inefficient. If someone with more expertise would like to help and optimize it - feel free to get in touch, I am always happy to learn some new tricks. :)
This script does 2 things:
- It shows daily gaps stats based on user inputs
- It shows color coded labels on gap days with additional information in tooltips ( important: make sure to read 'known issues/limitations' at the end )
User Inputs
==========
Although the input dialog is pretty straight forward, I do a quick rundown:
- Length: max lookback time
- Gap Direction: self explanatory
- Show All Gaps | Cont Only | Reversal Only | Off:
This refers to the way labels are displayed on gap days (again: make sure to read known issues/limitations!)
- Show All Gaps: does what it says
- Cont Only: only shows gaps where price continued in the gap direction. If you filter for gap ups and chose 'Cont only' you will only see labels on gap days where price closed above the open (and vice versa if you scan for gap downs).
- Reversal Only: you will only see labels for closes below the open on gap up days (and the opposite on gap down days)
- Off: self explanatory
- Gap Measure in ATR/PCT: self explanatory, ATR is calculated over a 10d period
- Gap Size (Abs Values): no negative values allowed here. If you filter for gap downs and enter 3 it means it will show gaps where the stock fell more than 3 ATR/PCT on the open.
- RVOL Factor: along with significant gaps should come significant volume. RVOL = volume of the gap day / 20d average volume
- Viewing Options: Placing the stats label in the window is a bit tricky (see knonw issues/limitations) and I was not sure which way I liked better. See for yourself what works best for you.
Known Isusses/Limitations:
=======================
- Positioning of the stats table:
As to my knowledge, Tradingview only allows label positioning relative to price and not relative to the chart window. I tried to always display the gap stats table in the upper right corner, using 52wk high as y-coordinate. This works ok most of the time, but is not pretty. If anybody has some fancy way to tag the label in a fixed position, please get in touch.
- Max number of labels per script:
TradingView has a limitation that allows a maxium of ~50 labels per script. If there are more labels, TradingView will automatically cut the oldest ones, without any notification. I have found this behaviour to be rather inconsistent - sometimes it'll dump labels even if there are a lot fewer than 50. Hopefully TradingView will drop this limitation at one point in the future.
Important: The inconsistent display of the gap day labels has NO INFLUENCE on the calculations in the gap stats table - the count and the calculations are complete and correct!

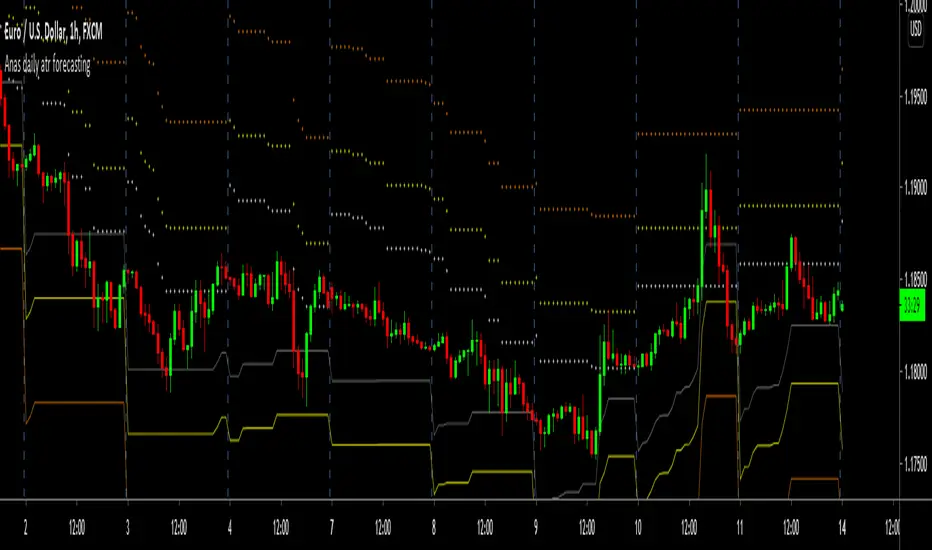
Anas daily atr forecastingthis indicator is used to forecast the coming day ATR by using hourly ATR and multiply by 24 hour then multiply with common Fibonacci retracement of 0.68 and 0.38 alternately
and it tracks the intraday price oscillation , so if first target reached its recommended for breakeven , 2nd target is the forecasted ATR and its recommended take profit for intraday
if there is a strong news and its expected to have strong movement last target is recommended .
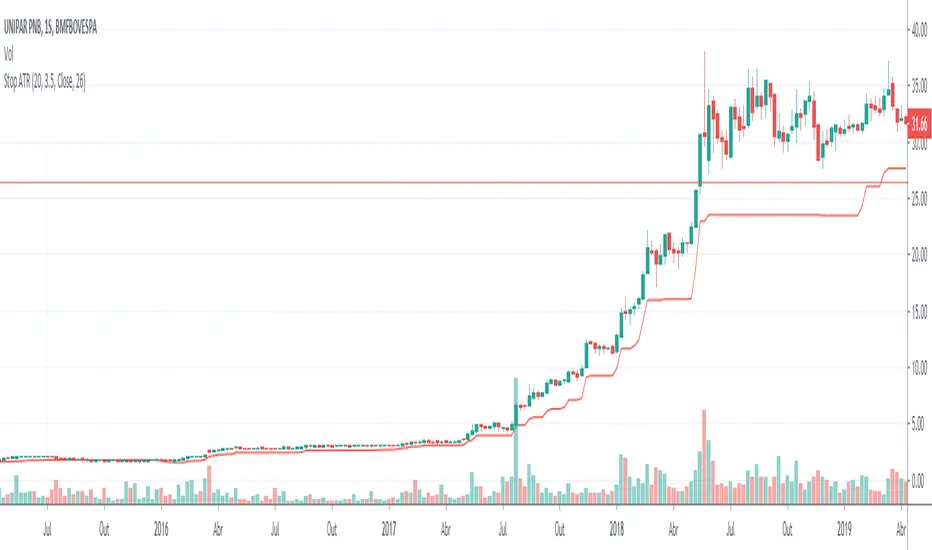
Stop ATR BuyStop ATR focused on Bull Trend Following, therefore it is plotted only as ATR subtracted from the prices. This indicator has the correct calculation of the ATR formula.
Baseline + cross signals within atr channelThis script displays an KAMA (kaufman adaptative moving average) baseline on the chart (default = 14, 2, 30) or a Kijun baseline.
It displays visual signals at every baseline crossover :
- Long (green) if a crossover + within an ATR distance.
- Short (red) if a crossunder + within an ATR distance.
- Filtered signals (not within the ATR channel) are displayed in yellow.
A x factor can be applied to ATR.
Adapted to both dark and light mode

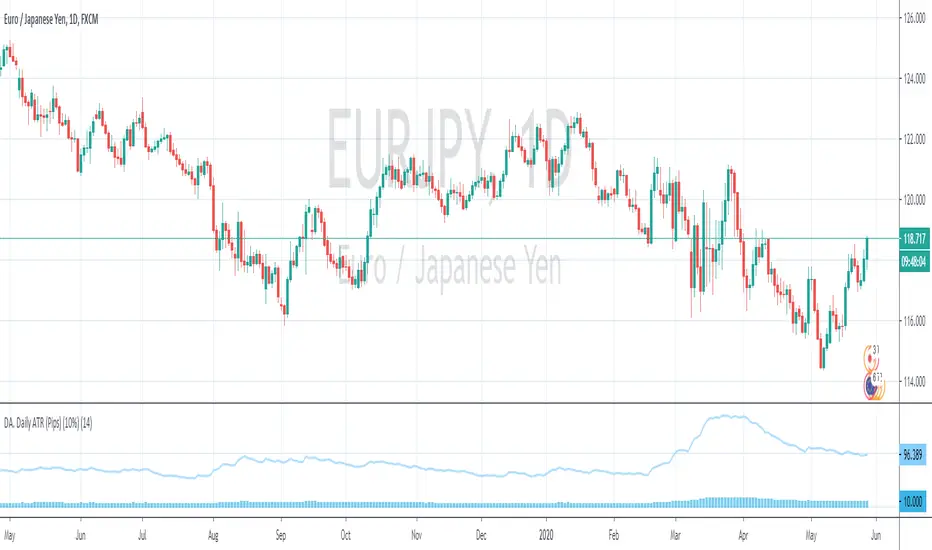
DA. Daily ATR (Pips) (10%)This is the Daily ATR Indicator that convert the ATR value into pips.
This script support the pair that contain JPY.
And show the 10% value of ATR in pips.
Separated ATR - evoThis script plots two ATR (Average True Range) values, one based on only bullish and the other based on only bearish bars. If the current bar is positive, the negative ATR will use its last known negative bar for the calculation. You can smooth bar directions by using the Heikin Ashi setting.
Use this the same way how you would use the regular ATR indicator, but with the added value of knowing which side of the market has more volatility.

Range Force Impulse The "Range Force Impulse" indicator combines 4 useful indicators into one, freeing up chart real-estate and giving the trader insight into trend health, bull/bear commitment, range and volatility all at a glance.
The indicator consists of the following:
Direction - True Range and Average True Range columns shown above and below 0 depending on direction of the period's price
-- TR (gray) shows the current period's trading volatility
-- ATR (Impulse colors, see below) shows an EMA of TR over a specified length
-- Can be used to determine stops and targets (Example: Stop loss at prev close - ATR, Target at 2x ATR)
Index - Alexander Elder's EMA of (change(close) * volume), shows crosses above 0 (green) and below 0 (red), and intermediate signals
-- Shows bull vs. bear interest/commitment/dominance
-- Elder recommends EMA length of 2 for daily chart buy/sell signals, and 13 for weekly chart bull/bear dominance & trend direction signals
-- Intermediate signals are shown above 0 when falling (salmon), or below 0 when rising (pale yellow)
System - Range columns are colored using Alexander Elder's censorship system (green: do not short, red: do not long, blue: is up to you)
-- Shows overall trend health (Macd histogram and EMA up/down changes)

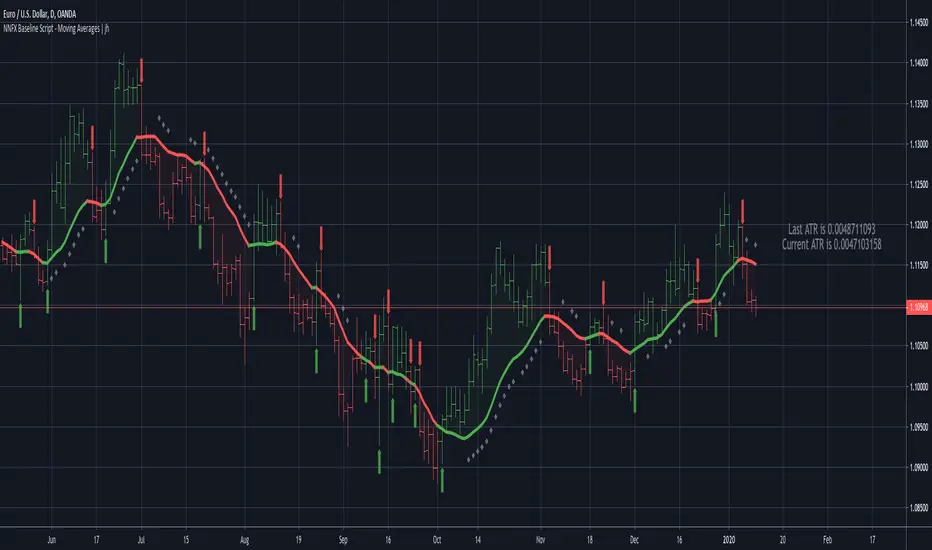
No Nonsense NNFX VP Strategy for Back Testing Baseline | jhStrategy for the NNFX Baseline Script - Moving Averages
Does not enter when price is > 1 ATR away.
Adapted the "Many Moving Averages" script to VP's NNFX No Nonsense Forex method.
Includes:
- ATR bands and labels
- Price is > 1 ATR away from baseline indication
Available MAs
"ALMA", "EMA", "DEMA", "TEMA", "WMA", "VWMA", "SMA", "SMMA", "HMA", "Kijun", "McGinley"

NNFX Baseline Script - Moving AveragesCredits to @Fractured
Adapted the "Many Moving Averages" script to VP's NNFX No Nonsense Forex method.
Includes:
- ATR bands and labels
- Price is > 1 ATR away from baseline indication
Without ATR Bands and bar colors
Available MAs
"ALMA", "EMA", "DEMA", "TEMA", "WMA", "VWMA", "SMA", "SMMA", "HMA", "Kijun", "McGinley"