10 Simple & 6 Exponential Moving Averages (w/ 18 day,week,month)* This is for the trader who wants tons of moving averages on their chart from one indicator
* Using the options, you should be able ot turn off some of them if the screen is too noisy for you
* You should also be able to change colors and thickness of the bars
* The thicker bars are for longer term averages
* This version is similar to my other script except it adds the 18 day, 18 week, and 18 Month SMa
* I added them after watching ira Epstein's YouTube videos
* Let me know if there are any bugs or things that need to be change
Cerca negli script per "averages"
Multiple Moving Averages (Rainbow Waves)Two moving averages with toggle for Rainbow Wave mode (total of 16 equally spaced moving averages)

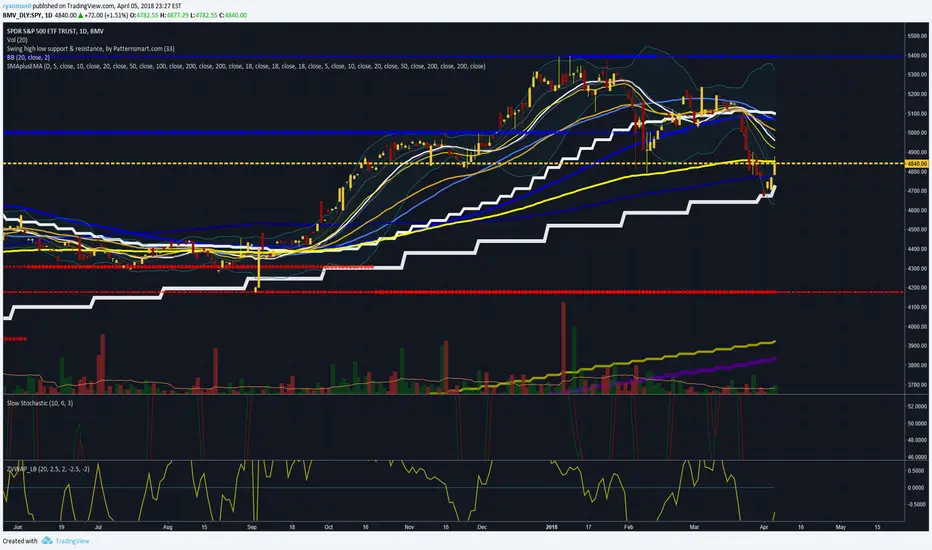
Multiple Moving AveragesThis is really simple. But useful for me as I don't have a paid account. No-pro users can only use 3 indicators at once and because I rely heavily on simple moving averages it can be a real pain.
This one indicator features:
20 MA
50 MA
100 MA
200 MA
which I find are the most useful overall. The 20 and 50 over all time frame but in particular < 1 day, the 100 and 200 at > 4 hr time frames. In general I don't use the 100 MA that much. The daily 200 MA is a critical support for many assets like stocks and cryptos. I'm by no means a pro and if you are learning I recommend becoming familiar with moving averages right at the beginning.
If you want to deactivate some of the lines, you can do it via the indicator's settings icon.


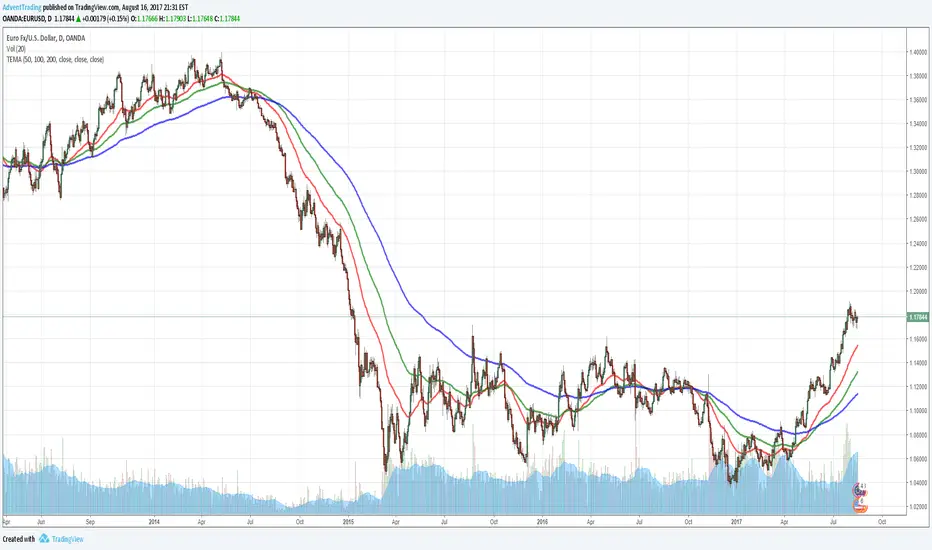
Three Moving Averages [AdventTrading]I couldn't find a Indicator that allowed me to have 3 Moving averages in one. So I made one myself.
Allows three different Moving Averages in one indicator.
Enjoy.
Multiple Moving Averages using only 1 Indicator!Multiple moving averages in one indicator, so those of you without a pro membership can add multiple moving averages to your chart while only taking up 1 of the 3 indicators.

Trade Archer - Moving Averages - v1A group of four moving averages used for price smoothing. It also creates a cloud between Fast Ma and Medfast MA, Medfast MA and Medslow MA, and Medslow MA and Slow MA. Originally only Exponential Moving Averages were available, however the option to choose SMA, EMA (default), RMA, WMA, and VWMA were added. Also added was the option to choose the source of input. If any interesting additions are added, please let me know so I can update the script.

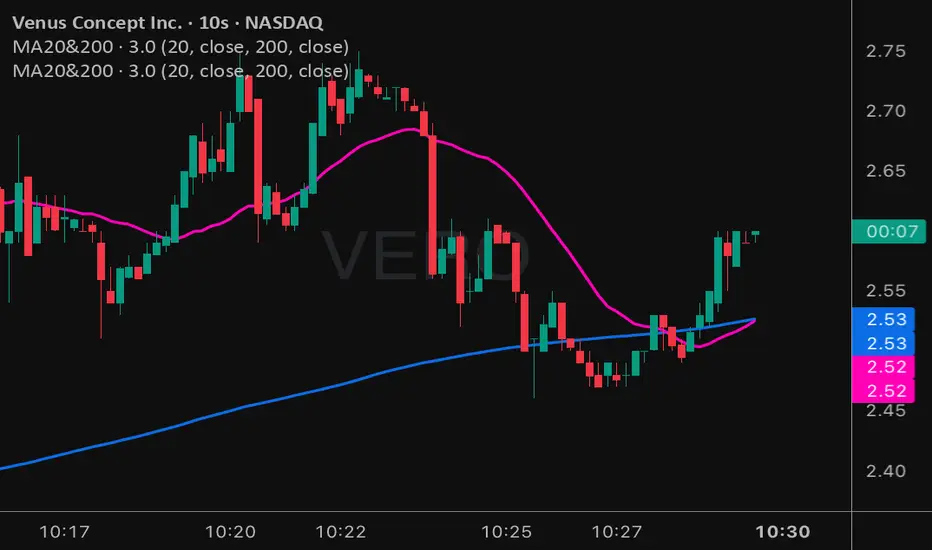
Moving Averages 20 & 200Moving Averages 20&200. Help you decide buy signal to find bullish or bearish.
Magic Moving AveragesThis indicator plots up to three adaptive “Magic MAs” plus a weighted combo line, with optional traditional SMAs for comparison.
Instead of averaging only closes, each Magic MA:
looks at the midpoints of highs/lows and opens/closes
decides whether recent behaviour favours the highs or the lows
builds a series of either highs or lows, then smooths it over your chosen length
You can run:
Short / Medium / Long Magic MAs
A weighted combo line (using 1–10 weights)
Optional traditional short/long SMAs on close
How I use it:
Price above the combo line → bullish bias
Price below the combo line → bearish bias
Short/medium/long Magic MAs together → dynamic support/resistance and trend structure
Traditional SMAs on for comparison with “classic” moving average behaviour
Inputs:
Magic MA lengths control how reactive vs smooth each regime is
Weights (1–10) let you emphasise short, medium or long regimes in the combo
This is a free / educational version of the Magic MAs.
It’s not financial advice – always manage your own risk.

Moving Averages (10, 21, 50, 200)Moving Averages including 10, 21, 50 and 200 period. Intended mainly for use on a daily chart, but will work for any period.

Strategy: HMA 50 + Supertrend SniperHMA 50 + Supertrend Confluence Strategy (Trend Following with Noise Filtering)
Description:
Introduction and Concept This strategy is designed to solve a common problem in trend-following trading: Lag vs. False Signals. Standard Moving Averages often lag too much, while price action indicators can generate false signals during choppy markets. This script combines the speed of the Hull Moving Average (HMA) with the volatility-based filtering of the Supertrend indicator to create a robust "Confluence System."
The primary goal of this script is not just to overlay two indicators, but to enforce a strict rule where a trade is only taken when Momentum (HMA) and Volatility Direction (Supertrend) are in perfect agreement.
Why this combination? (The Logic Behind the Mashup)
Hull Moving Average (HMA 50): We use the HMA because it significantly reduces lag compared to SMA or EMA by using weighted calculations. It acts as our primary Trend Direction detector. However, HMA can be too sensitive and "whipsaw" during sideways markets.
Supertrend (ATR-based): We use the Supertrend (Factor 3.0, Period 10) as our Volatility Filter. It uses Average True Range (ATR) to determine the significant trend boundary.
How it Works (Methodology) The strategy uses a boolean logic system to filter out low-quality trades:
Bullish Confluence: The HMA must be rising (Slope > 0) AND the Close Price must be above the Supertrend line (Uptrend).
Bearish Confluence: The HMA must be falling (Slope < 0) AND the Close Price must be below the Supertrend line (Downtrend).
The "Choppy Zone" (Noise Filter): This is a unique feature of this script. If the HMA indicates one direction (e.g., Rising) but the Supertrend indicates the opposite (e.g., Downtrend), the market is considered "Choppy" or indecisive. In this state, the script paints the candles or HMA line Gray and exits all positions (optional setting) to preserve capital.
Visual Guide & Signals To make the script easy to interpret for traders who do not read Pine Script, I have implemented specific visual cues:
Green Cross (+): Indicates a LONG entry signal. Both HMA and Supertrend align bullishly.
Red Cross (X): Indicates a SHORT entry signal. Both HMA and Supertrend align bearishly.
Thick Line (HMA): The main line changes color based on the trend.
Green: Bullish Confluence.
Red: Bearish Confluence.
Gray: Divergence/Choppy (No Trade Zone).
Thin Step Line: This is the Supertrend line, serving as your dynamic Trailing Stop Loss.
Strategy Settings
HMA Length: Default is 50 (Mid-term trend).
ATR Factor/Period: Default is 3.0/10 (Standard for trend catching).
Exit on Choppy: A toggle switch allowing users to decide whether to hold through noise or exit immediately when indicators disagree.
Risk Warning This strategy performs best in trending markets (Forex, Crypto, Indices). Like all trend-following systems, it may experience drawdown during prolonged accumulation/distribution phases. Please backtest with your specific asset before using it with real capital.


Five Moving Averages (5, 10, 21, 50, 200)This helps to use multiple Moving averages . Using this indicator you can able to user 5 time frames at time .

VM TRADERS 3 Moving Averages SimpleThis indicator displays three Simple Moving Averages (SMA) that can be toggled on/off individually. Perfect for traders who use multiple SMAs to identify trends, support/resistance levels, and potential entry/exit points.
Features:
- SMA 30 (White) - Short-term trend
- SMA 50 (Yellow) - Medium-term trend
- SMA 100 (Blue) - Long-term trend
- Toggle each SMA on/off independently
- Customizable periods and colors
- Clean and organized settings interface
Ideal for swing trading, trend following, and multi-timeframe analysis across Forex, Crypto, Stocks, and Synthetic indices.

TFX AVERAGESThis indicator created by TFX features the EMA's of 5, 10, 20, 50, 200. These indicators will show the averages of candles.

Advanced Multi-Timeframe Moving AveragesThis indicator combines three fully customizable Moving Averages (MA30, MA80, MA120 by default) with multi-timeframe support, trend detection, and visual highlights — all in one lightweight script.
⚙️ Features
🕒 Multi-Timeframe Control – set a custom timeframe for each MA (e.g. MA30 from 1H, MA80 from 4H, MA120 from Daily).
🟢 Dynamic Trend Coloring – candles and background turn green when price is above all MAs, and red when below.
⚡ Crossover Alerts – built-in alerts for MA1↔MA2, MA2↔MA3, and MA1↔MA3 crossovers.
🎨 Optimized Colors – clear, bright MA colors for better visibility:
MA 1 (short-term): Gold (#FFD700)
MA 2 (mid-term): Deep Sky Blue (#00BFFF)
MA 3 (long-term): Hot Pink (#FF69B4)
🧩 Simple, Modular Design – easily adjust lengths, types (SMA/EMA), and timeframes from inputs.
🧠 How to Use
Add the indicator to your chart.
Set your preferred lengths (e.g. 30, 80, 120).
Optionally assign different timeframes for higher-TF analysis.
Use the color cues and crossovers to spot momentum shifts and trend changes.
🪶 Notes
Works great on all assets (crypto, forex, stocks, indices).
Compatible with both light and dark themes.
Built with Pine Script v5 — no external dependencies.

Simple Moving AveragesIn Pine Script v6, the standard method for plotting indicators is still the plot function, and it should be recognized. However, if you are getting an "Undeclared identifier 'plot'" error, double-check these points:
Make sure your script is still using indicator() (not study()) at the top.
The script must not use indentation or syntax errors that break context.
Confirm Pine Script version is set correctly with //@version=6.
Here is a fully corrected Pine Script v6 template for your moving averages scenario using
THAIT Moving Averages Tight within # ATR EMA SMA convergence
THAIT(tight) indicator is a powerful tool for identifying moving average convergence in price action. This indicator plots four user-defined moving averages (EMA or SMA). It highlights moments when the MAs converge within a user specified number of ATRs, adjusted by the 14-period ATR, signaling potential trend shifts or consolidation.
A convergence is flagged when MA1 is the maximum, the spread between MAs is tight, and the price is above MA1, excluding cases where the longest MA (MA4) is the highest. The indicator alerts and visually marks convergence zones with a shaded green background, making it ideal for traders seeking precise entry or exit points.


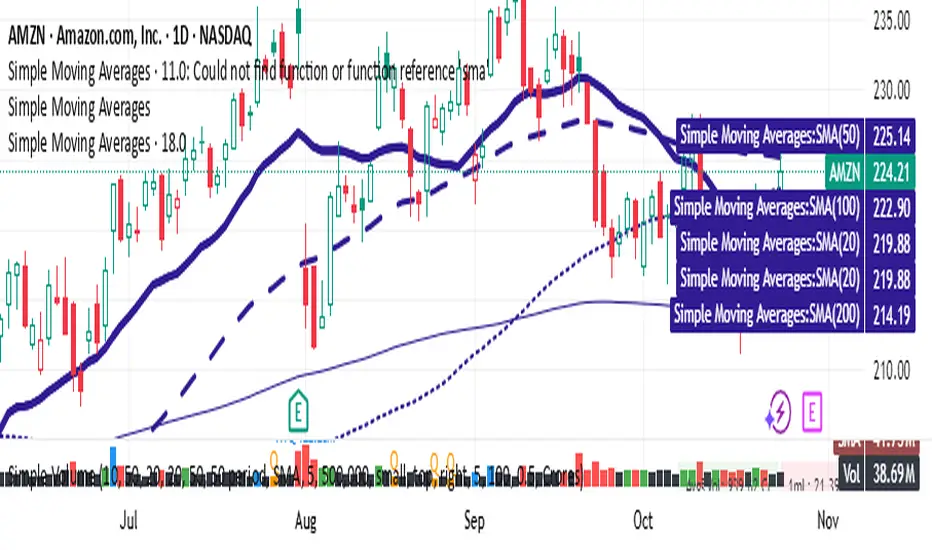
Simple Moving Averages (20, 50, 100)A clean and lightweight SMA indicator that plots 20, 50, and 100 simple moving averages with customizable colors and line widths. Includes an optional label showing the latest SMA values for quick reference. Ideal for trend confirmation and swing trading setups.

Moving Averages PowerMoving Averages Power — Trend + Normalized Strength
Lightweight indicator that plots up to 15 SMAs (5 → 4320) and shows a compact table with each MA’s:
Slope % (per-bar)
Trend (Bullish/Bearish/Neutral)
Normalized “Strength” bars comparable across MA lengths and, optionally, across timeframes via ATR%
Not financial advice. For research/education only.
What it does
Plots 15 SMA lines on the price chart
Colors match trend: Bullish (green), Bearish (red), Neutral (gray)
Bottom-right table: MA, Slope %, Trend, Strength bars
Strength normalization modes:
None: raw |slope%|
Length: scales by length relative to a reference length
ATR%: scales by volatility (ATR as % of price)
Length+ATR%: combines both for better cross-timeframe comparability
How it works (concepts)
Slope % per bar: 100 × (MA − MA ) / MA
Normalization:
None: S = |slope%|
Length: S = |slope%| × (length / normRefLen)
ATR%: S = |slope%| / ATR%, where ATR% = 100 × ATR(atrLen) / close
Length+ATR%: S = (|slope%| × (length / normRefLen)) / ATR%
Bars: floor(S / strengthStep), clamped to Max bars (default 10)
Notes:
normRefLen (default 240) keeps Length scaling stable across very short and very long MAs
In ATR modes, Strength shows blank until there’s enough history for ATR
How to use
Add the indicator to your chart (Indicators → search this title → Add).
Open Settings:
Show/hide any of the 15 SMAs
Choose Strength normalization mode
Tune Strength step, Max bars, Reference length, and ATR Length
Read the table:
MA: period
Slope %: per-bar percent change of the MA
Trend: green (bullish), red (bearish), gray (neutral)
Strength: more bars = stronger trend under the chosen normalization
Inputs (quick reference)
Display:
15 toggles: Show SMA 5 … Show SMA 4320
Strength Settings:
Strength normalization: None | Length | ATR% | Length+ATR%
Strength step (normalized units): sensitivity of bar count
Max bars: clamp for the bar count (default 10)
Normalization reference length: baseline for Length scaling (default 240)
ATR Length (for ATR%): ATR lookback used for ATR%
Text:
Label font size, Table font size
Line + label colors
Bullish (slope > 0): green
Bearish (slope < 0): red
Neutral (otherwise): gray
The MA lines, end-of-series labels, and table trend cell use the same colors
Recommended presets (examples)
Intraday (e.g., BTCUSD, 1h):
Strength normalization: Length+ATR%
normRefLen: 240
Strength step: 0.02–0.05
Max bars: 10
ATR Length: 14
Daily (e.g., AAPL, 1D):
Strength normalization: Length
normRefLen: 240–480
Strength step: 0.01–0.03
Max bars: 10
Calibration tips
Bars often at max (pegged)?
Increase Strength step (e.g., 0.01 → 0.03 → 0.05)
Or increase normRefLen (e.g., 240 → 480 → 720)
Bars too few?
Decrease Strength step (e.g., 0.02 → 0.01 → 0.005)
Or decrease normRefLen (e.g., 240 → 120)
Cross-timeframe comparability:
Prefer Length+ATR%; start with Strength step ≈ 0.02–0.05 and tune
Limitations
SMA only (no EMA/WMA/etc.)
Per-bar slope is inherently timeframe-sensitive; use ATR% or Length+ATR% for better cross-timeframe comparisons
ATR modes require atrLen bars; Strength shows blank until ready
The longest SMA (4320) needs sufficient chart history
Troubleshooting
Strength always looks maxed:
You might be on Length mode with a very small step; increase Strength step and/or use Length+ATR%; review normRefLen
Strength blank cells:
In ATR modes, wait for enough history (atrLen) or switch to Length mode
Table bounds:
The script manages rows internally; if you customize periods, ensure the total rows fit the 4×16 table
Compatibility
Pine Script v6
Works on most symbols/timeframes with adequate history
If you find this useful, consider leaving feedback with your preferred defaults (symbol/timeframe) so I can provide better presets.


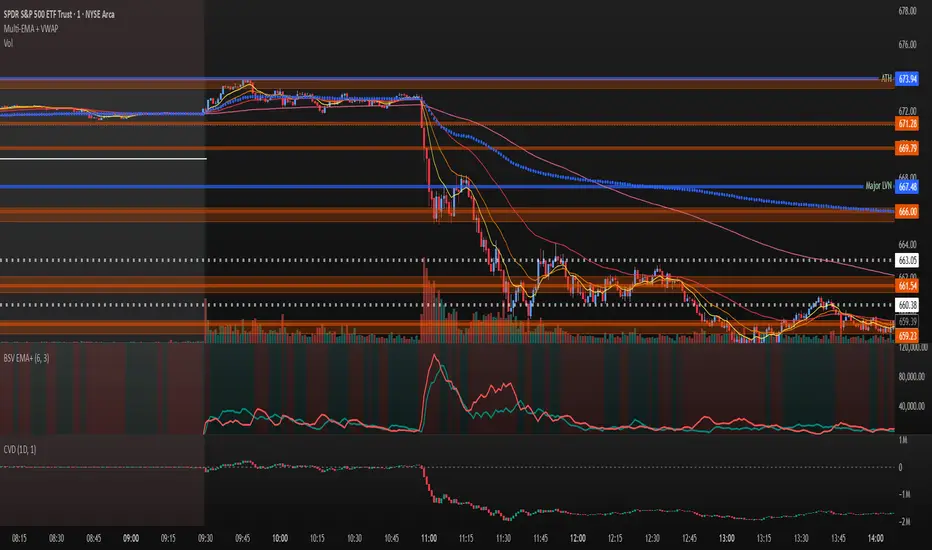
Volume Exponential Moving Averages (EMA)
Description:
This script is a simple script that plots a desired exponential moving average of buy and sell volume as a line chart with a tunable smoothing factor. There is a highlight on the plot area of either green or red to denote if the EMA of buy volume or sell volume is of a higher value. This indicator uses basic math of exponential averages and calculates volume using the formulas: "buy volume" = the product of total volume and the "closing price" minus the "low price" divided by "high price" minus the "low price" for a specific candle. Conversely, "sell volume" = the product of "total volume" and the "high price" minus the "close price" divided by "high price" minus the "low price" for a specific candle.
Utility:
This indicator is an effective way to gauge the acceleration/ deceleration of buyers and sellers in the market and can be used in combination with market structure and important levels to understand if buyers or sellers are taking over at any given time.
How to use this indicator:
There are two settings for this indicator:
1. The Length of the EMA: The length of the EMA can be adjusted based on your preference for a running number of candles' data. If you are interested to know short term changes in volume (e.g. over the past few candles at a major level) you can adjust this setting lower (~3-9 length). Conversely, if you are interested in volume trends over a greater number of candles you can increase this to your liking.
Personal preference : Because I am a short term daytrader/ scalper, I keep this setting at 6 length to see immediate changes in the acceleration or deceleration of buyers/ sellers.
2. The Smoothing Factor: The smoothing factor can be adjusted to further tune the size of trend you are interested in with 1 = No smoothing of the EMA line. Smoothing of the EMA line increases as the value for smoothing increases, resulting in a less volatile, more smooth EMA line. However, the more smooth the line, the less sensitive the EMA will be to immediate changes in volume pace. The less smoothing factor is applied, the more volatile data will be, resulting in quicker observation of shorter term trends. Again the same rules apply as the EMA length as these are similar in function: If you are interested to know short term changes in volume (e.g. over the past few candles at a major level) you can adjust this setting lower (~2-6). Conversely, if you are interested in volume trends over a greater number of candles you can increase this to your liking.
Personal preference : Because I am a short term daytrader/ scalper, I keep this setting at 2-4 smoothing factor to see immediate changes in the acceleration or deceleration of buyers/ sellers.
You should, of course, play with these settings to your exact preferences based on your trading style.
Tips for using this indicator:
General Use:
When the buy volume EMA is moving up, buyers are increasing the pace of buying and when the buy volume EMA is moving down, buyers are decreasing the pace of buying. Conversely, when the sell volume EMA is moving up, sellers are increasing the pace of selling and when the sell volume EMA is moving down, sellers are decreasing the pace of selling. The overall movement of the stock is relative to the combination of these rates. e.g. If both buyers and sellers are increasing at the same rate (EMAs slopes are roughly equal) there will be not a large change in price. If the slope of the buy volume EMA is greater than the slope of sell volume EMA, the price should move up. Conversely, if the slope of the sell volume EMA is greater than the slope of buy volume EMA, the price should move down.
Predicting pullbacks, reversals, and continuations:
This indicator allows you to see if buyers or sellers are increasing their pace, even if the stock price is in consolidation. This allows you to predict if out of the consolidation buyers or sellers are likely to win based on the momentum of the volume in consolidation. e.g. If price is in consolidation after an uptrend and the buy volume EMA starts to decrease, this could be a sign that buyers are running out of steam at this price level. Another example, If at a major support the buy volume EMA begins to trend up then buyers are accelerating the pace of buying at this level.
EMA crosses: There is something to be said about the point at which the buy volume EMA and sell volume EMA cross. This signifies that at this moment there is a shift in which the acceleration of one party outpaces that of the other and can result in increased speed of the movement of the stock price.
Considerations
Because volume changes constantly, this indicator is best to identify short term changes in volume that could impact price movements. It is not guaranteed to continue just because buyers or sellers have had a change in pace. Therefore it is advised to use this indicator in combination with significant price levels such as pivot points, or price levels from volume profile tools to identify the price zones where significant volume changes are likely to impact price movements. It is also advised to continue to monitor the changes in pace in buyers and sellers using this volume EMA indicator to determine if a change in pace is short lived or if it will continue for a longer duration.
Examples of use:
Bullish Reversal:
Bearish Continuation:
Bearish EMA Crossover: (Settings: Length 6, Smoothing factor 3)
Bullish EMA Crossover: (Settings: Length 6, Smoothing factor 4)