Scout Regiment - MACD# Scout Regiment - MACD Indicator
## English Documentation
### Overview
Scout Regiment - MACD is an advanced implementation of the Moving Average Convergence Divergence indicator with enhanced features including dual divergence detection (histogram and MACD line), customizable moving average types, multi-timeframe analysis, and sophisticated visual elements. This indicator provides traders with comprehensive momentum analysis and high-probability reversal signals.
### What is MACD?
MACD (Moving Average Convergence Divergence) is a trend-following momentum indicator that shows the relationship between two moving averages:
- **MACD Line**: Difference between fast and slow EMAs
- **Signal Line**: Moving average of the MACD line
- **Histogram**: Difference between MACD line and signal line
- **Purpose**: Identifies trend direction, momentum strength, and potential reversals
### Key Features
#### 1. **Enhanced MACD Display**
**Three Core Components:**
**MACD Line** (Default: Blue/Orange, 2px)
- Fast EMA (13) minus Slow EMA (34)
- Shows momentum direction
- Color changes based on position relative to signal line:
- Blue: Above signal line (bullish)
- Orange: Below signal line (bearish)
- Can be toggled on/off
**Signal Line** (Default: White/Blue with transparency, 2px)
- EMA (9) of the MACD line
- Serves as trigger line for crossover signals
- Color varies based on settings
- Essential for identifying entry/exit points
**Histogram** (Default: 4-color gradient, 4px columns)
- Difference between MACD and signal line
- Visual representation of momentum strength
- Advanced 4-color scheme:
- **Dark Green (#26A69A)**: Positive and increasing (strong bullish)
- **Light Green (#B2DFDB)**: Positive but decreasing (weakening bullish)
- **Dark Red (#FF5252)**: Negative and decreasing (strong bearish)
- **Light Red (#FFCDD2)**: Negative but increasing (weakening bearish)
- Histogram tells the "story" of momentum changes
#### 2. **Customizable Moving Average Types**
**Oscillator MA Type** (MACD Line calculation):
- **EMA** (Exponential) - Default, more responsive
- **SMA** (Simple) - Smoother, less responsive
**Signal Line MA Type**:
- **EMA** (Exponential) - Default, faster signals
- **SMA** (Simple) - Slower, fewer false signals
**Flexibility**: Mix and match for different trading styles
- EMA/EMA: Most responsive (day trading)
- SMA/SMA: Smoothest (swing trading)
- EMA/SMA or SMA/EMA: Balanced approaches
#### 3. **Multi-Timeframe Capability**
**Current Chart Period** (Default: Enabled)
- Uses current timeframe automatically
- Simplest option for most traders
**Custom Timeframe Selection**
- Calculate MACD on any timeframe
- Display higher timeframe MACD on lower timeframe charts
- Example: View 1H MACD on 15min chart
- **Use Case**: Align lower timeframe trades with higher timeframe momentum
#### 4. **Visual Enhancement Features**
**Golden Cross / Death Cross Markers**
- Circles mark crossover points
- Color matches MACD line color
- Clearly identifies entry/exit signals
- Can be toggled on/off
**Zero Line** (White, 2px solid)
- Reference for positive/negative momentum
- Critical level for trend identification
- MACD above zero = Bullish bias
- MACD below zero = Bearish bias
**Color Transitions**
- MACD line changes color at signal line crosses
- Histogram shows momentum acceleration/deceleration
- Provides early warning of trend changes
#### 5. **Dual Divergence Detection System**
This indicator features TWO separate divergence detection systems:
**A. Histogram Divergence Detection**
- **Purpose**: Earlier divergence signals (most sensitive)
- **Detects**: Regular bullish and bearish divergences
- **Label**: "H涨" (Histogram Up), "H跌" (Histogram Down)
- **Special Feature**: Same-sign requirement option
- Top divergence: Both histogram points must be positive
- Bottom divergence: Both histogram points must be negative
- Filters out less reliable divergences
**B. MACD Line Divergence Detection**
- **Purpose**: Stronger, more reliable divergences
- **Detects**: Regular bullish and bearish divergences
- **Label**: "M涨" (MACD Up), "M跌" (MACD Down)
- **Use**: Confirmation of histogram divergences or standalone
**Divergence Types Explained:**
**Regular Bullish Divergence (Yellow)**
- **Price**: Lower lows
- **Indicator**: Higher lows (histogram OR MACD line)
- **Signal**: Potential upward reversal
- **Best**: Near support levels, oversold conditions
- **Entry**: After price breaks above recent resistance
**Regular Bearish Divergence (Blue)**
- **Price**: Higher highs
- **Indicator**: Lower highs (histogram OR MACD line)
- **Signal**: Potential downward reversal
- **Best**: Near resistance levels, overbought conditions
- **Entry**: After price breaks below recent support
#### 6. **Advanced Divergence Parameters**
**Histogram Divergence Settings:**
- **Price Reference**: Wicks (default) or Bodies
- **Right Lookback**: Bars to right of pivot (default: 2)
- **Left Lookback**: Bars to left of pivot (default: 5)
- **Max Range**: Maximum bars between divergences (default: 60)
- **Min Range**: Minimum bars between divergences (default: 5)
- **Same Sign Requirement**: Ensures both histogram points have same sign
- **Show Regular Divergence**: Toggle display
- **Show Labels**: Toggle divergence labels
**MACD Line Divergence Settings:**
- **Price Reference**: Wicks (default) or Bodies
- **Right Lookback**: Bars to right of pivot (default: 1)
- **Left Lookback**: Bars to left of pivot (default: 5)
- **Max Range**: Maximum bars between divergences (default: 60)
- **Min Range**: Minimum bars between divergences (default: 5)
- **Show Regular Divergence**: Toggle display
- **Show Labels**: Toggle divergence labels
**Independent Control**: Adjust histogram and MACD line divergences separately
### Configuration Settings
#### MACD Basic Settings
- **Fast EMA Period**: Fast moving average length (default: 13)
- **Slow EMA Period**: Slow moving average length (default: 34)
- **Signal Line Period**: Signal line length (default: 9)
- **Use Current Chart Period**: Auto-adjust to current timeframe
- **Select Period**: Choose custom timeframe
- **Show MACD & Signal Lines**: Toggle lines display
- **Show Cross Markers**: Toggle golden/death cross dots
- **Show Histogram**: Toggle histogram display
- **Show Crossover Color Change**: Enable MACD line color change
- **Show Histogram Colors**: Enable 4-color histogram scheme
- **Oscillator MA Type**: Choose SMA or EMA for MACD
- **Signal Line MA Type**: Choose SMA or EMA for signal
#### Histogram Divergence Settings
- **Show Histogram Divergence**: Enable histogram divergence detection
- **Price Reference**: Wicks or Bodies for price comparison
- **Right/Left Lookback**: Pivot detection parameters
- **Max/Min Range**: Distance constraints between pivots
- **Show Regular Divergence**: Display histogram divergence lines
- **Show Labels**: Display histogram divergence labels
- **Require Same Sign**: Enforce histogram sign consistency
#### MACD Line Divergence Settings
- **Show MACD Line Divergence**: Enable MACD line divergence detection
- **Price Reference**: Wicks or Bodies for price comparison
- **Right/Left Lookback**: Pivot detection parameters
- **Max/Min Range**: Distance constraints between pivots
- **Show Regular Divergence**: Display MACD line divergence lines
- **Show Labels**: Display MACD line divergence labels
### How to Use
#### For Basic Trend Following
1. **Enable Core Components**
- MACD line, signal line, and histogram
- Enable cross markers
2. **Identify Trend**
- MACD above zero = Uptrend
- MACD below zero = Downtrend
3. **Watch for Crossovers**
- Golden cross (MACD crosses above signal) = Buy signal
- Death cross (MACD crosses below signal) = Sell signal
4. **Confirm with Histogram**
- Increasing histogram = Strengthening trend
- Decreasing histogram = Weakening trend
#### For Divergence Trading
1. **Enable Both Divergence Systems**
- Histogram divergence (early signals)
- MACD line divergence (confirmation)
2. **Wait for Divergence Signals**
- "H涨" or "H跌" = Early warning
- "M涨" or "M跌" = Confirmation
3. **Best Divergences**
- Both histogram AND MACD line showing divergence
- Divergence at key support/resistance levels
- Multiple divergences on same trend
4. **Entry Timing**
- Wait for price structure break
- Enter on pullback after confirmation
- Use MACD crossover as trigger
#### For Multi-Timeframe Analysis
1. **Set Higher Timeframe**
- Example: 4H MACD on 1H chart
- Uncheck "Use Current Chart Period"
- Select desired timeframe
2. **Identify Higher TF Trend**
- MACD position relative to zero
- MACD vs signal line relationship
3. **Trade with HTF Direction**
- Only take long signals if HTF MACD bullish
- Only take short signals if HTF MACD bearish
4. **Use Current TF for Entries**
- Higher TF for bias
- Current TF for precise timing
#### For Histogram Analysis
1. **Enable 4-Color Histogram**
- Watch color transitions
- Dark colors = Strong momentum
- Light colors = Weakening momentum
2. **Momentum Stages**
- Dark green → Light green = Bullish losing steam
- Light red → Dark red = Bearish gaining strength
3. **Trade Transitions**
- Light green to light red = Momentum shift (potential reversal)
- Entry on confirmation crossover
### Trading Strategies
#### Strategy 1: Classic MACD Crossover
**Setup:**
- Standard settings (13/34/9)
- Enable MACD, signal line, and cross markers
- Clear trend on higher timeframe
**Entry:**
- **Long**: Golden cross (circle marker) above zero line
- **Short**: Death cross (circle marker) below zero line
**Confirmation:**
- Histogram color supporting direction
- Volume increase helps
**Stop Loss:**
- Below recent swing low (long)
- Above recent swing high (short)
**Exit:**
- Opposite crossover
- MACD crosses zero line against position
**Best For:** Trend following, clear trending markets
#### Strategy 2: Zero Line Bounce
**Setup:**
- Enable all components
- Established trend (MACD staying one side of zero)
- Wait for pullback to zero line
**Entry:**
- **Long**: MACD touches zero from above, bounces up with golden cross
- **Short**: MACD touches zero from below, bounces down with death cross
**Confirmation:**
- Histogram color change
- Price at support/resistance
**Stop Loss:**
- Just beyond zero line (opposite side)
**Exit:**
- Target previous extreme
- Or opposite crossover
**Best For:** Trend continuation, strong markets
#### Strategy 3: Dual Divergence Confirmation
**Setup:**
- Enable both histogram and MACD line divergences
- Price at extreme (high/low)
- Wait for divergence signals
**Entry:**
- **Long**: Both "H涨" AND "M涨" labels appear
- **Short**: Both "H跌" AND "M跌" labels appear
**Confirmation:**
- Price breaks structure
- Volume increase
- Golden/death cross confirms
**Stop Loss:**
- Beyond divergence pivot point
**Exit:**
- MACD crosses zero line
- Or opposite divergence appears
**Best For:** Reversal trading, swing trading
#### Strategy 4: Histogram Color Transition
**Setup:**
- Enable 4-color histogram
- Focus on color changes
- Price in trend
**Entry:**
- **Long**: Light red → Light green transition + golden cross
- **Short**: Light green → Light red transition + death cross
**Rationale:**
- Light colors show momentum exhaustion
- Color flip = momentum shift
- Early entry before full trend reversal
**Stop Loss:**
- Recent swing point
**Exit:**
- Histogram color turns light against position
- Or at predetermined target
**Best For:** Scalping, day trading, early entries
#### Strategy 5: Multi-Timeframe Momentum
**Setup:**
- Display higher timeframe MACD (e.g., 4H on 1H chart)
- Current chart shows current momentum
- Higher TF shows overall bias
**Entry:**
- **Long**: HTF MACD above zero + current TF golden cross
- **Short**: HTF MACD below zero + current TF death cross
**Confirmation:**
- HTF histogram supporting direction
- Both timeframes aligned
**Stop Loss:**
- Based on current timeframe structure
**Exit:**
- Current TF opposite crossover
- Or HTF MACD momentum weakens
**Best For:** Swing trading, high-probability setups
#### Strategy 6: Histogram-Only Divergence Scout
**Setup:**
- Enable only histogram divergence
- Use "same sign requirement"
- Focus on early signals
**Entry:**
- **Long**: "H涨" label + price at support
- **Short**: "H跌" label + price at resistance
**Confirmation:**
- Wait for MACD/signal crossover
- Or price structure break
**Advantage:**
- Earliest divergence signals
- Get in before crowd
**Risk:**
- More false signals than MACD line divergence
- Requires strict confirmation
**Stop Loss:**
- Tight stop beyond entry bar
**Exit:**
- Quick targets (30-50% of expected move)
- Or trail stop
**Best For:** Active traders, scalpers seeking early entries
### Best Practices
#### MACD Period Selection
**Standard (13/34/9)** - Default
- Balanced for most markets
- Good for day trading and swing trading
- Widely used, works with general market psychology
**Faster (8/21/5 or 12/26/9)**
- More responsive
- More signals, more noise
- Best for: Scalping, volatile markets
- Risk: More false signals
**Slower (21/55/13)**
- Smoother signals
- Fewer but stronger signals
- Best for: Swing trading, position trading
- Benefit: Higher reliability
#### Histogram vs MACD Line Divergences
**Histogram Divergence:**
- ✅ Earlier signals
- ✅ Catch moves before others
- ❌ More false signals
- ❌ Requires confirmation
- **Best for**: Active traders, scalpers
**MACD Line Divergence:**
- ✅ More reliable
- ✅ Stronger divergences
- ❌ Later signals
- ❌ May miss early moves
- **Best for**: Swing traders, conservative traders
**Both Together:**
- ✅ Maximum confidence
- ✅ Histogram for alert, MACD for confirmation
- ✅ Highest probability setups
- **Best for**: All traders seeking quality over quantity
#### Same Sign Requirement Feature
**Enabled (Recommended):**
- Filters low-quality divergences
- Top divergence: Both histogram points positive
- Bottom divergence: Both histogram points negative
- Results in fewer but more reliable signals
**Disabled:**
- More divergence signals
- Includes zero-line crossing divergences
- Higher false signal rate
- Only for experienced traders
#### Price Reference: Wicks vs Bodies
**Wicks (Default):**
- Uses high/low prices
- Catches all extremes
- More divergences detected
- Best for: Most trading styles
**Bodies:**
- Uses open/close prices
- Filters out spike movements
- Fewer but cleaner divergences
- Best for: Noisy markets, crypto
#### Visual Settings Recommendations
**For Beginners:**
- Enable: MACD line, signal line, histogram
- Enable: Cross markers
- Enable: Histogram colors
- Disable: Both divergence systems initially
- Focus: Learn basic crossovers first
**For Intermediate:**
- All basic components
- Add: Histogram divergence only
- Use: Same sign requirement
- Focus: Early reversal signals
**For Advanced:**
- All components
- Both divergence systems
- Custom parameters per market
- Multi-timeframe analysis
- Focus: High-probability confluence setups
### Indicator Combinations
**With Moving Averages (EMAs):**
- EMAs (21/55/144) show trend
- MACD shows momentum
- Enter when both align
- Exit when MACD turns first
**With RSI:**
- RSI for overbought/oversold
- MACD for momentum confirmation
- Divergence on both = Extremely strong signal
- RSI + MACD divergence = High probability trade
**With Volume:**
- Volume confirms MACD signals
- Crossover + volume spike = Valid breakout
- Divergence + volume divergence = Strong reversal
**With Support/Resistance:**
- S/R levels for entry/exit targets
- MACD divergence at levels = Highest probability
- MACD crossover at level = Strong confirmation
**With Bias Indicator:**
- Bias shows price deviation from EMA
- MACD shows momentum
- Both diverging = Powerful reversal signal
- Bias extreme + MACD divergence = High conviction trade
**With OBV:**
- OBV shows volume trend
- MACD shows price momentum
- OBV + MACD divergence = Volume not supporting price
- Strong reversal indication
**With KSI (RSI/CCI):**
- KSI for oscillator extremes
- MACD for momentum direction
- KSI extreme + MACD divergence = Reversal likely
- All aligned = Maximum confidence
### Common MACD Patterns
1. **Bullish Cross Above Zero**: Strong uptrend continuation signal
2. **Bearish Cross Below Zero**: Strong downtrend continuation signal
3. **Zero Line Rejection**: Price respects zero as support/resistance
4. **Histogram Peak**: Momentum climax, watch for reversal
5. **Double Divergence**: Two divergences without reversal = Very strong signal when it finally reverses
6. **Histogram Convergence**: Histogram narrowing = Trend losing steam
7. **Signal Line Hug**: MACD stays close to signal = Consolidation, expect breakout
### Performance Tips
- Start with default settings (13/34/9 EMA/EMA)
- Test one divergence system at a time
- Use same sign requirement initially
- Enable cross markers for clear signals
- Adjust lookback parameters per market volatility
- Higher timeframe MACD more reliable than lower
- Combine histogram early signal with MACD line confirmation
- Don't trade every divergence - wait for best setups
### Alert Conditions
While not explicitly coded, you can set custom alerts on:
- MACD crossing above/below signal line
- MACD crossing above/below zero line
- Histogram crossing zero
- When divergence labels appear (using visual alerts)
---
## 中文说明文档
### 概述
Scout Regiment - MACD 是移动平均线收敛发散指标的高级实现版本,具有增强功能,包括双重背离检测(直方图和MACD线)、可自定义的移动平均类型、多时间框架分析和复杂的视觉元素。该指标为交易者提供全面的动量分析和高概率反转信号。
### 什么是MACD?
MACD(移动平均线收敛发散)是一个趋势跟随动量指标,显示两条移动平均线之间的关系:
- **MACD线**:快速和慢速EMA之间的差值
- **信号线**:MACD线的移动平均
- **直方图**:MACD线和信号线之间的差值
- **用途**:识别趋势方向、动量强度和潜在反转
### 核心功能
#### 1. **增强的MACD显示**
**三个核心组件:**
**MACD线**(默认:蓝色/橙色,2像素)
- 快速EMA(13)减去慢速EMA(34)
- 显示动量方向
- 根据相对于信号线的位置改变颜色:
- 蓝色:信号线上方(看涨)
- 橙色:信号线下方(看跌)
- 可开关显示
**信号线**(默认:白色/蓝色带透明度,2像素)
- MACD线的EMA(9)
- 作为交叉信号的触发线
- 颜色根据设置变化
- 识别进出场点的关键
**直方图**(默认:4色渐变,4像素柱)
- MACD和信号线之间的差值
- 动量强度的视觉表示
- 高级4色方案:
- **深绿色(#26A69A)**:正值且增加(强劲看涨)
- **浅绿色(#B2DFDB)**:正值但减少(看涨减弱)
- **深红色(#FF5252)**:负值且减少(强劲看跌)
- **浅红色(#FFCDD2)**:负值但增加(看跌减弱)
- 直方图讲述动量变化的"故事"
#### 2. **可自定义的移动平均类型**
**振荡器MA类型**(MACD线计算):
- **EMA**(指数)- 默认,反应更快
- **SMA**(简单)- 更平滑,反应较慢
**信号线MA类型**:
- **EMA**(指数)- 默认,更快信号
- **SMA**(简单)- 更慢,假信号更少
**灵活性**:混合搭配以适应不同交易风格
- EMA/EMA:最灵敏(日内交易)
- SMA/SMA:最平滑(波段交易)
- EMA/SMA或SMA/EMA:平衡方法
#### 3. **多时间框架功能**
**当前图表周期**(默认:启用)
- 自动使用当前时间框架
- 大多数交易者的最简单选项
**自定义时间框架选择**
- 在任何时间框架上计算MACD
- 在低时间框架图表上显示高时间框架MACD
- 示例:在15分钟图上查看1小时MACD
- **使用场景**:使低时间框架交易与高时间框架动量保持一致
#### 4. **视觉增强功能**
**金叉/死叉标记**
- 圆点标记交叉点
- 颜色与MACD线颜色匹配
- 清晰识别进出场信号
- 可开关
**零线**(白色,2像素实线)
- 正负动量的参考
- 趋势识别的关键水平
- MACD在零线上方 = 看涨偏向
- MACD在零线下方 = 看跌偏向
**颜色转换**
- MACD线在信号线交叉处改变颜色
- 直方图显示动量加速/减速
- 提供趋势变化的早期警告
#### 5. **双重背离检测系统**
该指标具有两个独立的背离检测系统:
**A. 直方图背离检测**
- **用途**:更早的背离信号(最敏感)
- **检测**:常规看涨和看跌背离
- **标签**:"H涨"(直方图上涨)、"H跌"(直方图下跌)
- **特殊功能**:同符号要求选项
- 顶背离:两个直方图点都必须为正
- 底背离:两个直方图点都必须为负
- 过滤不太可靠的背离
**B. MACD线背离检测**
- **用途**:更强、更可靠的背离
- **检测**:常规看涨和看跌背离
- **标签**:"M涨"(MACD上涨)、"M跌"(MACD下跌)
- **用途**:确认直方图背离或独立使用
**背离类型说明:**
**常规看涨背离(黄色)**
- **价格**:更低的低点
- **指标**:更高的低点(直方图或MACD线)
- **信号**:潜在向上反转
- **最佳**:在支撑水平附近、超卖状况
- **入场**:价格突破近期阻力后
**常规看跌背离(蓝色)**
- **价格**:更高的高点
- **指标**:更低的高点(直方图或MACD线)
- **信号**:潜在向下反转
- **最佳**:在阻力水平附近、超买状况
- **入场**:价格跌破近期支撑后
#### 6. **高级背离参数**
**直方图背离设置:**
- **价格参考**:影线(默认)或实体
- **右侧回溯**:枢轴点右侧K线数(默认:2)
- **左侧回溯**:枢轴点左侧K线数(默认:5)
- **最大范围**:背离之间最大K线数(默认:60)
- **最小范围**:背离之间最小K线数(默认:5)
- **同符号要求**:确保两个直方图点符号相同
- **显示常规背离**:切换显示
- **显示标签**:切换背离标签
**MACD线背离设置:**
- **价格参考**:影线(默认)或实体
- **右侧回溯**:枢轴点右侧K线数(默认:1)
- **左侧回溯**:枢轴点左侧K线数(默认:5)
- **最大范围**:背离之间最大K线数(默认:60)
- **最小范围**:背离之间最小K线数(默认:5)
- **显示常规背离**:切换显示
- **显示标签**:切换背离标签
**独立控制**:分别调整直方图和MACD线背离
### 配置设置
#### MACD基础设置
- **快速EMA周期**:快速移动平均长度(默认:13)
- **慢速EMA周期**:慢速移动平均长度(默认:34)
- **信号线周期**:信号线长度(默认:9)
- **使用当前图表周期**:自动调整到当前时间框架
- **选择周期**:选择自定义时间框架
- **显示MACD线和信号线**:切换线条显示
- **显示金叉死叉圆点标记**:切换金叉/死叉圆点
- **显示直方图**:切换直方图显示
- **显示穿越变化MACD线**:启用MACD线颜色变化
- **显示直方图颜色**:启用4色直方图方案
- **振荡器MA类型**:为MACD选择SMA或EMA
- **信号线MA类型**:为信号线选择SMA或EMA
#### 直方图背离设置
- **显示直方图背离信号**:启用直方图背离检测
- **价格参考**:影线或实体用于价格比较
- **右侧/左侧回溯**:枢轴检测参数
- **最大/最小范围**:枢轴之间的距离约束
- **显示直方图常规背离**:显示直方图背离线
- **显示直方图常规背离标签**:显示直方图背离标签
- **要求背离点柱状图同符号**:强制直方图符号一致性
#### MACD线背离设置
- **显示MACD线背离信号**:启用MACD线背离检测
- **价格参考**:影线或实体用于价格比较
- **右侧/左侧回溯**:枢轴检测参数
- **最大/最小范围**:枢轴之间的距离约束
- **显示线常规背离**:显示MACD线背离线
- **显示线常规背离标签**:显示MACD线背离标签
### 使用方法
#### 基础趋势跟随
1. **启用核心组件**
- MACD线、信号线和直方图
- 启用交叉标记
2. **识别趋势**
- MACD在零线上方 = 上升趋势
- MACD在零线下方 = 下降趋势
3. **观察交叉**
- 金叉(MACD向上穿越信号线)= 买入信号
- 死叉(MACD向下穿越信号线)= 卖出信号
4. **用直方图确认**
- 直方图增加 = 趋势加强
- 直方图减少 = 趋势减弱
#### 背离交易
1. **启用两个背离系统**
- 直方图背离(早期信号)
- MACD线背离(确认)
2. **等待背离信号**
- "H涨"或"H跌" = 早期警告
- "M涨"或"M跌" = 确认
3. **最佳背离**
- 直方图和MACD线都显示背离
- 在关键支撑/阻力水平的背离
- 同一趋势上多个背离
4. **入场时机**
- 等待价格结构突破
- 确认后回调时进入
- 使用MACD交叉作为触发
#### 多时间框架分析
1. **设置更高时间框架**
- 示例:在1小时图上显示4小时MACD
- 取消勾选"使用当前图表周期"
- 选择所需时间框架
2. **识别更高TF趋势**
- MACD相对于零线的位置
- MACD与信号线的关系
3. **顺HTF方向交易**
- 仅在HTF MACD看涨时接受多头信号
- 仅在HTF MACD看跌时接受空头信号
4. **使用当前TF入场**
- 更高TF确定偏向
- 当前TF精确定时
#### 直方图分析
1. **启用4色直方图**
- 观察颜色转换
- 深色 = 强动量
- 浅色 = 动量减弱
2. **动量阶段**
- 深绿色→浅绿色 = 看涨失去动力
- 浅红色→深红色 = 看跌获得力量
3. **交易转换**
- 浅绿色到浅红色 = 动量转变(潜在反转)
- 确认交叉时入场
### 交易策略
#### 策略1:经典MACD交叉
**设置:**
- 标准设置(13/34/9)
- 启用MACD、信号线和交叉标记
- 更高时间框架明确趋势
**入场:**
- **多头**:零线上方金叉(圆点标记)
- **空头**:零线下方死叉(圆点标记)
**确认:**
- 直方图颜色支持方向
- 成交量增加有帮助
**止损:**
- 近期波动低点之下(多头)
- 近期波动高点之上(空头)
**离场:**
- 相反交叉
- MACD反向穿越零线
**适合:**趋势跟随、明确趋势市场
#### 策略2:零线反弹
**设置:**
- 启用所有组件
- 已建立趋势(MACD保持在零线一侧)
- 等待回调至零线
**入场:**
- **多头**:MACD从上方触及零线,向上反弹并金叉
- **空头**:MACD从下方触及零线,向下反弹并死叉
**确认:**
- 直方图颜色变化
- 价格在支撑/阻力位
**止损:**
- 零线对面一侧
**离场:**
- 目标前一极值
- 或相反交叉
**适合:**趋势延续、强势市场
#### 策略3:双重背离确认
**设置:**
- 启用直方图和MACD线背离
- 价格在极值(高点/低点)
- 等待背离信号
**入场:**
- **多头**:"H涨"和"M涨"标签都出现
- **空头**:"H跌"和"M跌"标签都出现
**确认:**
- 价格突破结构
- 成交量增加
- 金叉/死叉确认
**止损:**
- 背离枢轴点之外
**离场:**
- MACD穿越零线
- 或出现相反背离
**适合:**反转交易、波段交易
#### 策略4:直方图颜色转换
**设置:**
- 启用4色直方图
- 关注颜色变化
- 价格处于趋势
**入场:**
- **多头**:浅红色→浅绿色转换 + 金叉
- **空头**:浅绿色→浅红色转换 + 死叉
**原理:**
- 浅色显示动量衰竭
- 颜色翻转 = 动量转变
- 完全趋势反转前的早期入场
**止损:**
- 近期波动点
**离场:**
- 直方图颜色变为反向浅色
- 或预定目标
**适合:**剥头皮、日内交易、早期入场
#### 策略5:多时间框架动量
**设置:**
- 显示更高时间框架MACD(例如,在1小时图上显示4小时)
- 当前图表显示当前动量
- 更高TF显示整体偏向
**入场:**
- **多头**:HTF MACD在零线上方 + 当前TF金叉
- **空头**:HTF MACD在零线下方 + 当前TF死叉
**确认:**
- HTF直方图支持方向
- 两个时间框架对齐
**止损:**
- 基于当前时间框架结构
**离场:**
- 当前TF相反交叉
- 或HTF MACD动量减弱
**适合:**波段交易、高概率设置
#### 策略6:仅直方图背离侦察
**设置:**
- 仅启用直方图背离
- 使用"同符号要求"
- 关注早期信号
**入场:**
- **多头**:"H涨"标签 + 价格在支撑位
- **空头**:"H跌"标签 + 价格在阻力位
**确认:**
- 等待MACD/信号线交叉
- 或价格结构突破
**优势:**
- 最早的背离信号
- 在大众之前进入
**风险:**
- 比MACD线背离假信号更多
- 需要严格确认
**止损:**
- 入场K线之外紧密止损
**离场:**
- 快速目标(预期波动的30-50%)
- 或移动止损
**适合:**活跃交易者、寻求早期入场的剥头皮交易者
### 最佳实践
#### MACD周期选择
**标准(13/34/9)** - 默认
- 大多数市场的平衡
- 适合日内交易和波段交易
- 广泛使用,符合一般市场心理
**更快(8/21/5或12/26/9)**
- 更灵敏
- 更多信号,更多噪音
- 最适合:剥头皮、波动市场
- 风险:更多假信号
**更慢(21/55/13)**
- 更平滑的信号
- 信号较少但更强
- 最适合:波段交易、仓位交易
- 优势:更高可靠性
#### 直方图vs MACD线背离
**直方图背离:**
- ✅ 更早信号
- ✅ 在其他人之前捕捉波动
- ❌ 更多假信号
- ❌ 需要确认
- **最适合**:活跃交易者、剥头皮交易者
**MACD线背离:**
- ✅ 更可靠
- ✅ 更强的背离
- ❌ 信号较晚
- ❌ 可能错过早期波动
- **最适合**:波段交易者、保守交易者
**两者结合:**
- ✅ 最大信心
- ✅ 直方图警报,MACD确认
- ✅ 最高概率设置
- **最适合**:所有寻求质量而非数量的交易者
#### 同符号要求功能
**启用(推荐):**
- 过滤低质量背离
- 顶背离:两个直方图点都为正
- 底背离:两个直方图点都为负
- 产生更少但更可靠的信号
**禁用:**
- 更多背离信号
- 包括零线穿越背离
- 假信号率更高
- 仅适合有经验的交易者
#### 价格参考:影线vs实体
**影线(默认):**
- 使用最高/最低价
- 捕捉所有极值
- 检测到更多背离
- 最适合:大多数交易风格
**实体:**
- 使用开盘/收盘价
- 过滤突刺波动
- 背离更少但更干净
- 最适合:噪音市场、加密货币
#### 视觉设置建议
**新手:**
- 启用:MACD线、信号线、直方图
- 启用:交叉标记
- 启用:直方图颜色
- 禁用:初始禁用两个背离系统
- 重点:先学习基本交叉
**中级:**
- 所有基本组件
- 添加:仅直方图背离
- 使用:同符号要求
- 重点:早期反转信号
**高级:**
- 所有组件
- 两个背离系统
- 每个市场自定义参数
- 多时间框架分析
- 重点:高概率汇合设置
### 指标组合
**与移动平均线(EMA)配合:**
- EMA(21/55/144)显示趋势
- MACD显示动量
- 两者一致时进入
- MACD先转向时退出
**与RSI配合:**
- RSI用于超买超卖
- MACD用于动量确认
- 两者都背离 = 极强信号
- RSI + MACD背离 = 高概率交易
**与成交量配合:**
- 成交量确认MACD信号
- 交叉 + 成交量激增 = 有效突破
- 背离 + 成交量背离 = 强反转
**与支撑/阻力配合:**
- 支撑阻力水平用于进出目标
- 水平处的MACD背离 = 最高概率
- 水平处的MACD交叉 = 强确认
**与Bias指标配合:**
- Bias显示价格相对EMA的偏离
- MACD显示动量
- 两者都背离 = 强大反转信号
- Bias极值 + MACD背离 = 高信念交易
**与OBV配合:**
- OBV显示成交量趋势
- MACD显示价格动量
- OBV + MACD背离 = 成交量不支持价格
- 强反转迹象
**与KSI(RSI/CCI)配合:**
- KSI用于振荡器极值
- MACD用于动量方向
- KSI极值 + MACD背离 = 可能反转
- 全部对齐 = 最大信心
### 常见MACD形态
1. **零线上方看涨交叉**:强上升趋势延续信号
2. **零线下方看跌交叉**:强下降趋势延续信号
3. **零线拒绝**:价格将零线作为支撑/阻力
4. **直方图峰值**:动量高潮,注意反转
5. **双重背离**:两次背离未反转 = 最终反转时非常强
6. **直方图收敛**:直方图变窄 = 趋势失去动力
7. **信号线紧贴**:MACD紧贴信号线 = 盘整,预期突破
### 性能提示
- 从默认设置开始(13/34/9 EMA/EMA)
- 一次测试一个背离系统
- 初始使用同符号要求
- 启用交叉标记以获得清晰信号
- 根据市场波动性调整回溯参数
- 更高时间框架MACD比更低的更可靠
- 结合直方图早期信号与MACD线确认
- 不要交易每个背离 - 等待最佳设置
### 警报条件
虽然没有明确编码,但您可以设置自定义警报:
- MACD向上/向下穿越信号线
- MACD向上/向下穿越零线
- 直方图穿越零线
- 背离标签出现时(使用视觉警报)
---
## Technical Support
For questions or issues, please refer to the TradingView community or contact the indicator creator.
## 技术支持
如有问题,请参考TradingView社区或联系指标创建者。
Cerca negli script per "averages"

Scout Regiment - Bias# Scout Regiment - Bias Indicator
## English Documentation
### Overview
Scout Regiment - Bias is a technical indicator that measures the deviation (bias) between the current price and exponential moving averages (EMAs). It helps traders identify overbought/oversold conditions, trend strength, and potential reversal points through divergence detection.
### What is Bias?
Bias measures how far the price has moved away from a moving average, expressed as a percentage:
- **Positive Bias**: Price is above the EMA (potential overbought)
- **Negative Bias**: Price is below the EMA (potential oversold)
- **Formula**: Bias = (Price - EMA) / EMA × 100
### Key Features
#### 1. **Triple EMA Bias Lines**
The indicator calculates bias from three different EMAs:
- **EMA 55 Bias** (Default: Green/Red, 1px line)
- Short-term bias measurement
- Quick response to price changes
- Best for intraday and swing trading
- **EMA 144 Bias** (Pink, 2px line)
- Medium-term bias measurement
- Balanced response to price movements
- Ideal for swing trading
- **EMA 233 Bias** (White, 2px line)
- Long-term bias measurement
- Slower response, more stable
- Best for position trading
**Color Coding:**
- Green: Price above EMA (bullish)
- Red: Price below EMA (bearish)
#### 2. **Visual Components**
**Histogram Display**
- Shows EMA 55 bias as a histogram for easy visualization
- Green bars: Price above EMA 55
- Red bars: Price below EMA 55
- Can be toggled on/off
**Background Color**
- Light green background: Bullish bias (price above EMA 55)
- Light red background: Bearish bias (price below EMA 55)
- Optional display for cleaner charts
**Zero Line**
- White horizontal line at 0%
- Reference point for positive/negative bias
- Crossovers indicate trend changes
**Crossover Labels**
- "突破" (Breakout): When bias crosses above zero
- "跌破" (Breakdown): When bias crosses below zero
- Can be enabled/disabled for clarity
#### 3. **Divergence Detection**
The indicator automatically detects regular divergences for all three bias lines:
**Bullish Divergence (Yellow Labels)**
- Price makes lower lows
- Bias makes higher lows
- Suggests potential upward reversal
- Labels: "55涨", "144涨", "233涨"
**Bearish Divergence (Blue Labels)**
- Price makes higher highs
- Bias makes lower highs
- Suggests potential downward reversal
- Labels: "55跌", "144跌", "233跌"
**Divergence Parameters** (Customizable for each EMA):
- Left Lookback: Bars to the left of pivot (default: 5)
- Right Lookback: Bars to the right of pivot (default: 1)
- Max Lookback Range: Maximum distance between pivots (default: 60)
- Min Lookback Range: Minimum distance between pivots (default: 5)
### Configuration Settings
#### Bias Settings
- **EMA Periods**: Customize lengths for EMA 55, 144, and 233
- **Price Source**: Choose calculation source (default: close)
- **Enable/Disable**: Toggle each bias line independently
#### Display Settings
- **Show Histogram**: Toggle histogram display
- **Show Background Color**: Toggle background coloring
- **Show Crossover Labels**: Toggle breakout/breakdown labels
#### Divergence Settings (Per EMA)
- Individual controls for EMA 55, 144, and 233 divergences
- Customizable lookback parameters for precision tuning
- Adjustable range settings for different market conditions
### How to Use
#### For Trend Trading
1. **Identify Trend Direction**
- Price above zero = Uptrend
- Price below zero = Downtrend
2. **Confirm with Multiple Timeframes**
- EMA 55: Short-term trend
- EMA 144: Medium-term trend
- EMA 233: Long-term trend
3. **Trade in Direction of Bias**
- All three lines positive = Strong uptrend
- All three lines negative = Strong downtrend
#### For Mean Reversion Trading
1. **Identify Extremes**
- High positive bias (>5-10%) = Overbought
- High negative bias (<-5 to -10%) = Oversold
2. **Wait for Confirmation**
- Look for bias to turn back toward zero
- Watch for crossover labels
3. **Enter on Reversal**
- Enter long when extreme negative bias starts rising
- Enter short when extreme positive bias starts falling
#### For Divergence Trading
1. **Spot Divergence Labels**
- Yellow labels = Bullish divergence (potential buy)
- Blue labels = Bearish divergence (potential sell)
2. **Confirm with Price Action**
- Wait for price to confirm with structure break
- Look for support/resistance reactions
3. **Use Multiple EMAs**
- EMA 55 divergence: Quick reversals
- EMA 144 divergence: Reliable signals
- EMA 233 divergence: Major trend changes
#### For Multi-Timeframe Analysis
1. **Check Long-term Bias** (EMA 233)
- Determines overall market direction
2. **Find Medium-term Entry** (EMA 144)
- Look for pullbacks in long-term trend
3. **Time Short-term Entry** (EMA 55)
- Enter when short-term aligns with longer timeframes
### Trading Strategies
#### Strategy 1: Triple Confirmation
- Wait for all three bias lines to be positive (or negative)
- Enter in direction of unanimous bias
- Exit when any line crosses zero
- Best for: Strong trending markets
#### Strategy 2: Divergence Trading
- Enable all divergence detection
- Take trades only when divergence appears
- Confirm with price structure
- Best for: Range-bound and reversal setups
#### Strategy 3: Zero Line Crossover
- Enable crossover labels
- Enter long on "突破" labels
- Enter short on "跌破" labels
- Use stop loss at recent swing points
- Best for: Trend following
#### Strategy 4: Extreme Reversion
- Wait for bias to reach extremes (>10% or <-10%)
- Enter counter-trend when bias reverses
- Exit at zero line
- Best for: Ranging markets
### Best Practices
1. **Combine with Price Action**
- Don't trade bias alone
- Confirm with support/resistance
- Look for candlestick patterns
2. **Use Multiple Timeframes**
- Check higher timeframe bias
- Trade in direction of larger trend
- Use lower timeframe for entry timing
3. **Manage Risk**
- Set stop losses beyond recent swings
- Don't fight extreme bias in strong trends
- Reduce position size at extremes
4. **Customize for Your Market**
- Volatile assets: Use wider ranges
- Stable assets: Use tighter ranges
- Adjust EMA periods for your timeframe
5. **Watch for False Signals**
- Multiple small divergences = Less reliable
- Divergences at extremes = More reliable
- Confirm with other indicators
### Indicator Combinations
**With Volume:**
- High bias + Low volume = Weak move
- High bias + High volume = Strong move
**With Moving Averages:**
- Check if price is above/below key EMAs
- Bias confirms EMA trend strength
**With RSI/MACD:**
- Multiple indicator divergence = Stronger signal
- Use bias for overbought/oversold confirmation
### Performance Tips
- Disable unused features for faster loading
- Use histogram for quick visual reference
- Enable background color for trend clarity
- Use divergence detection selectively
### Common Patterns
1. **Bias Expansion**: Bias increasing = Strong trend
2. **Bias Contraction**: Bias decreasing = Trend weakening
3. **Zero Line Bounce**: Price respects EMA as support/resistance
4. **Extreme Bias**: Over-extension, watch for reversal
5. **Divergence Cluster**: Multiple EMAs diverging = High probability reversal
### Alert Conditions
You can set alerts for:
- Bias crossing above/below zero
- Extreme bias levels
- Divergence detection
- All three bias lines aligned
---
## 中文说明文档
### 概述
Scout Regiment - Bias 是一个技术指标,用于测量当前价格与指数移动平均线(EMA)之间的偏离程度(乖离率)。它帮助交易者识别超买超卖状况、趋势强度,以及通过背离检测发现潜在的反转点。
### 什么是乖离率?
乖离率衡量价格偏离移动平均线的程度,以百分比表示:
- **正乖离**:价格高于EMA(可能超买)
- **负乖离**:价格低于EMA(可能超卖)
- **计算公式**:乖离率 = (价格 - EMA) / EMA × 100
### 核心功能
#### 1. **三重EMA乖离率线**
指标计算三条不同EMA的乖离率:
- **EMA 55 乖离率**(默认:绿色/红色,1像素线)
- 短期乖离测量
- 对价格变化反应快速
- 适合日内和波段交易
- **EMA 144 乖离率**(粉色,2像素线)
- 中期乖离测量
- 对价格波动反应平衡
- 最适合波段交易
- **EMA 233 乖离率**(白色,2像素线)
- 长期乖离测量
- 反应较慢,更稳定
- 适合仓位交易
**颜色编码:**
- 绿色:价格高于EMA(看涨)
- 红色:价格低于EMA(看跌)
#### 2. **视觉组件**
**柱状图显示**
- 以柱状图形式显示EMA 55乖离率,便于可视化
- 绿色柱:价格高于EMA 55
- 红色柱:价格低于EMA 55
- 可开关显示
**背景颜色**
- 浅绿色背景:看涨乖离(价格高于EMA 55)
- 浅红色背景:看跌乖离(价格低于EMA 55)
- 可选显示,图表更清爽
**零轴**
- 零点位置的白色横线
- 正负乖离的参考点
- 穿越表示趋势变化
**穿越标签**
- "突破":乖离率向上穿越零轴
- "跌破":乖离率向下穿越零轴
- 可启用/禁用以保持清晰
#### 3. **背离检测**
指标自动检测所有三条乖离率线的常规背离:
**看涨背离(黄色标签)**
- 价格创新低
- 乖离率创更高的低点
- 暗示潜在向上反转
- 标签:"55涨"、"144涨"、"233涨"
**看跌背离(蓝色标签)**
- 价格创新高
- 乖离率创更低的高点
- 暗示潜在向下反转
- 标签:"55跌"、"144跌"、"233跌"
**背离参数**(每个EMA可自定义):
- 左侧回溯:枢轴点左侧K线数(默认:5)
- 右侧回溯:枢轴点右侧K线数(默认:1)
- 最大回溯范围:枢轴点之间最大距离(默认:60)
- 最小回溯范围:枢轴点之间最小距离(默认:5)
### 配置设置
#### Bias设置
- **EMA周期**:自定义EMA 55、144和233的长度
- **价格源**:选择计算源(默认:收盘价)
- **启用/禁用**:独立切换每条乖离率线
#### 显示设置
- **显示柱状图**:切换柱状图显示
- **显示背景颜色**:切换背景着色
- **显示突破标签**:切换突破/跌破标签
#### 背离设置(按EMA)
- EMA 55、144和233背离的独立控制
- 可自定义回溯参数用于精确调整
- 可调整范围设置以适应不同市场状况
### 使用方法
#### 趋势交易
1. **识别趋势方向**
- 价格高于零 = 上升趋势
- 价格低于零 = 下降趋势
2. **多时间框架确认**
- EMA 55:短期趋势
- EMA 144:中期趋势
- EMA 233:长期趋势
3. **顺乖离方向交易**
- 三条线全部为正 = 强劲上升趋势
- 三条线全部为负 = 强劲下降趋势
#### 均值回归交易
1. **识别极值**
- 高正乖离(>5-10%)= 超买
- 高负乖离(<-5至-10%)= 超卖
2. **等待确认**
- 等待乖离率回归零轴
- 观察穿越标签
3. **在反转时进场**
- 极端负乖离开始上升时做多
- 极端正乖离开始下降时做空
#### 背离交易
1. **发现背离标签**
- 黄色标签 = 看涨背离(潜在买入)
- 蓝色标签 = 看跌背离(潜在卖出)
2. **用价格行为确认**
- 等待价格通过结构突破确认
- 观察支撑/阻力反应
3. **使用多个EMA**
- EMA 55背离:快速反转
- EMA 144背离:可靠信号
- EMA 233背离:重大趋势变化
#### 多时间框架分析
1. **检查长期乖离**(EMA 233)
- 确定整体市场方向
2. **寻找中期入场**(EMA 144)
- 在长期趋势中寻找回调
3. **把握短期入场时机**(EMA 55)
- 短期与长期时间框架一致时进场
### 交易策略
#### 策略1:三重确认
- 等待三条乖离率线全部为正(或负)
- 顺一致乖离方向入场
- 任一线穿越零轴时离场
- 适合:强趋势市场
#### 策略2:背离交易
- 启用所有背离检测
- 仅在出现背离时交易
- 用价格结构确认
- 适合:震荡和反转设置
#### 策略3:零轴穿越
- 启用穿越标签
- 在"突破"标签时做多
- 在"跌破"标签时做空
- 在近期波动点设置止损
- 适合:趋势跟随
#### 策略4:极值回归
- 等待乖离率达到极值(>10%或<-10%)
- 乖离率反转时逆趋势入场
- 在零轴离场
- 适合:震荡市场
### 最佳实践
1. **结合价格行为**
- 不要单独使用乖离率交易
- 用支撑/阻力确认
- 寻找K线形态
2. **使用多时间框架**
- 检查更高时间框架的乖离
- 顺大趋势方向交易
- 用低时间框架把握入场时机
3. **风险管理**
- 在近期波动之外设置止损
- 不要在强趋势中对抗极端乖离
- 在极值处减少仓位
4. **针对您的市场定制**
- 波动大的资产:使用更宽的范围
- 稳定的资产:使用更紧的范围
- 根据时间框架调整EMA周期
5. **警惕假信号**
- 多个小背离 = 可靠性较低
- 极值处的背离 = 更可靠
- 用其他指标确认
### 指标组合
**与成交量配合:**
- 高乖离 + 低成交量 = 弱势波动
- 高乖离 + 高成交量 = 强势波动
**与移动平均线配合:**
- 检查价格是否在关键EMA上方/下方
- 乖离率确认EMA趋势强度
**与RSI/MACD配合:**
- 多指标背离 = 更强信号
- 使用乖离率确认超买超卖
### 性能提示
- 禁用未使用的功能以加快加载
- 使用柱状图快速视觉参考
- 启用背景颜色以清晰显示趋势
- 有选择地使用背离检测
### 常见形态
1. **乖离扩张**:乖离率增大 = 强趋势
2. **乖离收缩**:乖离率减小 = 趋势减弱
3. **零轴反弹**:价格将EMA作为支撑/阻力
4. **极端乖离**:过度延伸,注意反转
5. **背离集群**:多个EMA背离 = 高概率反转
### 警报条件
您可以为以下情况设置警报:
- 乖离率向上/向下穿越零轴
- 极端乖离水平
- 背离检测
- 三条乖离率线对齐
---
## Technical Support
For questions or issues, please refer to the TradingView community or contact the indicator creator.
## 技术支持
如有问题,请参考TradingView社区或联系指标创建者。

Hellenic EMA Matrix - PremiumHellenic EMA Matrix - Alpha Omega Premium
Complete User Guide
Table of Contents
Introduction
Indicator Philosophy
Mathematical Constants
EMA Types
Settings
Trading Signals
Visualization
Usage Strategies
FAQ
Introduction
Hellenic EMA Matrix is a premium indicator based on mathematical constants of nature: Phi (Phi - Golden Ratio), Pi (Pi), e (Euler's number). The indicator uses these universal constants to create dynamic EMAs that adapt to the natural rhythms of the market.
Key Features:
6 EMA types based on mathematical constants
Premium visualization with Neon Glow and Gradient Clouds
Automatic Fast/Mid/Slow EMA sorting
STRONG signals for powerful trends
Pulsing Ribbon Bar for instant trend assessment
Works on all timeframes (M1 - MN)
Indicator Philosophy
Why Mathematical Constants?
Traditional EMAs use arbitrary periods (9, 21, 50, 200). Hellenic Matrix goes further, using universal mathematical constants found in nature:
Phi (1.618) - Golden Ratio: galaxy spirals, seashells, human body proportions
Pi (3.14159) - Pi: circles, waves, cycles
e (2.71828) - Natural logarithm base: exponential growth, radioactive decay
Markets are also a natural system composed of millions of participants. Using mathematical constants allows tuning into the natural rhythms of market cycles.
Mathematical Constants
Phi (Phi) - Golden Ratio
Phi = 1.618033988749895
Properties:
Phi² = Phi + 1 = 2.618
Phi³ = 4.236
Phi⁴ = 6.854
Application: Ideal for trending movements and Fibonacci corrections
Pi (Pi) - Pi Number
Pi = 3.141592653589793
Properties:
2Pi = 6.283 (full circle)
3Pi = 9.425
4Pi = 12.566
Application: Excellent for cyclical markets and wave structures
e (Euler) - Euler's Number
e = 2.718281828459045
Properties:
e² = 7.389
e³ = 20.085
e⁴ = 54.598
Application: Suitable for exponential movements and volatile markets
EMA Types
1. Phi (Phi) - Golden Ratio EMA
Description: EMA based on the golden ratio
Period Formula:
Period = Phi^n × Base Multiplier
Parameters:
Phi Power Level (1-8): Power of Phi
Phi¹ = 1.618 → ~16 period (with Base=10)
Phi² = 2.618 → ~26 period
Phi³ = 4.236 → ~42 period (recommended)
Phi⁴ = 6.854 → ~69 period
Recommendations:
Phi² or Phi³ for day trading
Phi⁴ or Phi⁵ for swing trading
Works excellently as Fast EMA
2. Pi (Pi) - Circular EMA
Description: EMA based on Pi for cyclical movements
Period Formula:
Period = Pi × Multiple × Base Multiplier
Parameters:
Pi Multiple (1-10): Pi multiplier
1Pi = 3.14 → ~31 period (with Base=10)
2Pi = 6.28 → ~63 period (recommended)
3Pi = 9.42 → ~94 period
Recommendations:
2Pi ideal as Mid or Slow EMA
Excellently identifies cycles and waves
Use on volatile markets (crypto, forex)
3. e (Euler) - Natural EMA
Description: EMA based on natural logarithm
Period Formula:
Period = e^n × Base Multiplier
Parameters:
e Power Level (1-6): Power of e
e¹ = 2.718 → ~27 period (with Base=10)
e² = 7.389 → ~74 period (recommended)
e³ = 20.085 → ~201 period
Recommendations:
e² works excellently as Slow EMA
Ideal for stocks and indices
Filters noise well on lower timeframes
4. Delta (Delta) - Adaptive EMA
Description: Adaptive EMA that changes period based on volatility
Period Formula:
Period = Base Period × (1 + (Volatility - 1) × Factor)
Parameters:
Delta Base Period (5-200): Base period (default 20)
Delta Volatility Sensitivity (0.5-5.0): Volatility sensitivity (default 2.0)
How it works:
During low volatility → period decreases → EMA reacts faster
During high volatility → period increases → EMA smooths noise
Recommendations:
Works excellently on news and sharp movements
Use as Fast EMA for quick adaptation
Sensitivity 2.0-3.0 for crypto, 1.0-2.0 for stocks
5. Sigma (Sigma) - Composite EMA
Description: Composite EMA combining multiple active EMAs
Composition Methods:
Weighted Average (default):
Sigma = (Phi + Pi + e + Delta) / 4
Simple average of all active EMAs
Geometric Mean:
Sigma = fourth_root(Phi × Pi × e × Delta)
Geometric mean (more conservative)
Harmonic Mean:
Sigma = 4 / (1/Phi + 1/Pi + 1/e + 1/Delta)
Harmonic mean (more weight to smaller values)
Recommendations:
Enable for additional confirmation
Use as Mid EMA
Weighted Average - most universal method
6. Lambda (Lambda) - Wave EMA
Description: Wave EMA with sinusoidal period modulation
Period Formula:
Period = Base Period × (1 + Amplitude × sin(2Pi × bar / Frequency))
Parameters:
Lambda Base Period (10-200): Base period
Lambda Wave Amplitude (0.1-2.0): Wave amplitude
Lambda Wave Frequency (10-200): Wave frequency in bars
How it works:
Period pulsates sinusoidally
Creates wave effect following market cycles
Recommendations:
Experimental EMA for advanced users
Works well on cyclical markets
Frequency = 50 for day trading, 100+ for swing
Settings
Matrix Core Settings
Base Multiplier (1-100)
Multiplies all EMA periods
Base = 1: Very fast EMAs (Phi³ = 4, 2Pi = 6, e² = 7)
Base = 10: Standard (Phi³ = 42, 2Pi = 63, e² = 74)
Base = 20: Slow EMAs (Phi³ = 85, 2Pi = 126, e² = 148)
Recommendations by timeframe:
M1-M5: Base = 5-10
M15-H1: Base = 10-15 (recommended)
H4-D1: Base = 15-25
W1-MN: Base = 25-50
Matrix Source
Data source selection for EMA calculation:
close - closing price (standard)
open - opening price
high - high
low - low
hl2 - (high + low) / 2
hlc3 - (high + low + close) / 3
ohlc4 - (open + high + low + close) / 4
When to change:
hlc3 or ohlc4 for smoother signals
high for aggressive longs
low for aggressive shorts
Manual EMA Selection
Critically important setting! Determines which EMAs are used for signal generation.
Use Manual Fast/Slow/Mid Selection
Enabled (default): You select EMAs manually
Disabled: Automatic selection by periods
Fast EMA
Fast EMA - reacts first to price changes
Recommendations:
Phi Golden (recommended) - universal choice
Delta Adaptive - for volatile markets
Must be fastest (smallest period)
Slow EMA
Slow EMA - determines main trend
Recommendations:
Pi Circular (recommended) - excellent trend filter
e Natural - for smoother trend
Must be slowest (largest period)
Mid EMA
Mid EMA - additional signal filter
Recommendations:
e Natural (recommended) - excellent middle level
Pi Circular - alternative
None - for more frequent signals (only 2 EMAs)
IMPORTANT: The indicator automatically sorts selected EMAs by their actual periods:
Fast = EMA with smallest period
Mid = EMA with middle period
Slow = EMA with largest period
Therefore, you can select any combination - the indicator will arrange them correctly!
Premium Visualization
Neon Glow
Enable Neon Glow for EMAs - adds glowing effect around EMA lines
Glow Strength:
Light - subtle glow
Medium (recommended) - optimal balance
Strong - bright glow (may be too bright)
Effect: 2 glow layers around each EMA for 3D effect
Gradient Clouds
Enable Gradient Clouds - fills space between EMAs with gradient
Parameters:
Cloud Transparency (85-98): Cloud transparency
95-97 (recommended)
Higher = more transparent
Dynamic Cloud Intensity - automatically changes transparency based on EMA distance
Cloud Colors:
Phi-Pi Cloud:
Blue - when Pi above Phi (bullish)
Gold - when Phi above Pi (bearish)
Pi-e Cloud:
Green - when e above Pi (bullish)
Blue - when Pi above e (bearish)
2 layers for volumetric effect
Pulsing Ribbon Bar
Enable Pulsing Indicator Bar - pulsing strip at bottom/top of chart
Parameters:
Ribbon Position: Top / Bottom (recommended)
Pulse Speed: Slow / Medium (recommended) / Fast
Symbols and colors:
Green filled square - STRONG BULLISH
Pink filled square - STRONG BEARISH
Blue hollow square - Bullish (regular)
Red hollow square - Bearish (regular)
Purple rectangle - Neutral
Effect: Pulsation with sinusoid for living market feel
Signal Bar Highlights
Enable Signal Bar Highlights - highlights bars with signals
Parameters:
Highlight Transparency (88-96): Highlight transparency
Highlight Style:
Light Fill (recommended) - bar background fill
Thin Line - bar outline only
Highlights:
Golden Cross - green
Death Cross - pink
STRONG BUY - green
STRONG SELL - pink
Show Greek Labels
Shows Greek alphabet letters on last bar:
Phi - Phi EMA (gold)
Pi - Pi EMA (blue)
e - Euler EMA (green)
Delta - Delta EMA (purple)
Sigma - Sigma EMA (pink)
When to use: For education or presentations
Show Old Background
Old background style (not recommended):
Green background - STRONG BULLISH
Pink background - STRONG BEARISH
Blue background - Bullish
Red background - Bearish
Not recommended - use new Gradient Clouds and Pulsing Bar
Info Table
Show Info Table - table with indicator information
Parameters:
Position: Top Left / Top Right (recommended) / Bottom Left / Bottom Right
Size: Tiny / Small (recommended) / Normal / Large
Table contents:
EMA list - periods and current values of all active EMAs
Effects - active visual effects
TREND - current trend state:
STRONG UP - strong bullish
STRONG DOWN - strong bearish
Bullish - regular bullish
Bearish - regular bearish
Neutral - neutral
Momentum % - percentage deviation of price from Fast EMA
Setup - current Fast/Slow/Mid configuration
Trading Signals
Show Golden/Death Cross
Golden Cross - Fast EMA crosses Slow EMA from below (bullish signal) Death Cross - Fast EMA crosses Slow EMA from above (bearish signal)
Symbols:
Yellow dot "GC" below - Golden Cross
Dark red dot "DC" above - Death Cross
Show STRONG Signals
STRONG BUY and STRONG SELL - the most powerful indicator signals
Conditions for STRONG BULLISH:
EMA Alignment: Fast > Mid > Slow (all EMAs aligned)
Trend: Fast > Slow (clear uptrend)
Distance: EMAs separated by minimum 0.15%
Price Position: Price above Fast EMA
Fast Slope: Fast EMA rising
Slow Slope: Slow EMA rising
Mid Trending: Mid EMA also rising (if enabled)
Conditions for STRONG BEARISH:
Same but in reverse
Visual display:
Green label "STRONG BUY" below bar
Pink label "STRONG SELL" above bar
Difference from Golden/Death Cross:
Golden/Death Cross = crossing moment (1 bar)
STRONG signal = sustained trend (lasts several bars)
IMPORTANT: After fixes, STRONG signals now:
Work on all timeframes (M1 to MN)
Don't break on small retracements
Work with any Fast/Mid/Slow combination
Automatically adapt thanks to EMA sorting
Show Stop Loss/Take Profit
Automatic SL/TP level calculation on STRONG signal
Parameters:
Stop Loss (ATR) (0.5-5.0): ATR multiplier for stop loss
1.5 (recommended) - standard
1.0 - tight stop
2.0-3.0 - wide stop
Take Profit R:R (1.0-5.0): Risk/reward ratio
2.0 (recommended) - standard (risk 1.5 ATR, profit 3.0 ATR)
1.5 - conservative
3.0-5.0 - aggressive
Formulas:
LONG:
Stop Loss = Entry - (ATR × Stop Loss ATR)
Take Profit = Entry + (ATR × Stop Loss ATR × Take Profit R:R)
SHORT:
Stop Loss = Entry + (ATR × Stop Loss ATR)
Take Profit = Entry - (ATR × Stop Loss ATR × Take Profit R:R)
Visualization:
Red X - Stop Loss
Green X - Take Profit
Levels remain active while STRONG signal persists
Trading Signals
Signal Types
1. Golden Cross
Description: Fast EMA crosses Slow EMA from below
Signal: Beginning of bullish trend
How to trade:
ENTRY: On bar close with Golden Cross
STOP: Below local low or below Slow EMA
TARGET: Next resistance level or 2:1 R:R
Strengths:
Simple and clear
Works well on trending markets
Clear entry point
Weaknesses:
Lags (signal after movement starts)
Many false signals in ranging markets
May be late on fast moves
Optimal timeframes: H1, H4, D1
2. Death Cross
Description: Fast EMA crosses Slow EMA from above
Signal: Beginning of bearish trend
How to trade:
ENTRY: On bar close with Death Cross
STOP: Above local high or above Slow EMA
TARGET: Next support level or 2:1 R:R
Application: Mirror of Golden Cross
3. STRONG BUY
Description: All EMAs aligned + trend + all EMAs rising
Signal: Powerful bullish trend
How to trade:
ENTRY: On bar close with STRONG BUY or on pullback to Fast EMA
STOP: Below Fast EMA or automatic SL (if enabled)
TARGET: Automatic TP (if enabled) or by levels
TRAILING: Follow Fast EMA
Entry strategies:
Aggressive: Enter immediately on signal
Conservative: Wait for pullback to Fast EMA, then enter on bounce
Pyramiding: Add positions on pullbacks to Mid EMA
Position management:
Hold while STRONG signal active
Exit on STRONG SELL or Death Cross appearance
Move stop behind Fast EMA
Strengths:
Most reliable indicator signal
Doesn't break on pullbacks
Catches large moves
Works on all timeframes
Weaknesses:
Appears less frequently than other signals
Requires confirmation (multiple conditions)
Optimal timeframes: All (M5 - D1)
4. STRONG SELL
Description: All EMAs aligned down + downtrend + all EMAs falling
Signal: Powerful bearish trend
How to trade: Mirror of STRONG BUY
Visual Signals
Pulsing Ribbon Bar
Quick market assessment at a glance:
Symbol Color State
Filled square Green STRONG BULLISH
Filled square Pink STRONG BEARISH
Hollow square Blue Bullish
Hollow square Red Bearish
Rectangle Purple Neutral
Pulsation: Sinusoidal, creates living effect
Signal Bar Highlights
Bars with signals are highlighted:
Green highlight: STRONG BUY or Golden Cross
Pink highlight: STRONG SELL or Death Cross
Gradient Clouds
Colored space between EMAs shows trend strength:
Wide clouds - strong trend
Narrow clouds - weak trend or consolidation
Color change - trend change
Info Table
Quick reference in corner:
TREND: Current state (STRONG UP, Bullish, Neutral, Bearish, STRONG DOWN)
Momentum %: Movement strength
Effects: Active visual effects
Setup: Fast/Slow/Mid configuration
Usage Strategies
Strategy 1: "Golden Trailing"
Idea: Follow STRONG signals using Fast EMA as trailing stop
Settings:
Fast: Phi Golden (Phi³)
Mid: Pi Circular (2Pi)
Slow: e Natural (e²)
Base Multiplier: 10
Timeframe: H1, H4
Entry rules:
Wait for STRONG BUY
Enter on bar close or on pullback to Fast EMA
Stop below Fast EMA
Management:
Hold position while STRONG signal active
Move stop behind Fast EMA daily
Exit on STRONG SELL or Death Cross
Take Profit:
Partially close at +2R
Trail remainder until exit signal
For whom: Swing traders, trend followers
Pros:
Catches large moves
Simple rules
Emotionally comfortable
Cons:
Requires patience
Possible extended drawdowns on pullbacks
Strategy 2: "Scalping Bounces"
Idea: Scalp bounces from Fast EMA during STRONG trend
Settings:
Fast: Delta Adaptive (Base 15, Sensitivity 2.0)
Mid: Phi Golden (Phi²)
Slow: Pi Circular (2Pi)
Base Multiplier: 5
Timeframe: M5, M15
Entry rules:
STRONG signal must be active
Wait for price pullback to Fast EMA
Enter on bounce (candle closes above/below Fast EMA)
Stop behind local extreme (15-20 pips)
Take Profit:
+1.5R or to Mid EMA
Or to next level
For whom: Active day traders
Pros:
Many signals
Clear entry point
Quick profits
Cons:
Requires constant monitoring
Not all bounces work
Requires discipline for frequent trading
Strategy 3: "Triple Filter"
Idea: Enter only when all 3 EMAs and price perfectly aligned
Settings:
Fast: Phi Golden (Phi³)
Mid: e Natural (e²)
Slow: Pi Circular (3Pi)
Base Multiplier: 15
Timeframe: H4, D1
Entry rules (LONG):
STRONG BUY active
Price above all three EMAs
Fast > Mid > Slow (all aligned)
All EMAs rising (slope up)
Gradient Clouds wide and bright
Entry:
On bar close meeting all conditions
Or on next pullback to Fast EMA
Stop:
Below Mid EMA or -1.5 ATR
Take Profit:
First target: +3R
Second target: next major level
Trailing: Mid EMA
For whom: Conservative swing traders, investors
Pros:
Very reliable signals
Minimum false entries
Large profit potential
Cons:
Rare signals (2-5 per month)
Requires patience
Strategy 4: "Adaptive Scalper"
Idea: Use only Delta Adaptive EMA for quick volatility reaction
Settings:
Fast: Delta Adaptive (Base 10, Sensitivity 3.0)
Mid: None
Slow: Delta Adaptive (Base 30, Sensitivity 2.0)
Base Multiplier: 3
Timeframe: M1, M5
Feature: Two different Delta EMAs with different settings
Entry rules:
Golden Cross between two Delta EMAs
Both Delta EMAs must be rising/falling
Enter on next bar
Stop:
10-15 pips or below Slow Delta EMA
Take Profit:
+1R to +2R
Or Death Cross
For whom: Scalpers on cryptocurrencies and forex
Pros:
Instant volatility adaptation
Many signals on volatile markets
Quick results
Cons:
Much noise on calm markets
Requires fast execution
High commissions may eat profits
Strategy 5: "Cyclical Trader"
Idea: Use Pi and Lambda for trading cyclical markets
Settings:
Fast: Pi Circular (1Pi)
Mid: Lambda Wave (Base 30, Amplitude 0.5, Frequency 50)
Slow: Pi Circular (3Pi)
Base Multiplier: 10
Timeframe: H1, H4
Entry rules:
STRONG signal active
Lambda Wave EMA synchronized with trend
Enter on bounce from Lambda Wave
For whom: Traders of cyclical assets (some altcoins, commodities)
Pros:
Catches cyclical movements
Lambda Wave provides additional entry points
Cons:
More complex to configure
Not for all markets
Lambda Wave may give false signals
Strategy 6: "Multi-Timeframe Confirmation"
Idea: Use multiple timeframes for confirmation
Scheme:
Higher TF (D1): Determine trend direction (STRONG signal)
Middle TF (H4): Wait for STRONG signal in same direction
Lower TF (M15): Look for entry point (Golden Cross or bounce from Fast EMA)
Settings for all TFs:
Fast: Phi Golden (Phi³)
Mid: e Natural (e²)
Slow: Pi Circular (2Pi)
Base Multiplier: 10
Rules:
All 3 TFs must show one trend
Entry on lower TF
Stop by lower TF
Target by higher TF
For whom: Serious traders and investors
Pros:
Maximum reliability
Large profit targets
Minimum false signals
Cons:
Rare setups
Requires analysis of multiple charts
Experience needed
Practical Tips
DOs
Use STRONG signals as primary - they're most reliable
Let signals develop - don't exit on first pullback
Use trailing stop - follow Fast EMA
Combine with levels - S/R, Fibonacci, volumes
Test on demo before real
Adjust Base Multiplier for your timeframe
Enable visual effects - they help see the picture
Use Info Table - quick situation assessment
Watch Pulsing Bar - instant state indicator
Trust auto-sorting of Fast/Mid/Slow
DON'Ts
Don't trade against STRONG signal - trend is your friend
Don't ignore Mid EMA - it adds reliability
Don't use too small Base Multiplier on higher TFs
Don't enter on Golden Cross in range - check for trend
Don't change settings during open position
Don't forget risk management - 1-2% per trade
Don't trade all signals in row - choose best ones
Don't use indicator in isolation - combine with Price Action
Don't set too tight stops - let trade breathe
Don't over-optimize - simplicity = reliability
Optimal Settings by Asset
US Stocks (SPY, AAPL, TSLA)
Recommendation:
Fast: Phi Golden (Phi³)
Mid: e Natural (e²)
Slow: Pi Circular (2Pi)
Base: 10-15
Timeframe: H4, D1
Features:
Use on daily for swing
STRONG signals very reliable
Works well on trending stocks
Forex (EUR/USD, GBP/USD)
Recommendation:
Fast: Delta Adaptive (Base 15, Sens 2.0)
Mid: Phi Golden (Phi²)
Slow: Pi Circular (2Pi)
Base: 8-12
Timeframe: M15, H1, H4
Features:
Delta Adaptive works excellently on news
Many signals on M15-H1
Consider spreads
Cryptocurrencies (BTC, ETH, altcoins)
Recommendation:
Fast: Delta Adaptive (Base 10, Sens 3.0)
Mid: Pi Circular (2Pi)
Slow: e Natural (e²)
Base: 5-10
Timeframe: M5, M15, H1
Features:
High volatility - adaptation needed
STRONG signals can last days
Be careful with scalping on M1-M5
Commodities (Gold, Oil)
Recommendation:
Fast: Pi Circular (1Pi)
Mid: Phi Golden (Phi³)
Slow: Pi Circular (3Pi)
Base: 12-18
Timeframe: H4, D1
Features:
Pi works excellently on cyclical commodities
Gold responds especially well to Phi
Oil volatile - use wide stops
Indices (S&P500, Nasdaq, DAX)
Recommendation:
Fast: Phi Golden (Phi³)
Mid: e Natural (e²)
Slow: Pi Circular (2Pi)
Base: 15-20
Timeframe: H4, D1, W1
Features:
Very trending instruments
STRONG signals last weeks
Good for position trading
Alerts
The indicator supports 6 alert types:
1. Golden Cross
Message: "Hellenic Matrix: GOLDEN CROSS - Fast EMA crossed above Slow EMA - Bullish trend starting!"
When: Fast EMA crosses Slow EMA from below
2. Death Cross
Message: "Hellenic Matrix: DEATH CROSS - Fast EMA crossed below Slow EMA - Bearish trend starting!"
When: Fast EMA crosses Slow EMA from above
3. STRONG BULLISH
Message: "Hellenic Matrix: STRONG BULLISH SIGNAL - All EMAs aligned for powerful uptrend!"
When: All conditions for STRONG BUY met (first bar)
4. STRONG BEARISH
Message: "Hellenic Matrix: STRONG BEARISH SIGNAL - All EMAs aligned for powerful downtrend!"
When: All conditions for STRONG SELL met (first bar)
5. Bullish Ribbon
Message: "Hellenic Matrix: BULLISH RIBBON - EMAs aligned for uptrend"
When: EMAs aligned bullish + price above Fast EMA (less strict condition)
6. Bearish Ribbon
Message: "Hellenic Matrix: BEARISH RIBBON - EMAs aligned for downtrend"
When: EMAs aligned bearish + price below Fast EMA (less strict condition)
How to Set Up Alerts:
Open indicator on chart
Click on three dots next to indicator name
Select "Create Alert"
In "Condition" field select needed alert:
Golden Cross
Death Cross
STRONG BULLISH
STRONG BEARISH
Bullish Ribbon
Bearish Ribbon
Configure notification method:
Pop-up in browser
Email
SMS (in Premium accounts)
Push notifications in mobile app
Webhook (for automation)
Select frequency:
Once Per Bar Close (recommended) - once on bar close
Once Per Bar - during bar formation
Only Once - only first time
Click "Create"
Tip: Create separate alerts for different timeframes and instruments
FAQ
1. Why don't STRONG signals appear?
Possible reasons:
Incorrect Fast/Mid/Slow order
Solution: Indicator automatically sorts EMAs by periods, but ensure selected EMAs have different periods
Base Multiplier too large
Solution: Reduce Base to 5-10 on lower timeframes
Market in range
Solution: STRONG signals appear only in trends - this is normal
Too strict EMA settings
Solution: Try classic combination: Phi³ / Pi×2 / e² with Base=10
Mid EMA too close to Fast or Slow
Solution: Select Mid EMA with period between Fast and Slow
2. How often should STRONG signals appear?
Normal frequency:
M1-M5: 5-15 signals per day (very active markets)
M15-H1: 2-8 signals per day
H4: 3-10 signals per week
D1: 2-5 signals per month
W1: 2-6 signals per year
If too many signals - market very volatile or Base too small
If too few signals - market in range or Base too large
4. What are the best settings for beginners?
Universal "out of the box" settings:
Matrix Core:
Base Multiplier: 10
Source: close
Phi Golden: Enabled, Power = 3
Pi Circular: Enabled, Multiple = 2
e Natural: Enabled, Power = 2
Delta Adaptive: Enabled, Base = 20, Sensitivity = 2.0
Manual Selection:
Fast: Phi Golden
Mid: e Natural
Slow: Pi Circular
Visualization:
Gradient Clouds: ON
Neon Glow: ON (Medium)
Pulsing Bar: ON (Medium)
Signal Highlights: ON (Light Fill)
Table: ON (Top Right, Small)
Signals:
Golden/Death Cross: ON
STRONG Signals: ON
Stop Loss: OFF (while learning)
Timeframe for learning: H1 or H4
5. Can I use only one EMA?
No, minimum 2 EMAs (Fast and Slow) for signal generation.
Mid EMA is optional:
With Mid EMA = more reliable but rarer signals
Without Mid EMA = more signals but less strict filtering
Recommendation: Start with 3 EMAs (Fast/Mid/Slow), then experiment
6. Does the indicator work on cryptocurrencies?
Yes, works excellently! Especially good on:
Bitcoin (BTC)
Ethereum (ETH)
Major altcoins (SOL, BNB, XRP)
Recommended settings for crypto:
Fast: Delta Adaptive (Base 10-15, Sensitivity 2.5-3.0)
Mid: Pi Circular (2Pi)
Slow: e Natural (e²)
Base: 5-10
Timeframe: M15, H1, H4
Crypto market features:
High volatility → use Delta Adaptive
24/7 trading → set alerts
Sharp movements → wide stops
7. Can I trade only with this indicator?
Technically yes, but NOT recommended.
Best approach - combine with:
Price Action - support/resistance levels, candle patterns
Volume - movement strength confirmation
Fibonacci - retracement and extension levels
RSI/MACD - divergences and overbought/oversold
Fundamental analysis - news, company reports
Hellenic Matrix:
Excellently determines trend and its strength
Provides clear entry/exit points
Doesn't consider fundamentals
Doesn't see major levels
8. Why do Gradient Clouds change color?
Color depends on EMA order:
Phi-Pi Cloud:
Blue - Pi EMA above Phi EMA (bullish alignment)
Gold - Phi EMA above Pi EMA (bearish alignment)
Pi-e Cloud:
Green - e EMA above Pi EMA (bullish alignment)
Blue - Pi EMA above e EMA (bearish alignment)
Color change = EMA order change = possible trend change
9. What is Momentum % in the table?
Momentum % = percentage deviation of price from Fast EMA
Formula:
Momentum = ((Close - Fast EMA) / Fast EMA) × 100
Interpretation:
+0.5% to +2% - normal bullish momentum
+2% to +5% - strong bullish momentum
+5% and above - overheating (correction possible)
-0.5% to -2% - normal bearish momentum
-2% to -5% - strong bearish momentum
-5% and below - oversold (bounce possible)
Usage:
Monitor momentum during STRONG signals
Large momentum = don't enter (wait for pullback)
Small momentum = good entry point
10. How to configure for scalping?
Settings for scalping (M1-M5):
Base Multiplier: 3-5
Source: close or hlc3 (smoother)
Fast: Delta Adaptive (Base 8-12, Sensitivity 3.0)
Mid: None (for more signals)
Slow: Phi Golden (Phi²) or Pi Circular (1Pi)
Visualization:
- Gradient Clouds: ON (helps see strength)
- Neon Glow: OFF (doesn't clutter chart)
- Pulsing Bar: ON (quick assessment)
- Signal Highlights: ON
Signals:
- Golden/Death Cross: ON
- STRONG Signals: ON
- Stop Loss: ON (1.0-1.5 ATR, R:R 1.5-2.0)
Scalping rules:
Trade only STRONG signals
Enter on bounce from Fast EMA
Tight stops (10-20 pips)
Quick take profit (+1R to +2R)
Don't hold through news
11. How to configure for long-term investing?
Settings for investing (D1-W1):
Base Multiplier: 20-30
Source: close
Fast: Phi Golden (Phi³ or Phi⁴)
Mid: e Natural (e²)
Slow: Pi Circular (3Pi or 4Pi)
Visualization:
- Gradient Clouds: ON
- Neon Glow: ON (Medium)
- Everything else - to taste
Signals:
- Golden/Death Cross: ON
- STRONG Signals: ON
- Stop Loss: OFF (use percentage stop)
Investing rules:
Enter only on STRONG signals
Hold while STRONG active (weeks/months)
Stop below Slow EMA or -10%
Take profit: by company targets or +50-100%
Ignore short-term pullbacks
12. What if indicator slows down chart?
Indicator is optimized, but if it slows:
Disable unnecessary visual effects:
Neon Glow: OFF (saves 8 plots)
Gradient Clouds: ON but low quality
Lambda Wave EMA: OFF (if not using)
Reduce number of active EMAs:
Sigma Composite: OFF
Lambda Wave: OFF
Leave only Phi, Pi, e, Delta
Simplify settings:
Pulsing Bar: OFF
Greek Labels: OFF
Info Table: smaller size
13. Can I use on different timeframes simultaneously?
Yes! Multi-timeframe analysis is very powerful:
Classic scheme:
Higher TF (D1, W1) - determine global trend
Wait for STRONG signal
This is our trading direction
Middle TF (H4, H1) - look for confirmation
STRONG signal in same direction
Precise entry zone
Lower TF (M15, M5) - entry point
Golden Cross or bounce from Fast EMA
Precise stop loss
Example:
W1: STRONG BUY active (global uptrend)
H4: STRONG BUY appeared (confirmation)
M15: Wait for Golden Cross or bounce from Fast EMA → ENTRY
Advantages:
Maximum reliability
Clear timeframe hierarchy
Large targets
14. How does indicator work on news?
Delta Adaptive EMA adapts excellently to news:
Before news:
Low volatility → Delta EMA becomes fast → pulls to price
During news:
Sharp volatility spike → Delta EMA slows → filters noise
After news:
Volatility normalizes → Delta EMA returns to normal
Recommendations:
Don't trade at news release moment (spreads widen)
Wait for STRONG signal after news (2-5 bars)
Use Delta Adaptive as Fast EMA for quick reaction
Widen stops by 50-100% during important news
Advanced Techniques
Technique 1: "Divergences with EMA"
Idea: Look for discrepancies between price and Fast EMA
Bullish divergence:
Price makes lower low
Fast EMA makes higher low
= Possible reversal up
Bearish divergence:
Price makes higher high
Fast EMA makes lower high
= Possible reversal down
How to trade:
Find divergence
Wait for STRONG signal in divergence direction
Enter on confirmation
Technique 2: "EMA Tunnel"
Idea: Use space between Fast and Slow EMA as "tunnel"
Rules:
Wide tunnel - strong trend, hold position
Narrow tunnel - weak trend or consolidation, caution
Tunnel narrowing - trend weakening, prepare to exit
Tunnel widening - trend strengthening, can add
Visually: Gradient Clouds show this automatically!
Trading:
Enter on STRONG signal (tunnel starts widening)
Hold while tunnel wide
Exit when tunnel starts narrowing
Technique 3: "Wave Analysis with Lambda"
Idea: Lambda Wave EMA creates sinusoid matching market cycles
Setup:
Lambda Base Period: 30
Lambda Wave Amplitude: 0.5
Lambda Wave Frequency: 50 (adjusted to asset cycle)
How to find correct Frequency:
Look at historical cycles (distance between local highs)
Average distance = your Frequency
Example: if highs every 40-60 bars, set Frequency = 50
Trading:
Enter when Lambda Wave at bottom of sinusoid (growth potential)
Exit when Lambda Wave at top (fall potential)
Combine with STRONG signals
Technique 4: "Cluster Analysis"
Idea: When all EMAs gather in narrow cluster = powerful breakout soon
Cluster signs:
All EMAs (Phi, Pi, e, Delta) within 0.5-1% of each other
Gradient Clouds almost invisible
Price jumping around all EMAs
Trading:
Identify cluster (all EMAs close)
Determine breakout direction (where more volume, higher TFs direction)
Wait for breakout and STRONG signal
Enter on confirmation
Target = cluster size × 3-5
This is very powerful technique for big moves!
Technique 5: "Sigma as Dynamic Level"
Idea: Sigma Composite EMA = average of all EMAs = magnetic level
Usage:
Enable Sigma Composite (Weighted Average)
Sigma works as dynamic support/resistance
Price often returns to Sigma before trend continuation
Trading:
In trend: Enter on bounces from Sigma
In range: Fade moves from Sigma (trade return to Sigma)
On breakout: Sigma becomes support/resistance
Risk Management
Basic Rules
1. Position Size
Conservative: 1% of capital per trade
Moderate: 2% of capital per trade (recommended)
Aggressive: 3-5% (only for experienced)
Calculation formula:
Lot Size = (Capital × Risk%) / (Stop in pips × Pip value)
2. Risk/Reward Ratio
Minimum: 1:1.5
Standard: 1:2 (recommended)
Optimal: 1:3
Aggressive: 1:5+
3. Maximum Drawdown
Daily: -3% to -5%
Weekly: -7% to -10%
Monthly: -15% to -20%
Upon reaching limit → STOP trading until end of period
Position Management Strategies
1. Fixed Stop
Method:
Stop below/above Fast EMA or local extreme
DON'T move stop against position
Can move to breakeven
For whom: Beginners, conservative traders
2. Trailing by Fast EMA
Method:
Each day (or bar) move stop to Fast EMA level
Position closes when price breaks Fast EMA
Advantages:
Stay in trend as long as possible
Automatically exit on reversal
For whom: Trend followers, swing traders
3. Partial Exit
Method:
50% of position close at +2R
50% hold with trailing by Mid EMA or Slow EMA
Advantages:
Lock profit
Leave position for big move
Psychologically comfortable
For whom: Universal method (recommended)
4. Pyramiding
Method:
First entry on STRONG signal (50% of planned position)
Add 25% on pullback to Fast EMA
Add another 25% on pullback to Mid EMA
Overall stop below Slow EMA
Advantages:
Average entry price
Reduce risk
Increase profit in strong trends
Caution:
Works only in trends
In range leads to losses
For whom: Experienced traders
Trading Psychology
Correct Mindset
1. Indicator is a tool, not holy grail
Indicator shows probability, not guarantee
There will be losing trades - this is normal
Important is series statistics, not one trade
2. Trust the system
If STRONG signal appeared - enter
Don't search for "perfect" moment
Follow trading plan
3. Patience
STRONG signals don't appear every day
Better miss signal than enter against trend
Quality over quantity
4. Discipline
Always set stop loss
Don't move stop against position
Don't increase risk after losses
Beginner Mistakes
1. "I know better than indicator"
Indicator says STRONG BUY, but you think "too high, will wait for pullback"
Result: miss profitable move
Solution: Trust signals or don't use indicator
2. "Will reverse now for sure"
Trading against STRONG trend
Result: stops, stops, stops
Solution: Trend is your friend, trade with trend
3. "Will hold a bit more"
Don't exit when STRONG signal disappears
Greed eats profit
Solution: If signal gone - exit!
4. "I'll recover"
After losses double risk
Result: huge losses
Solution: Fixed % risk ALWAYS
5. "I don't like this signal"
Skip signals because of "feeling"
Result: inconsistency, no statistics
Solution: Trade ALL signals or clearly define filters
Trading Journal
What to Record
For each trade:
1. Entry/exit date and time
2. Instrument and timeframe
3. Signal type
Golden Cross
STRONG BUY
STRONG SELL
Death Cross
4. Indicator settings
Fast/Mid/Slow EMA
Base Multiplier
Other parameters
5. Chart screenshot
Entry moment
Exit moment
6. Trade parameters
Position size
Stop loss
Take Profit
R:R
7. Result
Profit/Loss in $
Profit/Loss in %
Profit/Loss in R
8. Notes
What was right
What was wrong
Emotions during trade
Lessons
Journal Analysis
Analyze weekly:
1. Win Rate
Win Rate = (Profitable trades / All trades) × 100%
Good: 50-60%
Excellent: 60-70%
Exceptional: 70%+
2. Average R
Average R = Sum of all R / Number of trades
Good: +0.5R
Excellent: +1.0R
Exceptional: +1.5R+
3. Profit Factor
Profit Factor = Total profit / Total losses
Good: 1.5+
Excellent: 2.0+
Exceptional: 3.0+
4. Maximum Drawdown
Track consecutive losses
If more than 5 in row - stop, check system
5. Best/Worst Trades
What was common in best trades? (do more)
What was common in worst trades? (avoid)
Pre-Trade Checklist
Technical Analysis
STRONG signal active (BUY or SELL)
All EMAs properly aligned (Fast > Mid > Slow or reverse)
Price on correct side of Fast EMA
Gradient Clouds confirm trend
Pulsing Bar shows STRONG state
Momentum % in normal range (not overheated)
No close strong levels against direction
Higher timeframe doesn't contradict
Risk Management
Position size calculated (1-2% risk)
Stop loss set
Take profit calculated (minimum 1:2)
R:R satisfactory
Daily/weekly risk limit not exceeded
No other open correlated positions
Fundamental Analysis
No important news in coming hours
Market session appropriate (liquidity)
No contradicting fundamentals
Understand why asset is moving
Psychology
Calm and thinking clearly
No emotions from previous trades
Ready to accept loss at stop
Following trading plan
Not revenging market for past losses
If at least one point is NO - think twice before entering!
Learning Roadmap
Week 1: Familiarization
Goals:
Install and configure indicator
Study all EMA types
Understand visualization
Tasks:
Add indicator to chart
Test all Fast/Mid/Slow settings
Play with Base Multiplier on different timeframes
Observe Gradient Clouds and Pulsing Bar
Study Info Table
Result: Comfort with indicator interface
Week 2: Signals
Goals:
Learn to recognize all signal types
Understand difference between Golden Cross and STRONG
Tasks:
Find 10 Golden Cross examples in history
Find 10 STRONG BUY examples in history
Compare their results (which worked better)
Set up alerts
Get 5 real alerts
Result: Understanding signals
Week 3: Demo Trading
Goals:
Start trading signals on demo account
Gather statistics
Tasks:
Open demo account
Trade ONLY STRONG signals
Keep journal (minimum 20 trades)
Don't change indicator settings
Strictly follow stop losses
Result: 20+ documented trades
Week 4: Analysis
Goals:
Analyze demo trading results
Optimize approach
Tasks:
Calculate win rate and average R
Find patterns in profitable trades
Find patterns in losing trades
Adjust approach (not indicator!)
Write trading plan
Result: Trading plan on 1 page
Month 2: Improvement
Goals:
Deepen understanding
Add additional techniques
Tasks:
Study multi-timeframe analysis
Test combinations with Price Action
Try advanced techniques (divergences, tunnels)
Continue demo trading (minimum 50 trades)
Achieve stable profitability on demo
Result: Win rate 55%+ and Profit Factor 1.5+
Month 3: Real Trading
Goals:
Transition to real account
Maintain discipline
Tasks:
Open small real account
Trade minimum lots
Strictly follow trading plan
DON'T increase risk
Focus on process, not profit
Result: Psychological comfort on real
Month 4+: Scaling
Goals:
Increase account
Become consistently profitable
Tasks:
With 60%+ win rate can increase risk to 2%
Upon doubling account can add capital
Continue keeping journal
Periodically review and improve strategy
Share experience with community
Result: Stable profitability month after month
Additional Resources
Recommended Reading
Technical Analysis:
"Technical Analysis of Financial Markets" - John Murphy
"Trading in the Zone" - Mark Douglas (psychology)
"Market Wizards" - Jack Schwager (trader interviews)
EMA and Moving Averages:
"Moving Averages 101" - Steve Burns
Articles on Investopedia about EMA
Risk Management:
"The Mathematics of Money Management" - Ralph Vince
"Trade Your Way to Financial Freedom" - Van K. Tharp
Trading Journals:
Edgewonk (paid, very powerful)
Tradervue (free version + premium)
Excel/Google Sheets (free)
Screeners:
TradingView Stock Screener
Finviz (stocks)
CoinMarketCap (crypto)
Conclusion
Hellenic EMA Matrix is a powerful tool based on universal mathematical constants of nature. The indicator combines:
Mathematical elegance - Phi, Pi, e instead of arbitrary numbers
Premium visualization - Neon Glow, Gradient Clouds, Pulsing Bar
Reliable signals - STRONG BUY/SELL work on all timeframes
Flexibility - 6 EMA types, adaptation to any trading style
Automation - auto-sorting EMAs, SL/TP calculation, alerts
Key Success Principles:
Simplicity - start with basic settings (Phi/Pi/e, Base=10)
Discipline - follow STRONG signals strictly
Patience - wait for quality setups
Risk Management - 1-2% per trade, ALWAYS
Journal - document every trade
Learning - constantly improve skills
Remember:
Indicator shows probability, not guarantee
Important is series statistics, not one trade
Psychology more important than technique
Quality more important than quantity
Process more important than result
Acknowledgments
Thank you for using Hellenic EMA Matrix - Alpha Omega Premium!
The indicator was created with love for mathematics, markets, and beautiful visualization.
Wishing you profitable trading!
Guide Version: 1.0
Date: 2025
Compatibility: Pine Script v6, TradingView
"In the simplicity of mathematical constants lies the complexity of market movements"

TraderDemircan Auto Fibonacci RetracementDescription:
What This Indicator Does:This indicator automatically identifies significant swing high and swing low points within a customizable lookback period and draws comprehensive Fibonacci retracement and extension levels between them. Unlike the manual Fibonacci tool that requires you to constantly redraw levels as price action evolves, this automated version continuously updates the Fibonacci grid based on the most recent major swing points, ensuring you always have current and relevant support/resistance zones displayed on your chart.Key Features:
Automatic Swing Detection: Continuously scans the specified lookback period to find the most significant high and low points, eliminating manual drawing errors
Comprehensive Level Coverage: Plots 16 Fibonacci levels including 7 retracement levels (0.0 to 1.0) and 9 extension levels (1.115 to 3.618)
Top-Down Methodology: Draws from swing high to swing low (right-to-left), following the traditional Fibonacci retracement convention where 100% is at the top
Dual Labeling System: Shows both exact price values and Fibonacci percentages for easy reference
Complete Customization: Individual toggle controls and color selection for each of the 16 levels
Flexible Display Options: Adjust line thickness (1-5), style (solid/dashed/dotted), and extension direction (left/right/both)
Visual Swing Markers: Red diamond at the swing high (starting point) and green diamond at the swing low (ending point)
Optional Trend Line: Connects the two swing points to visualize the overall price movement direction
How It Works:The indicator employs a sophisticated swing point detection algorithm that operates in two stages:Stage 1 - Find the Swing Low (Support Base):
Scans the entire lookback period to identify the lowest low, which becomes the anchor point (0.0 level in traditional retracement terms, though displayed at the bottom of the grid).Stage 2 - Find the Swing High (Resistance Peak):
After identifying the swing low, searches for the highest high that occurred after that low point, establishing the swing range. This creates a valid price movement range for Fibonacci analysis.Fibonacci Calculation Method:
The indicator uses the top-down approach where:
1.0 Level = Swing High (100% retracement, the top)
0.0 Level = Swing Low (0% retracement, the bottom)
Retracement Levels (0.236 to 0.786) = Potential support zones during pullbacks from the high
Extension Levels (1.115 to 3.618) = Potential target zones below the swing low
Formula: Price = SwingHigh - (SwingHigh - SwingLow) × FibonacciLevelThis ensures that 0.0 is at the bottom and extensions (>1.0) plot below the swing low, following standard Fibonacci retracement convention.Fibonacci Levels Explained:Retracement Levels (0.0 - 1.0):
0.0 (Gray): Swing low - the base support level
0.236 (Red): Shallow retracement, first minor support
0.382 (Orange): Moderate retracement, commonly watched support
0.5 (Purple): Psychological midpoint, significant support/resistance
0.618 (Blue - Golden Ratio): The most important retracement level, high-probability reversal zone
0.786 (Cyan): Deep retracement, last defense before full reversal
1.0 (Gray): Swing high - the initial resistance level
Extension Levels (1.115 - 3.618):
1.115 (Green): First extension, minimal downside target
1.272 (Light Green): Minor extension, common profit target
1.414 (Yellow-Green): Square root of 2, mathematical significance
1.618 (Gold - Golden Extension): Primary downside target, most watched extension level
2.0 (Orange-Red): 200% extension, psychological round number
2.382 (Pink): Secondary extension target
2.618 (Purple): Deep extension, major target zone
3.272 (Deep Purple): Extreme extension level
3.618 (Blue): Maximum extension, rare but powerful target
How to Use:For Retracement Trading (Buying Pullbacks in Uptrends):
Wait for price to make a significant move up from swing low to swing high
When price starts pulling back, watch for reactions at key Fibonacci levels
Most common entry zones: 0.382, 0.5, and especially 0.618 (golden ratio)
Enter long positions when price shows reversal signals (candlestick patterns, volume increase) at these levels
Place stop loss below the next Fibonacci level
Target: Return to swing high or higher extension levels
For Extension Trading (Profit Targets):
After price breaks below the swing low (0.0 level), use extensions as profit targets
First target: 1.272 (conservative)
Primary target: 1.618 (golden extension - most commonly reached)
Extended target: 2.618 (for strong trends)
Extreme target: 3.618 (only in powerful trending moves)
For Counter-Trend Trading (Fading Extremes):
When price reaches deep retracements (0.786 or below), look for exhaustion signals
Watch for divergences between price and momentum indicators at these levels
Enter reversal trades with tight stops below the swing low
Target: 0.5 or 0.382 levels on the bounce
For Trend Continuation:
In strong uptrends, shallow retracements (0.236 to 0.382) often hold
Use these as low-risk entry points to join the existing trend
Failure to hold 0.5 suggests weakening momentum
Breaking below 0.618 often indicates trend reversal, not just retracement
Multi-Timeframe Strategy:
Use daily timeframe Fibonacci for major support/resistance zones
Use 4H or 1H Fibonacci for precise entry timing within those zones
Confluence between multiple timeframe Fibonacci levels creates high-probability zones
Example: Daily 0.618 level aligning with 4H 0.5 level = strong support
Settings Guide:Lookback Period (10-500):
Short (20-50): Captures recent swings, more frequent updates, suited for day trading
Medium (50-150): Balanced approach, good for swing trading (default: 100)
Long (150-500): Identifies major market structure, suited for position trading
Higher values = more stable levels but slower to adapt to new trends
Pivot Sensitivity (1-20):
Controls how many candles are required to confirm a swing point
Low (1-5): More sensitive, identifies minor swings (default: 5)
High (10-20): Less sensitive, only major swings qualify
Use higher sensitivity on lower timeframes to filter noise
Individual Level Toggles:
Enable only the levels you actively trade to reduce chart clutter
Common minimalist setup: Show only 0.382, 0.5, 0.618, 1.0, 1.618, 2.618
Comprehensive setup: Enable all levels for maximum information
Visual Customization:
Line Thickness: Thicker lines (3-5) for presentation, thinner (1-2) for trading
Line Style: Solid for primary levels (0.5, 0.618, 1.618), dashed/dotted for secondary
Price Labels: Essential for knowing exact entry/exit prices
Percent Labels: Helpful for quickly identifying which Fibonacci level you're looking at
Extension Direction: Extend right for forward-looking analysis, left for historical context
What Makes This Original:While Fibonacci indicators are common on TradingView, this script's originality comes from:
Intelligent Two-Stage Detection: Unlike simple high/low finders, this uses a sequential approach (find low first, then find the high that occurred after it), ensuring logical price flow representation
Comprehensive Level Set: Includes 16 levels spanning from retracement to extreme extensions, more than most Fibonacci tools
Top-Down Methodology: Properly implements the traditional Fibonacci retracement convention (high to low) rather than the reverse
Automatic Range Validation: Only draws Fibonacci when both swing points are valid and in the correct temporal order
Dual Extension Options: Separate controls for extending lines left (historical context) and right (forward projection)
Smart Label Positioning: Places percentage labels on the left and price labels on the right for clarity
Visual Swing Confirmation: Diamond markers at swing points help users understand why levels are positioned where they are
Important Considerations:
Historical Nature: Fibonacci retracements are based on past price swings; they don't predict future moves, only suggest potential support/resistance
Self-Fulfilling Prophecy: Fibonacci levels work partly because many traders watch them, creating actual support/resistance at those levels
Not All Levels Hold: In strong trends, price may slice through multiple Fibonacci levels without pausing
Context Matters: Fibonacci works best when aligned with other support/resistance (previous highs/lows, moving averages, trendlines)
Volume Confirmation: The most reliable Fibonacci reversals occur with volume spikes at key levels
Dynamic Updates: The levels will redraw as new swing highs/lows form, so don't rely solely on static screenshots
Best Practices:
Don't Trade Blindly: Fibonacci levels are zones, not exact prices. Look for confirmation (candlestick patterns, indicators, volume)
Combine with Price Action: Watch for pin bars, engulfing candles, or doji at key Fibonacci levels
Use Stop Losses: Place stops beyond the next Fibonacci level to give trades room but limit risk
Scale In/Out: Consider entering partial positions at 0.5 and adding more at 0.618 rather than all-in at one level
Check Multiple Timeframes: Daily Fibonacci + 4H Fibonacci convergence = high-probability zone
Respect the 0.618: This golden ratio level is historically the most reliable for reversals
Extensions Need Strong Trends: Don't expect extensions to be hit unless there's clear momentum beyond the swing low
Optimal Timeframes:
Scalping (1-5 minutes): Lookback 20-30, watch 0.382, 0.5, 0.618 only
Day Trading (15m-1H): Lookback 50-100, all retracement levels important
Swing Trading (4H-Daily): Lookback 100-200, focus on 0.5, 0.618, 0.786, and extensions
Position Trading (Daily-Weekly): Lookback 200-500, all levels relevant for long-term planning
Common Fibonacci Trading Mistakes to Avoid:
Wrong Swing Selection: Choosing insignificant swings produces meaningless levels
Premature Entry: Entering as soon as price touches a Fibonacci level without confirmation
Ignoring Trend: Fighting the main trend by buying deep retracements in downtrends
Over-Reliance: Using Fibonacci in isolation without confirming with other technical factors
Static Analysis: Not updating your Fibonacci as market structure evolves
Arbitrary Lookback: Using the same lookback period for all assets and timeframes
Integration with Other Tools:Fibonacci + Moving Averages:
When 0.618 level aligns with 50 or 200 EMA, confluence creates stronger support
Price bouncing from both Fibonacci and MA simultaneously = high-probability trade
Fibonacci + RSI/Stochastic:
Oversold indicators at 0.618 or deeper retracements = strong buy signal
Overbought indicators at swing high (1.0) = potential reversal warning
Fibonacci + Volume Profile:
High-volume nodes aligning with Fibonacci levels create robust support/resistance
Low-volume areas near Fibonacci levels may see rapid price movement through them
Fibonacci + Trendlines:
Fibonacci retracement level + ascending trendline = double support
Breaking both simultaneously confirms trend change
Technical Notes:
Uses ta.lowest() and ta.highest() for efficient swing detection across the lookback period
Implements dynamic line and label arrays for clean redraws without memory leaks
All calculations update in real-time as new bars form
Extension options allow customization without modifying core code
Format.mintick ensures price labels match the symbol's minimum price increment
Tooltip on swing markers shows exact price values for precision

Luminous Glide Momentum Indicator [wjdtks255]This indicator, named "Customized SuperSmoother MA Oscillator," applies a smoothing filter to price data using a SuperSmoother technique to reduce noise and enhance signal clarity. It calculates two moving averages on the smoothed data—a fast and a slow—whose difference forms the oscillator line. A signal line is derived by smoothing the oscillator with another moving average. The histogram visualizes the divergence between the oscillator and signal lines, indicating momentum strength and direction.
How it works
SuperSmoother Filter: Reduces price noise to provide smoother and more reliable signals than raw data.
Fast and Slow Moving Averages: The fast MA reacts quicker to price changes, while the slow MA indicates longer trends.
Oscillator: The difference between the fast and slow MAs signals shifts in momentum.
Signal Line: A smoothed version of the oscillator used to generate crossovers.
Histogram: Displays the distance between the oscillator and signal line, with color changes indicating bullish or bearish momentum.
Trading Strategy
Buy Signal: When the oscillator crosses above the signal line, it suggests increasing upward momentum, signaling a potential buy opportunity.
Sell Signal: When the oscillator crosses below the signal line, it suggests increasing downward momentum, signaling a potential sell opportunity.
Histogram Size and Color: Larger green bars indicate stronger bullish momentum; larger red bars indicate stronger bearish momentum.
Usage Tips
Combine this oscillator with other indicators or price action analysis to confirm trading signals.
Adjust smoothing and moving average lengths according to your trading timeframe and the asset volatility.
Use proper risk management to filter out potential false signals common in oscillators.

chart Pattern & Candle sticks Strategy# **XAUUSD Pattern & Candle Strategy - Complete Description**
## **Overview**
This Pine Script indicator is a comprehensive multi-factor trading system specifically designed for **XAUUSD (Gold) scalping and swing trading**. It combines classical technical analysis methods including candlestick patterns, chart patterns, moving averages, and volume analysis to generate high-probability buy/sell signals with automatic stop-loss and take-profit levels.
***
## **Core Components**
### **1. Moving Average System (Triple MA)**
**Purpose:** Identifies trend direction and momentum
- **Fast MA (20-period)** - Short-term price action
- **Medium MA (50-period)** - Intermediate trend
- **Slow MA (200-period)** - Long-term trend direction
**How it works:**
- **Bullish alignment**: MA20 > MA50 > MA200 (all pointing up)
- **Bearish alignment**: MA20 < MA50 < MA200 (all pointing down)
- **Crossover signals**: When Fast MA crosses Medium MA, it triggers buy/sell signals
- **Choice of SMA or EMA**: Adjustable based on preference
**Visual indicators:**
- Blue line = Fast MA
- Orange line = Medium MA
- Light red line = Slow MA
- Green background tint = Bullish trend
- Red background tint = Bearish trend
---
### **2. Candlestick Pattern Recognition (13 Patterns)**
**Purpose:** Identifies reversal and continuation signals based on price action
#### **Bullish Patterns (Signal potential upward moves):**
1. **Hammer** 🔨
- Long lower wick (2x body size)
- Small body at top
- Indicates rejection of lower prices (buyers stepping in)
- Best at support levels
2. **Inverted Hammer**
- Long upper wick
- Small body at bottom
- Shows buying pressure despite initial selling
3. **Bullish Engulfing** 📈
- Green candle completely engulfs previous red candle
- Strong reversal signal
- Body must be 1.2x larger than previous
4. **Morning Star** ⭐
- 3-candle pattern
- Red candle → Small indecision candle → Large green candle
- Powerful reversal at bottoms
5. **Piercing Line** ⚡
- Green candle closes above 50% of previous red candle
- Indicates strong buying interest
6. **Bullish Marubozu**
- Almost no wicks (95% body)
- Very strong bullish momentum
- Body must be 1.3x average size
#### **Bearish Patterns (Signal potential downward moves):**
7. **Shooting Star** 💫
- Long upper wick
- Small body at bottom
- Indicates rejection of higher prices (sellers in control)
- Best at resistance levels
8. **Hanging Man**
- Similar to hammer but appears at top
- Warning of potential reversal down
9. **Bearish Engulfing** 📉
- Red candle completely engulfs previous green candle
- Strong reversal signal
10. **Evening Star** 🌙
- 3-candle pattern (opposite of Morning Star)
- Green → Small → Large red candle
- Powerful top reversal
11. **Dark Cloud Cover** ☁️
- Red candle closes below 50% of previous green candle
- Indicates strong selling pressure
12. **Bearish Marubozu**
- Almost no wicks, pure red body
- Very strong bearish momentum
#### **Neutral Pattern:**
13. **Doji**
- Open and close nearly equal (tiny body)
- Indicates indecision
- Often precedes major moves
**Detection Logic:**
- Compares body size, wick ratios, and position relative to previous candles
- Uses 14-period average body size as reference
- All patterns validated against volume confirmation
***
### **3. Chart Pattern Recognition**
**Purpose:** Identifies major support/resistance and reversal patterns
#### **Patterns Detected:**
**Double Bottom** 📊 (Bullish)
- Two lows at approximately same level
- Indicates strong support
- Breakout above neckline triggers buy signal
- Most reliable at major support zones
**Double Top** 📊 (Bearish)
- Two highs at approximately same level
- Indicates strong resistance
- Breakdown below neckline triggers sell signal
- Most reliable at major resistance zones
**Support & Resistance Levels**
- Automatically plots recent pivot highs (resistance)
- Automatically plots recent pivot lows (support)
- Uses 3-bar strength for validation
- Levels shown as dashed horizontal lines
**Price Action Patterns**
- **Uptrend detection**: Higher highs + higher lows
- **Downtrend detection**: Lower highs + lower lows
- Confirms overall market structure
***
### **4. Volume Analysis**
**Purpose:** Confirms signal strength and filters false signals
**Metrics tracked:**
- **Volume MA (20-period)**: Baseline average volume
- **High volume threshold**: 1.5x the volume average
- **Volume increase**: Current volume > previous 2 bars
**How it's used:**
- All buy/sell signals **require volume confirmation**
- High volume = institutional participation
- Low volume signals are filtered out
- Prevents whipsaw trades during quiet periods
**Visual indicator:**
- Dashboard shows "High" volume in orange when active
- "Normal" shown in gray during low volume
***
### **5. Signal Generation Logic**
**BUY SIGNALS triggered when ANY of these occur:**
1. **Candlestick + Volume**
- Bullish candle pattern detected
- High volume confirmation
- Price above Fast MA
2. **MA Crossover + Volume**
- Fast MA crosses above Medium MA
- High volume confirmation
3. **Double Bottom Breakout**
- Price breaks above support level
- Volume confirmation present
4. **Trend Continuation**
- Uptrend structure intact (higher highs/lows)
- All MAs in bullish alignment
- Price above Fast MA
- Volume confirmation
**SELL SIGNALS triggered when ANY of these occur:**
1. **Candlestick + Volume**
- Bearish candle pattern detected
- High volume confirmation
- Price below Fast MA
2. **MA Crossunder + Volume**
- Fast MA crosses below Medium MA
- High volume confirmation
3. **Double Top Breakdown**
- Price breaks below resistance level
- Volume confirmation present
4. **Trend Continuation**
- Downtrend structure intact (lower highs/lows)
- All MAs in bearish alignment
- Price below Fast MA
- Volume confirmation
***
### **6. Risk Management System**
**Automatic Stop Loss Calculation:**
- Based on ATR (Average True Range) - 14 periods
- **Formula**: Entry price ± (ATR × SL Multiplier)
- **Default multiplier**: 1.5 (adjustable)
- Adapts to market volatility automatically
**Automatic Take Profit Calculation:**
- **Formula**: Entry price ± (ATR × TP Multiplier)
- **Default multiplier**: 2.5 (adjustable)
- **Default Risk:Reward ratio**: 1:1.67
- Higher TP multiplier = more aggressive targets
**Position Management:**
- Tracks ONE position at a time (no pyramiding)
- Automatically closes position when:
- Stop loss is hit
- Take profit is reached
- Opposite MA crossover occurs
- Prevents revenge trading and over-leveraging
**Visual Representation:**
- **Red horizontal line** = Stop Loss level
- **Green horizontal line** = Take Profit level
- Lines remain on chart while position is active
- Automatically disappear when position closes
***
### **7. Visual Elements**
**On-Chart Displays:**
1. **Moving Average Lines**
- Fast MA (Blue, thick)
- Medium MA (Orange, thick)
- Slow MA (Red, thin)
2. **Support/Resistance**
- Green crosses = Support levels
- Red crosses = Resistance levels
3. **Buy/Sell Arrows**
- Large GREEN "BUY" label below bars
- Large RED "SELL" label above bars
4. **Pattern Labels** (Small markers)
- "Hammer", "Bull Engulf", "Morning Star" (green, below bars)
- "Shooting Star", "Bear Engulf", "Evening Star" (red, above bars)
- "Double Bottom" / "Double Top" (blue/orange)
5. **Signal Detail Labels** (Medium size)
- Shows signal reason (e.g., "Bullish Candle", "MA Cross Up")
- Displays Entry, SL, and TP prices
- Color-coded (green for long, red for short)
6. **Background Coloring**
- Light green tint = Bullish MA alignment
- Light red tint = Bearish MA alignment
***
### **8. Information Dashboard**
**Top-right corner table showing:**
| Metric | Description |
|--------|-------------|
| **Position** | Current trade status (LONG/SHORT/None) |
| **MA Trend** | Overall trend direction (Bullish/Bearish/Neutral) |
| **Volume** | Current volume status (High/Normal) |
| **Pattern** | Last detected candlestick pattern |
| **ATR** | Current volatility measurement |
**Purpose:**
- Quick at-a-glance market assessment
- Real-time position tracking
- No need to check multiple indicators
***
### **9. Alert System**
**Complete alert coverage for:**
✅ **Entry Alerts**
- "Buy Signal" - Triggers when buy conditions met
- "Sell Signal" - Triggers when sell conditions met
✅ **Exit Alerts**
- "Long TP Hit" - Take profit reached on long position
- "Long SL Hit" - Stop loss triggered on long position
- "Short TP Hit" - Take profit reached on short position
- "Short SL Hit" - Stop loss triggered on short position
**How to use:**
1. Click "Create Alert" button
2. Select desired alert from dropdown
3. Set notification method (popup, email, SMS, webhook)
4. Never miss a trade opportunity
***
## **Recommended Settings**
### **For Scalping (Quick trades):**
- **Timeframe**: 5-minute
- **Fast MA**: 9
- **Medium MA**: 21
- **Slow MA**: 50
- **SL Multiplier**: 1.0
- **TP Multiplier**: 2.0
- **Volume Threshold**: 1.5x
### **For Swing Trading (Longer holds):**
- **Timeframe**: 1-hour or 4-hour
- **Fast MA**: 20
- **Medium MA**: 50
- **Slow MA**: 200
- **SL Multiplier**: 2.0
- **TP Multiplier**: 3.0
- **Volume Threshold**: 1.3x
### **Best Trading Hours for XAUUSD:**
- **Asian Session**: 00:00 - 08:00 GMT (lower volatility)
- **London Session**: 08:00 - 16:00 GMT (high volatility) ⭐
- **New York Session**: 13:00 - 21:00 GMT (highest volume) ⭐
- **London-NY Overlap**: 13:00 - 16:00 GMT (BEST for scalping) 🔥
***
## **How to Use This Strategy**
### **Step 1: Setup**
1. Open TradingView
2. Load XAUUSD chart
3. Select timeframe (5m, 15m, 1H, or 4H)
4. Add indicator from Pine Editor
5. Adjust settings based on your trading style
### **Step 2: Wait for Signals**
- Watch for GREEN "BUY" or RED "SELL" labels
- Check the signal reason in the detail label
- Verify dashboard shows favorable conditions
- Confirm volume is "High" (not required but preferred)
### **Step 3: Enter Trade**
- Enter at market or limit order near signal price
- Note the displayed Entry, SL, and TP prices
- Set your broker's SL/TP to match indicator levels
### **Step 4: Manage Position**
- Watch for SL/TP lines on chart
- Monitor dashboard for trend changes
- Exit manually if opposite MA crossover occurs
- Let SL/TP do their job (don't move them!)
### **Step 5: Review & Learn**
- Track win rate over 20+ trades
- Adjust multipliers if needed
- Note which patterns work best for you
- Refine entry timing
***
## **Key Advantages**
✅ **Multi-confirmation approach** - Reduces false signals significantly
✅ **Automatic risk management** - No manual calculation needed
✅ **Adapts to volatility** - ATR-based SL/TP adjusts to market conditions
✅ **Volume filtered** - Ensures institutional participation
✅ **Visual clarity** - Easy to understand at a glance
✅ **Complete alert system** - Never miss opportunities
✅ **Pattern education** - Learn patterns as they appear
✅ **Works on all timeframes** - Scalping to swing trading
***
## **Limitations & Considerations**
⚠️ **Not a holy grail** - No strategy wins 100% of trades
⚠️ **Requires practice** - Demo trade first to understand signals
⚠️ **Market conditions matter** - Works best in trending or volatile markets
⚠️ **News events** - Avoid trading during major economic releases
⚠️ **Slippage on 5m** - Fast markets may have execution delays
⚠️ **Pattern subjectivity** - Some patterns may trigger differently than expected
***
## **Risk Management Rules**
1. **Never risk more than 1-2% per trade**
2. **Maximum 3 positions per day** (avoid overtrading)
3. **Don't trade during major news** (NFP, FOMC, etc.)
4. **Use proper position sizing** (0.01 lot per $100 for micro accounts)
5. **Keep trade journal** (track patterns, win rate, mistakes)
6. **Stop trading after 3 consecutive losses** (psychological reset)
7. **Don't move stop loss further away** (accept losses)
8. **Take partial profits** at 1:1 R:R if desired
***
## **Expected Performance**
**Realistic expectations:**
- **Win rate**: 50-65% (depending on market conditions and timeframe)
- **Risk:Reward**: 1:1.67 default (adjustable to 1:2 or 1:3)
- **Signals per day**: 3-8 on 5m, 1-3 on 1H
- **Best months**: High volatility periods (news events, economic uncertainty)
- **Drawdowns**: Expect 3-5 losing trades in a row occasionally
***
## **Customization Options**
All inputs are adjustable in settings panel:
**Moving Averages:**
- Type (SMA or EMA)
- All three period lengths
**Volume:**
- Volume MA length
- High volume multiplier threshold
**Chart Patterns:**
- Pattern strength (bars for pivot detection)
- Show/hide pattern labels
**Risk Management:**
- ATR period
- Stop loss multiplier
- Take profit multiplier
**Display:**
- Toggle pattern labels
- Customize colors (in code)
***
## **Conclusion**
This is a **professional-grade, multi-factor trading system** that combines the best of classical technical analysis with modern risk management. It's designed to give clear, actionable signals while automatically handling the complex calculations of stop loss and take profit levels.
**Best suited for traders who:**
- Understand basic technical analysis
- Can follow rules consistently
- Prefer systematic approach over gut feeling
- Want visual confirmation before entering trades
- Value proper risk management
**Start with demo trading** for at least 20-30 trades to understand how the signals work in different market conditions. Once comfortable and profitable on demo, transition to live trading with minimal risk per trade.
Happy trading! 📈🎯

MA 250 & 1250 + OverextensionThis indicator is designed for long-term and macro traders who use moving averages to identify structural support levels and potential overextended tops.
It plots two key simple moving averages:
250-day SMA (≈1-year average)
1250-day SMA (≈5-year average)
While the 1250-day MA often acts as strong support during major market bottoms, the 250-day MA serves as a dynamic reference for identifying potential tops.
The core innovation of this script is the addition of user-defined overextension zones above the 250-day MA:
+30% zone: highlights potential cyclical tops (ideal for less volatile assets)
+50% zone: marks extreme overextension levels (useful for volatile instruments)
You can independently choose which background zone to display:
"+30% only"
"+50% only"
"Both" (with +50% taking visual priority)
"None"
Visual cues include:
Colored circles when price enters each overextension zone
Optional semi-transparent background highlighting active zones
Clean, non-repainting logic based on closing prices
Use cases:
Confirming structural support near the 1250-day MA during deep corrections
Assessing risk/reward when price moves far above the 250-day MA
Avoiding late long entries in euphoric market phases
Identifying potential distribution zones in long-term uptrends
Note: This tool does not generate buy/sell signals on its own. It is intended as a contextual filter to complement price action, volume, momentum, and macro analysis.

Supertrend0913This Pine Script (`@version=6`) combines **two Supertrend indicators** and a set of **moving averages (EMA & MA)** into one overlay chart tool for TradingView.
**Key features:**
* **Supertrend \ & \ :**
* Each has independent ATR period, multiplier, and ATR calculation method.
* Plots trend lines (green/red for \ , blue/yellow for \ ).
* Generates **buy/sell signals** when trend direction changes.
* Includes **alert conditions** for buy, sell, and trend reversals.
* **Moving Averages:**
* 6 EMAs (lengths 21, 55, 100, 200, 300, 400).
* 5 SMAs (lengths 11, 23, 25, 39, 200).
* Each plotted in different colors for trend visualization.
👉 In short: it’s a **combined trading tool** that overlays two configurable Supertrend systems with alerts plus multiple EMAs/SMAs to help identify trend direction, signals, and potential entry/exit points.

ZLEMA Trend Index 2.0ZTI — ZLEMA Trend Index 2.0 (0–1000)
Overview
Price Mapped ZTI v2.0 - Enhanced Zero-Lag Trend Index.
This indicator is a significant upgrade to the original ZTI v1.0, featuring enhanced resolution from 0-100 to 0-1000 levels for dramatically improved price action accuracy. The Price Mapped ZTI uses direct price-to-level mapping to eliminate statistical noise and provide true proportional representation of market movements.
Key Innovation: Instead of statistical normalization, this version maps current price position within a user-defined lookback period directly to the ZTI scale, ensuring perfect correlation with actual price movements. I believe this is the best way to capture trends instead of directly on the charts using a plethora of indicators which introduces bad signals resulting in drawdowns. The RSI-like ZTI overbought and oversold lines filter valid trends by slicing through the current trading zone. Unlike RSI that can introduce false signals, the ZTI levels 1 to 1000 is faithfully mapped to the lowest to highest price in the current trading zone (lookback period in days) which can be changed in the settings. The ZTI line will never go off the beyond the ZTI levels in case of extreme trend continuation as the trading zone is constantly updated to reflect only the most recent bars based on lookback days.
Core Features
✅ 10x Higher Resolution - 0-1000 scale provides granular movement detection
✅ Adjustable Trading Zone - Customizable lookback period from 1-50 days
✅ Price-Proportional Mapping - Direct correlation between price position and ZTI level
✅ Zero Statistical Lag - No rolling averages or standard deviation calculations
✅ Multi-Strategy Adaptability - Single parameter adjustment for different trading styles
Trading Zone Optimization
📊 Lookback Period Strategies
Short-term (1-3 days):
Ultra-responsive to recent price action
Perfect for scalping and day trading
Tight range produces more sensitive signals
Medium-term (7-14 days):
Balanced view of recent trading range
Ideal for swing trading
Captures meaningful support/resistance levels
Long-term (21-30 days):
Broader market context
Excellent for position trading
Smooths out short-term market noise
⚡ Market Condition Adaptation
Volatile Markets: Use shorter lookback (3-5 days) for tighter ranges
Trending Markets: Use longer lookback (14-21 days) for broader context
Ranging Markets: Use medium lookback (7-10 days) for clear boundaries
🎯 Timeframe Optimization
1-minute charts: 1-2 day lookback
5-minute charts: 2-5 day lookback
Hourly charts: 7-14 day lookback
Daily charts: 21-50 day lookback
Trading Applications
Scalping Setup (2-day lookback):
Super tight range for quick reversals
ZTI 800+ = immediate short opportunity
ZTI 200- = immediate long opportunity
Swing Trading Setup (10-day lookback):
Meaningful swing levels captured
ZTI extremes = high-probability reversal zones
More stable signals, reduced whipsaws
Advanced Usage
🔧 Real-Time Adaptability
Trending days: Increase to 14+ days for broader perspective
Range-bound days: Decrease to 3 days for tighter signals
High volatility: Shorter lookback for responsiveness
Low volatility: Longer lookback to avoid false signals
💡 Multi-Timeframe Approach
Entry signals: Use 7-day ZTI on main timeframe
Trend confirmation: Use 21-day ZTI on higher timeframe
Exit timing: Use 3-day ZTI for precise exits
🌐 Session Optimization
Asian session: Shorter lookback (3-5 days) for range-bound conditions
London/NY session: Longer lookback (7-14 days) for trending conditions
How It Works
The indicator maps the current price position within the specified lookback period directly to a 0-1000 scale and plots it using ZLEMA (Zero Lag Exponential Moving Average) which has the least lag of the available popular moving averages:
Price at recent high = ZTI at 1000
Price at recent low = ZTI at 1
Price at mid-range = ZTI at 500
This creates perfect proportional representation where every price movement translates directly to corresponding ZTI movement, eliminating the false signals common in traditional oscillators.
This single, versatile indicator adapts to any market condition, timeframe, or trading style through one simple parameter adjustment, making it an essential tool for traders at every level.
Credits
ZLEMA techniques widely attributed to John Ehlers.
Disclaimer
This tool is for educational purposes only and is not financial advice. Backtest and forward‑test before live use, and always manage risk.
Please note that I set this as closed source to prevent source code cloning by others, repackaging and republishing which results in multiple confusing choices of the same indicator.

BTC Evaluation IndicatorBTC Evaluation Indicator
The BTC Evaluation Indicator is a volatility-based tool designed to help traders evaluate Bitcoin’s price behavior relative to its moving average trend. It combines customizable moving averages with dynamic standard deviation bands to identify overbought and oversold conditions.
Key Features
Flexible Moving Averages: Choose between SMA, EMA, WMA, VWMA, HMA, or RMA for the baseline trend.
Dynamic Volatility Bands: Upper and lower bands are calculated using standard deviation, scaled by a user-defined multiplier.
Visual Clarity:
Orange line = central moving average (trend mean)
Green line = upper band (potential overbought zone)
Red line = lower band (potential oversold zone)
Shaded gray area = volatility range
Automatic Highlights: Background shading marks when price breaks above the upper band (overbought) or below the lower band (oversold).
How to Use
When price pushes above the upper band, it may indicate overextension or potential local overbought conditions.
When price falls below the lower band, it may signal undervaluation or potential oversold conditions.
The mean line acts as a dynamic equilibrium, often serving as short-term support/resistance.
This indicator is designed for Bitcoin evaluation, but it can be applied to any asset. By combining trend analysis with volatility context, it helps traders better understand when price may be stretched and when conditions are reverting to the mean.

ASK Screener by AshpreetThe ASK Indicator is a custom-built breakout and trend continuation system designed for swing traders seeking high-probability entries with strong risk-reward ratios. Built using a combination of moving averages, momentum filters, volume confirmation, and price structure, this indicator helps identify stocks poised for explosive moves.
It uses three key moving averages: the 44-period SMA (medium trend), 20-period DEMA (short-term strength, custom-coded), and 50-period WEMA (institutional trendline). Trades are only triggered when the price is above 50 WEMA, and the 20 DEMA is above the 44 SMA.
Momentum is confirmed using RSI(14) within a healthy zone of 40–60, ensuring the stock is not overbought or oversold. To focus on breakout candidates, the stock must be trading within 10% of its 52-week high, and the weekly candle range must be under 10%, signaling compression before expansion.
A valid ASK Signal occurs when these conditions are met along with a breakout above the previous day’s high and volume exceeding 1.5× the 20-day average. Once triggered, the indicator auto-plots the stop-loss (1× ATR) and two profit targets: 1:2 (TP1) and 1:4 (TP2).
Additionally, the system detects a narrow range setup, where the last 3 daily candles are inside the previous 3-day range — a powerful consolidation signal. Alerts for both ASK entries and narrow ranges are included.
This system is ideal for positional and short-term swing traders who want to combine structure, momentum, and volume in one powerful tool.
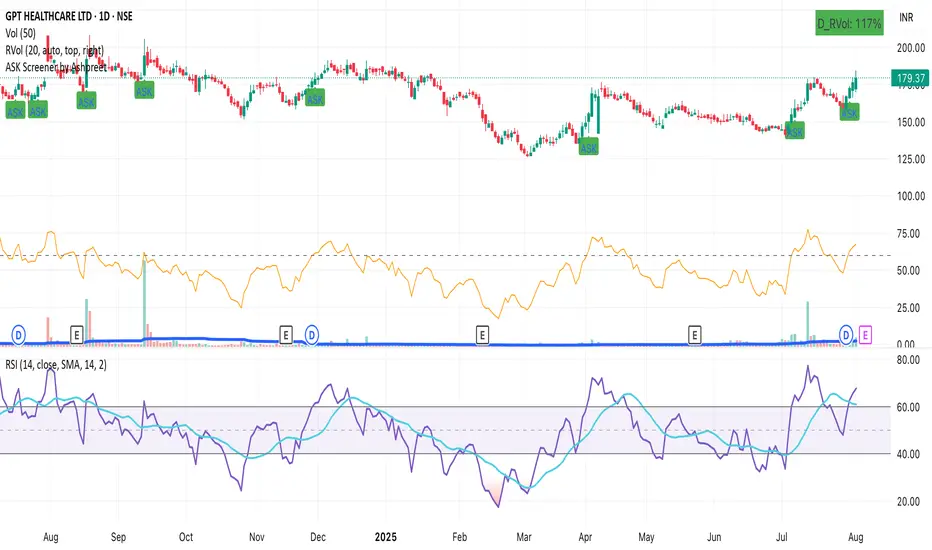
ASK Indicator by AshpreetThe ASK Indicator is a custom-built breakout and trend continuation system designed for swing traders seeking high-probability entries with strong risk-reward ratios. Built using a combination of moving averages, momentum filters, volume confirmation, and price structure, this indicator helps identify stocks poised for explosive moves.
It uses three key moving averages: the 44-period SMA (medium trend), 20-period DEMA (short-term strength, custom-coded), and 50-period WEMA (institutional trendline). Trades are only triggered when the price is above 50 WEMA, and the 20 DEMA is above the 44 SMA.
Momentum is confirmed using RSI(14) within a healthy zone of 40–60, ensuring the stock is not overbought or oversold. To focus on breakout candidates, the stock must be trading within 10% of its 52-week high, and the weekly candle range must be under 10%, signaling compression before expansion.
A valid ASK Signal occurs when these conditions are met along with a breakout above the previous day’s high and volume exceeding 1.5× the 20-day average. Once triggered, the indicator auto-plots the stop-loss (1× ATR) and two profit targets: 1:2 (TP1) and 1:4 (TP2).
Additionally, the system detects a narrow range setup, where the last 3 daily candles are inside the previous 3-day range — a powerful consolidation signal. Alerts for both ASK entries and narrow ranges are included.
This system is ideal for positional and short-term swing traders who want to combine structure, momentum, and volume in one powerful tool.
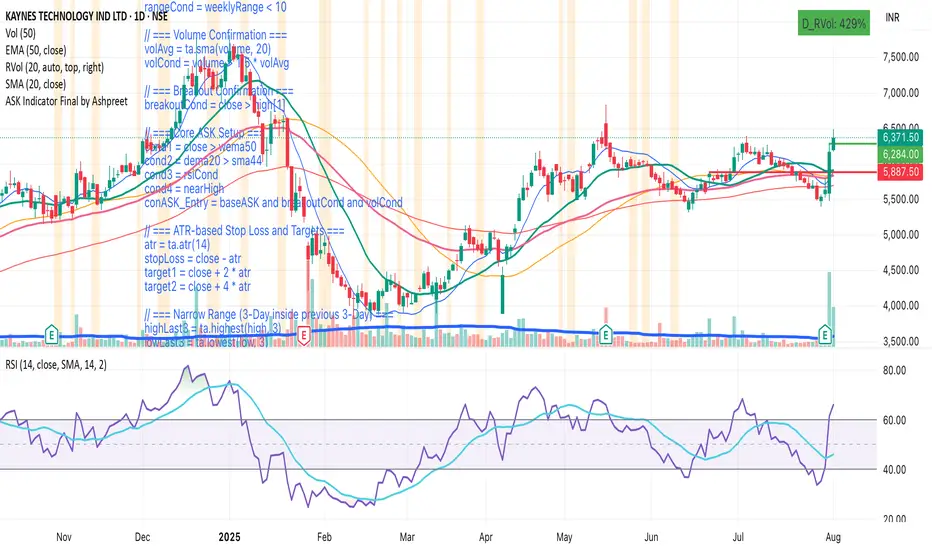
Vix_Fix Enhanced MTF [Cometreon]The VIX Fix Enhanced is designed to detect market bottoms and spikes in volatility, helping traders anticipate major reversals with precision. Unlike standard VIX Fix tools, this version allows you to control the standard deviation logic, switch between chart styles, customize visual outputs, and set up advanced alerts — all with no repainting.
🧠 Logic and Calculation
This indicator is based on Larry Williams' VIX Fix and integrates features derived from community requests/advice, such as inverse VIX logic.
It calculates volatility spikes using a customizable standard deviation of the lows and compares it to a moving high to identify potential reversal points.
All moving average logic is based on Cometreon's proprietary library, ensuring accurate and optimized calculations on all 15 moving average types.
🔷 New Features and Improvements
🟩 Custom Visual Styles
Choose how you want your VIX data displayed:
Line
Step Line
Histogram
Area
Column
You can also flip the orientation (bottom-up or top-down), change the source ticker, and tailor the display to match your charting preferences.
🟩 Multi-MA Standard Deviation Calculation
Customize the standard deviation formula by selecting from 15 different moving averages:
SMA (Simple Moving Average)
EMA (Exponential Moving Average)
WMA (Weighted Moving Average)
RMA (Smoothed Moving Average)
HMA (Hull Moving Average)
JMA (Jurik Moving Average)
DEMA (Double Exponential Moving Average)
TEMA (Triple Exponential Moving Average)
LSMA (Least Squares Moving Average)
VWMA (Volume-Weighted Moving Average)
SMMA (Smoothed Moving Average)
KAMA (Kaufman’s Adaptive Moving Average)
ALMA (Arnaud Legoux Moving Average)
FRAMA (Fractal Adaptive Moving Average)
VIDYA (Variable Index Dynamic Average)
This gives you fine control over how volatility is measured and allows tuning the sensitivity for different market conditions.
🟩 Full Control Over Percentile and Deviation Conditions
You can enable or disable lines for standard deviation and percentile conditions, and define whether you want to trigger on over or under levels — adapting the indicator to your exact logic and style.
🟩 Chart Type Selection
You're no longer limited to candlestick charts! Now you can use Vix_Fix with different chart formats, including:
Candlestick
Heikin Ashi
Renko
Kagi
Line Break
Point & Figure
🟩 Multi-Timeframe Compatibility Without Repainting
Use a different timeframe from your chart with confidence. Signals remain stable and do not repaint. Perfect for spotting long-term reversal setups on lower timeframes.
🟩 Alert System Ready
Configure alerts directly from the indicator’s panel when conditions for over/under signals are met. Stay informed without needing to monitor the chart constantly.
🔷 Technical Details and Customizable Inputs
This indicator includes full control over the logic and appearance:
1️⃣ Length Deviation High - Adjusts the lookback period used to calculate the high deviation level of the VIX logic. Shorter values make it more reactive; longer values smooth out the signal.
2️⃣ Ticker - Choose a different chart type for the calculation, including Heikin Ashi, Renko, Kagi, Line Break, and Point & Figure.
3️⃣ Style VIX - Change the visual style (Line, Histogram, Column, etc.), adjust line width, and optionally invert the display (bottom-to-top).
📌 Fill zones for deviation and percentile are active only in Line and Step Line modes
4️⃣ Use Standard Deviation Up / Down - Enable the overbought and oversold zone logic based on upper and lower standard deviation bands.
5️⃣ Different Type MA (for StdDev) - Choose from 15 different moving averages to define the calculation method for standard deviation (SMA, EMA, HMA, JMA, etc.), with dedicated parameters like Phase, Sigma, and Offset for optimized responsiveness.
6️⃣ BB Length & Multiplier - Adjust the period and multiplier for the standard deviation bands, similar to how Bollinger Bands work.
7️⃣ Show StdDev Up / Down Line - Enable or disable the visibility of upper and lower standard deviation boundaries.
8️⃣ Use Percentile & Length High - Activate the percentile-based logic to detect extreme values in historical volatility using a customizable lookback length.
9️⃣ Highest % / Lowest % - Set the high and low percentile thresholds (e.g., 85 for high, 99 for low) that will be used to trigger over/under signals.
🔟 Show High / Low Percentile Line - Toggle the visual display of the percentile boundaries directly on the chart for clearer signal reference.
1️⃣1️⃣ Ticker Settings – Customize parameters for special chart types such as Renko, Heikin Ashi, Kagi, Line Break, and Point & Figure, adjusting reversal, number of lines, ATR length, etc.
1️⃣2️⃣ Timeframe – Enables using SuperTrend on a higher timeframe.
1️⃣3️⃣ Wait for Timeframe Closes -
✅ Enabled – Displays Vix_Fix smoothly with interruptions.
❌ Disabled – Displays Vix_Fix smoothly without interruptions.
☄️ If you find this indicator useful, leave a Boost to support its development!
Every feedback helps to continuously improve the tool, offering an even more effective trading experience. Share your thoughts in the comments! 🚀🔥

Crypto_in_details_MAlibCrypto_in_details_MaLib — Advanced Moving Average Library for Pine Script
Overview:
Crypto_in_details_MaLib is a comprehensive, performance-optimized Moving Average (MA) library designed specifically for Pine Script v6 users seeking advanced technical analysis tools. Developed by Crypto_in_details, this library consolidates the most popular and sophisticated MA calculation methods — including classical, weighted, exponential, and Hull variants — into one seamless package.
Key Features:
Implements a wide range of Moving Averages: SMA, EMA, WMA, RMA, VWMA, HMA, TEMA, EHMA, THMA.
Designed for precision and flexibility — suitable for diverse trading strategies and indicator development.
Fully typed functions compatible with Pine Script v6 standards.
Simplifies your scripting workflow by providing ready-to-use MA functions via clean and easy-to-import methods.
Well-documented and maintained by an experienced Pine Script developer.
Why Use Crypto_in_details_MaLib?
Gain access to advanced MA calculations that enhance trend analysis, smoothing, and signal accuracy.
Save time on coding complex moving averages from scratch.
Easily extend or combine with your own strategies or indicators for improved performance.
Rely on a tested and community-driven solution backed by a prolific Pine Script author.
Ideal for:
Traders and developers building custom indicators or strategies requiring versatile MA techniques.
Anyone looking to improve their Pine Script efficiency and code maintainability.
Pine Script enthusiasts wanting a professional-grade MA toolkit.

UM Dual MA with Price Bar Color change & Fill
Description
This is a dual moving average indicator with colored bars and moving averages. I wrote this indicator to keep myself on the right side of the market and trends. It plots two moving averages, (length and type of MA are user-defined) and colors the MAs green when trending higher or red when trending lower. The price bars are green when both MAs are green, red when both MAs are red, and orange when one MA is green and the other is red. The idea behind the indicator is to be extremely visual. If I am buying a red bar, I ask myself "why?" If I am selling a green bar, again, "why?"
Recommended Usage
Configure your tow favorite Moving averages. Consider long positions when one or both turn green. Scale into a position with a portion upon the first MA turning green, and then more when the second turns green. Consider scaling out when the bars are orange after an up move.
Orange bars are either areas of consolidation or prior to major turns.
You can also look for MA crossovers.
The indicator works on any timeframe and any security. I use it on daily, hourly, 2 day charts.
Default settings
The defaults are the author's preferred settings:
- 8 period WMA and 16 period WMA.
- Bars are green when both MAs are trending higher, red when both MAs are trending lower, and orange when one MA is trending higher and the other is trending lower.
Moving average types, lengths, and colors are user-configurable. Bar colors are also user-configurable.
Alerts
Alerts can be set by right-clicking the indicator and selecting the dropdown:
- Bullish Trend Both MAs turning green
- Bearish Trend Both MAs turning red
- Mixed Trend, 1 green 1 red MA
Helpful Hints:
Look for bullish areas when both MAs turn green after a sustained downtrend
Look for bearish areas when both MAs turn red
Careful in areas of orange bars, this could be a consolidation or a warning to a potential trend direction change.
Switch up your timeframes, I toggle back and forth between 1 and 2 days.
Stretch your timeframe over a lower time frame; for example, I like the 8 and 16 daily WMA. With most securities I get 16 bars with pre and post market. This translates into 128 and 256 MAs on the hourly chart. This slows down moves and color transitions for better manageability.
Author's Subjective Observations
I like the 128/256 WMA on the hourly charts for leveraged and inverse ETFs such as SPXL/SPXS, TQQQ/SQQQ, TNA/TZA. Or even the volatility ETFs/ETNS: UVXY, VXX.
Here is a one-hour chart example:
I have noticed that as volatility increases, I should begin looking at higher timeframes. This seems counterintuitive, but higher volatility increases the level of noise or swings.
I question myself when I short a green bar or buy a red bar; "Why am I doing this?" The colors help me visually stay on the right side of trend. If I am going to speculate on a market turn, at least do it when the bars are orange (MA trends differ)
My last observation is a 2-day chart of leveraged ETFs with the 8 and 16 WMAs. I frequently trade SPXL, FNGA, and TNA. If you are really dissecting this indicator,
look at a few 2-day charts. 2-day charts seem to catch the major swings nicely up and down. They also weed out the daily sudden big swings such as a panic move from economic data
or tweets. When both the MAs turn red on a 2-day chart the same day or same bar, beware; this could be a rough ride or short opportunity. I found weekly charts too long for my style but good
to review for direction. Less decisions on longer charts equate to less brain damage for myself.
These are just my thoughts, of course you do you and what suits your style best! Happy Trading.

Multi-Symbol Trend DashboardMulti-Symbol Trend Dashboard - MA Cross Trend Monitor
Short Description
A customizable dashboard that displays trend direction across multiple symbols and timeframes using moving average crossovers.
Full Description
Overview
This Multi-Symbol Trend Dashboard allows you to monitor trend direction across 7 different symbols and 5 timeframes simultaneously in a single view. The dashboard uses moving average crossovers to determine trend direction, displaying bullish trends in green and bearish trends in red.
Key Features
Multi-Symbol Monitoring : Track up to 7 different trading instruments at once
Multi-Timeframe Analysis: View 5 different timeframes simultaneously for each instrument
Customizable Moving Averages: Choose between SMA, EMA, or WMA with adjustable periods
Visual Clarity: Color-coded cells provide immediate trend identification
Flexible Positioning: Place the dashboard anywhere on your chart
Customizable Appearance: Adjust sizes, colors, and text formatting
How It Works
The dashboard calculates a fast MA and slow MA for each symbol-timeframe combination. When the fast MA is above the slow MA, the cell shows green (bullish). When the fast MA is below the slow MA, the cell shows red (bearish).
Use Cases
Get a bird's-eye view of market trends across multiple instruments
Identify potential trading opportunities where multiple timeframes align
Monitor your watchlist without switching between charts
Spot divergences between related instruments
Track market breadth across sectors or related instruments
Notes and Limitations
Limited to 7 symbols and 5 timeframes due to TradingView's security request limits
Uses simple MA crossover as trend determination method
Dashboard is most effective when displayed on a dedicated chart
Performance may vary on lower-end devices due to multiple security requests
Settings Explanation
MA Settings: Configure the periods and types of moving averages
Display Settings: Adjust dashboard positioning and visual elements
Trading Instruments: Select which symbols to monitor (defaults to major forex pairs)
Timeframes: Choose which timeframes to display (default: M15, H1, H4, D1, W1)
Colors: Customize the color scheme for bullish/bearish indications and headers
This dashboard provides a straightforward way to maintain situational awareness across multiple markets and timeframes, helping traders identify potential setups and market conditions at a glance.

Dskyz Options Flow Flux (OFF) - FuturesDskyz Options Flow Flux (OFF) - Futures
*This is a repost due to moderator intervention on use of ™ in my scripts. I'm in the process of getting this rectified. This was originally posted around mid-night CDT.
🧠 The Dskyz Options Flow Flux (OFF) - Futures indicator is a game changer for futures traders looking to tap into institutional activity with limited resources. Designed for TradingView this tool simulates options flow data (call/put volume and open interest) for futures contracts like MNQ MES NQ and ES giving u actionable insights through volume spike detection volatility adjustments and stunning visuals like aurora flux bands and round number levels. Whether u’re a beginner learning the ropes or a pro hunting for an edge this indicator delivers real time market sentiment and key price levels to boost ur trading game
Key Features
⚡ Simulated Options Flow: Breaks down call/put volume and open interest using market momentum and volatility
📈 Spike Detection: Spots big moves in volume and open interest with customizable thresholds
🧠 Volatility Filter: Adapts to market conditions using ATR for smarter spike detection
✨ Aurora Flux Bands: Glows with market sentiment showing u bullish or bearish vibes at a glance
🎯 Round Number Levels: Marks key psychological levels where big players might step in
📊 Interactive Dashboard: Real time metrics like sentiment score and volatility factor right on ur chart
🚨 Alerts: Get notified of bullish or bearish spikes so u never miss a move
How It Works
🧠 This indicator is built to make complex options flow analysis simple even with the constraints of Pine Script. Here’s the step by step:
Simulated Volume Data (Dynamic Split):
Pulls daily volume for ur chosen futures contract (MNQ1! MES1! NQ1! ES1!)
Splits it into call and put volume based on momentum (ta.mom) and volatility (ATR vs its 20 period average)
Estimates open interest (OI) for calls and puts (1.15x for calls 1.1x for puts)
Formula: callRatio = 0.5 + (momentum / close) * 10 + (volatility - 1) * 0.1 capped between 0.3 and 0.7
Why It Matters: Mimics how big players might split their trades giving u a peek into institutional sentiment
Spike Detection:
Compares current volume/OI to short term (lookbackShort) and long term (lookbackLong) averages
Flags spikes when volume/OI exceeds the average by ur set threshold (spikeThreshold for regular highConfidenceThreshold for strong)
Adjusts for volatility so u’re not fooled by choppy markets
Output: optionsSignal (2 for strong bullish -2 for strong bearish 1 for bullish -1 for bearish 0 for neutral)
Why It Matters: Pinpoints where big money might be stepping in
Volatility Filter:
Uses ATR (10 periods) and its 20 period average to calculate a volatility factor (volFactor = ATR / avgAtr)
Scales spike thresholds based on market conditions (volAdjustedThreshold = spikeThreshold * max(1 volFactor * volFilter))
Why It Matters: Keeps ur signals reliable whether the market is calm or wild
Sentiment Score:
Calculates a call/put ratio (callVolume / putVolume) and adjusts for volatility
Converts it to a 0 to 100 score (higher = bullish lower = bearish)
Formula: sentimentScore = min(max((volAdjustedSentiment - 1) * 50 0) 100)
Why It Matters: Gives u a quick read on market bias
Round Number Detection:
Finds the nearest round number (e.g. 100 for MNQ1! 50 for MES1!)
Checks for volume spikes (volume > 3 period SMA * spikeThreshold) and if price is close (within ATR * atrMultiplier)
Updates the top activity level every 15 minutes when significant activity is detected
Why It Matters: Highlights psychological levels where price often reacts
Visuals and Dashboard:
Combines aurora flux bands glow effects round number lines and a dashboard to make insights pop (see Visual Elements below)
Plots triangles for call/put spikes (green/red for strong lime/orange for regular)
Sets up alerts for key market moves
Why It Matters: Makes complex data easy to read at a glance
Inputs and Customization
⚙️ Beginners can tweak these settings to match their trading style while pros can dig deeper for precision:
Futures Symbol (symbol): Pick ur contract (MNQ1! MES1! NQ1! ES1!). Default: MNQ1!
Short Lookback (lookbackShort): Days for short term averages. Smaller = more sensitive. Range: 1+. Default: 5
Long Lookback (lookbackLong): Days for long term averages. Range: 5+. Default: 10
Spike Threshold (spikeThreshold): How big a spike needs to be (e.g. 1.1 = 10% above average). Range: 1.0+. Default: 1.1
High Confidence Threshold (highConfidenceThreshold): For strong spikes (e.g. 3.0 = 3x average). Range: 2.0+. Default: 3.0
Volatility Filter (volFilter): Adjusts for market volatility (e.g. 1.2 = 20% stricter in volatile markets). Range: 1.0+. Default: 1.2
Aurora Flux Transparency (glowOpacity): Controls band transparency (0 = solid 100 = invisible). Range: 0 to 100. Default: 65
Show Show OFF Dashboard (showDashboard): Toggles the dashboard with key metrics. Default: true
Show Nearest Round Number (showRoundNumbers): Displays round number levels. Default: true
ATR Multiplier for Proximity (atrMultiplier): How close price needs to be to a round number (e.g. 1.5 = within 1.5x ATR). Range: 0.5+. Default: 1.5
Functions and Logic
🧠 Here’s the techy stuff pros will love:
Simulated Volume Data : Splits daily volume into call/put volume and OI using momentum and volatility
Volatility Filter: Scales thresholds with volFactor = atr / avgAtr for adaptive detection
Spike Detection: Flags spikes and assigns optionsSignal (2, -2, 1, -1, 0) for sentiment
Sentiment Score: Converts call/put ratio into a 0-100 score for quick bias reads
Round Number Detection: Identifies key levels and significant activity for trading zones
Dashboard Display: Updates real time metrics like sentiment score and volatility factor
Visual Elements
✨ These visuals make data come alive:
Gradient Background: Green (bullish) red (bearish) or yellow (neutral/choppy) at 95% transparency to show trend
Aurora Flux Bands: Stepped bands (linewidth 3) around a 14 period EMA ± ATR * 1.8. Colors shift with sentiment (green red lime orange gray) with glow effects at 85% transparency
Round Number Visualization: Stepped lines (linewidth 2) at key levels (solid if active dashed if not) with labels (black background white text size.normal)
Visual Signals: Triangles above/below bars for spikes (size.small for strong size.tiny for regular)
Dashboard: Bottom left table (2 columns 10 rows) with a black background (29% transparency) gray border and metrics:
⚡ Round Number Activity: “Detected” or “None”
📈 Trend: “Bullish” “Bearish” or “Neutral” (colored green/red/gray)
🧠 ATR: Current 10 period ATR
📊 ATR Avg: 20 period SMA of ATR
📉 Volume Spike: “YES” (green) or “NO” (red)
📋 Call/Put Ratio: Current ratio
✨ Flux Signal: “Strong Bullish” “Strong Bearish” “Bullish” “Bearish” or “Neutral” (colored green/red/gray)
⚙️ Volatility Factor: Current volFactor
📈 Sentiment Score: 0-100 score
Usage and Strategy Recommendations
🎯 For Beginners: Use high confidence spikes (green/red triangles) for easy entries. Check the dashboard for a quick market read (sentiment score above 60 = bullish below 40 = bearish). Watch round number levels for support/resistance
💡 For Pros: Combine flux signals with round number activity for high probability setups. Adjust lookbackShort/lookbackLong for trending vs choppy markets. Use volFactor for position sizing (higher = smaller positions)

BONK 1H Long Volatility StrategyGrok 1hr bonk strategy:
Key Changes and Why They’re Made
1. Indicator Adjustments
Moving Averages:
Fast MA: Changed to 5 periods (from, e.g., 9 on a higher timeframe).
Slow MA: Changed to 13 periods (from, e.g., 21).
Why: Shorter periods make the moving averages more sensitive to quick price changes on the 1-hour chart, helping identify trends faster.
ATR (Average True Range):
Length: Set to 10 periods (down from, e.g., 14).
Multiplier: Reduced to 1.5 (from, e.g., 2.0).
Why: A shorter ATR length tracks recent volatility better, and a lower multiplier lets the strategy catch smaller price swings, which are more common hourly.
RSI:
Kept at 14 periods with an overbought level of 70.
Why: RSI stays the same to filter out overbought conditions, maintaining consistency with the original strategy.
2. Entry Conditions
Trend: Requires the fast MA to be above the slow MA, ensuring a bullish direction.
Volatility: The candle’s range (high - low) must exceed 1.5 times the ATR, confirming a significant move.
Momentum: RSI must be below 70, avoiding entries at potential peaks.
Price: The close must be above the fast MA, signaling a pullback or trend continuation.
Why: These conditions are tightened to capture frequent volatility spikes while filtering out noise, which is more prevalent on a 1-hour chart.
3. Exit Strategy
Profit Target: Default is 5% (adjustable from 3-7%).
Stop-Loss: Default is 3% (adjustable from 1-5%).
Why: These levels remain conservative to lock in gains quickly and limit losses, suitable for the faster pace of a 1-hour timeframe.
4. Risk Management
The strategy may trigger more trades on a 1-hour chart. To avoid overtrading:
The ATR filter ensures only volatile moves are traded.
Trading fees (e.g., 0.5% on Coinbase) reduce the net profit to ~4% on winners and -3.5% on losers, requiring a win rate above 47% for profitability.
Suggestion: Risk only 1-2% of your capital per trade to manage exposure.
5. Visuals and Alerts
Plots: Blue fast MA, red slow MA, and green triangles for buy signals.
Alerts: Trigger when an entry condition is met, so you don’t need to watch the chart constantly.
How to Use the Strategy
Setup:
Load TradingView, select BONK/USD on the 1-hour chart (Coinbase pair).
Paste the script into the Pine Editor and add it to your chart.
Customize:
Adjust the profit target (e.g., 5%) and stop-loss (e.g., 3%) to your preference.
Tweak ATR or MA lengths if BONK’s volatility shifts.
Trade:
Look for green triangle signals and confirm with market context (e.g., volume or news).
Enter trades manually or via TradingView’s broker tools if supported.
Exit when the profit target or stop-loss is hit.
Test:
Use TradingView’s Strategy Tester to backtest on historical data and refine settings.
Benefits of the 1-Hour Timeframe
Faster Opportunities: Captures shorter-term uptrends in BONK’s volatile price action.
Responsive: Adjusted indicators react quickly to hourly changes.
Conservative: Maintains the 3-7% profit goal with tight risk control.
Potential Challenges
Noise: The 1-hour chart has more false signals. The ATR and MA filters help, but caution is needed.
Fees: Frequent trading increases costs, so ensure each trade’s potential justifies the expense.
Volatility: BONK can move unpredictably—monitor broader market trends or Solana ecosystem news.
Final Thoughts
Switching to a 1-hour timeframe makes the strategy more active, targeting shorter volatility spikes while keeping profits conservative at 3-7%. The adjusted indicators and conditions balance responsiveness with reliability. Backtest it on TradingView to confirm it suits BONK’s behavior, and always use proper risk management, as meme coins are highly speculative.
Disclaimer: This is for educational purposes, not financial advice. Cryptocurrency trading, especially with assets like BONK, is risky. Test thoroughly and trade responsibly.

Golden Death Cross IndicatorThis indicator uses moving average to detect both a Golden Cross and Death Cross on any timeframe but is recommended for use on the daily and 24 hour timeframes only.
We have also provided instructions on how to create alerts for these indicators below.
Happy Trading!
Moving Averages: We’ll use Simple Moving Averages (SMA). The 50-day SMA looks at the average price over the last 50 periods, and the 200-day SMA does the same for 200 periods.
Crossovers: We’ll check when the 50-day SMA crosses above (Golden Cross) or below the 200-day SMA (Death Cross).
Set Up Alerts
Now, let’s make sure you get notified when a cross happens:
Open the Alerts Menu
On the chart, click the bell icon (top right of the screen) to create an alert.
Configure the Golden Cross Alert
In the “Condition” dropdown, select “Cross Alerts” (the name of your script).
Below that, select “Golden Cross.”
Set “Once Per Bar Close” in the next dropdown (this ensures it only triggers after the period ends, avoiding false signals mid-bar).
Choose how you want to be notified (e.g., popup, email, or phone app—set this under “Notifications”).
Name the alert (e.g., “Golden Cross Alert”) and click “Create.”
Configure the Death Cross Alert
Click the bell icon again to create a second alert.
Condition: “Cross Alerts” > “Death Cross.”
Set “Once Per Bar Close” again.
Choose your notification method.
Name it (e.g., “Death Cross Alert”) and click “Create.”
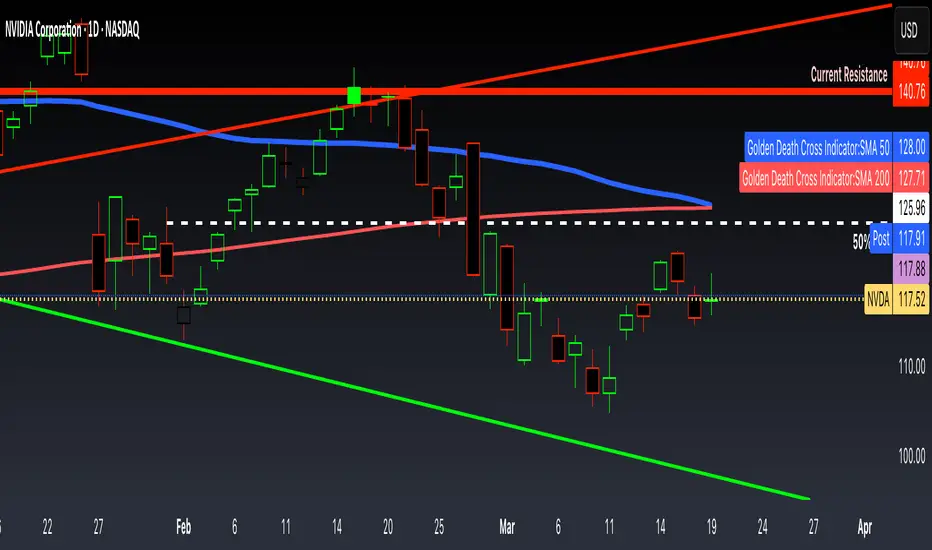
Moving Average Shift [ChartPrime]Moving Average Shift indicator combines multiple moving average (MA) types with a unique MA Shift Oscillator to help traders visualize trend direction, price deviations, and mean reversion states.
⯁ KEY FEATURES
Customizable Moving Averages: Choose from SMA, EMA, SMMA (RMA), WMA, or VWMA.
Trend-Based Coloring: Candles are dynamically colored based on price position relative to the MA.
MA Shift Oscillator: Identifies price deviations and potential mean reversion zones.
Threshold Filtering: Helps filter mean reversion signals using a user-defined threshold.
Diamond Signals for Mean Reversion: Plots diamonds on the chart when the oscillator crosses back above or below the threshold level.
Oscillator Color Coding: The oscillator has four color states:
Color 1: Above 0 and increasing.
Color 2: Above 0 and decreasing.
Color 3: Below 0 and increasing.
Color 4: Below 0 and decreasing.
⯁ HOW TO USE
Use the indicator to follow the trend based on MA direction and price relation to it.
The MA Shift Oscillator helps identify potential mean reversion points where price may revert toward the MA.
The threshold setting allows traders to filter out weak mean reversion signals and focus on significant shifts.
The four-color oscillator visually indicates trend momentum and potential trend shifts.
⯁ CONCLUSION
The Moving Average Shift indicator is a powerful tool that merges trend-following and mean reversion strategies into one comprehensive system. By allowing traders to select different types of moving averages, it provides flexibility in trend analysis while visually enhancing price action with dynamic candle coloring. The MA Shift Oscillator further strengthens decision-making by detecting deviations and highlighting potential mean reversion points.
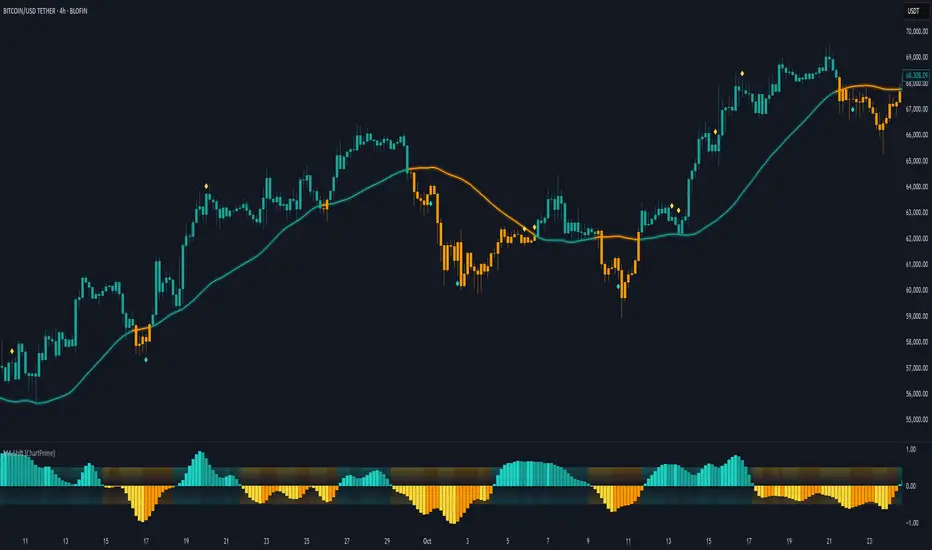
Volume Delta with PVSRAVolume Delta with PVSRA
Volume Delta with PVSRA is an advanced volume indicator that dissects each bar’s volume into its directional components using higher resolution data. It visually distinguishes between buying and selling volume, so that for a bullish candle the bottom portion represents buying volume and for a bearish candle it represents selling volume. A dot is plotted at the 50% mark of the candle’s total volume, serving as a clear reference point.
Key Features:
Directional Volume Breakdown:
The indicator calculates the delta volume by analyzing lower timeframe data. The bottom portion of a bullish candle (displayed in green) represents buying volume, while that of a bearish candle (displayed in red) represents selling volume.
PVSRA Analysis:
Using Price-Volume Spread Range Analysis, the indicator compares the current volume to the 10-bar average. When volume is significantly higher (using thresholds of 150% and 200%), the candle borders are highlighted in custom colors, indicating medium or strong volume conditions.
Volume Moving Averages:
Three moving averages are plotted:
Total Volume MA (yellow): Tracks overall volume.
Buying Volume MA (green) and Selling Volume MA (red): These are re-centered around the total volume MA. A crossover of the green over the red typically signals rising buying pressure, while the opposite indicates increasing selling pressure.
Scalable Volume Bars:
The indicator scales the volume bars to provide optimal visualization on your chart.
Setup Instructions:
For best results, open your chart settings, navigate to the Canvas tab, and set the bottom margin to 0%. This ensures the indicator displays like a standard volume indicator without any unwanted gaps at the bottom.
Customize the various settings—including colors, border opacity, and moving average parameters—to suit your trading style.

Dynamic RSI Bollinger Bands with Waldo Cloud
TradingView Indicator Description: Dynamic RSI Bollinger Bands with Waldo Cloud
Title: Dynamic RSI Bollinger Bands with Waldo Cloud
Short Title: Dynamic RSI BB Waldo
Overview:
Introducing an experimental indicator, the Dynamic RSI Bollinger Bands with Waldo Cloud, designed for adventurous traders looking to explore new dimensions in technical analysis. This indicator overlays on your chart, providing a unique perspective by integrating the Relative Strength Index (RSI) with Bollinger Bands, creating a dynamic trading tool that adapts to market conditions through the lens of momentum and volatility.
What is it?
This innovative indicator combines the traditional Bollinger Bands with the RSI in a way that hasn't been commonly explored. Here's a breakdown:
RSI Integration: The RSI is calculated with customizable length settings, and its values are used not just for momentum analysis but as the basis for the Bollinger Bands. This means the position and width of the bands are directly influenced by the RSI, offering a visual representation of momentum within the context of price volatility.
Dynamic Bollinger Bands: Instead of using price directly, the Bollinger Bands are calculated using a scaled version of the RSI. This scaling is done to fit the RSI values into the price range, ensuring the bands are relevant to the actual price movement. The standard deviation for these bands is also scaled accordingly, providing a unique volatility measure that's momentum-driven.
Waldo Cloud: Named after a visual representation concept, the 'Waldo Cloud' refers to the colored area between the Bollinger Bands, which changes based on various conditions:
Purple when RSI is overbought.
Blue when RSI is oversold.
Green for bullish conditions, defined by the fast-moving average crossing above the slow one, RSI is bullish, and the price is above the slow MA.
Red for bearish conditions, when the fast MA crosses below the slow MA, the RSI is bearish, and the price is below the slow MA.
Gray for neutral market conditions.
Moving Averages: Two simple moving averages (Fast MA and Slow MA) are included, which can be toggled on or off, offering additional trend analysis through crossovers.
How to Use It:
Given its experimental nature, this indicator should be used with caution and in conjunction with other analysis methods:
Identifying Market Conditions: Use the color of the Waldo Cloud to gauge market sentiment. A green cloud might suggest a good time to consider long positions, while a red cloud could indicate potential shorting opportunities. Purple and blue clouds highlight extreme conditions that might precede reversals.
Volatility and Momentum: The dynamic nature of the Bollinger Bands based on RSI provides insight into how momentum is affecting price volatility. When the bands are wide, it might indicate high momentum and potential trend continuation or reversal, depending on the RSI's position relative to its overbought/oversold levels.
Trend Confirmation: The moving average crossovers can act as confirmation signals. For instance, a bullish crossover (fast MA over slow MA) within a green cloud might strengthen a buy signal, whereas a bearish crossover in a red cloud might reinforce a sell decision.
Customization: Adjust the RSI length, overbought/oversold levels, and moving average lengths to suit different trading styles or market conditions. Experiment with these settings to find what works best for your strategy.
Combining with Other Indicators: Since this is an experimental tool, it's advisable to use it alongside established indicators like traditional Bollinger Bands, MACD, or trend lines to validate signals.
Conclusion:
The Dynamic RSI Bollinger Bands with Waldo Cloud is an experimental venture into combining momentum with volatility visually and interactively. It's designed for traders who are open to exploring new methods of market analysis.
Remember, due to its experimental status, this indicator should be part of a broader trading strategy, and backtesting or paper trading is recommended before applying it in live trading scenarios. Keep an eye on how the market reacts to the signals provided by this indicator and always consider risk management practices.

Liquidity ZonesLiquidity Zones Indicator
The Liquidity Zones indicator is a custom Pine Script™ tool designed to identify significant price levels where high trading volume has occurred. These zones often act as support or resistance levels, providing valuable insights for traders.
Key Features:
Window Size: The number of bars to consider for calculating the moving averages and identifying peaks.
Tolerance: The allowable percentage difference to consider peaks as unique.
Number of Peaks: The maximum number of significant peaks to identify.
Minimum Volume: The minimum volume threshold relative to the average volume to consider a peak.
Minimum Range: The minimum price range to consider a peak.
How It Works:
Input Parameters: The user can customize the window size, tolerance, number of peaks, minimum volume, and minimum range.
Moving Averages: The script calculates the simple moving average (SMA) of the volume and closing prices over the specified window.
Peak Identification:
For each bar, the script identifies the bar with the highest volume within the window.
It checks if the volume exceeds the minimum volume threshold.
It determines the peak price based on whether the bar closed higher or lower than it opened.
It ensures the price range of the bar exceeds the minimum range.
It checks if the peak is above the SMA of the closing prices.
It verifies the peak is unique within the specified tolerance.
Plotting Peaks: The identified peaks are plotted on the chart with lines and labels, color-coded based on whether the bar closed higher (green) or lower (red).
This indicator helps traders visualize key liquidity zones, aiding in making informed trading decisions.
