30-10-3 MAX,min dinamici Supported timeframes: The script works only on timeframes of 1 minute or lower (including second-based timeframes).
Displayed levels: The highs and lows of the last closed candle are plotted for the 30-minute, 10-minute, and 3-minute timeframes.
Updates: The levels update only when a candle closes in the respective timeframe (e.g., every 30 minutes for the 30m levels).
Visualization: Dashed lines for highs and lows (blue for 30m, green for 10m, red for 3m).
Labels indicating "Max 30m", "Min 30m", etc., positioned above the highs and below the lows.
Cerca negli script per "a股近10年第二天溢价的股票"

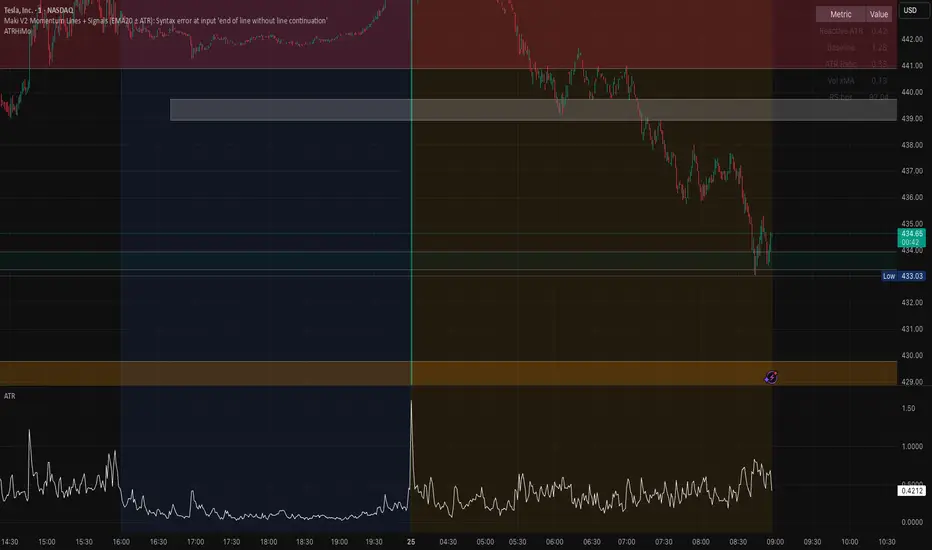
Opening ATR + High Momentum (10/30/60)this is a custom momentum indicator using atr
A fixed, compiling Pine v5 script is below with the three issues corrected: no plots in local scope, a ≤10-character shorttitle, and cleaned ternaries/formatting that remove the “end of line without line continuation” error.
QQQ Ladder → Adjusted to Active Ticker (5s & 10s)This indicator allows you to a grid of QQQ levels directly on futures chart like NQ, MNQ, ES and MES, automatically adjusting for the spread between the displayed symbol and QQQ. This is particularly useful for traders who perform technical analysis on QQQ but execute trades on Futures.
Features:
Renders every 5 and 10 points steps of QQQ in your current chart.
The script adjusts these levels in real-time based on the current spread between QQQ and the displayed symbol!
Plots updated horizontal lines that move with the spread
Supports Multiple Tickers, ES1!, MES1!, NQ1!, MNQ1! SPY and SPX500USD.

NDX Ladder → Adjusted to Active Ticker (5s & 10s)This indicator allows you to a grid of NDX levels directly on the NQ! (E-mini NASDAQ 100 Futures) chart, automatically adjusting for the spread between NDX and NQ1!. This is particularly useful for traders who perform technical analysis on SPX but execute trades on NQ1!.
Features:
Renders every 5 and 10 points steps of the NDX in your current chart.
The script adjusts these levels in real-time based on the current spread between NDX and NQ / MNQ
Plots updated horizontal lines that move with the spread

SPX Ladder → Adjusted to Active Ticker (5s & 10s)This indicator allows you to a grid of SPX levels directly on the ES1! (E-mini S&P 500 Futures) chart, automatically adjusting for the spread between SPX and ES1!. This is particularly useful for traders who perform technical analysis on SPX but execute trades on ES1!.
Features:
Renders every 5 and 10 points steps of the SPX in your current chart.
The script adjusts these levels in real-time based on the current spread between SPX and ES1!
Plots updated horizontal lines that move with the spread
Supports Multiple Tickers, ES1!, SPY and SPX500USD.
Ideal for futures traders who want SPX context while trading ES1!.

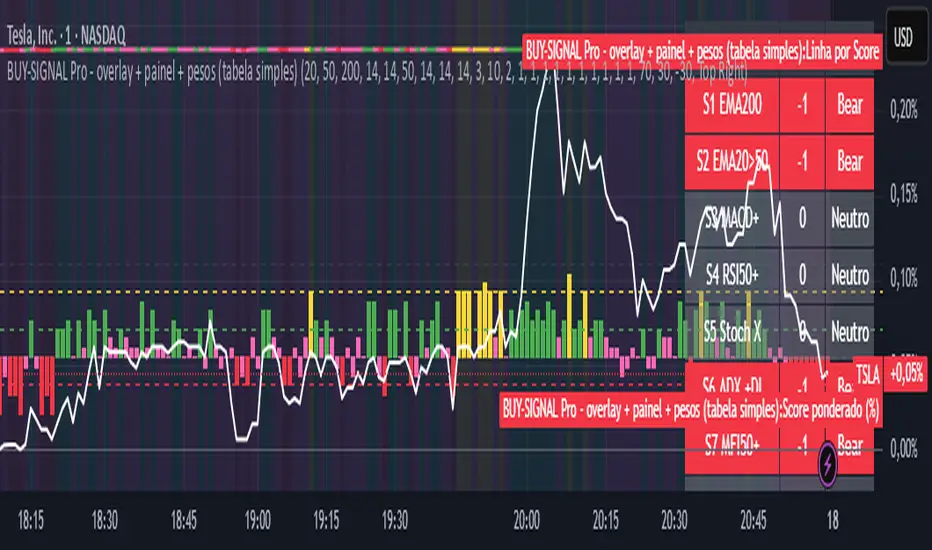
BUY-SIGNAL Pro - 10 Indicators - Strategy Godinho 2Best 10 indicators
Strong buy YELLOW
Buy GREEN
Hold PINK
Sell RED
MA 10/20/50A Simple MA array including 10, 20, and 50 day.
Used primarily for determining crypto bullish or bearish technical trending primarily on the 1-day chart.

EMA 10/20/50/100/200plot 10, 20, 50,100,200 EMA on the chart. can be used to determine on any timeframe EMA
EMA 10/20 Crossover BackgroundThis script works best on a weekly chart and it taints the background green if the EMA-10 is larger than EMA-20 (EMA lengths can be configured) and red otherwise. I use this script to immediately determine if a market is trending upwards or downwards.

EMA 10,20 SMA 50, 200This indicator is very helpful for swing traders who plan their trades using EMAs and SMAs. It is used on the daily chart and displays the 10- and 20-EMA, as well as the 50- and 200-SMA.

🔫 10:00 AM Candle Range – Bhavishya Sniper ScriptMarks the 10:00 AM candle high and low for intraday breakout trading. Designed for Bhavishya’s sniper entry system during Trading Reset 3.0."

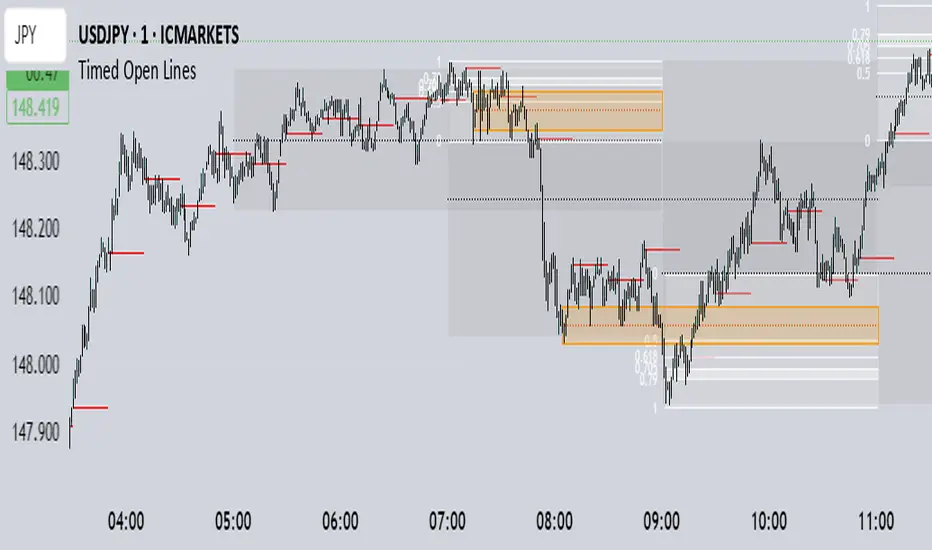
Bill Mensah - 10 / 30 / 50 Minute Open Lines Scientia maledictus sum.
Opening Macro lines extended, 10 / 30 / 50 Minute Open Lines
EMA 10/20/50 Alignment Strategy### 📘 **Strategy Name**
**EMA 10/20/50 Trend Alignment Strategy**
---
### 📝 **Description (for Publishing)**
This strategy uses the alignment of Exponential Moving Averages (EMAs) to identify strong bullish trends. It enters a long position when the short-term EMA is above the mid-term EMA, which is above the long-term EMA — a classic sign of trend strength.
#### 🔹 Entry Criteria:
* **EMA10 > EMA20 > EMA50**: A bullish alignment that signals momentum in an upward direction.
* The strategy enters a **long position** when this alignment occurs.
#### 🔹 Exit Criteria:
* The long position is closed when the EMA alignment breaks (i.e., the trend weakens or reverses).
#### 🔹 Additional Features:
* Includes a **date range filter**, allowing you to backtest the strategy over a specific period.
* Uses **100% of available capital** for each trade (position size auto-scales with account balance).
* No short positions, stop loss, or take profit are applied — this is a trend-following strategy meant to ride bullish moves.
---
### ✅ Best For:
* Traders looking for a **simple, trend-based entry system**
* Testing price momentum strategies during specific market regimes
* Visualizing EMA stacking patterns in historical data

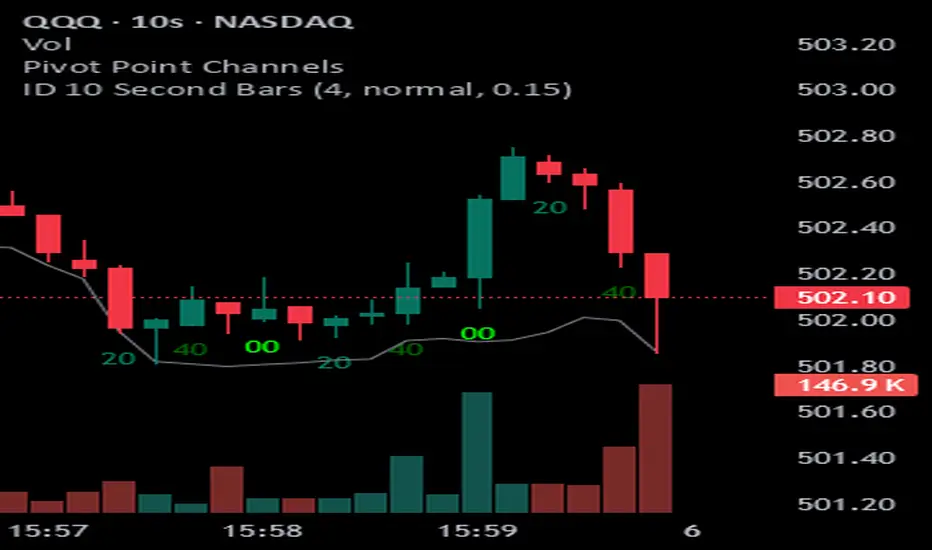
ID 10 Second BarsEnters numbers 1, 3 and 5 under the appropriate bars on the 10 second chart and permits you to adjust the colors of each number.
SMA 10/20 Trend Info Table - QullamaggieThe Qullamaggie Index Trend Filter is a momentum-based technical indicator designed to identify strong bullish or bearish trends in the market by analyzing the relationship and movement of two simple moving averages (SMAs): the 10-period SMA and the 20-period SMA. It simplifies trend analysis and provides clear visual cues for traders to align their trades with the prevailing market direction.

ORB Daily 10 min (9:30am-3pm)This script implements the Opening Range Breakout (ORB) strategy for the New York trading session, specifically from 9:30 AM to 3:00 PM (Eastern Time). It identifies the high and low of the first 10 minutes (the first two 5-minute candles) after the market opens and draws a box representing this range. The box remains on the chart throughout the day until 3:00 PM. This strategy is useful for traders looking to trade breakouts of the opening range, often indicating potential trends or reversals.

krw -> 10 millionkrw price
each number show 10 millon
default num is 1, that means volume isn't usd. so if you use usd volume, you can change krw? indicator num to all number not 1.
and you can change exchange_rate to another num.

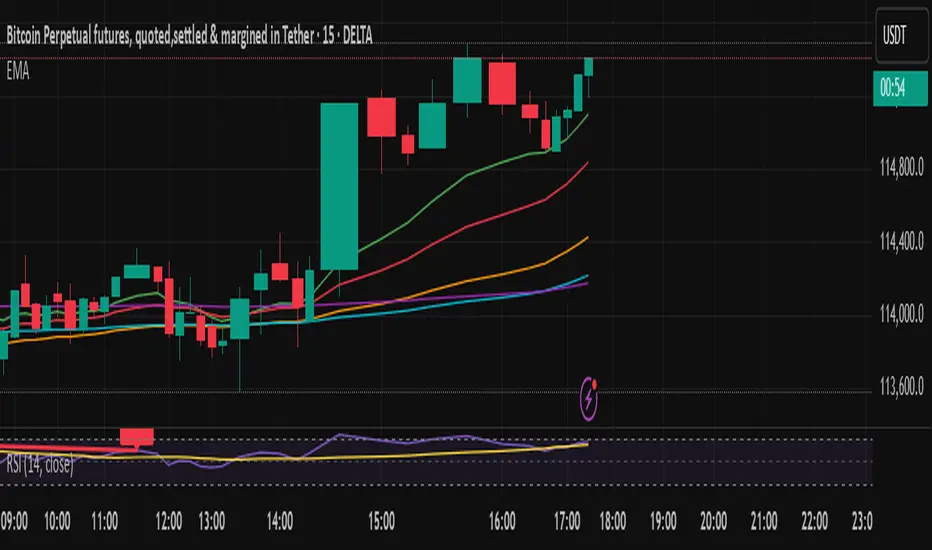
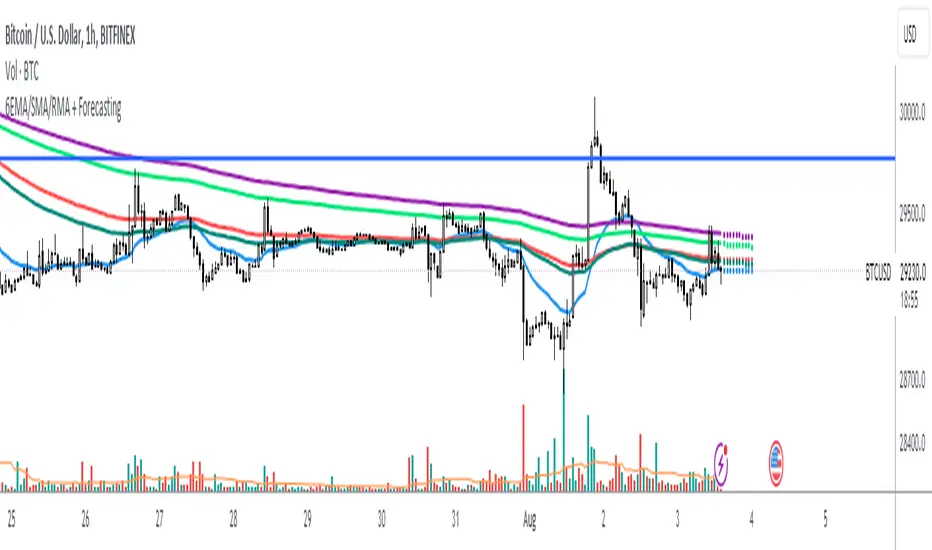
6 EMA/SMA/RMA + Forecasting 10 candles 6EMA/SMA/RMA + Forecasting 10 candles
The script allows the user to choose between different types of moving averages (SMA, EMA, RMA) using the soft_func_choice input.
The user can also choose between two types of forecasting: "Repetition" or "Linear Regression" using the type_of_forecast input.
For the linear regression forecast, the user can specify the number of candles to use in the linear regression calculation using the Linreglen input.
First Moving Average (MA) Calculation:
The script calculates the first MA based on the selected type (SMA, EMA, RMA) and plots it on the chart.
The user can customize the length and source of data for this MA.
If the selected forecast type is "Repetition," the script also calculates additional offset values for different repetitions of the MA.
Forecasting and Offset Calculation:
Depending on the chosen forecast type, the script calculates additional offset values for the MA. These offsets are used to forecast the future values of the MA.
The script calculates offsets for up to five repetitions (offset1, offset2, ..., offset5) for each MA.
If the forecast type is "Linear Regression," the script combines the MA's historical values with linear regression predictions to generate the forecasted values.
Plotting Additional Moving Averages:
The script allows the user to plot up to four additional MAs (Second MA, Third MA, Fourth MA, Fifth MA) with similar customizable settings for length and source of data.
Forecast Repetition:
If the forecast type is "Repetition," the script iterates through historical data and accumulates offset values, effectively simulating a repeated forecasting approach.
This repetition is controlled by a loop that adjusts the offset values based on historical price data.
Overall, this script provides a versatile tool for analyzing and forecasting multiple moving averages using various methods, allowing traders and analysts to experiment with different MA types and forecast strategies on their chosen price series.
Day's First Candle High & Low and + or - 10 pointThis code is an indicator that calculates and plots the high and low of the first candle of the day, along with parallel lines. The purpose of the indicator is to help traders identify potential support and resistance levels for the day.
The code checks if a new day has started and, if so, calculates the high and low of the first candle of the day. It then plots the high and low as well as parallel lines that are 200 ticks (10 points) above and below the first candle's high and low, respectively.
The resulting plot shows the first candle's high and low, as well as the upper and lower boundaries that may act as support and resistance levels throughout the trading day.

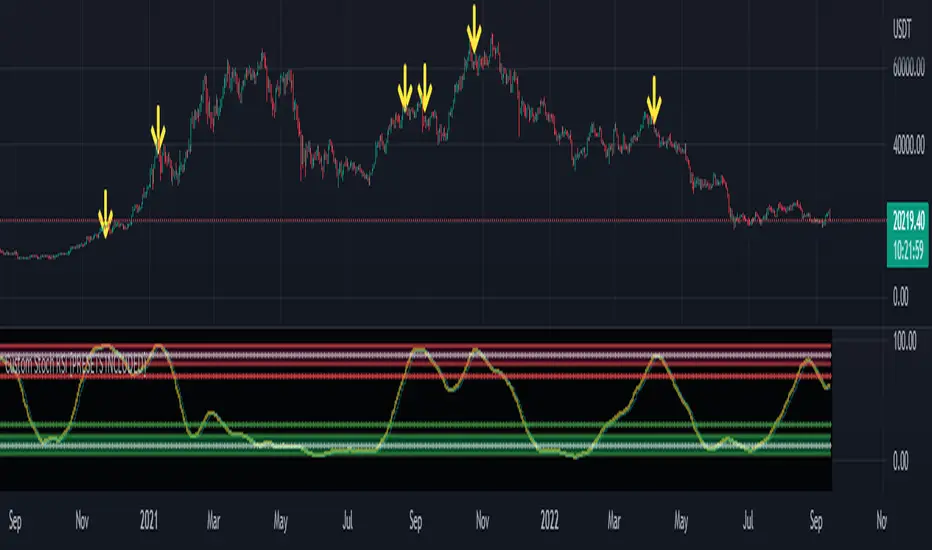
Customisable Stoch RSI [10 PRESETS INCLUDED]Customisable Stochastic by Nicholas Kormanik
A stochastic oscillator is a momentum indicator comparing a particular closing price of a security to a range of its prices over a certain period of time.
The sensitivity of the oscillator to market movements is reducible by adjusting that time period or by taking a moving average of the result.
It is used to generate overbought and oversold trading signals, utilizing a 0–100 bounded range of values.
In this version we have 4 levels
top levels are
95 - extra overbought
80 - semi-extra overbought
70 - standart overbought
bottom levels are
5 - extra oversold
20 - semi-extra oversold
30 - standart oversold
Message by Nicholas Kormanik :
" The formula I've adopted was put on the Silicon Investor web site thread by
'bdog'. Basically, I just leave the Slowing Periods (mp3) to 1, so it
really plays no part in things. However, if somebody presents a good
argument for using other than 1 ... hey, I'm amenable.
Chande, the original inventor, didn't use a moving average on the whole
thing. Chande's result was therefore sort of choppy. I guess along the way
people decided to add the EMA Periods to smooth things out. "
There are 10 presets, try to find your best!
1. 5 -- 5 -- 3
2. 8 -- 8 -- 5
3. 13 -- 13 -- 13
4. 21 -- 15 -- 13
5. 21 -- 21 -- 13
6. 34 -- 34 -- 13
7. 55 -- 55 -- 21
8. 89 -- 13 -- 34
9. 89 -- 89 -- 21
10. 233 -- 233 -- 34
On the chart im using 9th preset and the timeframe is daily on BTCUSD pair.
*DISCLAIMER*
Use this indicator for educational purpose only, i don't recommend you to use it to trade for real money!
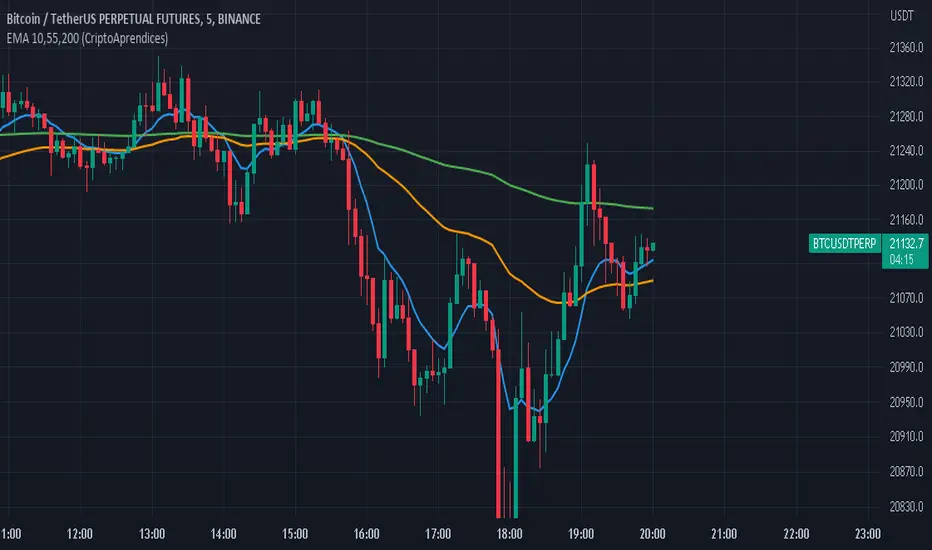
EMA 10,55,200 (CriptoAprendices) CriptoAprendices
Media Móvil Exponencial (EMA'S )de 10,55 Y 200 en Un Solo Indicador