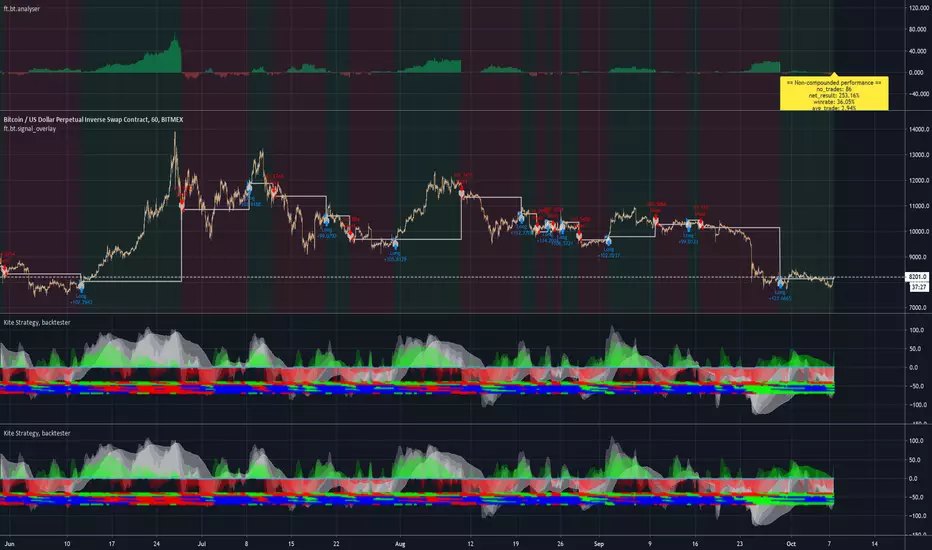
Kite Strategy, backtesterThis is an alertable version of the Kite-Crossing-Oscillator-backtester . One can use the strategy version to optimize settings and subsequently this version to create automated alerts on those settings. Alternatively one can also use the ft.bt.analyser to analyse/optimize this study performance directly by selecting the signal line as input. Happy trading!
Cerca negli script per "backtest"
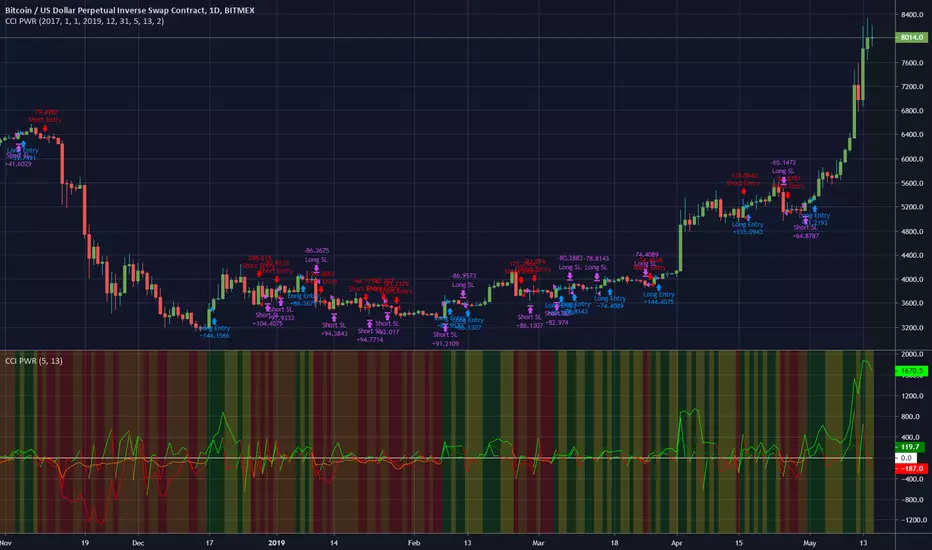
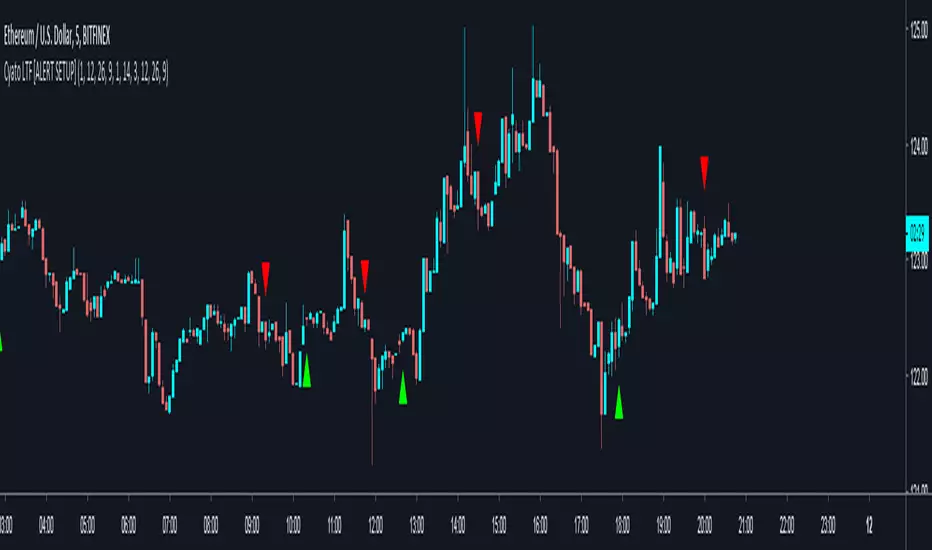
CCI PWRThis is a backtest for my CCI PWR indicator here . It works very well on a daily chart but may be useful for lower timeframes.
You can change the backtest settings to test different periods of time.
I have included a stop-loss function that will exit a trade if the price goes against the signals. The parameter is an integer that represents a %age of the current price, so for example, a value of 2 would mean a stoploss is set 2% below a long entry or 2% above a short entry.
Here is an image of ETH/BTC with the same settings.
Let me know if you find it useful!
Machine Learning RSI Bands V3The Machine Learning RSI Bands V3 is a cutting-edge trading tool designed to provide actionable insights by combining the strength of machine learning with a traditional RSI framework. It adapts dynamically to changing market conditions, offering traders a robust, data-driven approach to identifying opportunities.
Let’s break down its functionality and the logic behind each input to give you a clear understanding of how it works and how you can use it effectively.
RSI Parameters RSI Source (rsisrc): Choose the data source for RSI calculation, such as the closing price. This allows you to focus on the specific price data that aligns with your trading strategy. RSI Length (rsilen): Set the number of periods used for RSI calculation. A shorter length makes the RSI more reactive to price changes, while a longer length smooths out volatility. These inputs allow you to customize the foundational RSI calculations, ensuring the indicator fits your style of trading.
Band Limits Lower Band Limit (lb): Defines the RSI value below which the market is considered oversold. Upper Band Limit (ub): Defines the RSI value above which the market is considered overbought. These settings give you control over the thresholds for market conditions. By adjusting the band limits, you can tailor the indicator to be more or less sensitive to market movements.
Sampling and Reaction Settings Target Reaction Size (l): Determines the number of bars used to define pivot points. Smaller values react to shorter-term price movements, while larger values focus on broader trends. Backtesting Reaction Size (btw): Sets the number of bars used to validate signal performance. This ensures signals are only considered valid if they perform consistently within the specified range. Data Format (version): Choose between Absolute (ignoring direction) and Directional (incorporating directional price changes). Sampling Method (sm): Select how the data is analyzed—options include Price Movement, Volume Movement, RSI Movement, Trend Movement, or a Hybrid approach. These settings empower you to refine how the indicator processes and interprets data, whether focusing on short-term price shifts or broader market trends.
Signal Settings Signal Confidence Method (cm): Choose between: Threshold: Signals must meet a confidence limit before being generated. Voting: Requires a majority of 5 signal components to confirm a trade. Confidence Limit (cl): Defines the confidence threshold for generating signals when using the Threshold method. Votes Needed (vn): Sets the number of votes required to confirm a trade when using the Voting method. Use All Outputs (fm): If enabled, signals are generated without filtering, providing an unfiltered view of potential opportunities. This section offers a balance between precision and flexibility, enabling you to control the rigor applied to signal generation.
How It Works
The script uses machine learning models to adaptively calculate dynamic RSI bands. These bands adjust based on market conditions, providing a more responsive and nuanced interpretation of overbought and oversold levels.
Dynamic Bands: The lower and upper RSI bands are recalibrated using machine learning to reflect current market conditions. Signals: Long and short signals are generated when RSI crosses these bands, with additional filters applied based on your chosen confidence method and sampling settings. Transparency: Real-time success rates and profit factors are displayed on the chart, giving you clear feedback on the indicator's performance.
Why Use Machine Learning RSI Bands V3?
This indicator is built for traders who want more than static thresholds and generic signals. It offers:
Adaptability: Machine learning dynamically adjusts the indicator to market conditions. Customizability: Each input serves a specific purpose, giving you full control over its behavior. Accountability: With built-in performance metrics, you always know how the tool is performing.
This is a tool designed for those who value precision and adaptability in trading.

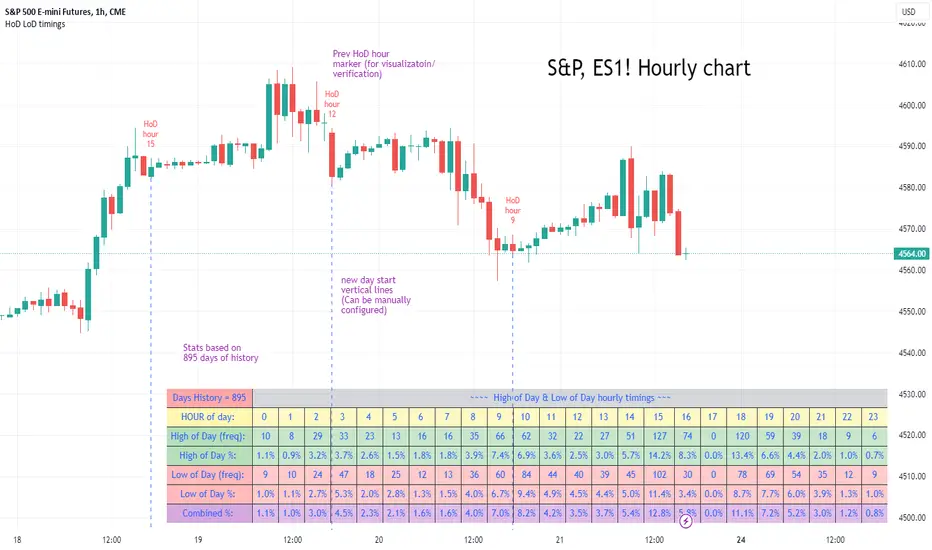
High of Day Low of Day hourly timings: Statistics. Time of day %High of Day (HoD) & Low of Day (LoD) hourly timings: Statistics. Time of day % likelihood for high and low.
//Purpose:
To collect stats on the hourly occurrences of HoD and LoD in an asset, to see which times of day price is more likely to form its highest and lowest prices.
//How it works:
Each day, HoD and LoD are calculated and placed in hourly 'buckets' from 0-23. Frequencies and Percentages are then calculated and printed/tabulated based on the full asset history available.
//User Inputs:
-Timezone (default is New York); important to make sure this matches your chart's timezone
-Day start time: (default is Tradingview's standard). Toggle Custom input box to input your own custom day start time.
-Show/hide day-start vertical lines; show/hide previous day's 'HoD hour' label (default toggled on). To be used as visual aid for setting up & verifying timezone settings are correct and table is populating correctly).
-Use historical start date (default toggled off): Use this along with bar-replay to backtest specific periods in price (i.e. consolidated vs trending, dull vs volatile).
-Standard formatting options (text color/size, table position, etc).
-Option to show ONLY on hourly chart (default toggled off): since this indicator is of most use by far on the hourly chart (most history, max precision).
// Notes & Tips:
-Make sure Timezone settings match (input setting & chart timezone).
-Play around with custom input day start time. Choose a 'dead' time (overnight) so as to ensure stats are their most meaningful (if you set a day start time when price is likely to be volatile or trending, you may get a biased / misleadingly high readout for the start-of-day/ end-of-day hour, due to price's tendency for continuation through that time.
-If you find a time of day with significantly higher % and it falls either side of your day start time. Try adjusting day start time to 'isolate' this reading and thereby filter out potential 'continuation bias' from the stats.
-Custom input start hour may not match to your chart at first, but this is not a concern: simply increment/decrement your input until you get the desired start time line on the chart; assuming your timezone settings for chart and indicator are matching, all will then work properly as designed.
-Use the the lines and labels along with bar-replay to verify HoD/LoD hours are printing correctly and table is populating correctly.
-Hour 'buckets' represent the start of said hour. i.e. hour 14 would be populated if HoD or LoD formed between 14:00 and 15:00.
-Combined % is simply the average of HoD % and LoD %. So it is the % likelihood of 'extreme of day' occurring in that hour.
-Best results from using this on Hourly charts (sub-hourly => less history; above hourly => less precision).
-Note that lower tier Tradingview subscriptions will get less data history. Premium acounts get 20k bars history => circa 900 days history on hourly chart for ES1!
-Works nicely on Btc/Usd too: any 24hr assets this will give meaningful data (whereas some commodities, such as Lean Hogs which only trade 5hrs in a day, will yield less meaningful data).
Example usage on S&P (ES1! 1hr chart): manual day start time of 11pm; New York timezone; Visual aid lines and labels toggled on. HoD LoD hour timings with 920 days history:
[MiV] Trading SessionHello, everyone!
Today I want to present my new script, which I hope will help not only me!
I'm sure that many people, like me, went through such a stage as "building their strategy". This is when you sit and test on the history how you would enter or exit a trade.
Recently I was doing the same thing and realized that my "tests" involve night time, when in reality I would be asleep and not trading! So I decided to create an indicator that would display my "working hours" so that the backtest I conduct would be as realistic as possible.
Also this indicator is able to display sessions of major exchanges and forex working hours, so it will be useful not only for cryptocurrency lovers.
In addition, we don't always trade every day and, for example, I don't trade on Sunday. That's why we added a feature that "turns off" the day and does not highlight it in color if you're not planning to trade on that day.
And finally, I added a notification of the beginning and end of the trading session. A small thing, but it may also be a useful feature for those who like to sit at the chart!
I will be glad to receive any comments and suggestions!
-----
Всем привет!
Хочу сегодня представить свой новый скрипт, который, надеюсь, поможет не только мне!
Уверен, что многие, как и я, проходили такой этап как "постройка своей стратегии". Это когда ты сидишь и тестируешь на истории то как бы ты входил или выходил из сделки.
Вот недавно я ровно также занимался этим и осознал, что мои "тесты" затрагивают и ночное время, когда в реальности я бы спал и не торговал! Поэтому я решил создать индикатор, который будет отображать мои "рабочие часы", чтобы бектест, который я провожу, был максимально реалистичным.
Также данный индикатор умеет отображать сессии крупных бирж и время работы форекса, так что полезным он будет не только для любителей криптовалюты.
Кроме того, мы же не всегда торгуем каждый день и например я не торгую в воскресенье. Поэтому добавлен функционал, который "выключает" день и не подсвечивает его цветом, если ты в этот день не планируешь торговать.
Ну и в заключении, добавил уведомление о начале и завершении торговой сессии. Мелочь, а тоже может быть полезной фичей для тех кто любит засесть за графиком!
Буду рад любым замечаниям и предложениям!

Divergence Backtester - V2Further attempts to study divergence impact on price in shorter terms.
Previous study can be found here:
In this script, we are trying to gather the stats based on last two pivot state together. For example, Individual table of Pivot High Projection is as explained below:
But, by looking at the bigger picture, we can further estimate following things regarding the current unconfirmed pivot and the new pivot which is yet to be formed.

Pump blaster based on Pump FinderThis is based on a video I watched while searching for good indicators to use for scanning pumps across the crypto market.
You can probably find the video by searching for "Pump Finder On 15 Minute Chart With Best Trading Indicators".
The approach presented uses LSMA and BB B% to detect pumps.
Results:
It does detect many pumps, it also detects many dumps...
I'm not very impressed after this first attempt but might give it another try if I come up with maybe something I'm doing wrong while trying to automate in a script the original strategy from the video.
Instructions:
This indicator is compatible with the backtest script we use.
It plots 1 for buy and 2 for sell. The rest of the plots are for debugging the strategy and can be ignored.
It's meant to be used on 15mins tf

Jack MA Cross Alerts with TP, SL, TSLAlerts for:
Jack MA Cross is works based on a MA Crossover. What makes this script unique is the framework built behind it. With the ability of adding TP, SL, and TSL. It makes this script more advanced compare to other traditional MA Crossover scripts.
Will add more Moving Averages in the future, making this the Jack of all Trades .
To request a trial for this script, please PM me.
-----------------
Jack MA Cross V1.0.0
- Initial release

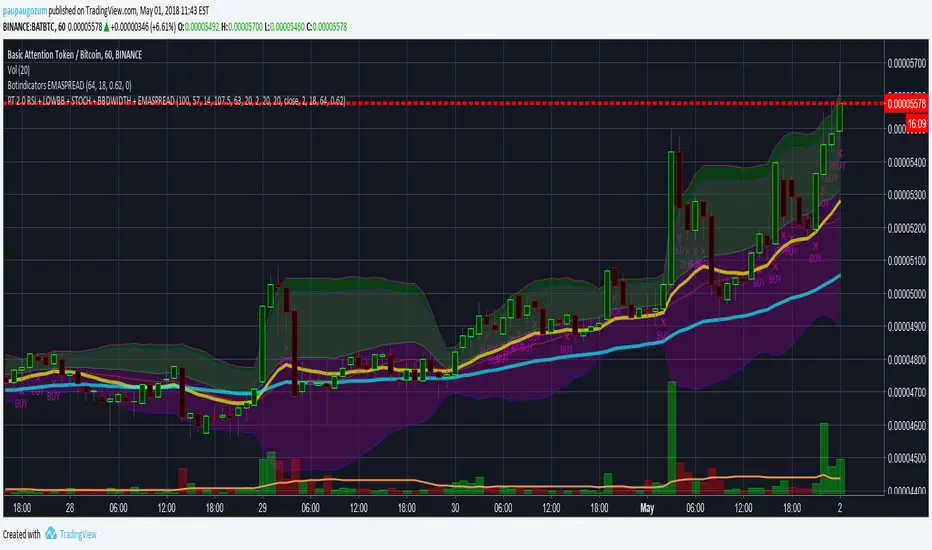
PT 2.0 RSI + LOWBB + STOCH + BBWIDTH + EMASPREADProfitTrailer 2.0 - Backtest for RSI + LOWBB + STOCH + BBWIDTH + EMASPREAD. Default settings are meant to buy up during a pump, but stops buying at the top of the pump. Optimized for 1-hour time frame. Adjust default values as you see fit for shorter timeframes.
**In the process of adding STOCH**
The Falcon - My Custom Indicator and Alert SetupHello,
I made a custom indicator, I called it The Falcon because it reacts quickly and knows how to take perspective of the market. It switches entry and exit conditions depending on wether we are in trading range or in a bullish/bearish trend (difference between green/blue arrows and between red/orange arrows).
This kind of indicator can be used for manual trading or bots.
I will grant access to people willing to make a small donation.
Here is my BTC address : 19sVQvCDmVfEACq7BiMnWSMqFPZ8qfSQ2K
If you prefer ETH : 0xc8a5d3a63a05db0c2363ea1c08b37a01cce9ebfb
Send me a Private Message with the ID of the transaction
If you want to do some forward testing first, send me a message.
I will upload soon a Strategy version of The Falcon with backtesting results.
I am also taking commissions if you want me to code something for you, or do some reverse engineering.
Also you can ask me anything in the comments.
Thanks and see you next time !
BitcoinNinjas NINJASIGNALS V4 (Script)BitcoinNinjas NINJASIGNALS V4 (Script)
(for Cryptocurrencies, Forex, GunBot, ProfitTrailer, Autoview, CryptoHopper, manual or automated trading, and more)
This is version 4 of our Ninja Signals trading script, with accompanying backtesting strategy.
BitcoinNinjas NINJASIGNALS V4 (Strategy)
•Allows users to easily set automated buy/long and sell/short alerts on TradingView for use with automatic and manual trading of cryptocurrencies, Forex securities, and more (alerts are compatible with automatic trading software such as GunBot, ProfitTrailer, Autoview, CryptoHopper, and more).
•Synthesizes many powerful indicators [e.g., Relative Strength Index (RSI), Stochastic RSI, Money Flow Index (MFI), Moving Average Convergence Divergence (MACD), etc.) into one powerful script to generate very precise buy and sell signals in virtually all market conditions.
•Features user-defined adjustable calibration settings, allowing traders to customize the script to fit any currency / security on any exchange available through TradingView.com, simply by adjusting settings.
•Buy/Long arrows, Sell/Short arrows, & EMA trendline can be customized or hidden, if desired.
•Complete with backtesting strategy version of script which allows users to test various trading strategies based on the alerts the script generates (see information and screenshots below).
•Backtesting strategy features a user-defined adjustable date range, so traders can estimate performance of the script over specific periods of time, such as the last week, month, or year.
•Script and backtesting strategy feature many user-adjustable settings including stop loss and take profit alerts, an ‘only sell for profit’ option (Gunbot-specific), many different buy and sell filters, and more. Simply adjust the script settings and the backtesting results will automatically refresh.
•Backtesting strategy allows for pyramid buying to test various average down / dollar cost average trading strategies. Simply adjust the number of pyramid buys and the quantity of each buy.
•Fully compatible with margin and futures trading for any currency / security on TradingView.com.
DISCLAIMER: By using our BitcoinNinjas ‘Ninja Signals’ planning script, you agree to the BitcoinNinjas 'Terms of Use'. No sharing, copying, reselling, modifying, or any other forms of use are authorized for our documents, script / strategy, and the information published with them. This informational planning script / strategy is strictly for individual use and educational purposes only. This is not financial or investment advice. Investments are always made at your own risk and are based on your personal judgement. BitcoinNinjas is not responsible for any losses you may incur. Please invest wisely.

BitcoinNinjas 'Ninja Signals' Buy/Sell Alert Trading Script v3.0Bitcoin Ninjas 'Ninja Signals' Buy/Sell Alerts & Backtesting TradingView Script v3.0
(for Cryptocurrencies, Forex, GunBot, ProfitTrailer, automatic trading software, and more)
This is version 3 of our popular Ninja Signals trading script, which is similar to version 2, but with a new hard-coded calibration (resolution) setting that automatically matches candle size (period) to ensure that no repainting occurs regardless of the number or type of indicators and filters traders apply when configuring the script.
'Ninja Signals' v3.0 (SCRIPT)
'Ninja Signals' v3.0 (STRATEGY)
'Ninja Signals' v2.0 (SCRIPT)
'Ninja Signals' v2.0 (STRATEGY)
'Ninja Signals' v1.0 (SCRIPT)
'Ninja Signals' v1.0 (STRATEGY)
-Allows users to easily set automated buy and sell alerts on TradingView for use with automatic and manual trading of cryptocurrencies, Forex securities, and more (alerts are compatible with automatic trading software such as GunBot, ProfitTrailer, and more).
-Synthesizes many powerful indicators [e.g. Relative Strength Index (RSI), stochastic RSI, Money Flow Index (MFI), Moving Average Convergence Divergence (MACD), etc.) into one super script to generate very precise buy and sell signals in almost any market condition.
-Buy arrows (blue) and sell arrows (red) can be changed or hidden for ease of viewing.
-No lag EMA trendline featuring trend-reversal color-coding (white uptrend, black downtrend).
-Adjustable ‘calibration’ setting allows users to customize the script to work for any currency or security available through TradingView, on any exchange, simply by adjusting a number.
-Complete with backtesting strategy version of script which allows users to test various buy and sell strategies based on the alerts the script generates (see info and screenshots below).
-Backtesting strategy incorporates a user-defined adjustable date range, so users can estimate the script’s performance over specific periods of time, such as the last day, week, or month.
-Backtesting strategy utilizes a minimum protective gain setting to help you never sell for a loss. Simply adjust your minimum profit (%) per trade, and the test results will update.
-Backtesting strategy allows for pyramid buying to test various average down / double up buying strategies. Simply adjust the number of pyramid buys and the quantity of each buy.
- Free 7-day trial available for TradingView users who join our free BitcoinNinjas community.
-Free 24/7 support via BitcoinNinjas Telegram GunBot support group with script purchase.
-Fully compatible with GunBot automatic trading software (TradingView plugin is required).
-Special discount available for traders who purchase GunBot automatic trading software and the GunBot TradingView plugin from BitcoinNinjas, allowing for fully automatic trading.
-Contact us via Email or Telegram for more information, to request additional / custom screenshots, or to start your free trial.
DISCLAIMER: By using our BitcoinNinjas ‘Ninja Signals’ planning script, you agree to the BitcoinNinjas 'Terms of Use', as presented on our website (www.BitcoinNinjas.org) and as stated here. No sharing, copying, reselling, modifying, or any other forms of use are authorized for our documents, script / strategy, and the information published with them. This informational planning script / strategy is strictly for individual use and educational purposes only. This is not financial or investment advice. Investments are always made at your own risk and are based on your personal judgement. Bitcoin Ninjas is not responsible for any losses you may incur. Please invest wisely.

ORB Strategy + Backtesting (fixed timestamp) - Lines Adjusted⚡ ORB Strategy + Backtesting (Pine Script v5)
This script implements a complete Opening Range Breakout (ORB) strategy, featuring built-in backtesting, advanced TP/SL visualization, full style customization, and a performance dashboard. It is designed for traders who want to clearly evaluate breakout performance directly on the chart.
🕑 ORB Window Configuration
🔹 Session selection: choose between Market Timezone or Custom Session.
🔹 Timezone support: configurable from UTC-8 to UTC+12.
🔹 Daily limit: option to allow only one trade per day.
🔹 Risk/Reward (RR) settings:
Configurable TP1, TP2, and TP3 levels.
Stop Loss calculated dynamically from the ORB range.
📊 Backtesting Engine
🔹 Interactive dashboard showing trades, wins, losses, and win rate.
🔹 Adjustable partial exits for each TP (TP1, TP2, TP3).
🔹 Automatic calculation of percentage-based profit and loss.
🔹 Tracks total trades, total profit, and average profit per trade.
🎨 Visual Customization
🔹 Fully customizable colors:
ORB high/low lines and range fill.
Buy/Sell entry labels.
TP and SL lines with background zones.
🔹 Line style and thickness options (solid, dotted, dashed).
🔹 Visibility controls for each TP/SL level.
🔹 Clear profit and loss zones drawn directly on the chart.
🚀 Trading Logic
🔹 LONG entries: triggered when price breaks above the ORB high.
🔹 SHORT entries: triggered when price breaks below the ORB low.
🔹 Automatic calculation of Stop Loss and TP1, TP2, TP3 based on ORB range and RR.
🔹 Customizable BUY / SELL labels displayed at entry.
✅ TP / SL Detection
🔹 Real-time detection of TP1, TP2, TP3, and SL hits.
🔹 Prevents double counting of the same level.
🔹 Extended TP/SL lines with shaded zones for better clarity.
📈 Backtesting Dashboard
🔹 Displayed in the top-right corner of the chart.
🔹 Shows:
Total trades
Wins / Losses
Win rate (%)
Total profit (%)
Average profit per trade
🔹 Fully customizable panel color.
✨ Summary
This script combines:
Opening Range detection
Breakout trading logic with advanced risk management
Professional-grade visualizations
Integrated historical performance tracking
High customization for sessions, styles, and colors
💡 Ideal for traders who want to trade ORB setups with clarity, structure, and measurable results.

[DEM] Moving Average Signal (With Backtesting) Moving Average Signal (With Backtesting) is designed to generate buy and sell signals using a highly configurable moving average system with over 20 different moving average types (including EMA, SMA, HMA, ALMA, McGinley, TRAMA, and others) combined with dynamic upper and lower bands based on standard deviation or ATR multipliers. It also includes a comprehensive backtesting framework to evaluate the historical performance of these signals. The indicator overlays directly on the price chart, plotting the moving average with upper and lower bands while coloring bars green when price is above the upper band, red when below the lower band, and purple when between the bands. The strategy generates buy signals when price crosses above the upper band after being below it for one bar but above it for the previous three bars (indicating a breakout after brief consolidation), and sell signals under opposite conditions with the lower band, creating a momentum-based system that filters for sustained moves beyond the moving average envelope while offering extensive customization options and integrated backtesting metrics.
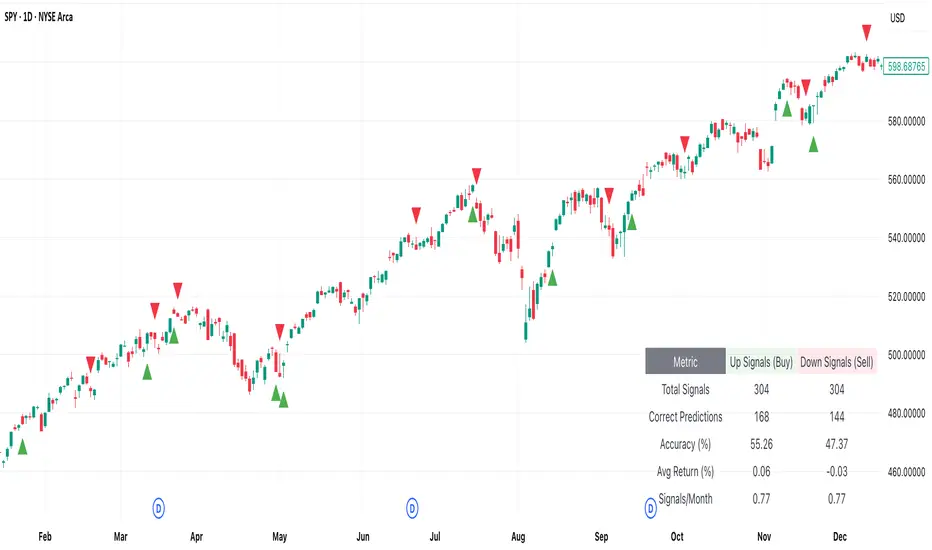
[DEM] Momentum Supertrend Signal (With Backtesting) Momentum Supertrend Signal (With Backtesting) is designed to generate buy and sell signals by combining SuperTrend trend analysis with consecutive price momentum patterns and timing filters to identify high-probability entry points with reduced signal frequency. It also includes a comprehensive backtesting framework to evaluate the historical performance of these signals. The indicator overlays directly on the price chart, plotting signals and displaying performance statistics in a table. The strategy generates buy signals when price shows three consecutive closes higher than the previous close while the SuperTrend indicates a bullish trend (direction = -1), with an additional requirement that at least 5 bars have passed since the last buy signal, while sell signals are triggered when price shows three consecutive lower closes during a SuperTrend bearish trend (direction = 1) with the same 5-bar spacing requirement, creating a momentum-confirmation system that filters for sustained directional movement while preventing excessive signal generation through integrated timing controls and backtesting analysis.

[DEM] Klinger Signal (With Backtesting) Klinger Signal (With Backtesting) is designed to generate buy and sell signals based on the Klinger Volume Oscillator, which combines price movement direction with volume flow to identify potential trend changes and momentum shifts. It also includes a comprehensive backtesting framework to evaluate the historical performance of these signals. The indicator overlays directly on the price chart, plotting signals and displaying performance statistics in a table. The strategy calculates signed volume (positive when HLC3 rises, negative when it falls), applies dual EMA smoothing with configurable fast and slow periods (default 34 and 55), creates a signal line using additional EMA smoothing (default 13 periods), then generates buy signals when the signal line crosses above its own EMA-smoothed version and sell signals on the opposite crossover, combining volume analysis with price momentum to identify institutional money flow changes while tracking signal accuracy, average returns, and frequency through integrated backtesting metrics.
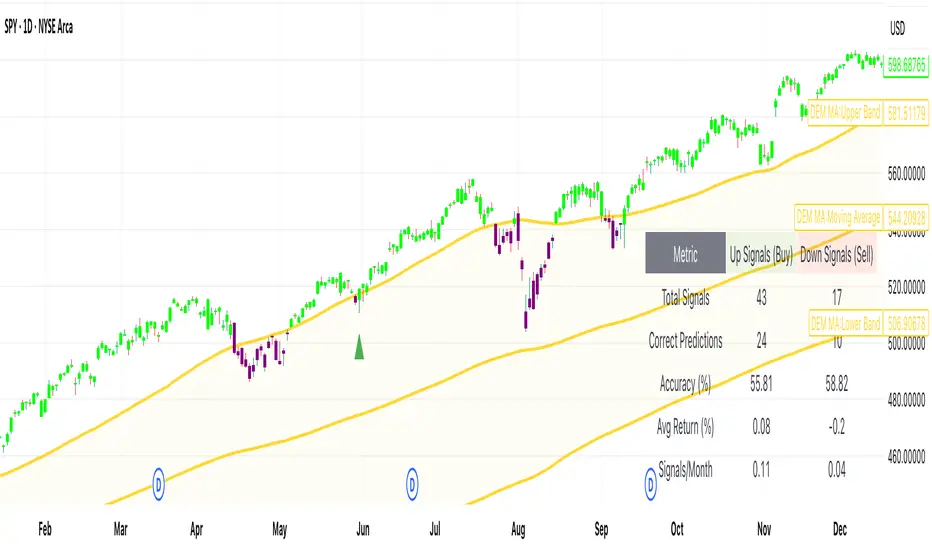
[DEM] EMA Crossover Signal (With Backtesting) EMA Crossover Signal (With Backtesting) is designed to generate buy and sell signals based on the classic exponential moving average crossover strategy using two configurable EMA periods (default 9 and 21). It also includes a comprehensive backtesting framework to evaluate the historical performance of these signals. The indicator overlays directly on the price chart, plotting signals and displaying performance statistics in a table. The strategy generates buy signals when the shorter EMA crosses above the longer EMA (indicating upward momentum shift) and sell signals when the shorter EMA crosses below the longer EMA (indicating downward momentum shift), while the integrated backtesting system tracks signal accuracy, average returns, signal frequency per month, and total correct predictions for both buy and sell signals over a configurable holding period to help traders evaluate the effectiveness of the crossover parameters.

[DEM] Confirmation Signal (With Backtesting) Confirmation Signal (With Backtesting) is designed to generate buy and sell signals by combining Aroon oscillator analysis with Parabolic SAR positioning, smoothed EMA trend confirmation, and RSI filtering to create high-confidence trading opportunities. It also includes a comprehensive backtesting framework to evaluate the historical performance of these signals. The indicator overlays directly on the price chart, plotting signals and displaying performance statistics in a table while also coloring bars based on market conditions (green for bullish confirmation, red for bearish confirmation, purple for neutral). The strategy generates buy signals when the Aroon Up reaches 100% (new highs) combined with bullish trend confirmations, proper SAR positioning, RSI filters, and adequate time spacing between signals, while sell signals are triggered under opposite conditions, emphasizing signal quality over quantity through multiple confirmation layers and integrated backtesting metrics.

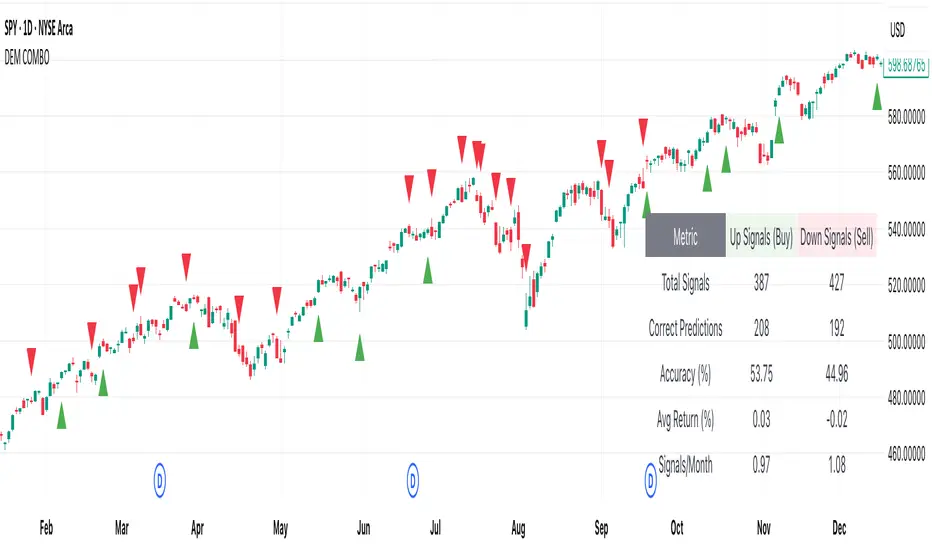
[DEM] Combo Signal (With Backtesting) Combo Signal (With Backtesting) is designed to generate buy and sell signals by combining seven different trading strategies that incorporate multiple technical indicators including SuperTrend, Parabolic SAR, MACD, and RSI. It also includes a comprehensive backtesting framework to evaluate the historical performance of these signals. The indicator overlays directly on the price chart, plotting signals and displaying performance statistics in a table. The strategy triggers buy signals when any of seven long conditions are met (including ATR-based reversal patterns, SuperTrend confirmations, RSI oversold crossovers, MACD bullish crossovers, and SuperTrend line breaks), while sell signals are generated when any of the corresponding seven short conditions occur, creating a multi-faceted approach that aims to capture various market conditions and trading opportunities while tracking signal accuracy, average returns, and signal frequency through its integrated backtesting system.
[DEM] Chande Momentum + Aroon Signal (With Backtesting) Chande Momentum + Aroon Signal (With Backtesting) is designed to generate buy and sell signals by combining the Chande Momentum Oscillator with the Aroon indicator. It also includes a comprehensive backtesting framework to evaluate the historical performance of these signals. The indicator overlays directly on the price chart, plotting signals and displaying performance statistics in a table. The strategy generates buy signals when the Aroon Up reaches 100% (indicating a new high) and the Chande Momentum Oscillator crosses above zero, while sell signals are triggered when the Aroon Down reaches 100% (indicating a new low) and the Chande Momentum Oscillator crosses below zero. The backtesting module tracks signal accuracy, average returns, signal frequency per month, and total correct predictions for both buy and sell signals across a configurable time horizon.

Uptrick: Asset Rotation SystemOverview
The Uptrick: Asset Rotation System is a high-level performance-based crypto rotation tool. It evaluates the normalized strength of selected assets and dynamically simulates capital rotation into the strongest asset while optionally sidestepping into cash when performance drops. Built to deliver an intelligent, low-noise view of where capital should move, this system is ideal for traders focused on strength-driven allocation without relying on standard technical indicators.
Purpose
The purpose of this tool is to identify outperforming assets based strictly on relative price behavior and automatically simulate how a portfolio would evolve if it consistently moved into the strongest performer. By doing so, it gives users a realistic and dynamic model for capital optimization, making it especially suitable during trending markets and major crypto cycles. Additionally, it includes an optional safety fallback mechanism into cash to preserve capital during risk-off conditions.
Originality
This system stands out due to its strict use of normalized performance as the only basis for decision-making. No RSI, no MACD, no trend oscillators. It does not rely on any traditional indicator logic. The rotation logic depends purely on how each asset is performing over a user-defined lookback period. There is a single optional moving average filter, but this is used internally for refinement, not for entry or exit logic. The system’s intelligence lies in its minimalism and precision — using normalized asset scores to continuously rotate capital with clarity and consistency.
Inputs
General
Normalization Length: Defines how many bars are used to calculate each asset’s normalized score. This score is used to compare asset performance.
Visuals: Selects between Equity Curve (show strategy growth over time) or Asset Performance (compare asset strength visually).
Detect after bar close: Ensures changes only happen after a candle closes (for safety), or allows bar-by-bar updates for quicker reactions.
Moving Average
Used internally for optional signal filtering.
MA Type: Lets you choose which moving average type to use (EMA, SMA, WMA, RMA, SMMA, TEMA, DEMA, LSMA, EWMA, SWMA).
MA Length: Sets how many bars the moving average should calculate over.
Use MA Filter: Turns the filter on or off. It doesn’t affect the signal directly — just adds a layer of control.
Backtest
Used to simulate equity tracking from a chosen starting point. All calculations begin from the selected start date. Prior data is ignored for equity tracking, allowing users to isolate specific market cycles or testing periods.
Starting Day / Month / Year: The exact day the strategy starts tracking equity.
Initial Capital $: The amount of simulated starting capital used for performance calculation.
Rotation Assets
Each asset has 3 controls:
Enable: Include or exclude this asset from the rotation engine.
Symbol: The ticker for the asset (e.g., BINANCE:BTCUSDT).
Color: The color for visualization (labels, plots, tables).
Assets supported by default:
BTC, ETH, SOL, XRP, BNB, NEAR, PEPE, ADA, BRETT, SUI
Cash Rotation
Normalization Threshold USDC: If all assets fall below this threshold, the system rotates into cash.
Symbol & Color: Sets the cash color for plots and tables.
Customization
Dynamic Label Colors: Makes labels change color to match the current asset.
Enable Asset Label: Plots asset name labels on the chart.
Asset Table Position: Choose where the key asset usage table appears.
Performance Table Position: Choose where the backtest performance table appears.
Enable Realism: Enables slippage and fee simulation for realistic equity tracking. Adjusted profit is shown in the performance table.
Equity Styling
Show Equity Curve (STYLING): Toggles an extra-thick visual equity curve.
Background Color: Adds a soft background color that matches the current asset.
Features
Dual Visualization Modes
The script offers two powerful modes for real-time visual insights:
Equity Curve Mode: Simulates the growth of a portfolio over time using dynamic asset rotation. It visually tracks capital as it moves between outperforming assets, showing compounded returns and the current allocation through both line plots and background color.
Asset Performance Mode: Displays the normalized performance of all selected assets over the chosen lookback period. This mode is ideal for comparing relative strength and seeing how different coins perform in real-time against one another, regardless of price level.
Multi-Asset Rotation Logic
You can choose up to 10 unique assets, each fully customizable by symbol and color. This allows full flexibility for different strategies — whether you're rotating across majors like BTC, ETH, and SOL, or including meme tokens and stablecoins. You decide the rotation universe. If none of the selected assets meet the strength threshold, the system automatically moves to cash as a protective fallback.
Key Asset Selection Table
This on-screen table displays how frequently each enabled asset was selected as the top performer. It updates in real time and can help traders understand which assets the system has historically favored.
Asset Name: Shortened for readability
Color Box: Visual color representing the asset
% Used: How often the asset was selected (as a percentage of strategy runtime)
This table gives clear insight into historical rotation behavior and asset dominance over time.
Performance Comparison Table
This second table shows a full backtest vs. chart comparison, broken down into key performance metrics:
Backtest Start Date
Chart Asset Return (%) – The performance of the asset you’re currently viewing
System Return (%) – The equity growth of the rotation strategy
Outperformed By – Shows how many times the system beat the chart (e.g., 2.1x)
Slippage – Estimated total slippage costs over the strategy
Fees – Estimated trading fees based on rotation activity
Total Switches – Number of times the system changed assets
Adjusted Profit (%) – Final net return after subtracting fees and slippage
Equity Curve Styling
To enhance visual clarity and aesthetics, the equity curve includes styling options:
Custom Thickness Curve: A second stylized line plots a shadow or highlight of the main equity curve for stronger visual feedback
Dynamic Background Coloring: The chart background changes color to match the currently held asset, giving instant visual context
Realism Mode
By enabling Realism, the system calculates estimated:
Trading Fees (default 0.1%)
Slippage (default 0.05%)
These costs are subtracted from the equity curve in real time, and shown in the table to produce an Adjusted Return metric — giving users a more honest and execution-aware picture of system performance.
Adaptive Labeling System
Each time the asset changes, an on-chart label updates to show:
Current Asset
Live Equity Value
These labels dynamically adjust in color and visibility depending on the asset being held and your styling preferences.
Full Customization
From visual position settings to table placements and custom asset color coding, the entire system is fully modular. You can move tables around the screen, toggle background visuals, and control whether labels are colored dynamically or uniformly.
Key Concepts
Normalized values represent how much an asset has changed relative to its past price over a fixed period, allowing performance comparisons across different assets. Outperforming refers to the asset with the highest normalized value at a given time. Cash fallback means the system moves into a stable asset like USDC when no strong performers are available. The equity curve is a running total of simulated capital over time. Slippage is the small price difference between expected and actual trade execution due to market movement.
Use Case Flexibility
You don’t need to use all 10 assets. The system works just as effectively with only 1 asset — such as rotating between CASH and SOL — for a simple, minimal strategy. This is ideal for more focused portfolios or thematic rotation systems.
How to Use the Indicator
To use the Uptrick: Asset Rotation System, start by selecting which assets to include and entering their symbols (e.g., BINANCE:BTCUSDT). Choose between Equity Curve mode to see simulated portfolio growth, or Asset Performance mode to compare asset strength. Set your lookback period, backtest start date, and optionally enable the moving average filter or realism settings for slippage and fees. The system will then automatically rotate into the strongest asset, or into cash if no asset meets the strength threshold. Use alerts to be notified when a rotation occurs.
Asset Switch Alerts
The script includes built-in alert conditions for when the system rotates into a new asset. You can enable these to be notified when the system reallocates to a different coin or to cash. Each alert message is labeled by target asset and can be used for automation or monitoring purposes.
Conclusion
The Uptrick: Asset Rotation System is a next-generation rotation engine designed to cut through noise and overcomplication. It gives users direct insight into capital strength, without relying on generic indicators. Whether used to track a broad basket or focus on just two assets, it is built for accuracy, adaptability, and transparency — all in real-time.
Disclaimer
This script is for research and educational purposes only. It is not intended as financial advice. Past performance is not a guarantee of future results. Always consult with a financial professional and evaluate risks before trading or investing.

ICT Turtle Soup | Flux Charts💎 GENERAL OVERVIEW
Introducing our new ICT Turtle Soup Indicator! This indicator is built around the ICT "Turtle Soup" model. The strategy has 5 steps for execution which are described in this write-up. For more information about the process, check the "HOW DOES IT WORK" section.
Features of the new ICT Turtle Soup Indicator :
Implementation of ICT's Turtle Soup Strategy
Adaptive Entry Method
Customizable Execution Settings
Customizable Backtesting Dashboard
Alerts for Buy, Sell, TP & SL Signals
📌 HOW DOES IT WORK ?
The ICT Turtle Soup strategy may have different implementations depending on the selected method of the trader. This indicator's implementation is described as :
1. Mark higher timerame liquidity zones.
Liquidity zones are where a lot of market orders sit in the chart. They are usually formed from the long / short position holders' "liquidity" levels. There are various ways to find them, most common one being drawing them on the latest high & low pivot points in the chart, which this indicator does.
2. Mark current timeframe market structure.
The market structure is the current flow of the market. It tells you if the market is trending right now, and the way it's trending towards. It's formed from swing higs, swing lows and support / resistance levels.
3. Wait for market to make a liquidity grab on the higher timeframe liquidity zone.
A liquidity grab is when the marked liquidity zones have a false breakout, which means that it gets broken for a brief amount of time, but then price falls back to it's previous position.
4. Buyside liquidity grabs are "Short" entries and Sellside liquidity grabs are "Long" entries by default.
5. Wait for the market-structure shift in the current timeframe for entry confirmation.
A market-structure shift happens when the current market structure changes, usually when a new swing high / swing low is formed. This indicator uses it as a confirmation for position entry as it gives an insight of the new trend of the market.
6. Place Take-Profit and Stop-Loss levels according to the risk ratio.
This indicator uses "Average True Range" when placing the stop-loss & take-profit levels. Average True Range calculates the average size of a candle and the indicator places the stop-loss level using ATR times the risk setting determined by the user, then places the take-profit level trying to keep a minimum of 1:1 risk-reward ratio.
This indicator follows these steps and inform you step by step by plotting them in your chart.
🚩UNIQUENESS
This indicator is an all-in-one suit for the ICT's Turtle Soup concept. It's capable of plotting the strategy, giving signals, a backtesting dashboard and alerts feature. It's designed for simplyfing a rather complex strategy, helping you to execute it with clean signals. The backtesting dashboard allows you to see how your settings perform in the current ticker. You can also set up alerts to get informed when the strategy is executable for different tickers.
⚙️SETTINGS
1. General Configuration
MSS Swing Length -> The swing length when finding liquidity zones for market structure-shift detection.
Higher Timeframe -> The higher timeframe to look for liquidity grabs. This timeframe setting must be higher than the current chart's timeframe for the indicator to work.
Breakout Method -> If "Wick" is selected, a bar wick will be enough to confirm a market structure-shift. If "Close" is selected, the bar must close above / below the liquidity zone to confirm a market structure-shift.
Entry Method ->
"Classic" : Works as described on the "HOW DOES IT WORK" section.
"Adaptive" : When "Adaptive" is selected, the entry conditions may chance depending on the current performance of the indicator. It saves the entry conditions and the performance of the past entries, then for the new entries it checks if it predicted the liquidity grabs correctly with the current setup, if so, continues with the same logic. If not, it changes behaviour to reverse the entries from long / short to short / long.
2. TP / SL
TP / SL Method -> If "Fixed" is selected, you can adjust the TP / SL ratios from the settings below. If "Dynamic" is selected, the TP / SL zones will be auto-determined by the algorithm.
Risk -> The risk you're willing to take if "Dynamic" TP / SL Method is selected. Higher risk usually means a better winrate at the cost of losing more if the strategy fails. This setting is has a crucial effect on the performance of the indicator, as different tickers may have different volatility so the indicator may have increased performance when this setting is correctly adjusted.

ICT Silver Bullet | Flux Charts💎 GENERAL OVERVIEW
Introducing our new ICT Silver Bullet Indicator! This indicator is built around the ICT's "Silver Bullet" strategy. The strategy has 5 steps for execution and works best in 1-5 min timeframes. For more information about the process, check the "HOW DOES IT WORK" section.
Features of the new ICT Silver Bullet Indicator :
Implementation of ICT's Silver Bullet Strategy
Customizable Execution Settings
2 NY Sessions & London Session
Customizable Backtesting Dashboard
Alerts for Buy, Sell, TP & SL Signals
📌 HOW DOES IT WORK ?
ICT's Silver Bullet strategy has 5 steps :
1. Mark your market sessions open (This indicator has 3 -> NY 10-11, NY 14-15, LDN 03-04)
2. Mark the swing liquidity points
3. Wait for market to take down one liquidity side
4. Look for a market structure-shift for reversals
5. Wait for a FVG for execution
This indicator follows these steps and inform you step by step by plotting them in your chart. You can switch execution types between FVG and MSS.
🚩UNIQUENESS
This indicator is an all-in-one suit for the ICT's Silver Bullet concept. It's capable of plotting the strategy, giving signals, a backtesting dashboard and alerts feature. It's designed for simplyfing a rather complex strategy, helping you to execute it with clean signals. The backtesting dashboard allows you to see how your settings perform in the current ticker. You can also set up alerts to get informed when the strategy is executable for different tickers.
⚙️SETTINGS
1. General Configuration
Execution Type -> FVG execution type will require a FVG to take an entry, while the MSS setting will take an entry as soon as it detects a market structure-shift.
MSS Swing Length -> The swing length when finding liquidity zones for market structure-shift detection.
Breakout Method -> If "Wick" is selected, a bar wick will be enough to confirm a market structure-shift. If "Close" is selected, the bar must close above / below the liquidity zone to confirm a market structure-shift.
FVG Detection -> "Same Type" means that all 3 bars that formed the FVG should be the same type. (Bullish / Bearish). "All" means that bar types may vary between bullish / bearish.
FVG Detection Sensitivity -> You can turn this setting on and off. If it's off, any 3 consecutive bullish / bearish bars will be calculated as FVGs. If it's on, the size of FVGs will be filtered by the selected sensitivity. Lower settings mean less but larger FVGs.
2. TP / SL
TP / SL Method -> If "Fixed" is selected, you can adjust the TP / SL ratios from the settings below. If "Dynamic" is selected, the TP / SL zones will be auto-determined by the algorithm.
Risk -> The risk you're willing to take if "Dynamic" TP / SL Method is selected. Higher risk usually means a better winrate at the cost of losing more if the strategy fails.
Close Position @ Session End -> If this setting is enabled, the current position (if any) will be closed at the beginning of a new session, regardless if it hit the TP / SL zone. If it's off, the position will be open until it hits a TP / SL zone.
