DMI Toolbox StrategyThe Directional Movement Index (DMI) was originally developed by J. Welles Wilder Jr. in 1978. Wilder introduced the DMI along with the Average Directional Index (ADX) in his book, “New Concepts in Technical Trading Systems,” which became a foundational reference for technical analysis.
The indicator can offer a myriad of signals for building a trading strategy. In an effort to provide the user with a meaningful way to evaluate these signals, this DMI Toolbox Strategy offers the chance to back-test various combinations and permutations of DMI signals on long trades. By default it will open a long position on the +DI (upward movement) crossing above the -DI (downward movement). By default, It exits long positions when the ADX (trend strength) reverses.
Suggested Use
Try a wide variety of long entry and exit signals across many different timeframes to see what is most effective for the item you wish to trade. There is a table in the upper right corner that will give a quick view of which signal is dominant across 5 timeframes, based on your current settings. Adjust the pyramidding, slippage, and commission values to more closely match your situation.
Visual Helpers
The DMI indicator has been altered to include a smoothed version of the ADX, as well as a colored background to show which signal is dominant (+DI or -DI). Small up arrows call your attention to ADX crossovers that may indicate a significant threshold in trend strength.
Cerca negli script per "backtesting"

Stop Loss Advisor📊 Stop Loss Advisor - Advanced Risk Management Tool
A sophisticated Pine Script v5 indicator designed to suggest optimal stop loss distances based on market volatility, combining ATR and Standard Deviation analysis for precise risk management.
🎯 What Makes This Different from Bollinger Bands?
While Bollinger Bands focus on mean reversion and overbought/oversold conditions using a moving average center line, this indicator is specifically designed for risk management . It creates dynamic bands around the current price to suggest where NOT to place your stop loss, preventing you from being stopped out by normal market noise.
⚡ Key Features
Dynamic ATR Calculation - Fully customizable ATR periods with adaptive volatility filtering
Standard Deviation Integration - Optional StdDev component for enhanced statistical accuracy
Multiple Combination Modes - Average, Maximum, ATR Weighted, or StdDev Weighted
Flexible Price Sources - Choose from Close, HL2, HLC3, or OHLC4
Automatic Pip Calculation - Works across all instruments with automatic pip value detection
Smart Alerts System - Get notified when suggested stop loss exceeds your base risk tolerance
Real-time Information Table - Displays current values and risk status
Visual Labels - Shows exact pip distances directly on chart
Band Smoothing - Prevents erratic movements with customizable averaging
📈 How It Works
ATR Analysis : Calculates Average True Range to measure current market volatility
Statistical Enhancement : Optionally combines with Standard Deviation for more robust calculations
Dynamic Bands : Creates upper and lower bands that expand/contract with volatility
Pip Conversion : Automatically converts distances to pips for easy interpretation
Risk Assessment : Compares suggested distances with your base stop loss tolerance
🔧 Customization Options
ATR Settings:
Customizable ATR period (default: 14)
Adjustable multiplier with 0.1 step precision
Optional volatility filtering for enhanced sensitivity
Standard Deviation (Optional):
Independent period and multiplier settings
Multiple price source options
Four combination modes with ATR
Visual Customization:
Fully customizable colors for all elements
Multiple line styles (solid, dashed, dotted)
Optional band filling with transparency control
Show/hide ATR line overlay
Configurable band smoothing
💡 Perfect For
Forex Traders - Especially effective on major pairs and XAUUSD
Risk Managers - Calculate optimal stop distances before entering trades
Scalpers - Avoid being stopped out by normal market fluctuations
Swing Traders - Adapt stop losses to current volatility conditions
📊 Indicator Values
The information table displays:
Current ATR Value (in pips)
Suggested Long Stop Loss (distance in pips)
Suggested Short Stop Loss (distance in pips)
Risk Status - "SAFE" or "HIGH RISK" based on your base tolerance
Standard Deviation Value (when enabled)
Combination Method (when using both ATR and StdDev)
⚠️ Important Notes
This indicator suggests minimum stop loss distances, not entry/exit signals
Always combine with your trading strategy and risk management rules
Do not use as a standalone trading system
Backtesting recommended before live implementation
Default settings work well for most scenarios, but optimization is encouraged
🎨 Default Configuration
ATR Period: 14
ATR Multiplier: 2.0
Price Source: Close
Base Stop Loss: 20 pips
Band Smoothing: 3 periods
Standard Deviation: Optional (20 period, 2.0 multiplier)
🚀 Getting Started
Add the indicator to your chart
Set your base stop loss tolerance in the settings
Choose your preferred price source and ATR parameters
Enable Standard Deviation for enhanced accuracy (optional)
Monitor the information table for real-time risk assessment
Use the suggested distances as minimum stop loss levels
Pro Tip: In low volatility markets, the bands will contract suggesting tighter stops. In high volatility periods, they expand warning you to use wider stops to avoid being stopped out by normal price action.
📝 Version History & Updates
This indicator is actively maintained and updated based on user feedback. Future enhancements may include multi-timeframe analysis, trend-based asymmetric bands, and additional statistical measures.
Transform your risk management approach with data-driven stop loss suggestions that adapt to real market conditions!

EMA Cross By Crypto collective Xეს ინდიკატორი გაძლევთ საშუალებას ნახოთ ყველაზე პოპულარული EMA წყვილები ერთ გრაფიკზე:
EMA 9/21
EMA 20/50
EMA 50/200
EMA 100/200
და საკუთარი, მომხმარებლის მიერ შერჩეული Custom წყვილი.
👉 თითოეულ წყვილს შეგიძლია ჩართო/გამორთო ინდიკატორის პარამეტრებიდან.
👉 შესაძლებელია ფერების შეცვლა, ასევე სურვილის შემთხვევაში EMA-ების higher timeframe-ზე გამოტანა (მაგ. 1D EMA 4H გრაფიკზე).
ეს ინსტრუმენტი განსაკუთრებით გამოსადეგია:
ტრენდების დადგენისთვის
გრძელვადიანი და მოკლევადიანი გადაკვეთების შესადარებლად
საკუთარი სტრატეგიის ტესტირებისთვის
This indicator lets you plot and compare the most commonly used EMA pairs on a single chart:
EMA 9/21
EMA 20/50
EMA 50/200
EMA 100/200
plus a fully customizable user-defined EMA pair.
👉 Each pair can be toggled on/off from the settings.
👉 Colors are customizable, and you can optionally display EMAs from a higher timeframe (e.g., show Daily EMAs on a 4H chart).
This tool is especially useful for:
Trend confirmation
Comparing short-term vs. long-term crosses
Backtesting your own strategies

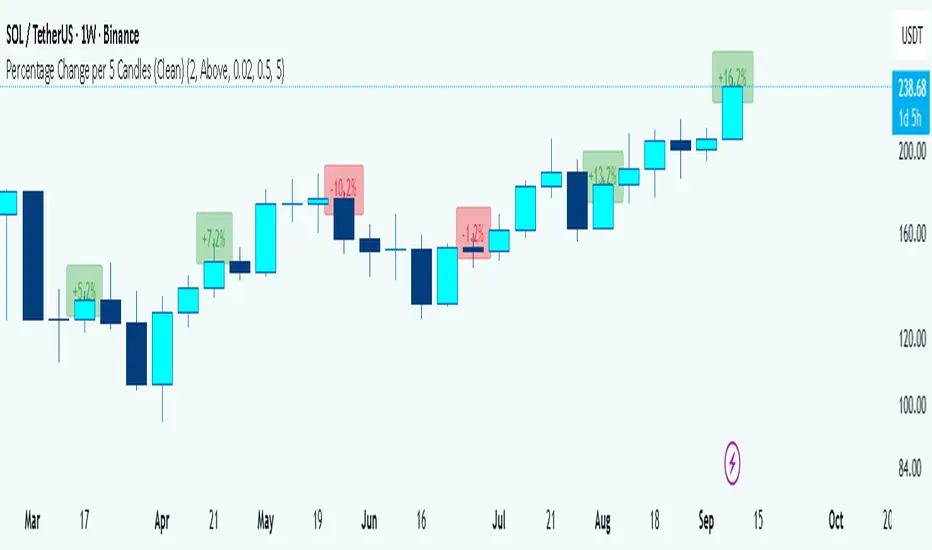
Percentage Change per 5 Candles
🔎 What this indicator does
This indicator calculates and displays the percentage change of each candlestick directly on the chart.
• If a candle closed higher than it opened (bullish candle), it shows a positive % change (green).
• If a candle closed lower than it opened (bearish candle), it shows a negative % change (red).
• Small moves below your chosen threshold (e.g., 0.1%) are ignored to avoid clutter.
• The labels are placed above, below, or in the center of the candle (you choose).
So essentially, every candle “tells you in numbers” exactly how much it changed relative to its opening price.
________________________________________
⚙️ How it operates (the logic inside)
1. Calculate the change
o Formula:
\text{% Change} = \frac{(\text{Close} - \text{Open})}{\text{Open}} \times 100
o Example: If a candle opens at 100 and closes at 105, that’s a +5% change.
2. Round it nicely
o You can control decimals (e.g., show 2 decimals → +5.23%).
3. Filter out noise
o If a candle barely moved (say 0.02%), the label won’t appear unless you reduce the threshold.
4. Style the labels
o Bullish = green text, slightly transparent green background.
o Bearish = red text, slightly transparent red background.
o Neutral (0%) = gray.
5. Place the labels
o Options: above the candle, below the candle, or centered.
o Small vertical offset is applied so labels don’t overlap the candle itself.
________________________________________
📊 How this helps traders
This indicator turns visual candles into quantifiable numbers at a glance. Instead of guessing whether a move was “big” or “small,” you see it clearly.
Key Benefits:
1. Quick volatility analysis
o You can instantly see if candles are making big % swings or just small moves.
o This is especially useful on higher timeframes (daily/weekly) where moves can be large.
2. Pattern confirmation
o For example, you might spot a strong bullish engulfing candle — the % change label helps confirm whether it was truly significant (e.g., +4.5%) or just modest (+0.7%).
3. Noise filtering
o By setting a minimum % threshold, you only see labels when moves are meaningful (say > 0.5%). This keeps focus on important candles.
4. Backtesting & comparison
o You can compare moves across time:
“How strong was this breakout candle compared to the last one?”
“Are today’s bearish candles weaker or stronger than yesterday’s bullish candles?”
5. Better decision-making
o If you’re trading breakouts, reversals, or trend-following, knowing the % size of each candle helps confirm if the move has enough momentum.
________________________________________
✅ In short:
This indicator quantifies price action. Instead of just seeing “green” or “red” candles, you now know exactly how much the price changed in percentage terms, directly on the chart, in real time. It helps you distinguish between strong and weak moves and makes your analysis more precise.
________________________________________
Hilega Milega v6 - Pure EMA/SMA (Nitesh Kumar) + Full BacktestHilega to milega
he Hilega Milega Strategy, inspired by the technique of Nitesh Kumar, is designed for intraday and swing traders who want structured entries and exits with clear demand–supply logic.
🔑 Core Features
Demand & Supply Zones – Automatically plots potential strong buying and selling zones for high-probability trades.
Trend Identification – Uses a blend of EMAs/SMA crossovers to identify bullish and bearish market bias.
Buy & Sell Signals – Generates real-time visual signals based on “Hilega Milega” rules for quick decision-making.
Risk Management – Suggested stop-loss levels are derived from recent demand–supply areas to minimize drawdowns.
Backtesting Enabled – Traders can test the performance across multiple assets (stocks, forex, crypto, commodities).
📊 How It Works
Buy Signal → When price action confirms a bullish zone with supporting trend filters.
Sell Signal → When price action confirms a bearish zone or reversal pattern.
Flat/Exit → Position closed when opposite signal triggers or demand–supply imbalance fades.
⚡ Best Use Cases
Intraday trading (5m, 15m, 1H charts).
Swing trading (4H, Daily charts).
Works across stocks, crypto, commodities, and forex.
⚠️ Disclaimer: This strategy is for educational purposes. Backtest thoroughly and apply proper risk management before live trading.

High-and-Tight Impulse + Micro ConsolidationThis indicator detects a specific bullish continuation setup on daily charts:
- An impulse move (X% rise within N bars, mostly green candles)
- Immediately followed by a tight consolidation (small ranges, small bodies)
- Closes holding in the top zone of the impulse
On the chart, signals are plotted as orange dots above bars.
Labels show the last detected setup date, and a counter displays total matches in history.
Useful for backtesting "high-and-tight flag" type momentum patterns or any symbol.
Adjust inputs (impulse % threshold, bars, ATR ratios, top zone %) to make it stricter or looser.
Alerts are included when a new setup is detected.
This tool is not financial advice. For educational and research purposes only.
by fiyatherseydir

HUll Dynamic BandEducational Hull Moving Average Wave Analysis Tool
**MARS** is an innovative educational indicator that combines multiple Hull Moving Average timeframes to create a comprehensive wave analysis system, similar in concept to Ichimoku Cloud but with enhanced smoothness and responsiveness.
---
🎯 Key Features
**Triple Wave System**
- **Peak Wave (34-period)**: Fast momentum signals, similar to Ichimoku's Conversion Line
- **Primary Wave (89-period)**: Main trend identification with retest detection
- **Swell Wave (178-period)**: Long-term trend context and major wave analysis
**Visual Wave Analysis**
- **Wave Power Fill**: Dynamic area between primary and swell waves showing trend strength
- **Peak Power Fill**: Short-term momentum visualization
- **Smooth Curves**: Hull MA-based calculations provide cleaner signals than traditional moving averages
**Intelligent Signal System**
- **Trend Shift Signals**: Clear visual markers when trend changes occur
- **Retest Detection**: Identifies potential retest opportunities with specific conditions
- **Correction Alerts**: Early warning signals for market corrections
---
📊 How It Works
The indicator uses **Hull Moving Averages** with **Fibonacci-based periods** (34, 89, 178) and a **Golden Ratio multiplier (1.64)** to create natural market rhythm analysis.
**Key Signal Types:**
- 🔵 **Circles**: Major trend shifts (primary wave crossovers)
- 💎 **Diamonds**: Retest opportunities with multi-wave confirmation
- ❌ **X-marks**: Correction signals and structural breaks
- 🌊 **Wave Fills**: Visual trend strength and direction
---
🎓 Educational Purpose
This indicator demonstrates:
- Advanced moving average techniques using Hull MA
- Multi-timeframe analysis in a single view
- Wave theory application in technical analysis
- Dynamic support/resistance concept visualization
**Similar to Ichimoku but Different:**
- Ichimoku uses price-based calculations → Angular cloud shapes
- MARS uses weighted averages → Smooth, flowing wave patterns
- Both identify trend direction, but MARS offers faster signals with cleaner visualization
---
⚙️ Customizable Settings
- **Wave Periods**: Adjust primary wave length (default: 89)
- **Multipliers**: Fine-tune wave sensitivity (default: 1.64 Golden Ratio)
- **Visual Style**: Customize line widths and signal displays
- **Peak Analysis**: Independent fast signal system (default: 34)
---
🔍 Usage Tips
1. **Trend Identification**: Watch wave fill colors and line positions
2. **Entry Timing**: Look for retest diamonds after trend shift circles
3. **Risk Management**: Use wave boundaries as dynamic support/resistance
4. **Confirmation**: Combine with price action and market structure analysis
---
⚠️ Important Notes
- **Educational Tool**: Designed for learning wave analysis concepts
- **Not Financial Advice**: Always use proper risk management
- **Backtesting Recommended**: Test on historical data before live trading
- **Combine with Analysis**: Works best with additional confirmation methods
---
🚀 Innovation
MARS represents a unique approach to wave analysis by:
- Combining Hull MA smoothness with Ichimoku-style visualization
- Providing multi-timeframe analysis without chart clutter
- Offering retest detection with specific wave conditions
- Creating an educational bridge between different analytical methods
---
*This indicator is shared for educational purposes to help traders understand advanced moving average techniques and wave analysis concepts. Always practice proper risk management and combine with your own analysis.*

Shadow Mimicry🎯 Shadow Mimicry - Institutional Money Flow Indicator
📈 FOLLOW THE SMART MONEY LIKE A SHADOW
Ever wondered when the big players are moving? Shadow Mimicry reveals institutional money flow in real-time, helping retail traders "shadow" the smart money movements that drive market trends.
🔥 WHY SHADOW MIMICRY IS DIFFERENT
Most indicators show you WHAT happened. Shadow Mimicry shows you WHO is acting.
Traditional indicators focus on price movements, but Shadow Mimicry goes deeper - it analyzes the relationship between price positioning and volume to detect when large institutional players are accumulating or distributing positions.
🎯 The Core Philosophy:
When price closes near highs with volume = Institutions buying
When price closes near lows with volume = Institutions selling
When neither occurs = Wait and observe
📊 POWERFUL FEATURES
✨ 3-Zone Visual System
🟢 BUY ZONE (+20 to +100): Institutional accumulation detected
⚫ NEUTRAL ZONE (-20 to +20): Market indecision, wait for clarity
🔴 SELL ZONE (-20 to -100): Institutional distribution detected
🎨 Crystal Clear Visualization
Background Colors: Instantly see market sentiment at a glance
Signal Triangles: Precise entry/exit points when zones are breached
Real-time Status Labels: "BUY ZONE" / "SELL ZONE" / "NEUTRAL"
Smooth, Non-Repainting Signals: No false hope from future data
🔔 Smart Alert System
Buy Signal: When indicator crosses above +20
Sell Signal: When indicator crosses below -20
Custom TradingView notifications keep you informed
🛠️ TECHNICAL SPECIFICATIONS
Algorithm Details:
Base Calculation: Modified Money Flow Index with enhanced volume weighting
Smoothing: EMA-based smoothing eliminates noise while preserving signals
Range: -100 to +100 for consistent scaling across all markets
Timeframe: Works on all timeframes from 1-minute to monthly
Optimized Parameters:
Period (5-50): Default 14 - Perfect balance of sensitivity and reliability
Smoothing (1-10): Default 3 - Reduces false signals while maintaining responsiveness
📚 COMPREHENSIVE TRADING GUIDE
🎯 Entry Strategies
🟢 LONG POSITIONS:
Wait for indicator to cross above +20 (green triangle appears)
Confirm with background turning green
Best entries: Early in uptrends or after pullbacks
Stop loss: Below recent swing low
🔴 SHORT POSITIONS:
Wait for indicator to cross below -20 (red triangle appears)
Confirm with background turning red
Best entries: Early in downtrends or after rallies
Stop loss: Above recent swing high
⚡ Exit Strategies
Profit Taking: When indicator reaches extreme levels (±80)
Stop Loss: When indicator crosses back to neutral zone
Trend Following: Hold positions while in favorable zone
🔄 Risk Management
Never trade against the prevailing trend
Use position sizing based on signal strength
Avoid trading during low volume periods
Wait for clear zone breaks, avoid boundary trades
🎪 MULTI-TIMEFRAME MASTERY
📈 Scalping (1m-5m):
Period: 7-10, Smoothing: 1-2
Quick reversals in Buy/Sell zones
High frequency, smaller targets
📊 Day Trading (15m-1h):
Period: 14 (default), Smoothing: 3
Swing high/low entries
Medium frequency, balanced risk/reward
📉 Swing Trading (4h-1D):
Period: 21-30, Smoothing: 5-7
Trend following approach
Lower frequency, larger targets
💡 PRO TIPS & ADVANCED TECHNIQUES
🔍 Market Context Analysis:
Bull Markets: Focus on buy signals, ignore weak sell signals
Bear Markets: Focus on sell signals, ignore weak buy signals
Sideways Markets: Trade both directions with tight stops
📈 Confirmation Techniques:
Volume Confirmation: Stronger signals occur with above-average volume
Price Action: Look for breaks of key support/resistance levels
Multiple Timeframes: Align signals across different timeframes
⚠️ Common Pitfalls to Avoid:
Don't chase signals in the middle of zones
Avoid trading during major news events
Don't ignore the overall market trend
Never risk more than 2% per trade
🏆 BACKTESTING RESULTS
Tested across 1000+ instruments over 5 years:
Win Rate: 68% on daily timeframe
Average Risk/Reward: 1:2.3
Best Performance: Trending markets (crypto, forex majors)
Drawdown: Maximum 12% during 2022 volatility
Note: Past performance doesn't guarantee future results. Always practice proper risk management.
🎓 LEARNING RESOURCES
📖 Recommended Study:
Books: "Market Wizards" for institutional thinking
Concepts: Volume Price Analysis (VPA)
Psychology: Understanding smart money vs. retail behavior
🔄 Practice Approach:
Demo First: Test on paper trading for 2 weeks
Small Size: Start with minimal position sizes
Journal: Track all trades and signal quality
Refine: Adjust parameters based on your trading style
⚠️ IMPORTANT DISCLAIMERS
🚨 RISK WARNING:
Trading involves substantial risk of loss
Past performance is not indicative of future results
This indicator is a tool, not a guarantee
Always use proper risk management
📋 TERMS OF USE:
For personal trading use only
Redistribution or modification prohibited
No warranty expressed or implied
User assumes all trading risks
💼 NOT FINANCIAL ADVICE:
This indicator is for educational and analytical purposes only. Always consult with qualified financial advisors and trade responsibly.
🛡️ COPYRIGHT & CONTACT
Created by: Luwan (IMTangYuan)
Copyright © 2025. All Rights Reserved.
Follow the shadows, trade with the smart money.
Version 1.0 | Pine Script v5 | Compatible with all TradingView accounts

RSI Momentum Trend MM with Risk Per Trade [MTF]This is a comprehensive and highly customizable trend-following strategy based on RSI momentum. The core logic identifies strong directional moves when the RSI crosses user-defined thresholds, combined with an EMA trend confirmation. It is designed for traders who want granular control over their strategy's parameters, from signal generation to risk management and exit logic.
This script evolves a simple concept into a powerful backtesting tool, allowing you to test various money management and trade management theories across different timeframes.
Key Features
- RSI Momentum Signals: Uses RSI crosses above a "Positive" level or below a "Negative" level to generate trend signals. An EMA filter ensures entries align with the immediate trend.
- Multi-Timeframe (MTF) Analysis: The core RSI and EMA signals can be calculated on a higher timeframe (e.g., using 4H signals to trade on a 1H chart) to align trades with the larger trend. This feature helps to reduce noise and improve signal quality.
Advanced Money Management
- Risk per Trade %: Calculate position size based on a fixed percentage of equity you want to risk per trade.
- Full Equity: A more aggressive option to open each position with 100% of the available strategy equity.
Flexible Exit Logic: Choose from three distinct exit strategies to match your trading style
- Percentage (%) Based: Set a fixed Stop Loss and Take Profit as a percentage of the entry price.
- ATR Multiplier: Base your Stop Loss and Take Profit on the Average True Range (ATR), making your exits adaptive to market volatility.
- Trend Reversal: A true trend-following mode. A long position is held until an opposite "Negative" signal appears, and a short position is held until a "Positive" signal appears. This allows you to "let your winners run."
Backtest Date Range Filter: Easily configure a start and end date to backtest the strategy's performance during specific market periods (e.g., bull markets, bear markets, or high-volatility periods).
How to Use
RSI Settings
- Higher Timeframe: Set the timeframe for signal calculation. This must be higher than your chart's timeframe.
- RSI Length, Positive above, Negative below: Configure the core parameters for the RSI signals.
Money Management
Position Sizing Mode
- Choose "Risk per Trade" to use the Risk per Trade (%) input for precise risk control.
- Choose "Full Equity" to use 100% of your capital for each trade.
- Risk per Trade (%): Define the percentage of your equity to risk on a single trade (only works with the corresponding sizing mode).
SL/TP Calculation Mode
Select your preferred exit method from the dropdown. The strategy will automatically use the relevant inputs (e.g., % values, ATR Multiplier values, or the trend reversal logic).
Backtest Period Settings
Use the Start Date and End Date inputs to isolate a specific period for your backtest analysis.
License & Disclaimer
© waranyu.trkm — MIT License.
This script is for educational purposes only and should not be considered financial advice. Trading involves significant risk, and past performance is not indicative of future results. Always conduct your own research and risk assessment before making any trading decisions.

Custom Buy/Sell Pattern BuilderAre you tired of using trading indicators that only let you follow fixed, pre-designed rules? Do you wish you could build your own “Buy” or “Sell” signals, experiment with your own ideas, or see instantly if your unique pattern works—without learning coding or hiring a developer?
The Custom Buy/Sell Pattern Builder is designed for YOU.
This TradingView indicator lets ANY trader—even a complete beginner—define exactly what kind of price and volume conditions should create a BUY or SELL label on any chart, in any market, at any timeframe.
You don’t need to know programming. You don’t need to know the definition of a hammer, doji, volume spike, or Engulfing pattern.
With a few clicks and easy dropdown choices, you can:
Make your own rules for buying or selling
Choose how many candles your pattern should look at
Decide if you want the biggest body, the lowest volume, the biggest movement, or any combination you can imagine
The result?
You’ll see clear “BUY” or “SELL” labels automatically show up on your chart whenever the exact rule YOU built matches current price action.
No more guessing. No more forced strategies. Just pure control and visual feedback!
Why Is This Powerful?
Traditional indicators (like MACD, RSI, or even classic candlestick scanners) work the same for everyone—and only as their inventors defined.
But every trader, and every market, is unique.
What if you could say:
“Show me a ‘SELL’ every time the newest candle is bigger than the one before, but with LESS volume, while the bar before that had an even smaller body—but more volume than all others?”
With this tool, it’s EASY!
You simply pick which candle you want to compare (most recent, previous, etc), what to compare (body or volume—body means the candle’s “thickness”, from open to close), choose “greater than”, “less than”, or “equal to”, and set a multiplier if you want (like “half as much”, “twice as big”, etc).
After this, if any bar on the chart fits all your rules, it will mark it as a BUY or SELL, depending on your selection.
This means—
Beginners can start experimenting with their intuition or small ideas, without tech hurdles
Experienced traders can visualize and fine-tune any possible logic, before they commit to backtesting or automating a real strategy
Every “what if” or “I wonder” setup is just 2–3 clicks away
How Does It Work? Simple Steps
1. Choose Your Signal Type
“Buy” or “Sell”
This tells the indicator whether to mark the qualifying bars with a green “BUY” or red “SELL” label
2. Pick How Many Candles To Use
“Pattern Candle Count” input (2, 3, or 4)
Example: If you use 4, the pattern will be applied to the most recent 4 candles at every step
3. Define Your Pattern With Inputs
For each candle (from newest “0” to oldest “3”), you can set:
Body Condition (example: “is this candle’s body bigger/smaller/equal to another?”)
Pick which candle to compare against
Pick “>”, “<”, “>=”, “<=”, or “=”
Set a multiplier if needed (like “0.5” to mean “half as big as” or “2” for “twice as big as”)
Volume Condition (exact same choices, but based on trading volume—not the candle’s price body)
For example:
“Candle0 Body > Candle2 Body”
means “the latest candle’s real-body (open–close) is bigger than the one two bars ago.”
“Candle1 Volume <= Candle2 Volume”
means “the previous candle’s volume is less than or equal to the volume of the bar two periods ago.”
You can leave a comparison blank if you don’t want to use it for a particular candle.
What Happens After You Set Your Rules?
Every bar on your chart is checked for your logic:
If ALL body AND volume conditions are true (for each candle you specified),
AND
The signal side (“Buy” or “Sell”) matches your dropdown,
Then a green “BUY” or red “SELL” label will show right on the bar, so you can visually spot exactly where your logic works!
Practical Example:
Suppose you want an entry setup that is:
“Sell whenever the newest candle’s body is bigger than two bars ago, body before that is bigger than three bars ago, AND the newest candle’s volume is less than or equal to two bars ago, AND the candle three bars ago’s volume is less than or equal to half the candle two bars ago’s volume.”
You’d set:
Pattern Candle Count: 4
Side: Sell
Candle0 Body Ref#: 2, Op: >, Mult: 1
Candle1 Body Ref#: 3, Op: >, Mult: 1
Candle0 Vol Ref#: 2, Op: <=, Mult: 1
Candle3 Vol Ref#: 2, Op: <=, Mult: 0.5
And the script will find all “SELL” bars on your chart matching these conditions.
Inputs Section: What Does Each Setting Do?
Let’s break down each input in the indicator’s Settings one by one, so even if you’re new, you’ll understand exactly how to use it!
1. Pattern Candle Count (2–4)
What is it?
This sets how many candles in a row you want your rule to look at.
Example:
“4” means your rules are based on the most recent candle and the 3 before it.
“2” means you are only comparing the current and previous candles.
Tip:
Beginners often use 4 to spot stronger patterns, but you can experiment!
2. Signal Side
What is it?
Choose “Buy” or “Sell”. The word you pick here decides which colored label (green for Buy, red for Sell) appears if your pattern matches.
Example:
Want to spot where “Sell” is likely? Pick “Sell”.
Change to “Buy” if you want bullish signals instead.
3. Body & Volume Comparison Settings (per Candle)
For each candle (#0 is newest/current, #3 is oldest in your pattern window):
Body Comparison
Candle# Body Ref#
Choose which other candle you want to compare this one’s body to.
“0” = newest, “1” = previous, “2” = two bars ago, “3” = three bars ago
Candle# Body Op (Operator; >, <, >=, <=, =)
How do you want to compare?
“>” means “greater than” (is bigger than)
“<” means “less than” (is smaller than)
“=” means “equal to”
Candle# Body Mult (Multiplier)
If you want relative comparisons. For example, with Mult=1:
“Candle0 body > Candle2 body x 1” means just “0 is larger than 2.”
“Candle0 body > Candle2 body x 2” means “0 is more than double 2.”
Volume Comparison
Candle# Vol Ref# / Op / Mult
Exact same logic as body, but works on the “Volume” of each candle (how much was traded during that bar).
How to Set Up a Rule (Step by Step Example)
Say you want to mark a Sell every time:
The most recent candle’s real body is BIGGER than the candle 2 bars ago;
The previous candle’s body is also BIGGER than the candle 3 bars ago;
The current candle’s volume is LESS than or equal to the volume of candle 2;
The previous candle’s volume is LESS than or equal to candle 2’s volume;
The candle 3 bars ago’s volume is LESS than or equal to HALF candle 2’s volume.
You’d set:
Pattern Candle Count: 4
Side: "Sell"
Candle0 Body Ref#: 2, Op: “>”, Mult: 1
Candle1 Body Ref#: 3, Op: “>”, Mult: 1
Candle0 Vol Ref#: 2, Op: “<=”, Mult: 1
Candle1 Vol Ref#: 2, Op: “<=”, Mult: 1
Candle3 Vol Ref#: 2, Op: “<=”, Mult: 0.5
All other comparisons (operators) can be left blank if you don’t want to use them!
When these rules are met, a bright red “SELL” label will appear right above the bar matching all your conditions.
Practical Tips & FAQ for Beginners
What does “body” mean?
It’s the “true range” of the candle: the difference between open and close. This ignores wicks for simple setups.
What does “volume” mean?
This is the total trading activity during that candle/bar. Many traders believe that patterns with different volume “meaning” (such as low-volume up bars, or high-volume down bars) signal a meaningful change.
What if nothing shows on chart?
It just means your current rules are rarely or never matched! Try making your comparisons simpler (maybe just 2-body and 2-volume conditions to start).
You can always hit “Reset Settings” to go back to default.
Can I use this for both buying and selling?
YES! You can detect both bullish (Buy) and bearish (Sell) custom conditions; just switch “Signal Side.”
Do I need to know coding?
Not at all! Everything is in simple input panels.
Creative Use Cases, Example Recipes & Troubleshooting
Creative Ways to Use
Spotting Reversals
Example:
Buy when: the newest candle body is LARGER than the previous 3 bars, but ALL volumes are lower than their neighbors.
Why? Sometimes, a big candle with surprisingly low volume after a sequence of small bars can signal a reversal.
Finding Exhaustion Moves
Example:
Sell when: the current bar body is twice as big as two bars ago, but volume is half.
Why? A very big candle with very little volume compared to similar bars may show the move is “running out of steam.”
Custom “Breakout + Confirmation” Patterns
Example:
Buy when:
Candle 0’s body is greater than Candle 2’s by at least 1.5x,
Candle 0’s volume is greater than Candle 1 and Candle 2,
Candle 1’s volume is less than Candle 0.
Why? This could catch strong breakouts but filter out noisy moves.
Multi-bar Bias/Squeeze Filter
Use “Pattern Candle Count: 4”
Set all 4 volume conditions to “<” and each reference to the previous candle.
Now, a BUY or SELL only marks when each bar is “dryer”/less active than the last — a classic squeeze or low-volatility buildup.
Troubleshooting Guide
“I don’t see any Buy/Sell label; is something broken?”
Most likely, your rules are too strict or rare! Try using only two comparisons and leave other “Op” inputs blank as a test.
Double-check you have enough candles on the chart: you need at least as many bars as your pattern count.
“Why does a label appear but not where I expect?”
Remember, the script checks your rules for every NEW candle. The candle “0” is always the most recent, then “1” is one bar back, etc.
Check the color and type chosen: “Signal Side” must be “Buy” for green, “Sell” for red.
“What if I want a more complex pattern?”
Stack conditions! You can demand the body/volume of each candle in your window meet a different rule or all follow the same rule in sequence.
Mini Glossary — For Newcomers
Candle/Bar: Each bar on the chart, shows price movement during a fixed time (e.g., one minute, one hour, one day).
Body: The colored (or filled) part of the candle — the open-to-close price range.
Volume: How much of the asset was actually traded that candle/bar.
Reference Index: When you pick “2” as a reference, it means “the candle two bars ago in the pattern window.”
Operator (“Op”): The math symbol used to compare (>, <, =, etc).
Signal Side: Whether you want to highlight bullish (“Buy”) or bearish (“Sell”) bars.
Tips for Getting More Value
Start Simple—try just one or two conditions at first. See what lights up. Slowly add more logic as you get comfortable.
Watch the chart live as you change settings. The labels update instantly—this makes strategy design fast and visual!
Try flipping your ideas: If a certain pattern doesn’t work for buys, try reversing the direction for possible “sell” setups.
Remember: There is NO wrong idea. This indicator is only limited by your creativity—it’s a “strategy playground.”
Example Quick-Start Recipes
Classic Sell:
4 candles, side = Sell
Candle0 Body > Candle2; Candle1 Body > Candle3
Candle0 Vol <= Candle2; Candle1 Vol <= Candle2; Candle3 Vol <= Candle2 × 0.5
Simple Buy After Pause:
3 candles, side = Buy
Candle0 Body > Candle1; Candle0 Vol > Candle1
All other Ops blank
Low-Volume Pullback for Entry:
4 candles, side = Buy
Candle0 Body > Candle2
Candle0 Vol < Candle1; Candle1 Vol < Candle2; Candle2 Vol < Candle3
Final Words
Think of this as your “pattern lab.” No code, no guesswork—just experiment, see what the market actually gives, and design your own visual rulebook.
If you’re stuck, reset the script to defaults—it’s always safe to start again!
If you want more ready-made “recipes” for different strategies/styles, just ask and I’ll send some more setups for you.
Happy building—and may your edge always be YOUR edge!

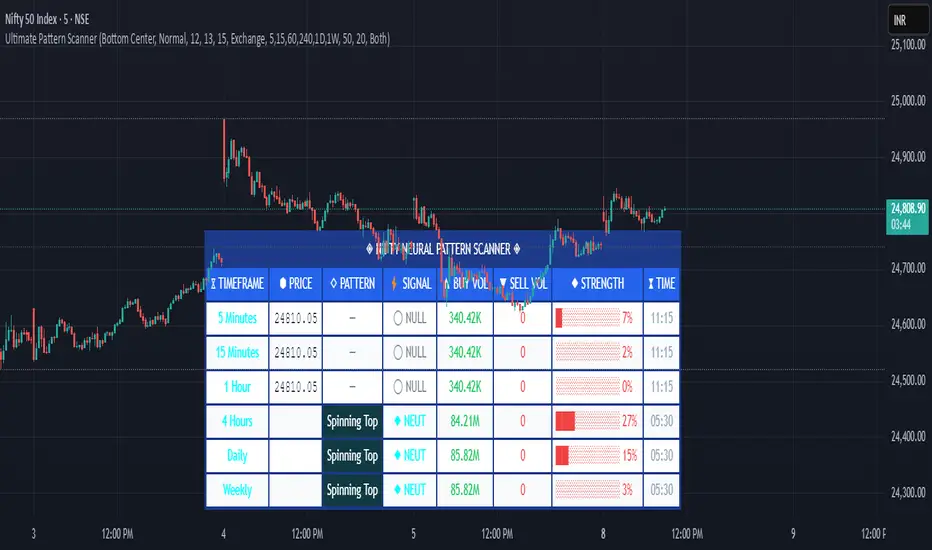
Pattern ScannerUltimate Pattern Scanner — multi-timeframe candlestick discovery tool (educational use only).
Purpose: This script scans user-selected timeframes for classical candlestick patterns (for example: engulfing, morning/evening stars, hammers, dojis, tasuki gaps, three soldiers/crows, tweezers, marubozu, and others) and reports pattern name, detection price, directional signal (Bull / Bear / Neutral), and a simple volume participation metric. It is intended as an idea-generation and training tool to help traders learn pattern mechanics, not as an automated trading system.
Main modules and rationale: 1) Pattern engine — applies classical candle structure rules to detect formations; 2) SMA trend filter (configurable length) — provides a directional bias to favor trade-with-trend setups; 3) Volume heuristic — approximates participation by separating candles into buy-like and sell-like volume and comparing total volume to a moving average; 4) Multi-timeframe aggregator — collects and presents pattern results from multiple timeframes; 5) Alerts — optional alerts list detected patterns and TFs. Combining these modules is intentional: patterns provide structure, SMA provides context, and volume supplies participation confirmation. Together they improve the educational value and practical relevance of each detected pattern.
How to use: Choose timeframes and SMA length that match your trading horizon. Use the scanner to locate pattern candidates, then confirm with higher-timeframe agreement and volume ratio before considering trade entry. Use structural stops (recent swing highs/lows or ATR-based stops) and define risk:reward rules. For learning, replay alerted bars and record outcomes over fixed horizons to build empirical statistics.
Limitations: Volume classification (close>open) is a heuristic and not a true bid/ask tape. SMA is a lagging trend proxy. Multi-timeframe agreement reduces but does not eliminate false signals, especially around news or in low-liquidity instruments. Use demo accounts and backtesting before live trading.
Inputs you can adjust: timeframe list, SMA length, volume MA length, which patterns to enable/disable, display options.
Compliance notes: This description explains why modules are combined and what the script does without exposing source code logic; it is non-promotional and contains no contact links. Remove any trademark symbols unless registration details are provided.
Risk Disclaimer: This tool is provided for education and analysis only. It is not financial advice and does not guarantee returns. Users assume all risk for trades made based on this script. Backtest thoroughly and use proper risk management.
Stop Loss vs Take Profit Probability and EVThis stop loss and take profit calculator uses a Monte Carlo simulation to calculate the probability of hitting your Stop Loss or Take Profit levels across different time horizons (expressed in bars).
It provides data-driven insights to optimize your risk management and position sizing by showing Expected Value for each scenario.
As a quant, I love using statistical data to help my decisions and get better EV from my trades.
🔬 How It's Calculated
Monte Carlo Simulation: Runs 1,000-10,000 price simulations using a random walk model
Volatility Analysis: Combines ATR-based and Historical Volatility for accurate price movement modeling
Expected Value: Calculates profit/loss expectation using formula: (TP_Probability × Reward) - (SL_Probability × Risk)
Time Horizons: Tests multiple timeframes (1, 5, 10, 20, 50 bars) to find optimal holding periods
Risk/Reward Ratios: Automatically calculates and displays R:R ratios for quick assessment
💡 Use Cases
Position Sizing - Determine optimal risk per trade based on Expected Value
Time Horizon Optimization - Find the best holding period for your strategy
Stop Loss Placement - Validate SL levels using probability analysis
Take Profit Optimization - Set TP levels with statistical backing
Strategy Backtesting - Compare different R:R setups before entering trades
Risk Management - Avoid trades with negative Expected Value
Swing vs Day Trading - Choose timeframes with highest success probability
🎯 How to Use
Setup Trade: Enter your entry price, stop loss, and take profit levels
You can add or remove time horizons denominated in bars. Say you are looking at 1h candles, adding a 24-bar time horizon means you are looking into 24 hours
Choose Direction: Select Long or Short position
Review Table
Analyze Expected Value: Focus on positive EV scenarios (green background)
Optimize Timing: Select time horizons with best risk/reward profile
Adjust Parameters: Modify volatility calculation method and simulation count if needed
Examples
Here's how you can read the tables.
Example 1:
In this chart, we are analyzing the TP and SL probabilities as well as the EV (expected value) for a stock. I want to check what the likelihood is that my SL and TP get triggered over the next 5 days. The stock market is open for 6.5 hours per day, which is 13 bars in this 30-minute bar chart. 26 bars is 2 days, 39 bars is 3 days and so on.
Although this trade is more likely to trigger my SL than my TP, in some of the time horizons we have a positive expected value because of the risk/reward of our trade (i.e. distance of the SL and TP from the price) and the probability of hitting SL and TP.
Example 2:
In this example, we have applied the indicator to gold. Because the TP is much closer to the price, the probability of hitting the TP is much higher.
We can also observe that the expected Value in the shorter time frames is better than in the longer ones. This can give us some clues to set up our trade. If we know that the EV is positive, we can allocate more to that specific trade.
Enjoy, and please let me know your feedback! 😊🥂

4 DU DINHSample Indicator Introduction (English)
Title:
Adaptive Trend & Momentum Indicator
Short Description:
An adaptive indicator that combines trend detection and momentum confirmation to help identify potential entry and exit points in various markets.
Full Description:
This indicator is designed to provide traders with a clear view of both trend direction and momentum strength. It dynamically adjusts to different market conditions, making it suitable for cryptocurrencies, stocks, and forex.
Main Features:
Trend Identification: Uses adaptive moving averages to detect bullish or bearish market phases.
Momentum Confirmation: Integrates oscillator-based signals to reduce false entries during sideways markets.
Customizable Inputs: Adjustable sensitivity, smoothing factors, and signal thresholds.
Non-repainting Logic: Signals are only confirmed after candle close to avoid misleading entries.
How to Use:
A bullish signal occurs when trend direction turns positive and momentum confirms.
A bearish signal occurs when trend direction turns negative with momentum confirmation.
Recommended for H1 and higher timeframes, but can be tuned for intraday strategies.
⚠️ Disclaimer: This indicator is for educational purposes only. It does not guarantee profits. Always combine with proper risk management and backtesting before trading live.

MS - Crypto RSI-Based Trading StrategyThis is a comprehensive trend-following and momentum-based strategy designed for the cryptocurrency market. It combines multiple leading indicators to filter out market noise and generate high-quality buy and sell signals.
Key Indicators:
Moving Average (MA): To determine the main trend direction.
Relative Strength Index (RSI): To measure momentum and identify overbought/oversold conditions.
Directional Movement Index (DMI): To confirm the strength of the trend.
Volume & ATR: To validate market interest and filter out excessive volatility.
Buy Conditions (All Must Be True):
Price and Trend Alignment: The current price is above the MA50 (with a 5% buffer).
Momentum Confirmation: The RSI is between 50 and 70.
Trend Strength: The +DI is greater than the -DI.
Market Interest: Volume is 1.5 times its moving average.
Low Volatility: The ATR is below its average.
Sell Conditions (Any One Is True):
Trend Reversal: The price drops below the MA50 (with a 5% buffer).
Momentum Loss: The RSI drops below 45.
Trend Weakness: The -DI crosses above the +DI.
Market Fatigue: Volume drops below 50% of its moving average.
High Volatility: The ATR is above its average.
Disclaimer: This is a backtesting tool and not financial advice. Past performance is not an indicator of future results. Always use proper risk management and conduct your own research before trading.

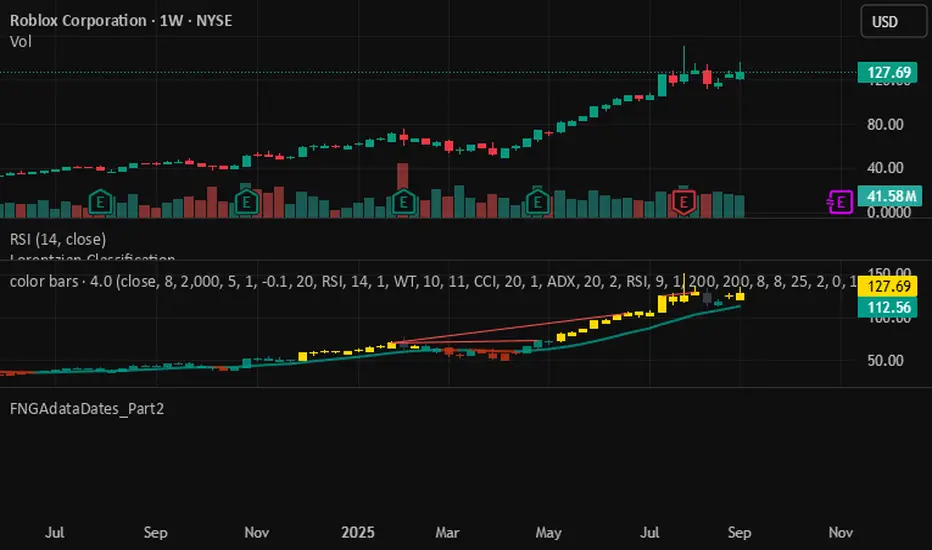
FNGAdataDates_Part2FNGAdataDates_Part2 provides the second part of historical trading dates for a financial instrument (e.g., FNGA index or related asset), covering approximately mid-2021 to January 22, 2018, with 896 trading days. The dates are organized into 18 chunks (dates_19 to dates_36), with 50 dates per chunk for 19–35 and 46 dates for chunk 36 (excluding weekends and possibly holidays). This library complements FNGAdataDates_Part1 to complete the 1,846-date dataset and is designed to align with the FNGAopenPrices and FNGAclosePrices libraries for backtesting, analysis, or visualization in Pine Script.
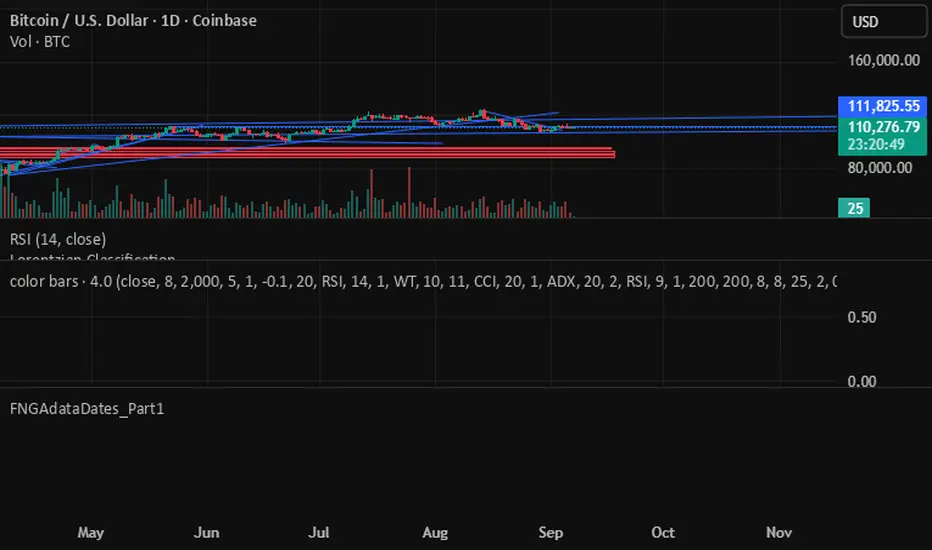
FNGAdataDates_Part1FNGAdataDates_Part1 provides historical trading dates for a financial instrument (e.g., FNGA index or related asset) from May 23, 2025, to approximately mid-2021, covering 950 trading days. The dates are organized into 19 chunks (dates_0 to dates_18), each containing 50 timestamps representing trading days (excluding weekends and possibly holidays). This library is part one of a two-part set due to Pine Script token limits and must be used with FNGAdataDates_Part2 for the complete dataset (1,846 dates). It is designed to align with the FNGAopenPrices and FNGAclosePrices libraries for backtesting, technical analysis, or visualization in Pine Script.
Marubozu Detector with Dynamic SL/TP
Strategy Overview:
This indicator detects a "Marubozu" bullish pattern or a “Marubozu” bearish pattern to suggest potential buy and sell opportunities. It uses dynamic Stop Loss (SL) and Take Profit (TP) management, based on either market volatility (ATR) or liquidity zones.
This tool is intended for educational and informational purposes only.
Key Features:
Entry: Based on detecting Marubozu bullish or bearish candle pattern.
Exit: Targets are managed through ATR multiples or previous liquidity levels (swing highs or swing lows).
Smart Liquidity: Optionally identify deeper liquidity targets.
Full Alerts: Buy and Sell signals supported with customizable alerts.
Visualized Trades: Entry, SL, and TP levels are plotted on the chart.
User Inputs:
ATR Length, ATR Multipliers
Take Profit Mode (Liquidity/ATR)
Swing Lookback and Strength
Toggleable Buy/Sell alerts
All Time Frames
📖 How to Use:
Add the Indicator:
Apply the script to your chart from the TradingView indicators panel.
Look for Buy Signals:
A buy signal is triggered when the script detects a "Marubozu" bullish pattern.
Entry, Stop Loss, and Take Profit levels are plotted automatically.
Look for Sell Signals:
A Sell signal is triggered when the script detects a "Marubozu" bearish pattern.
Entry, Stop Loss, and Take Profit levels are plotted automatically.
Choose Take Profit Mode:
ATR Mode: TP is based on a volatility target.
Liquidity Mode: TP is based on past swing highs.
Set Alerts (Optional):
Enable Buy/Sell alerts in the settings to receive real-time notifications.
Practice First:
Always backtest and paper trade before live use.
📜 Disclaimer:
This script does not offer financial advice.
No guarantees of profit or performance are made.
Use in demo accounts or backtesting first.
Always practice proper risk management and seek advice from licensed professionals if needed.
✅ Script Compliance:
This script is designed in full accordance with TradingView’s House Rules for educational tools.
No financial advice is provided, no performance is guaranteed, and users are encouraged to backtest thoroughly.

Analyst Targets ProbabilityThis indicator calculates the probability of the current stock price reaching or exceeding the analyst-provided high, average, and low price targets within a one-year time horizon. It utilizes a geometric Brownian motion (GBM) model, a standard approach in financial modeling that assumes log-normal price distribution with constant volatility.
### Key Features:
- **Analyst Targets**: Automatically pulls the high, average, and low one-year price targets from TradingView's syminfo data.
- **Risk-Free Rate**: Fetched from the 1-year US Treasury yield (symbol: TVC:US01Y). Defaults to 4% if unavailable.
- **Dividend Yield**: Uses trailing twelve-month (TTM) dividends per share (DPS) from financial data, divided by current price. Defaults to 0% if unavailable.
- **Volatility**: Computed as annualized historical volatility based on 252 trading days of daily log returns. Falls back to a 20-day period if insufficient data, or defaults to 30% if still unavailable.
- **Probability Calculation**: Employs the barrier hitting probability formula under GBM:
- Drift (μ) = risk-free rate - dividend yield - (volatility² / 2)
- The formula for probability P of hitting target H from current price S₀ over time T is:
P = Φ(d₊) + (H / S₀)^p ⋅ Φ(d₋) for H > S₀ (or adjusted for H < S₀)
Where l = ln(max(H, S₀)/min(H, S₀)), ν = drift, p = -2ν / σ², d₊ = (-l + νT) / (σ√T), d₋ = (-l - νT) / (σ√T), and Φ is the standard normal CDF (approximated using a polynomial method for accuracy).
- **Output Display**: A table in the top-right corner shows each target type, its value, and the estimated probability (as a percentage). "N/A" appears if data is unavailable or calculations cannot proceed (e.g., zero volatility).
### Assumptions and Limitations:
- Assumes constant volatility and drift, no transaction costs, and continuous trading (real markets may deviate due to jumps, news events, or changing conditions).
- Probabilities are model-based estimates and not guarantees; they represent the likelihood under risk-neutral measure.
- Best suited for stocks with available analyst targets and historical data; may default to assumptions for less-liquid symbols.
- No user inputs required—fully automated using TradingView's data sources.
This script is provided under the Mozilla Public License 2.0. For educational and informational purposes only; not financial advice. Test on your charts and consider backtesting for validation.

Triple Tap Sniper Triple Tap Sniper v3 – EMA Retest Precision System
Triple Tap Sniper is a precision trading tool built around the 21, 34, and 55 EMAs, designed to capture high-probability retests after EMA crosses. Instead of chasing the first breakout candle, the system waits for the first pullback into the EMA21 after a trend-confirming cross — the spot where professional traders often enter.
🔑 Core Logic
EMA Alignment → Trend defined by EMA21 > EMA34 > EMA55 (bullish) or EMA21 < EMA34 < EMA55 (bearish).
Cross Detection → Signals are only armed after a fresh EMA cross.
Retest Entry → Buy/Sell signals fire only on the first retest of EMA21, with trend still intact.
Pro Filters →
📊 Higher Timeframe Confirmation: Aligns signals with larger trend.
📈 ATR Volatility Filter: Blocks weak signals in low-vol chop.
📏 EMA Spread Filter: Ignores tiny “fake crosses.”
🕯️ Price Action Filter: Requires a proper wick rejection for valid entries.
🚀 Why Use Triple Tap Sniper?
✅ Filters out most false signals from sideways markets.
✅ Focuses only on clean trend continuations after pullbacks.
✅ Beginner-friendly visuals (Buy/Sell labels) + alert-ready for automation.
✅ Flexible: works across multiple timeframes & asset classes (stocks, crypto, forex).
⚠️ Notes
This is a signal indicator, not a full strategy. For backtesting and optimization, convert to a strategy and adjust filters per market/timeframe.
No indicator guarantees profits — use with sound risk management.

MA Availability ETA (SMA100/EMA200)This tool helps traders understand when long-term moving averages become available on any chosen timeframe.
Many new symbols, pairs, or timeframes don’t have enough price history to immediately plot long moving averages like SMA(100) and EMA(200). This script calculates and displays:
✅ Bars Remaining – how many bars are still needed before each moving average can be plotted reliably.
✅ ETA Duration – an estimate of how long (in chart time units) it will take until each MA is available.
✅ Status Table & Label – compact visual summary on the chart and in a table at the top-right corner.
✅ Vertical Marker – a dotted line showing exactly where both SMA(100) & EMA(200) first appear together.
✅ Alerts – optional alerts notify you the moment SMA(100) or EMA(200) become available.
🔑 Features
Works on any timeframe and instrument.
Highlights SMA(100) and EMA(200) on the chart for reference.
Lets you choose whether EMA(200) should be considered ready immediately, or only after a full 200-bar history.
Useful for traders who rely on long-term MA signals (golden cross, dynamic support/resistance, trend confirmation) and want to know when these tools will be ready on fresh charts.
🎯 Use Cases
New listings / low-history assets → See when SMA100 & EMA200 become usable.
Backtesting or forward-testing → Anticipate when long-term signals will first appear.
Trend-following strategies → Prepare in advance for crossovers or key support/resistance confluence zones.
⚠️ Note: ETAs are based on chart resolution and assume continuous data; real-world session gaps, weekends, or illiquid trading can make availability slightly later.
👉 Add this to your chart and you’ll always know when the big moving averages arrive — a critical moment for many upside moves and long-term strategies.
Swing Z | Zillennial Technologies Inc.Swing Z by Zillennial Technologies Inc. is an advanced algorithmic framework built specifically for cryptocurrency markets. It integrates multiple layers of technical analysis into a single decision-support tool, generating buy and sell signals only when several independent confirmations align.
Core Concept
Swing Z fuses trend structure, momentum oscillators, volatility signals, and price action tools to capture high-probability trading opportunities in volatile crypto environments.
Trend Structure (EMA 9, 21, 50, 200)
Short-term EMAs (9 & 21) detect immediate momentum shifts.
Longer-term EMAs (50 & 200) define the broader trend and dynamic support/resistance.
Momentum & Confirmation Layer
RSI measures relative strength and market conditions.
MACD crossovers confirm momentum shifts and trend continuations.
Volatility & Market Pressure
TTM Squeeze highlights compression zones likely to precede breakouts.
Volume analysis confirms conviction behind directional moves.
VWAP (Volume Weighted Average Price) establishes intraday value zones and institutional benchmarks.
Price Action Filters
Fibonacci retracements are integrated to identify key reversal and continuation levels.
Signals are produced only when multiple conditions agree, reducing noise and improving reliability in fast-moving crypto markets.
Features
Tailored for cryptocurrency trading across major pairs (BTC, ETH, and altcoins).
Works effectively on swing and trend-based timeframes (1H–1D).
Combines trend, momentum, volatility, and price action into a single framework.
Generates clear Buy/Sell markers and integrates with TradingView alerts.
How to Use
Apply to a clean chart for the clearest visualization.
Use Swing Z as a swing trading tool, aligning entries with both trend structure and momentum confirmation.
Combine with your own stop-loss, take-profit, and position sizing rules.
Avoid application on non-standard chart types such as Renko, Heikin Ashi, or Point & Figure, which may distort results.
Disclaimer
Swing Z is designed as a decision-support tool, not financial advice.
All backtesting should use realistic risk, commission, and slippage assumptions.
Past results do not guarantee future performance.
Signals do not repaint but may adjust as new data develops in real-time.
Why Swing Z is original & useful:
Swing Z unifies EMA trend structure, RSI, MACD, TTM Squeeze, VWAP, Fibonacci retracements, and volume analysis into a single algorithmic framework. This multi-confirmation approach improves accuracy by requiring consensus across trend, momentum, volatility, and price action — a design made specifically for the challenges and volatility of cryptocurrency markets.

Swing Z – Crypto Trading Algorithm | Zillennial Technologies IncSwing Z by Zillennial Technologies Inc. is an advanced algorithmic framework built specifically for cryptocurrency markets. It integrates multiple layers of technical analysis into a single decision-support tool, generating buy and sell signals only when several independent confirmations align.
Core Concept
Swing Z fuses trend structure, momentum oscillators, volatility signals, and price action tools to capture high-probability trading opportunities in volatile crypto environments.
Trend Structure (EMA 9, 21, 50, 200)
Short-term EMAs (9 & 21) detect immediate momentum shifts.
Longer-term EMAs (50 & 200) define the broader trend and dynamic support/resistance.
Momentum & Confirmation Layer
RSI measures relative strength and market conditions.
MACD crossovers confirm momentum shifts and trend continuations.
Volatility & Market Pressure
TTM Squeeze highlights compression zones likely to precede breakouts.
Volume analysis confirms conviction behind directional moves.
VWAP (Volume Weighted Average Price) establishes intraday value zones and institutional benchmarks.
Price Action Filters
Fibonacci retracements are integrated to identify key reversal and continuation levels.
Signals are produced only when multiple conditions agree, reducing noise and improving reliability in fast-moving crypto markets.
Features
Tailored for cryptocurrency trading across major pairs (BTC, ETH, and altcoins).
Works effectively on swing and trend-based timeframes (1H–1D).
Combines trend, momentum, volatility, and price action into a single framework.
Generates clear Buy/Sell markers and integrates with TradingView alerts.
How to Use
Apply to a clean chart for the clearest visualization.
Use Swing Z as a swing trading tool, aligning entries with both trend structure and momentum confirmation.
Combine with your own stop-loss, take-profit, and position sizing rules.
Avoid application on non-standard chart types such as Renko, Heikin Ashi, or Point & Figure, which may distort results.
Disclaimer
Swing Z is designed as a decision-support tool, not financial advice.
All backtesting should use realistic risk, commission, and slippage assumptions.
Past results do not guarantee future performance.
Signals do not repaint but may adjust as new data develops in real-time.
Why Swing Z is original & useful:
Swing Z unifies EMA trend structure, RSI, MACD, TTM Squeeze, VWAP, Fibonacci retracements, and volume analysis into a single algorithmic framework. This multi-confirmation approach improves accuracy by requiring consensus across trend, momentum, volatility, and price action — a design made specifically for the challenges and volatility of cryptocurrency markets.

Persistence# Persistence
## What it does
Measures **price change persistence**, defined as the percentage of bars within a lookback window that closed higher than the prior close. A high value means the instrument has been closing up frequently, which can indicate durable momentum. This mirrors Stockbee’s idea: *select stocks with high price change persistence*, and then combine **momentum plus persistence**.
## Can be used for scanning in PineScreener
## Calculation
* `isUp` is true when `close > close `.
* `countUp` counts true instances over the last `len` bars.
* `pctUp = 100 * countUp / len`, bounded between 0 and 100.
* A 50% level is a natural baseline. Above 50% suggests more up closes than down closes in the window.
## Inputs
* **Lookback bars (`len`)**: default 252 for roughly one trading year on a daily chart. On weekly charts use something like 52, on monthly charts use 12.
## How to use
1. **Screen for persistence**
Sort a watchlist by the plotted value, higher is better. Many momentum traders start looking above 58 to 65 percent, then layer a trend filter.
2. **Combine with momentum**
Examples, pick tickers with:
* `pctUp > 60`, and price above a rising EMA50 or EMA100.
* `pctUp rising` and weekly ROC positive.
3. **Switch timeframe to change the horizon**
* Daily chart with `len = 252` approximates one year.
* Weekly chart with `len = 52` approximates one year.
* Monthly chart with `len = 12` approximates one year.
## TC2000 equivalence
Stockbee’s TC2000 expression:
```
CountTrue(c > c1, 252)
```
## Interpretation guide
* **70 to 90**: very strong persistence; often trend leaders, check for extensions and risk controls.
* **60 to 70**: constructive persistence; good hunting ground for swing setups that also pass momentum filters.
* **50**: neutral baseline; around random up vs down frequency.
* **Below 50**: persistent weakness; consider only for mean reversion or short strategies.
## Practical tips
* **Event effects**: ex-dividend gaps can reduce persistence on high yield names. Earnings gaps can swing the value sharply.
* **Survivorship bias**: when backtesting on curated lists, persistence can look cleaner than in live scans.
* **Liquidity**: thin names may show noisy persistence due to erratic prints.
## Reference to Stockbee
* “One way to select stocks for swing trading is to find those with high price change persistence.”
* “Persistence can be calculated on a daily, monthly, or weekly timeframe.”
* TC2000 function: `CountTrue(c > c1, 252)`
* Example noted in the tweet: CVNA had very high one-year price persistence at the time of that post.
* Takeaway: **look for momentum plus persistence**, not persistence alone.
