Combo 2/20 EMA & Bandpass Filter by TamarokDescription:
This strategy combines a 2/20 exponential moving average (EMA) crossover with a custom bandpass filter to generate buy and sell signals.
Use the Fast EMA and Slow EMA inputs to adjust trend sensitivity, and the Bandpass Filter Length, Delta, and Zones to fine-tune momentum turns.
Signals occur when both EMA and BPF agree in direction, with optional reversal and time filters.
How to use:
1. Add the script to your chart in TradingView.
2. Adjust the EMA and BP Filter parameters to match your asset’s volatility.
3. Enable ‘Reverse Signals’ to trade counter-trend, or use the time filter to limit sessions.
4. Set alerts on Long Alert and Short Alert for automated notifications.
Inspiration:
Based on HPotter’s original combo strategy (Stocks & Commodities Mar 2010).
Updated to Pine Script v6 with streamlined code and alerts.
WARNING:
For purpose educate only
Cerca negli script per "backtesting"

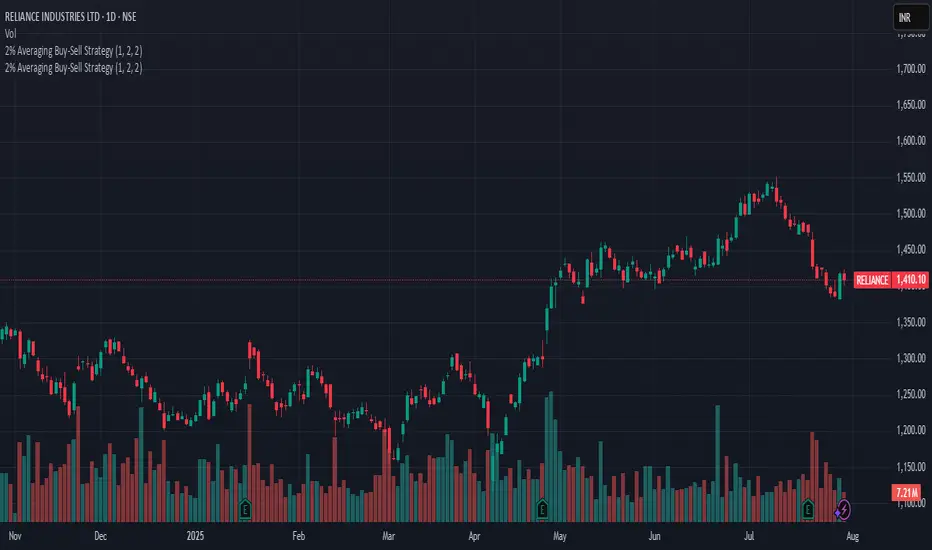
2% Averaging Buy-Sell Strategy📘 Strategy Description: 2% Averaging Buy-Sell Strategy
This strategy is designed to simulate an averaging-down and scaling-out approach based on percentage-based price movements.
Entry Logic (Buy):
Initial buy of 1 lot is triggered at the start of the strategy.
Every time the price drops by 2% from the last executed buy level, the strategy adds 2 more lots.
Exit Logic (Sell):
When the price rises 2% from the last buy level, the strategy sells 2 lots.
Selling continues in batches of 2 lots as long as the upward movement continues and lots are available.
Core Idea:
This is a dynamic averaging system that increases exposure during drawdowns and reduces it during rallies, aiming to capture mean reversion or trend reversals.
Customizable Inputs:
Initial lot size
Additional lot size
Percentage threshold (default 2%)
⚠️ Note: This strategy is for simulation/backtesting purposes. It does not account for slippage, fees, or real-world order execution conditions.
Opening-Range BreakoutNote: Default trading date range looks mediocre. Set date range to "Entire History" to see full effect of the strategy. 50.91% profitable trades, 1.178 profit factor, steady profits and limited drawdown. Total P&L: $154,141.18, Max Drawdown: $18,624.36. High R^2
█ Overview
The Opening-Range Breakout strategy is a mechanical, session‑based day‑trading system designed to capture the initial burst of directional momentum immediately following the market open. It defines a user‑configurable “opening range” window, measures its high and low boundaries, then places breakout stop orders at those levels once the range closes. Built‑in filters on minimum range width, reward‑to‑risk ratios, and optional reversal logic help refine entries and manage risk dynamically.
█ How It Works
Opening‑Range Formation
Between 9:30–10:15 AM ET (configurable), the script tracks the highest high and lowest low to form the day’s opening range box.
On the first bar after the range window closes, the range high (OR_high) and low (OR_low) are “locked in.”
Range‑Width Filter
To avoid false breakouts in low‑volatility mornings, the range must be at least X% of the current price (default 0.35%).
If the measured opening-range width < minimum threshold, no orders are placed that day.
Entry & Order Placement
Long: a stop‑buy order at the opening‑range high.
Short: a stop‑sell order at the opening‑range low.
Only one side can trigger (or both if reverse logic is enabled after a losing trade).
Risk Management
Once triggered, each trade uses an ATR‑style stop-loss defined as a percentage retracement of the range (default 50% of range width).
Profit target is set at a configurable Reward/Risk Ratio (default 1.1×).
Optional: Reverse on Stop‑Loss – if the initial breakout loses, immediately reverse into the opposite side on the same day.
Session Exit
Any open positions are closed at the end of the regular trading day (default 3:45 PM ET window end, with hard flat at session close).
Visual cues are provided via green (range high) and red (range low) step‑line plots directly on the chart, allowing you to see the range box and breakout triggers in real time.
█ Why It Works
Early Momentum Capture: The first 15 – 60 minutes of trading encapsulate overnight news digestion and institutional order flow, creating a well‑defined volatility “range.”
Mechanical Discipline: Clear, rule‑based entries and exits remove emotional guesswork, ensuring consistency.
Volatility Filtering: By requiring a minimum range width, the system avoids choppy, low‑range days where false breakouts are common.
Dynamic Sizing: Stops and targets scale with the opening range, adapting automatically to each day’s volatility environment.
█ How to Use
Set Your Instruments & Timeframe
-Apply to any futures contract on a 1‑ to 5‑minute chart.
-Ensure chart timezone is set to America/New_York.
Configure Inputs
-Opening‑Range Window: e.g. “0930-1015” for a 45‑minute range.
-Min. OR Width (%): e.g. 0.35 for 0.35% of current price.
-Reward/Risk Ratio: e.g. 1.1 for a modest profit target above your stop.
-Max OR Retracement %: e.g. 50 to set stop at 50% of range width.
-One Trade Per Day: toggle to limit to a single breakout.
-Reverse on Stop Loss: toggle to flip direction after a losing breakout.
Monitor the Chart
-Watch the green and red range boundaries form during the session open.
-Orders will automatically submit on the first bar after the range window closes, conditioned on your filters.
Review & Adjust
-Backtest across multiple months to validate performance on your preferred contract.
-Tweak range duration, minimum width, and R/R multiple to fit your risk tolerance and desired win‑rate vs. expectancy balance.
█ Settings Reference
Input Defaults
Opening‑Range Window - Time window to form OR (HHMM-HHMM) - 0930–1015
Regular Trading Day - Full session for EOD flat (HHMM-HHMM) - 0930–1545
Min. OR Width (%) - Minimum OR size as % of close to trigger orders - 0.35
Reward/Risk Ratio - Profit target multiple of stop‑loss distance - 1.1
Max OR Retracement (%) - % of OR width to use as stop‑loss distance - 50
One Trade Per Day - Limit to a single breakout order per day - false
Reverse on Stop Loss - Reverse direction immediately after a losing trade - true
Disclaimer
This strategy description and any accompanying code are provided for educational purposes only and do not constitute financial advice or a solicitation to trade. Futures trading involves substantial risk, including possible loss of capital. Past performance is not indicative of future results. Traders should assess their own risk tolerance and conduct thorough backtesting and forward-testing before committing real capital.

逆勢布林+RSI策略 for SOL可以直接套用到 SOLUSDT, SOLPERP, 或其他 SOL 合約。
在策略回測介面中選擇 5min 或 15min 看策略表現。
若要調整停利%或 RSI 數值,改變 rsi < 25 與 (shortEntryPrice - close) / shortEntryPrice >= 0.035 即可。
This can be directly applied to SOLUSDT, SOLPERP, or other SOL futures.
In the strategy backtesting interface, select 5-minute or 15-minute periods to view strategy performance.
To adjust the take-profit percentage or RSI value, set RSI < 25 and (shortEntryPrice - close) / shortEntryPrice >= 0.035.

Gold 3min Trading Pro [XAU/USD]# Gold 3min Trading Pro - User Guide
## Overview
This is a professional scalping indicator specifically designed for Gold (XAU/USD) trading on 3-minute timeframes. It combines multiple technical analysis methods to provide high-probability entry signals for short-term trading.
## Key Features
### 1. Multi-Timeframe Trend Analysis
- **Major Trend**: Analyzes 15min, 1H, and 4H timeframes using moving averages
- **Short-term Trend**: Focuses on 3-minute price action and moving average alignment
- **Trend Strength**: Rated from 1-3 based on timeframe agreement
### 2. Core Indicators
- **RSI (9-period)**: Momentum oscillator for overbought/oversold conditions
- **Stochastic (9-period)**: %K and %D lines for entry timing
- **MACD**: Additional trend confirmation
- **Volume Analysis**: Detects volume spikes for signal validation
- **ATR-based Volatility Filter**: Ensures adequate market movement
### 3. Signal Types
- **Primary Signals**: Green triangles (LONG) and Red triangles (SHORT)
- **Enhanced Signals**: Stronger signals with multiple confirmations
- **Confirmation Signals**: Small circles for stochastic crossovers
## How to Use
### 1. Setup
- **Timeframe**: Use on 3-minute charts for Gold (XAU/USD)
- **Settings**: Default settings are optimized for Gold scalping
- **Session Filter**: Enable for London/New York sessions (recommended)
### 2. Entry Conditions
#### LONG Entry:
- Major trend is bullish (green background)
- Short-term trend is up or neutral
- RSI shows bullish momentum
- Stochastic indicates oversold recovery
- Volume spike confirmation
- Strong price action (bullish candle)
#### SHORT Entry:
- Major trend is bearish (red background)
- Short-term trend is down or neutral
- RSI shows bearish momentum
- Stochastic indicates overbought reversal
- Volume spike confirmation
- Strong price action (bearish candle)
### 3. Trade Management
- **Quick Target**: 50% of ATR-based calculation
- **Main Target**: Full ATR-based target
- **Stop Loss**: 60% of ATR below/above entry
- **Time Limit**: Exit if no progress within 20 bars (60 minutes)
### 4. Risk Management
- **Position Size**: Risk 1-2% of account per trade
- **Maximum Trades**: 3-5 trades per session
- **Avoid**: Low volatility periods and major news events
## Visual Elements
### Background Colors
- **Light Green**: Bullish major trend
- **Light Red**: Bearish major trend
- **Yellow**: Volume spike detected
- **Intense Colors**: Very strong trend alignment
### Chart Indicators
- **RSI Line (Blue)**: Main momentum indicator
- **Stochastic %K (Orange)**: Fast stochastic line
- **Stochastic %D (Yellow)**: Slow stochastic line
- **Horizontal Lines**: 70 (overbought), 30 (oversold), 50 (midline)
### Information Table (Top Right)
- Total signal count and performance statistics
- Current market conditions and trend strength
- RSI levels and volatility status
- Trading session information
- Last signal timing
## Alert System
### Standard Alerts
- **Scalp Long Signal**: Basic long entry signal
- **Scalp Short Signal**: Basic short entry signal
- **Premium Signals**: High-quality signals with strong confirmation
- **Trend Reversal**: Major trend change notifications
### Alert Setup
1. Right-click on chart → "Add Alert"
2. Select desired alert condition
3. Configure notification method (popup, email, webhook)
4. Set alert frequency to "Once Per Bar Close"
## Best Practices
### 1. Trading Sessions
- **Optimal**: London-NY overlap (3:00-5:00 PM EST)
- **Good**: London session (2:00-11:00 AM EST)
- **Avoid**: Asian session and major news releases
### 2. Market Conditions
- **Best**: Trending markets with normal to high volatility
- **Moderate**: Ranging markets during active sessions
- **Avoid**: Extremely low volatility or choppy conditions
### 3. Confirmation Rules
- Wait for signal triangle to appear
- Check that major trend aligns with signal direction
- Verify volume spike (yellow background)
- Ensure volatility is adequate (check info table)
### 4. Entry Timing
- Enter immediately after signal confirmation
- Use market orders for scalping speed
- Set stop loss and take profit levels immediately
## Settings Customization
### Essential Settings
- **MA Type**: EMA (recommended) or SMA
- **RSI Length**: 9 (default, can adjust 5-14)
- **Volume Threshold**: 1.8 (higher = fewer but stronger signals)
- **Volatility Filter**: Keep enabled for better signal quality
### Display Options
- **Show Scalping Signals**: Main entry signals
- **Show Performance Stats**: Information table
- **Show Trend Filter**: Background trend colors
- **Use Time Filter**: Session-based filtering
## Performance Optimization
### 1. Backtesting Tips
- Test on different market conditions
- Analyze win rate and average profit/loss
- Adjust settings based on historical performance
### 2. Signal Quality
- Higher trend strength (2-3) = better signals
- Volume confirmation improves success rate
- Enhanced signals have higher probability
### 3. Risk Control
- Never risk more than 2% per trade
- Use proper position sizing
- Stop trading after 3 consecutive losses
## Troubleshooting
### Common Issues
1. **No Signals**: Check volatility filter and session timing
2. **Too Many Signals**: Increase volume threshold or enable filters
3. **Poor Performance**: Verify timeframe (must be 3-minute) and symbol (XAU/USD)
### Support
- Ensure TradingView Pro+ subscription for multi-timeframe data
- Verify Gold symbol matches your broker's format
- Update to latest TradingView version
This indicator is designed for experienced traders familiar with scalping techniques and risk management. Always practice on demo accounts before live trading.

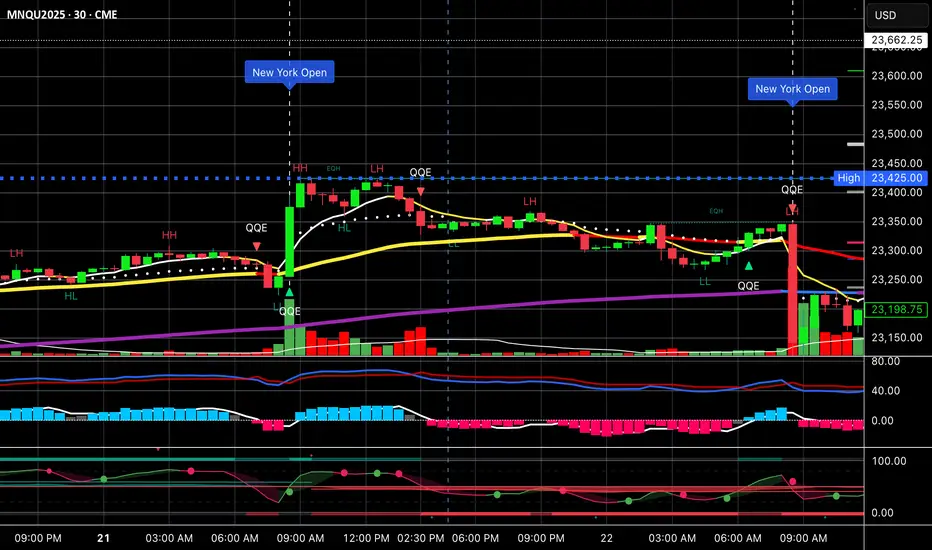
Vertical Time Marker Configurable (VTMC)# Vertical Time Marker Configurable (VTMC)
## Overview
The Vertical Time Marker Configurable (VTMC) is a powerful PineScript v6 indicator designed to help traders quickly identify key market times across their entire chart history. Instead of hovering over candles to check timestamps, VTMC draws clear vertical lines with customizable labels at your specified times, making it easy to spot important market sessions, news events, or personal trading windows at a glance.
## Key Features
### ⏰ Flexible Time Selection
- Set any time using an intuitive time picker (defaults to 8:30 AM Central Time)
- Automatically draws lines at your specified time across all historical data
- Perfect for marking market opens, closes, news releases, or personal trading times
### 🎨 Full Visual Customization
- **Line Color**: Choose any color (defaults to white for maximum visibility)
- **Line Style**: Solid, dashed, or dotted options
- **Line Width**: Adjustable from 1-10 pixels
- **Opacity Control**: Precise opacity slider (0-100%) for both line and text
### 🏷️ Smart Text Labels
- **Preset Options**: New York Open, New York Close, London Open, London Close, Asia Open, Asia Close
- **Custom Labels**: Enter any text for personalized marking (news events, trading windows, etc.)
- **Configurable Text**: Adjustable size (8-20px), color, and opacity
- **Smart Positioning**: Text appears just above the price action for clear visibility
### 📊 Professional Display
- Lines extend fully from top to bottom of chart
- Clean, non-intrusive design that doesn't clutter your analysis
- Works on any timeframe and market
- Historical lines persist across all chart data
## Perfect For
### Market Session Traders
- Mark key session opens and closes
- Identify overlap periods between major markets
- Track session-specific price behavior patterns
### News Traders
- Mark important economic releases (FOMC, NFP, etc.)
- Create visual reminders for scheduled events
- Track market reaction patterns around news times
### Institutional Flow Traders
- Identify key institutional activity times
- Mark order block formation periods
- Track smart money movement windows
### Personal Trading Systems
- Mark your optimal trading hours
- Create visual discipline for trading windows
- Track performance during specific time periods
## Why VTMC?
Unlike hardcoded session indicators that only work for specific markets, VTMC gives you complete flexibility to mark ANY time that matters to your trading strategy. Whether you're tracking "MY Trading Window" from 9:30-10:30 AM or marking custom news events, VTMC adapts to your specific needs.
The indicator eliminates the constant need to hover over candles to check times, instead providing instant visual reference points across your entire chart. This makes pattern recognition, backtesting, and trade timing significantly more efficient.
## Usage Tips
- Use multiple instances for different time zones or events
- Combine with other indicators for comprehensive market timing
- Customize colors to match your chart theme
- Use custom labels for personalized trading reminders
*Built with precision in PineScript v6 for reliable performance and modern TradingView compatibility.*
EMA Grid + Martingale Strategy (Long-Only) with CooldownTitle:
EMA Grid + Martingale Strategy (Long-Only) with Cooldown
Short Summary:
A long-only strategy combining EMA trend filters, grid-based entries, optional martingale sizing, and a cooldown feature to manage position timing and exits.
Full Description:
This strategy uses a 4-EMA trend confirmation system to detect bullish momentum, then deploys a grid-style entry method with optional martingale position sizing. It includes a cooldown mechanism to prevent reentry too soon after a completed trade cycle.
How It Works
1. Trend Confirmation: Two EMA groups (fast/slow) determine whether market conditions are bullish.
2. Initial Entry: A new position is entered when both EMA groups confirm an uptrend and no position is currently active.
3. Grid Entries: Additional long entries are placed when price drops by a defined pip distance from the last entry, respecting the maximum number of entries.
4. Martingale Sizing (Optional): Grid orders can increase in size with each level using a customizable multiplier.
5. Weighted-Average Exit: All positions close once price reaches or exceeds the average entry price plus a buffer.
6. Cooldown Timer: After closing a position set, the strategy waits a defined number of bars before opening a new grid.
Key Features
• 4 customizable EMAs for trend confirmation.
• Dynamic grid-style long entries based on pip intervals.
• Optional martingale-style position sizing.
• Weighted-average price exit logic with buffer control.
• Cooldown bar period to limit overtrading.
• Suitable for optimization and backtesting with full control over inputs.
Use Cases
• Designed for trending markets where pullbacks present entry opportunities.
• Helps manage staged entries while avoiding premature reentry.
• Ideal for testing martingale and grid-based strategies with exit precision.
Note: This strategy is for testing and educational purposes only. It does not guarantee profits and is not financial advice.

Setup: Smooth Gaussian + Adaptive Supertrend (Manual Vol)Overview
This strategy combines two powerful trend-based tools originally developed by Algo Alpha: the Smooth Gaussian Trend (simulated) and the Adaptive Supertrend. The objective is to capture sustained bullish movements in periods of controlled volatility by filtering for high-probability entries.
Entry Logic
Long Entry Conditions:
The closing price is above the Smooth Gaussian Trend line (with length = 75), and
The volatility setting from the Adaptive Supertrend is manually defined as either 2 or 3
Exit Condition:
The closing price falls below the Smooth Gaussian Trend line
This script uses a simulated version of the Gaussian Trend line via double-smoothed SMA, as the original Algo Alpha indicator is protected and cannot be accessed directly in code.
Features
Plots entry and exit signals directly on the chart
Manual toggle to enable or disable the volatility filter
Lightweight design to allow flexible backtesting even without access to proprietary indicators
Important Note
This strategy does not connect to the actual Adaptive Supertrend from Algo Alpha. Users must manually input the volatility level based on what they observe on the chart when the original indicator is also applied. The Smooth Gaussian Trend is approximated and may differ slightly from the original.
Suggested Use
Recommended timeframes: 1H, 4H, or Daily
Best used alongside the original indicators displayed on the chart
Consider incorporating additional structure, momentum, or volume filters to enhance performance
If you have suggestions or would like to contribute improvements, feel free to reach out or fork the script.

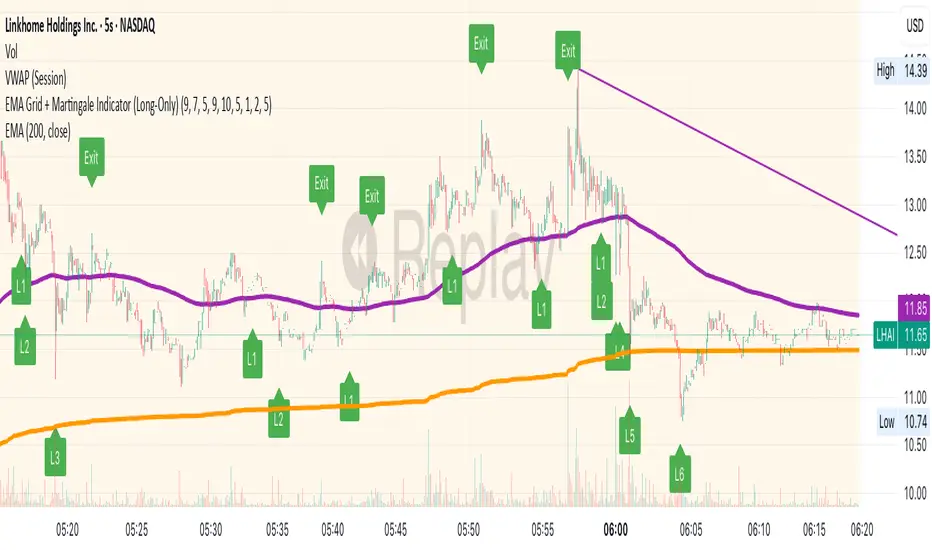
EMA Grid + Martingale Indicator (Long-Only)Title:
EMA Grid + Martingale Indicator (Long-Only)
Short Summary:
A 4-EMA trend filter combined with a grid-based entry system and optional martingale sizing to visualize staged long entries and exits in bullish markets.
Full Description:
This indicator combines a 4-EMA trend filter with a grid-based entry system and optional martingale-style position sizing to help traders visualize staged long entries and exits in trending markets.
How It Works
1. Trend Detection: Uses two sets of EMAs (fast/slow pairs) to confirm bullish momentum. A long signal is generated when both EMA groups align in an uptrend.
2. Grid Entries: After the initial long entry, additional grid levels are triggered every time price drops by the specified grid step (in pips).
3. Martingale Sizing (Optional): Each subsequent entry can increase in size based on the defined martingale factor.
4. Weighted-Average Exit: Calculates the weighted average of all grid entries and signals an exit when the price reaches or surpasses this level plus an optional buffer.
Key Features
• 4 EMA Trend Filter with fully customizable lengths.
• Dynamic grid entries with visual labels (L1, L2, etc.).
• Optional martingale position sizing.
• Weighted-average exit with adjustable buffer.
• Customizable parameters for EMAs, grid steps, max entries, and buffer pips.
• Clear chart visualization of EMAs and entry/exit levels.
Use Cases
• For traders using cost-averaging or grid strategies in bullish markets.
• Visualizes multiple entry levels and profit targets.
• Useful for backtesting and strategy planning.
Note: This indicator is for visualization and planning purposes only. It does not execute trades automatically. It does not guarantee profits and is not financial advice.
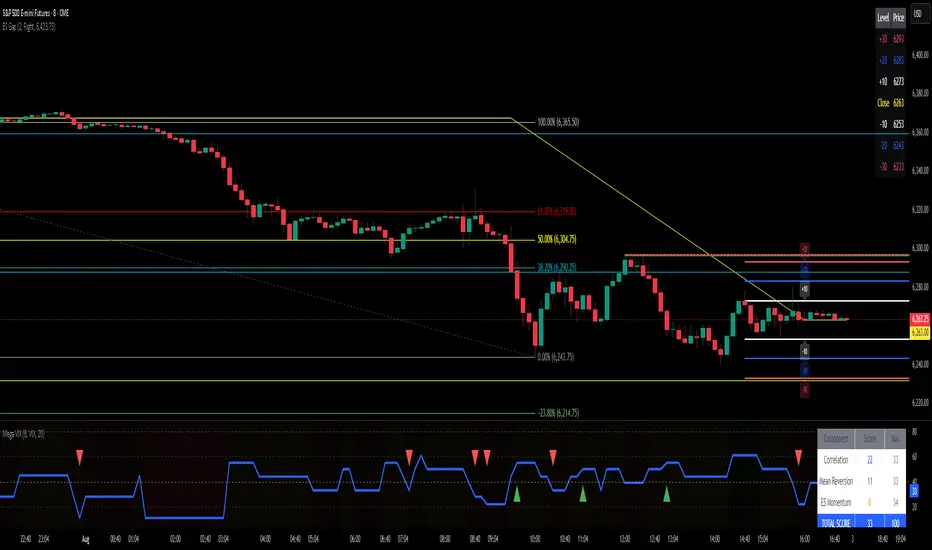
ES Gap Trading Levels# ES Gap Trading Levels
## Overview
A professional gap trading indicator designed specifically for ES Futures traders. This indicator automatically captures the closing price at 3:59 PM ET (NYSE close) and immediately displays key gap levels for the evening trading session starting at 6:00 PM ET.
## Key Features
### ✅ **Automatic Gap Level Detection**
- Captures ES Futures closing price at 3:59-4:00 PM ET
- Instantly displays gap levels for immediate session planning
- Resets daily for fresh gap analysis
### ✅ **Six Critical Gap Levels**
- **±10 Points** (White lines) - Short-term gap targets
- **±20 Points** (Light Blue lines) - Medium gap targets
- **±30 Points** (Red lines) - Extended gap targets
### ✅ **Professional Display**
- Clean horizontal lines with customizable colors
- Clear labels showing point values (+30, +20, +10, -10, -20, -30)
- Gap levels table showing exact price targets
- Optional closing price reference line
### ✅ **Customizable Settings**
- Adjustable line colors, width, and extension
- Toggle labels and reference table on/off
- Manual closing price override for testing
- Debug mode for troubleshooting
### ✅ **Smart Management**
- Automatic cleanup of previous day's levels
- Lines appear immediately after market close
- Optimized for ES1!, MES1!, and other ES futures contracts
## How It Works
1. **Market Close Capture**: At 3:59 PM ET, the indicator captures the ES closing price
2. **Instant Display**: Gap levels immediately appear on your chart
3. **Evening Session Ready**: Lines are positioned for 6:00 PM ET session start
4. **Daily Reset**: Old levels are automatically cleared each new trading day
## Perfect For:
- Gap trading strategies
- Overnight futures trading
- ES futures scalping
- Session transition analysis
- Risk management levels
## Usage Tips:
- Best used on 1-15 minute ES futures charts
- Ensure chart timezone shows ET times
- Use manual mode for backtesting specific dates
- Combine with volume and momentum indicators
## Settings Guide:
- **Display Settings**: Control lines, labels, and table visibility
- **Colors**: Customize each gap level color scheme
- **Manual Settings**: Override closing price for testing
- **Debug**: View time detection and diagnostic information
*Designed by traders, for traders. Clean, professional, and reliable gap level detection for serious ES futures trading.*
EMA 8/21/50 + VWAP Crossover Alert IndicatorOverview of the Indicator
This is a custom Pine Script v5 indicator for TradingView titled "EMA 8/21/50 + VWAP Crossover Alert Indicator" (short title: "EMA+VWAP Cross Alert"). It's designed as an overlay indicator, meaning it plots directly on your price chart rather than in a separate pane. The primary purpose is to detect and alert on crossovers between the 8-period Exponential Moving Average (EMA) and the 21-period EMA, which can signal potential bullish or bearish momentum shifts. These are classic short-term trend reversal or continuation signals often used in trading strategies like momentum or swing trading.
To enhance analysis, it also includes:
A 50-period EMA for medium-term trend context (e.g., to confirm if the overall trend aligns with the crossover).
A Volume Weighted Average Price (VWAP) line, which provides a benchmark for the average price weighted by volume, useful for identifying intraday value areas or fair price levels.
The indicator works across all timeframes (e.g., Daily, 4H, 1H, 15M, 5M, 3M) because the calculations are based on the chart's current bars and adapt to volatility and data resolution. It's not a trading strategy (no entry/exit logic or backtesting), but an alert tool—signals are visual and can trigger notifications in TradingView. Always combine it with risk management, as crossovers can produce false signals in ranging or choppy markets.

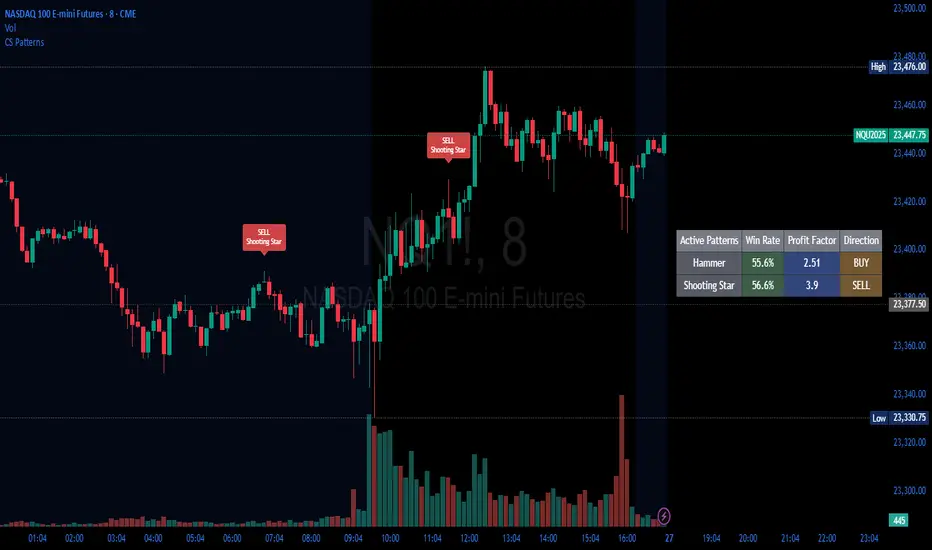
Candlestick Patterns Backtester [Optimized]Candlestick Patterns Backtester
What this is: This indicator is based on a really cool candlestick pattern backtester that I found (I'll update this later when I remember where I got it from or find the actual author). The original had this massive table showing win/loss ratios for a bunch of candlestick patterns, and according to the built-in backtester, it was actually profitable - which was pretty impressive.
The Problem: I played around with the original for a while but honestly wasn't really able to get it to work well at all for actual trading. It was still pretty cool to look at though! The main issues were:
It was just a big static table - hard to do anything useful with it
Couldn't send signals out to other strategies
The code was a monster - like 2,000+ lines of repetitive mess
What I Did: I completely refactored this thing and got it down from 2,000+ lines to just a few hundred lines. Much cleaner now! Here's what it does:
45+ Candlestick Patterns - All the classics are in there
Dynamic Filtering - Set your own requirements (minimum win rate, profit factor, total trades, etc.)
Flexible Logic - Choose AND/OR logic for your filters
Signal Generation - Creates actual buy/sell signals you can use with other strategies
Visual Badges - Shows pattern badges on chart when they meet your criteria
Active Patterns Table - Only shows patterns that are currently profitable based on your settings
Settings You Can Adjust:
Minimum win rate threshold
Minimum profit factor
Minimum number of trades required
Whether to use AND or OR logic for filtering
Colors, badge display, debug options
Reality Check: Trading these patterns really wasn't for me, but it was still a great learning experience. The backtesting results look good on paper, but as always, past performance doesn't guarantee future results. Use this as a research tool and educational resource more than anything else.
Credit: This is based on someone else's original work that I heavily modified and optimized. I'll update this description once I track down the original author to give proper credit where it's due.
This introduction captures your casual, honest tone while explaining the technical improvements you made and setting realistic expectations about the indicator's practical use.
Synthetic VX3! & VX4! continuous /VX futuresTradingView is missing continuous 3rd and 4th month VIX (/VX) futures, so I decided to try to make a synthetic one that emulates what continuous maturity futures would look like. This is useful for backtesting/historical purposes as it enables traders to see how their further out VX contracts would've performed vs the front month contract.
The indicator pulls actual realtime data (if you subscribe to the CBOE data package) or 15 minute delayed data for the VIX spot (the actual non-tradeable VIX index), the continuous front month (VX1!), and the continuous second month (VX2!) continually rolled contracts. Then the indicator's script applies a formula to fairly closely estimate how 3rd and 4th month continuous contracts would've moved.
It uses an exponential mean‑reversion to a long‑run level formula using:
σ(T) = θ+(σ0−θ)e−kT
You can expect it to be off by ~5% or so (in times of backwardation it might be less accurate).

SPY, QQQ, VIX - Multi TF Trend Table***CURRENTLY IN BACKTESTING PHASE***
This TradingView script creates a real-time multi-timeframe trend status table for SPY, QQQ, and VIX using the Ripster-style EMA cloud logic.
🔍 What It Shows:
Current Price (1 Min): Live snapshot of each symbol.
10min Trend (5/12 EMA): Short-term momentum.
10min Trend (34/50 EMA): Intermediate-term direction.
1 Hour Trend: Higher timeframe trend.
Daily Trend: Long-term trend using 5/12 and 34/55 EMA alignment.
Each cell is color-coded:
✅ Green = Bullish
❌ Red = Bearish
Yellow can be used for neutral if customized.
⚙️ How It Works:
Uses request.security() to pull multi-timeframe EMA values for each symbol.
Compares fast/slow EMAs to determine bullish or bearish alignment.
The table is refreshed live and placed in a corner of your choice.
✅ Ideal For:
Trend traders using Ripster EMA clouds
SPY/QQQ/VIX correlation watchers
Traders seeking real-time trend clarity across multiple timeframes

% / ATR Buy, Target, Stop + Overlay & P/L% / ATR Buy, Target, Stop + Overlay & P/L
This tool combines volatility‑based and fixed‑percentage trade planning into a single, on‑chart overlay—with built‑in profit‑and‑loss estimates. Toggle between ATR or percentage modes, plot your Buy, Target and Stop levels, and see the dollar gain or loss for a specified position size—all in one interactive table and chart display.
NOTE: To activate plotted lines, price labels, P/L rows and table values, enter a Buy Price greater than zero.
What It Does
Mode Toggle: Choose between “ATR” (volatility‑based) or “%” (fixed‑percentage) calculations.
Buy Price Input: Manually enter your entry price.
ATR Mode:
Target = Buy + (ATR × Target Multiplier)
Stop = Buy − (ATR × Stop Multiplier)
Percentage Mode:
Target = Buy × (1 + Target % / 100)
Stop = Buy × (1 – Stop % / 100)
P/L Estimates: Specify a dollar amount to “invest” at your Buy price, and the script calculates:
Gain ($): Profit if Target is hit
Loss ($): Cost if Stop is hit
Visual Overlay: Draws horizontal lines for Buy, Target and Stop, with optional price labels on the chart scale.
Interactive Table: Displays Buy, Target, Stop, ATR/timeframe info (in ATR mode), percentages (in % mode), and P/L rows.
Customization Options
Line Settings:
Choose color, style (solid/dashed/dotted), and width for Buy, Target, Stop lines.
Extend lines rightward only or in both directions.
Table Settings:
Position the table (top/bottom × left/right).
Toggle individual rows: Buy Price; Target (multiplier or %); Stop (multiplier or %); Target ATR %; Stop ATR %; ATR Time Frame; ATR Value; Gain ($); Loss ($).
Customize text colors for each row and background transparency.
General Inputs:
ATR length and optional ATR timeframe override (e.g. use daily ATR on an intraday chart).
Target/Stop multipliers or percentages.
Dollar Amount for P/L calculations.
How to Use It for Trading
Plan Your Entry: Enter your intended Buy Price and position size (dollar amount).
Select Mode: Toggle between ATR or % mode depending on whether you prefer volatility‑based or fixed offsets.
Assess R:R and P/L: Instantly see your Target, Stop levels, and potential profit or loss in dollars.
Visual Reference: Lines and price labels update in real time as you tweak inputs—ideal for live trading, backtesting or trade journaling.
Ideal For
Traders who want both volatility‑based and percentage‑based exit options in one tool
Those who need on‑chart P/L estimates based on position size
Swing and intraday traders focused on objective, rule‑based trade management
Anyone who uses ATR for adaptive stops/targets or fixed percentages for simpler exits
HMA Trend Line (Croc Signal Line)HMA Trend Line (Croc Signal Line) — The Ultimate Hull Moving Average Trend Indicator
Full English description here:
What is the HMA Trend Line (Croc Signal Line)?
The HMA Trend Line (Croc Signal Line) is a powerful, adaptive trend indicator for TradingView, based on the Hull Moving Average (HMA). This indicator is designed to help traders identify real market trends with less lag and reduced noise compared to traditional moving averages like SMA (Simple Moving Average) and EMA (Exponential Moving Average).
Why use the HMA Trend Line?
+ Faster Trend Detection: The Hull Moving Average (HMA) responds more quickly to price action, giving you earlier buy and sell signals.
+ Smoother and Cleaner: It provides a visually clean trend line that avoids the choppiness of classic EMAs and SMAs.
+ Reduced Lag: The HMA Trend Line follows the market closer, helping you avoid late entries or exits and spot trend reversals sooner.
+ Dynamic Support and Resistance: Use the line as a dynamic support or resistance to manage trades and identify pullbacks or breakouts.
What does “Croc Signal Line” mean?
The “Croc” in Croc Signal Line stands for:
+ Clean
+ Responsive
+ Optimized
+ Curve
This highlights the unique advantage of this indicator: a curve that is both fast-reacting and smooth, helping traders focus on real trends and filter out market noise.
How does the Hull Moving Average (HMA) work?
The HMA was developed by Alan Hull and uses weighted moving averages and a unique calculation to deliver both responsiveness and smoothness. Unlike standard moving averages, the HMA reacts faster to new price moves and avoids false signals in ranging or volatile markets.
How to use the HMA Trend Line (Croc Signal Line) on TradingView?
+ Watch for price crossing above the trend line for potential bullish signals, and below for bearish signals.
+ Use on any timeframe: from 1-minute scalping to daily, weekly, or even monthly charts.
+ Works with all asset classes: Forex, stocks, indices, cryptocurrencies, commodities, and futures.
+ Combine with other indicators (like Stochastics, RSI, or volume) for confirmation and to build your unique trading strategy.
+ Adjust the Signal Line Period for your market and style: shorter periods for faster markets, longer for smoother trends.
Who should use this indicator?
+ Day traders, swing traders, and long-term investors looking for reliable, actionable trend signals.
+ Anyone seeking a cleaner, more responsive alternative to the classic moving averages.
+ Traders who want a simple, visually clear way to filter out market noise and see real price direction.
Disclaimer:
This indicator is for educational and study purposes only. Please perform your own backtesting and analysis before using it in live trading. This script does not constitute financial advice. Use at your own risk.
--------

Midnight 30min High/LowMidnight 30min High/Low — Overnight Liquidity Range Tracker
Capture the Overnight Session: A Strategic Level Identification Tool from Professional Trading Methodology
This indicator captures the high and low prices during the critical 30-minute midnight session (12:00-12:30 AM EST) and projects these levels forward as key support and resistance zones. These overnight ranges often contain significant liquidity and serve as crucial reference points for intraday price action, representing areas where institutional activity may have established important levels.
🔍 What This Script Does:
Identifies Critical Overnight Session Levels
- Automatically detects the 12:00-12:30 AM EST session window
- Captures the highest and lowest prices during this 30-minute period
- Projects these levels forward for multiple trading days
Creates Dynamic Support/Resistance Zones
- Extends midnight high/low levels as horizontal lines with customizable projection periods
- Fills the area between high and low to create a visual trading range
- Updates automatically each trading day with new overnight levels
Provides Clear Visual Reference Points
- Optional session start markers (●) highlight when the midnight session begins
- Color-coded lines distinguish between high and low levels
- Transparent fill area creates an easy-to-identify trading zone
Real-Time Level Tracking
- Updates levels in real-time during the active midnight session
- Maintains historical levels for reference and backtesting
- Compatible with data window for precise level values
⚙️ Customization Options:
Extend Days (1-30):** Control how many days forward the levels are projected (default: 5 days)
High Line Color:** Customize the midnight high line color (default: blue)
Low Line Color:** Customize the midnight low line color (default: orange)
Fill Color:** Adjust the transparency and color of the range area (default: light aqua, 80% transparency)
Show Session Markers:** Toggle yellow session start indicators on/off (default: enabled)
💡 How to Use:
Deploy on lower timeframes (1m-15m) for precise level identification and reaction monitoring**
Watch for key price interactions:
- Rejection at midnight high levels (potential resistance)
- Bounce from midnight low levels (potential support)
- Range-bound trading between the high and low levels
Combine with liquidity concepts:
- Monitor for stop hunts above/below these levels
- Look for false breakouts that snap back into the range
- Use as confluence with other ICT concepts like FVGs and Order Blocks
Strategic Applications:
- Range trading between midnight levels
- Breakout confirmation when price closes decisively outside the range
- Support/resistance validation for entry and exit planning
🔗 Combine With These Tools for Complete Market Structure Analysis:
✅ First FVG — Opening Range Fair Value Gap Detector.
✅ ICT Turtle Soup (Liquidity Reversal)— Spot stop hunts and false breakout scenarios
✅ ICT Macro Zones (Grey Box Version)- It tracks real-time highs and lows for each Silver Bullet session
✅ ICT SMC Liquidity Grabs and OBs- Liquidity Grabs, Order Block Zones, and Fibonacci OTE Levels, allowing traders to identify institutional entry models with clean, rule-based visual signals.
Together, these tools create a comprehensive Smart Money Concepts (SMC) framework — helping traders identify, anticipate, and capitalize on institutional-level price movements with precision and confidence during critical overnight sessions.

TREV Candles - Range-Based Trend ReversalTREV Candles - Range-Based Trend Reversal Chart Implementation
What is a Trend Reversal (TREV) Chart?
A Trend Reversal chart, also known as a Point & Figure chart variation, is a unique charting method that focuses on price movement thresholds rather than time intervals. Unlike traditional candlestick charts where each candle represents a fixed time period, TREV candles form only when price moves by predefined amounts in ticks.
TREV charts eliminate time-based noise and focus purely on significant price movements, making them ideal for identifying genuine trend changes and continuation patterns.
How TREV Candles Work
This indicator implements true TREV logic with two critical thresholds:
Trend Size: The number of ticks price must move in the current direction to form a trend continuation candle
Reversal Size: The number of ticks price must move against the current direction to form a reversal candle and change the overall trend direction
Key TREV Rules Enforced:
Direction Changes Only Through Reversals: You cannot go from bullish trend directly to bearish trend - a reversal candle must occur first
Threshold-Based Formation: Candles form only when price thresholds are breached, not on time
Logical Wick Placement: Wicks only appear on the "open" side of candles where price temporarily moved against the formation direction
Multiple Candles Per Bar: When price moves significantly, several TREV candles can form within a single time-based bar
Four Distinct Candle Types
Bullish Trend (Green): Continues upward movement when trend threshold is hit
Bearish Trend (Red): Continues downward movement when trend threshold is hit
Bullish Reversal (Blue): Changes from bearish to bullish direction when reversal threshold is breached
Bearish Reversal (Orange): Changes from bullish to bearish direction when reversal threshold is breached
Practical Trading Applications
Trend Identification: Clear visual representation of when trends are continuing vs. reversing
Noise Reduction: Filters out insignificant price movements that don't meet threshold requirements
Support/Resistance: TREV levels often act as significant support and resistance zones
Breakout Confirmation: When price forms multiple trend candles in succession, it confirms strong directional movement
Reversal Signals: Reversal candles provide early warning of potential trend changes
Technical Implementation Features
Intelligent Price Path Processing: Analyzes the assumed price path within each bar (Low→High→Close for bullish bars, High→Low→Close for bearish bars)
Automatic Tick Size Detection: Works with any instrument by automatically detecting the correct tick size
Manual Override Option: Allows manual tick size specification for custom analysis
Impossible Scenario Prevention: Built-in logic prevents impossible wick configurations and direction changes
PineScript Optimization: Efficient state management and drawing limits handling for smooth performance
Comprehensive Styling Options
Each of the four candle types offers complete visual customization:
Body Colors: Independent color settings for each candle type's body
Border Colors: Separate border color customization
Border Styles: Choose from solid, dashed, or dotted borders
Wick Colors: Individual wick color settings for each candle type
Default Color Scheme:
🟢 Bullish Trend: Green body and wicks
🔵 Bullish Reversal: Blue body and wicks
🔴 Bearish Trend: Red body and wicks
🟠 Bearish Reversal: Orange body and wicks
Configuration Guidelines
Trend Size: Larger values create fewer, more significant trend candles. Smaller values increase sensitivity
Reversal Size: Should typically be smaller than trend size. Controls how easily the trend direction can change
Tick Size: Use "auto" for most instruments. Manual override useful for custom point values or backtesting
Ideal Use Cases
Swing Trading: Identify major trend changes and continuation patterns
Scalping: Use smaller thresholds to catch quick reversals and momentum shifts
Position Trading: Use larger thresholds to filter noise and focus on major trend moves
Multi-Timeframe Analysis: Compare TREV patterns across different threshold settings
Support/Resistance Trading: TREV close levels often become significant price zones
Why This Implementation is Superior
True TREV Logic: Enforces proper trend reversal rules that many implementations ignore
No Impossible Scenarios: Prevents wicks on both sides of candles and impossible direction changes
Professional Visualization: Clean, customizable appearance suitable for serious analysis
Performance Optimized: Handles large datasets without lag or drawing limit issues
Educational Value: Helps traders understand the difference between time-based and threshold-based charting
Perfect for traders who want to see beyond time-based noise and focus on what price is actually doing - moving in significant, measurable amounts that matter for trading decisions.

Trimmed ATR🧠 **Brief Description**:
Trimmed ATR is a modified volatility indicator that removes extreme values from the ATR calculation. This makes it more reliable for analyzing market conditions and filters out "noise" spikes. It is particularly useful for setting stop-losses and in strategies sensitive to false volatility.
🧾 **How Does Trimmed ATR Work?**
📌 For each bar:
- True Range (TR) is calculated.
- A sliding window of the last N TR values (where N = length) is stored.
- The TR list is sorted, and trimPercent % is cut off from each side:
- The smallest and largest values are removed.
- The remaining values are averaged → Trimmed ATR.
🔍 **Why Is This Important?**
Regular ATR can be distorted by outliers:
- A single spike can sharply inflate the ATR.
- This creates a false impression of market volatility.
🎯 Trimmed ATR solves this by eliminating the impact of anomalies, providing a more stable and accurate volatility measure.
📈 **What Does It Mean If Trimmed ATR Is Higher or Lower Than Regular ATR?**
🔵 **Trimmed ATR is lower than ATR** — this is normal:
- There are isolated TR spikes (high volatility on 1–2 bars).
- ATR increases, including these outliers.
- Trimmed ATR discards them → reflects the true average market background.
🧠 This is the most common case, indicating: a spike occurred, but the market is generally calm.
🟠 **Trimmed ATR is higher than ATR** — a rare but important signal:
- There were artificially low TR values (very small movements).
- ATR becomes too low.
- Trimmed ATR discards these "quiet" periods → provides a more realistic volatility estimate.
⚠️ This may indicate:
- Hidden pressure.
- Preparation for a breakout from a tight range.
- Underestimated volatility.
💡 **Applications**:
- **Trailing Stop**: Trimmed ATR helps avoid stop triggers due to noise.
- **Trend Filter**: Better reflects the "true" market dynamics.
- **Strategy Backtesting**: Eliminates distortions in volatility calculations.
LANZ Strategy 5.0 [Backtest]🔷 LANZ Strategy 5.0 — Rule-Based BUY Logic with Time Filter, Session Limits and Auto SL/TP Execution
This is the backtest version of LANZ Strategy 5.0, built as a strategy script to evaluate real performance under fixed intraday conditions. It automatically places BUY and SELL trades based on structured candle confirmation, EMA trend alignment, and session-based filters. The system simulates real-time execution with precise Stop Loss and Take Profit levels.
📌 Built for traders seeking to simulate clean intraday logic with fully automated entries and performance metrics.
🧠 Core Logic & Strategy Conditions
✅ BUY Signal Conditions:
Price is above the EMA200
The last 3 candles are bullish (close > open)
The signal occurs within the defined session window (NY time)
Daily trade limit has not been exceeded
If all are true, a BUY order is executed at market, with SL and TP set immediately.
🔻 SELL Signal Conditions (Optional):
Exactly inverse to BUY (below EMA + 3 bearish candles). Disabled by default.
🕐 Operational Time Filter (New York Time)
You can fully customize your intraday window:
Start Time: e.g., 01:15 NY
End Time: e.g., 16:00 NY
The system evaluates signals only within this range, even across midnight if configured.
🔁 Trade Management System
One trade at a time per signal
Trades include a Stop Loss (SL) and Take Profit (TP) based on pip distance
Trade result is calculated automatically
Each signal is shown with a triangle marker (BUY only, by default)
🧪 Backtest Accuracy
This version uses:
strategy.order() for entries
strategy.exit() for SL and TP
strategy.close_all() at the configured manual closing time
This ensures realistic behavior in the TradingView strategy tester.
⚙️ Flow Summary (Step-by-Step)
On every bar, check:
Is the time within the operational session?
Is the price above the EMA?
Are the last 3 candles bullish?
If conditions met → A BUY trade is opened:
SL = entry – X pips
TP = entry + Y pips
Trade closes:
If SL or TP is hit
Or at the configured manual close time (e.g., 16:00 NY)
📊 Settings Overview
Timeframe: 1-hour (ideal)
SL/TP: Configurable in pips
Max trades/day: User-defined (default = 99 = unlimited)
Manual close: Adjustable by time
Entry type: Market (not limit)
Visuals: Plotshape triangle for BUY entry
👨💻 Credits:
💡 Developed by: LANZ
🧠 Strategy logic & execution: LANZ
✅ Designed for: Clean backtesting, clarity in execution, and intraday logic simulation

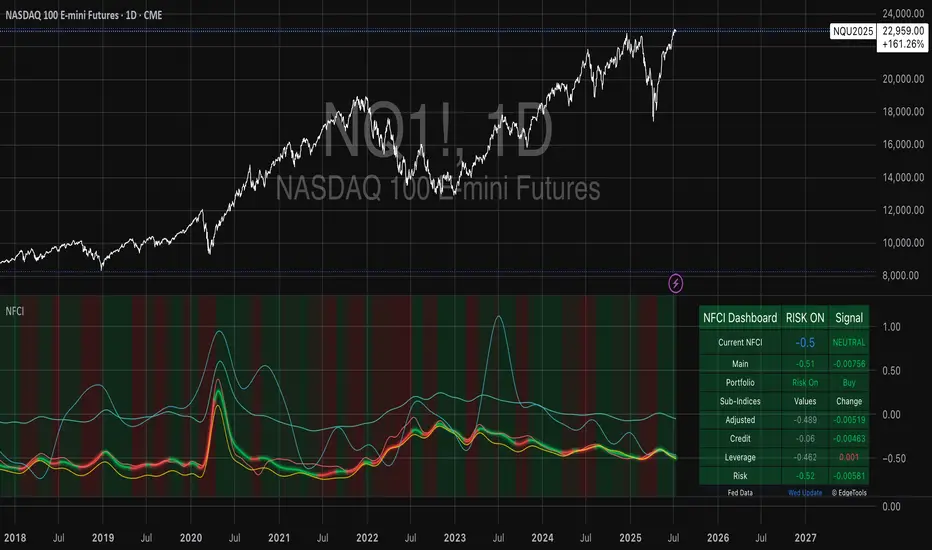
National Financial Conditions Index (NFCI)This is one of the most important macro indicators in my trading arsenal due to its reliability across different market regimes. I'm excited to share this with the TradingView community because this Federal Reserve data is not only completely free but extraordinarily useful for portfolio management and risk assessment.
**Important Disclaimers**: Be aware that some NFCI components are updated only monthly but carry significant weighting in the composite index. Additionally, the Fed occasionally revises historical NFCI data, so historical backtests should be interpreted with some caution. Nevertheless, this remains a crucial leading indicator for financial stress conditions.
---
## What is the National Financial Conditions Index?
The National Financial Conditions Index (NFCI) is a comprehensive measure of financial stress and liquidity conditions developed by the Federal Reserve Bank of Chicago. This indicator synthesizes over 100 financial market variables into a single, interpretable metric that captures the overall state of financial conditions in the United States (Brave & Butters, 2011).
**Key Principle**: When the NFCI is positive, financial conditions are tighter than average; when negative, conditions are looser than average. Values above +1.0 historically coincide with financial crises, while values below -1.0 often signal bubble-like conditions.
## Scientific Foundation & Research
The NFCI methodology is grounded in extensive academic research:
### Core Research Foundation
- **Brave, S., & Butters, R. A. (2011)**. "Monitoring financial stability: A financial conditions index approach." *Economic Perspectives*, 35(1), 22-43.
- **Hatzius, J., Hooper, P., Mishkin, F. S., Schoenholtz, K. L., & Watson, M. W. (2010)**. "Financial conditions indexes: A fresh look after the financial crisis." *US Monetary Policy Forum Report*, No. 23.
- **Kliesen, K. L., Owyang, M. T., & Vermann, E. K. (2012)**. "Disentangling diverse measures: A survey of financial stress indexes." *Federal Reserve Bank of St. Louis Review*, 94(5), 369-397.
### Methodological Validation
The NFCI employs Principal Component Analysis (PCA) to extract common factors from financial market data, following the methodology established by **English, W. B., Tsatsaronis, K., & Zoli, E. (2005)** in "Assessing the predictive power of measures of financial conditions for macroeconomic variables." The index has been validated through extensive academic research (Koop & Korobilis, 2014).
## NFCI Components Explained
This indicator provides access to all five official NFCI variants:
### 1. **Main NFCI**
The primary composite index incorporating all financial market sectors. This serves as the main signal for portfolio allocation decisions.
### 2. **Adjusted NFCI (ANFCI)**
Removes the influence of credit market disruptions to focus on non-credit financial stress. Particularly useful during banking crises when credit markets may be impaired but other financial conditions remain stable.
### 3. **Credit Sub-Index**
Isolates credit market conditions including corporate bond spreads, commercial paper rates, and bank lending standards. Important for assessing corporate financing stress.
### 4. **Leverage Sub-Index**
Measures systemic leverage through margin requirements, dealer financing, and institutional leverage metrics. Useful for identifying leverage-driven market stress.
### 5. **Risk Sub-Index**
Captures market-based risk measures including volatility, correlation, and tail risk indicators. Provides indication of risk appetite shifts.
## Practical Trading Applications
### Portfolio Allocation Framework
Based on the academic research, the NFCI can be used for portfolio positioning:
**Risk-On Positioning (NFCI declining):**
- Consider increasing equity exposure
- Reduce defensive positions
- Evaluate growth-oriented sectors
**Risk-Off Positioning (NFCI rising):**
- Consider reducing equity exposure
- Increase defensive positioning
- Favor large-cap, dividend-paying stocks
### Academic Validation
According to **Oet, M. V., Eiben, R., Bianco, T., Gramlich, D., & Ong, S. J. (2011)** in "The financial stress index: Identification of systemic risk conditions," financial conditions indices like the NFCI provide early warning capabilities for systemic risk conditions.
**Illing, M., & Liu, Y. (2006)** demonstrated in "Measuring financial stress in a developed country: An application to Canada" that composite financial stress measures can be useful for predicting economic downturns.
## Advanced Features of This Implementation
### Dynamic Background Coloring
- **Green backgrounds**: Risk-On conditions - potentially favorable for equity investment
- **Red backgrounds**: Risk-Off conditions - time for defensive positioning
- **Intensity varies**: Based on deviation from trend for nuanced risk assessment
### Professional Dashboard
Real-time analytics table showing:
- Current NFCI level and interpretation (TIGHT/LOOSE/NEUTRAL)
- Individual sub-index readings
- Change analysis
- Portfolio guidance (Risk On/Risk Off)
### Alert System
Professional-grade alerts for:
- Risk regime changes
- Extreme stress conditions (NFCI > 1.0)
- Bubble risk warnings (NFCI < -1.0)
- Major trend reversals
## Optimal Usage Guidelines
### Best Timeframes
- **Daily charts**: Recommended for intermediate-term positioning
- **Weekly charts**: Suitable for longer-term portfolio allocation
- **Intraday**: Less effective due to weekly update frequency
### Complementary Indicators
For enhanced analysis, combine NFCI signals with:
- **VIX levels**: Confirm stress readings
- **Credit spreads**: Validate credit sub-index signals
- **Moving averages**: Determine overall market trend context
- **Economic surprise indices**: Gauge fundamental backdrop
### Position Sizing Considerations
- **Extreme readings** (|NFCI| > 1.0): Consider higher conviction positioning
- **Moderate readings** (|NFCI| 0.3-1.0): Standard position sizing
- **Neutral readings** (|NFCI| < 0.3): Consider reduced conviction
## Important Limitations & Considerations
### Data Frequency Issues
**Critical Warning**: While the main NFCI updates weekly (typically Wednesdays), some underlying components update monthly. Corporate bond indices and commercial paper rates, which carry significant weight, may cause delayed reactions to current market conditions.
**Component Update Schedule:**
- **Weekly Updates**: Main NFCI composite, most equity volatility measures
- **Monthly Updates**: Corporate bond spreads, commercial paper rates
- **Quarterly Updates**: Banking sector surveys
- **Impact**: Significant portion of index weight may lag current conditions
### Historical Revisions
The Federal Reserve occasionally revises NFCI historical data as new information becomes available or methodologies are refined. This means backtesting results should be interpreted cautiously, and the indicator works best for forward-looking analysis rather than precise historical replication.
### Market Regime Dependency
The NFCI effectiveness may vary across different market regimes. During extended sideways markets or regime transitions, signals may be less reliable. Consider combining with trend-following indicators for optimal results.
**Bottom Line**: Use NFCI for medium-term portfolio positioning guidance. Trust the directional signals while remaining aware of data revision risks and update frequency limitations. This indicator is particularly valuable during periods of financial stress when reliable guidance is most needed.
---
**Data Source**: Federal Reserve Bank of Chicago
**Update Frequency**: Weekly (typically Wednesdays)
**Historical Coverage**: 1973-present
**Cost**: Free (public Fed data)
*This indicator is for educational and analytical purposes. Always conduct your own research and risk assessment before making investment decisions.*
## References
Brave, S., & Butters, R. A. (2011). Monitoring financial stability: A financial conditions index approach. *Economic Perspectives*, 35(1), 22-43.
English, W. B., Tsatsaronis, K., & Zoli, E. (2005). Assessing the predictive power of measures of financial conditions for macroeconomic variables. *BIS Papers*, 22, 228-252.
Hatzius, J., Hooper, P., Mishkin, F. S., Schoenholtz, K. L., & Watson, M. W. (2010). Financial conditions indexes: A fresh look after the financial crisis. *US Monetary Policy Forum Report*, No. 23.
Illing, M., & Liu, Y. (2006). Measuring financial stress in a developed country: An application to Canada. *Bank of Canada Working Paper*, 2006-02.
Kliesen, K. L., Owyang, M. T., & Vermann, E. K. (2012). Disentangling diverse measures: A survey of financial stress indexes. *Federal Reserve Bank of St. Louis Review*, 94(5), 369-397.
Koop, G., & Korobilis, D. (2014). A new index of financial conditions. *European Economic Review*, 71, 101-116.
Oet, M. V., Eiben, R., Bianco, T., Gramlich, D., & Ong, S. J. (2011). The financial stress index: Identification of systemic risk conditions. *Federal Reserve Bank of Cleveland Working Paper*, 11-30.
Contrarian Market Structure BreakMarket Structure Break application was inspired and adapted from Market Structure Oscillator indicator developed by Lux Algo. So much credit to their work.
This indicator pairs nicely with the Contrarian 100 MA and can be located here:
Indicator Description: Contrarian Market Structure BreakOverview
The "Contrarian Market Structure Break" indicator is a versatile tool tailored for traders seeking to identify potential reversal opportunities by analyzing market structure across multiple timeframes. Built on Institutional Concepts of Structure (ICT), this indicator detects Break of Structure (BOS) and Change of Character (CHoCH) patterns across short-term, intermediate-term, and long-term swings, plotting them with customizable lines and labels. It generates contrarian buy and sell signals when price breaks key swing levels, with a unique "Blue Dot Tracker" to monitor consecutive buy signals for trend confirmation. Optimized for the daily timeframe, this indicator is adaptable to other timeframes with proper testing, making it ideal for traders of forex, stocks, or cryptocurrencies.
How It Works
The indicator combines three key components to provide a comprehensive view of market dynamics: Multi-Timeframe Market Structure Analysis: It identifies swing highs and lows across short-term, intermediate-term, and long-term periods, plotting BOS (continuation) and CHoCH (reversal) events with customizable line styles and labels.
Contrarian Signal Generation: Buy and sell signals are triggered when the price crosses below swing lows (buy) or above swing highs (sell), indicating potential reversals in overextended markets.
Blue Dot Tracker: A unique feature that counts consecutive buy signals ("blue dots") and highlights a "Hold Investment" state with a yellow background when three or more buy signals occur, suggesting a potential trend continuation.
Signals are visualized as small circles below (buy) or above (sell) price bars, and a table in the bottom-right corner displays the blue dot count and recommended action (Hold or Flip Investment), enhancing decision-making clarity.
Mathematical Concepts Swing Detection: The indicator identifies swing highs and lows by comparing price patterns over three bars, ensuring robust detection of pivot points. A swing high occurs when the middle bar’s high is higher than the surrounding bars, and a swing low occurs when the middle bar’s low is lower.
Market Structure Logic: BOS is detected when the price breaks a prior swing high (bullish) or low (bearish) in the direction of the current trend, while CHoCH signals a potential reversal when the price breaks a swing level against the trend. These are calculated across three timeframes for a multi-dimensional perspective.
Blue Dot Tracker: This feature counts consecutive buy signals and tracks the entry price. If three or more buy signals occur without a sell signal, the indicator enters a "Hold Investment" state, marked by a yellow background, until the price exceeds the entry price or a sell signal occurs.
Entry and Exit Rules Buy Signal (Blue Dot Below Bar): Triggered when the closing price crosses below a swing low on either the intermediate-term or long-term timeframe, suggesting an oversold condition and potential reversal upward. Short-term signals can be enabled but are disabled by default to reduce noise.
Sell Signal (White Dot Above Bar): Triggered when the closing price crosses above a swing high on either the intermediate-term or long-term timeframe, indicating an overbought condition and potential reversal downward.
Blue Dot Tracker Logic: After a buy signal, the indicator increments a blue dot counter and records the entry price. If three or more consecutive buy signals occur (blueDotCount ≥ 3), the indicator enters a "Hold Investment" state, highlighted with a yellow background, suggesting a potential trend continuation. The "Hold Investment" state ends when the price exceeds the entry price or a sell signal occurs, resetting the counter.
Exit Rules: Traders can exit buy positions when a sell signal appears, the price exceeds the entry price during a "Hold Investment" state, or based on additional confirmation from BOS/CHoCH patterns or other technical analysis tools. Always use proper risk management.
Recommended Usage
The indicator is optimized for the daily timeframe, where it effectively captures significant reversal and continuation patterns in trending or ranging markets. It can be adapted to other timeframes (e.g., 1H, 4H, 15M) with careful testing of settings, particularly enabling/disabling short-term structure analysis to suit market conditions. Backtesting is recommended to optimize performance for your chosen asset and timeframe.
Customization Options Market Structure Display: Toggle short-term, intermediate-term, and long-term structures on or off, with customizable line styles (solid, dashed, dotted) and colors for bullish and bearish breaks.
Labels: Enable or disable BOS/CHoCH labels for each timeframe to reduce chart clutter.
Signal Visibility: Hide buy/sell signals if desired for a cleaner chart.
Blue Dot Tracker: Monitor the blue dot count and action (Hold or Flip Investment) via the table display, which is fully customizable in terms of position and appearance.
Why Use This Indicator?
The "Contrarian Market Structure Break" indicator offers a robust framework for identifying high-probability reversal and continuation setups using ICT principles. Its multi-timeframe analysis, clear signal visualization, and innovative Blue Dot Tracker provide traders with actionable insights into market dynamics. Whether you're a swing trader or a day trader, this indicator’s flexibility and intuitive design make it a valuable addition to your trading arsenal.
Note for TradingView Moderators
This script complies with TradingView's House Rules by providing an educational and transparent description without performance claims or guarantees. It is designed to assist traders in technical analysis and should be used alongside proper risk management and personal research. The code is original, well-documented, and includes customizable inputs and clear visual outputs to enhance the user experience.
Tips for Users:
Backtest thoroughly on your chosen asset and timeframe to validate signal reliability. Combine with other indicators or price action analysis for confirmation of entries and exits. Adjust timeframe settings and enable/disable short-term structures to match market volatility and your trading style.
Hope the "Contrarian Market Structure Break" indicator enhances your trading strategy and helps you navigate the markets with confidence! Happy trading!

Time Period Highlighter V2This indicator highlights custom time periods on any intraday chart in TradingView, making it easier to visualize your preferred trading sessions.
You can define up to three separate time ranges per day, each with precise start and end times down to the minute (e.g., 08:30 - 12:15, 14:00 - 16:45, and 20:00 - 22:30). The indicator shades the background of your chart during these periods, helping you quickly identify when you're most active or when specific market conditions occur.
Key Features:
Set start and end times (hours and minutes) for up to three trading sessions.
Automatically highlights these periods across any intraday timeframe.
Uses 24-hour time format aligned with your TradingView chart timezone.
Perfect for day traders, scalpers, or anyone needing clear visual cues for their trading windows.
This tool is especially useful for reviewing trading strategies, backtesting, or ensuring you're focusing on high-probability market hours.
Tip: Double-check that your chart timezone matches your desired session times for accurate highlighting.
