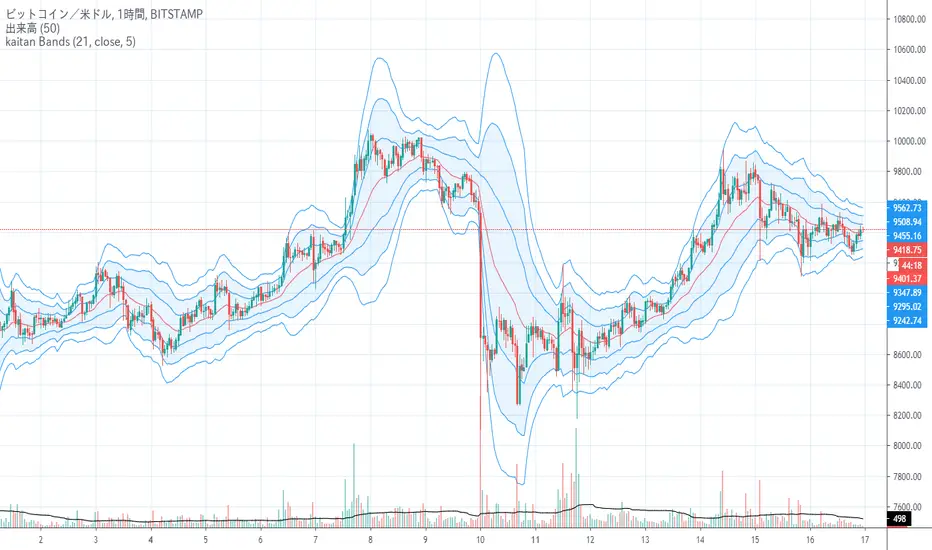
kaitan Bands
Reference: 200 section kaitan Bands
参考:200区間のkaitan Bands
Changing the Bollinger Band's midline from SMA to EMA is not so good in terms of the standard deviation calculation formula, and it was hard to say that EMABB is an index that can be used by the author in different calculation formulas.
This time, when I came up with the deviation, I came up with a method of weighting the latest deviation like EMA instead of the average and neglecting past deviations, so I made it.
The variation in the calculation result seems to be difficult to handle, so the finished product is the one with smoothed EMA deviation.
ボリンジャーバンドの中線をSMAからEMA変更にするのは標準偏差の計算式上いまいちで、EMABBは作者によって計算式もばらばらで使える指標とは言い難かった。
今回、偏差から求めるときに平均ではなくてEMAのように最新の偏差を重くし過去の偏差を軽視する方法を考え付きましたので、作ってみました。
単純に計算結果のばらつきが大きく扱いづらそうなので、EMA偏差をスムージングしたものを完成品としました。
Cerca negli script per "band"
R100 Volatility Combo Bands v1 (*v*)The Volatility Combo Bands are made from 4 separate volatility bands- two Bollinger Bands (10 and 20 period) and two Price Headley Acceleration Bands (10 and 20 period). The Volatility Combo Bands plot the innermost upper and lower points from these bands and then plots a mid-line. By default, only the standard 20 period Bollinger Bands and Combo Bands with mid-line are displayed, but can be configured however you want.
Try it out- see squeezes earlier, ride the bands earlier in trending markets, trade pullbacks to the Combo Bands and mid-line, trade the range of the band or use them to help identify potential support and resistance levels. Hopefully they can add another dimension to identifying volatility contraction patterns or whatever you currently use these things for!
I hope you get some value out of it. Only conditions of use are that if you improve it, let me know and if you publish something that uses it, don't hide the code! Enjoy!
Code for the Price Headley Acceleration Bands pinched and modified from LazyBear - thankyou.

ATR BandsDisplays two bands above and below the source using the ATR. Comes with ATR multipliers for upper and lower bands.
Percentage Band Indicator I added alerts in my Percentage Band strategy
You can see the strategy and backtest here
You can look at my other scripts.
www.tradingview.com
Prime Number Bands Strategy Determining market trends has become a science even though a high number
or people still believe it’s a gambling game. Mathematicians, technicians,
brokers and investors have worked together in developing quite several
indicators to help them better understand and forecast market movements.
The Prime Number Bands indicator was developed by Modulus Financial Engineering
Inc. This indicator is charted by indentifying the highest and lowest prime number
in the neighborhood and plotting the two series as a band.
WARNING:
- This script to change bars colors.

VWMA Keltner BandsKind of like Keltner Channel/Bands (stockcharts.com) but using VWMA instead so that volume is taken in to account.
Outside the upper band can considered to be 'overbought' and outside the lower band can be considered to be 'oversold'
Has option to highlight signals (i.e. when price closes outside a channel) and also the option to only display signals if the price is on the correct side of VWAP (i.e. no sell signals if price is above VWAP)
Fractal Regression Bands [DW]This study is an experimental regression curve built around fractal and ATR calculations.
First, Williams Fractals are calculated, and used as anchoring points.
Next, high anchor points are connected to negative sloping lines, and low anchor points to positive sloping lines. The slope is a specified percentage of the current ATR over the sampling period.
The median between the positive and negative sloping lines is then calculated, then the best fit line (linear regression) of the median is calculated to generate the basis line.
Lastly, a Golden Mean ATR is taken of price over the sampling period and multiplied by 1/2, 1, 2, and 3. The results are added and subtracted from the basis line to generate the bands.
Williams Fractals are included in the plots. The color scheme indicated whether each fractal is engulfing or non-engulfing.
Custom bar color scheme is included.

Directional Movement Bands [DW]This is a simple experimental study designed to outline trend activity and volatility.
In this study, the amount of change between current source and source of a specified lookback is calculated, then added to and subtracted from current source.
Next an exponential moving average is taken of the values for smoothing over the specified period.
Lastly, a midline is generated by taking the median of both bands.
ELASTIC WEIGHTED MOVING AVG with STDDEV BANDSImported from Stock & Commodities February 2017 month’s Traders’ Tips issue , from Vitali Apirine’s article in this issue, “Exponential Standard Deviation Bands.” Here, we present the February 2017 Traders’ Tips code with possible implementations in various software.


UCS_TTM - Reversion BandsOk, Here we go - Version 1 of TTM Reversion Band goes live.
Link to TTM Reversion Band - www.tradethemarkets.com
Link to TTM Reversion Band Guide - kb.simplertrading.com
John Carters Mastering the trade - www.amazon.com
For the amount of information this has, the price tag is not hefty.
John's RTM Chapter Synopsis - www.tradethemarkets.com
What did I modify?
1. Automated the Daily + and Intraday settings. So Switching to intraday will change the setting automatically.
2. Added text callouts for RTM condition
a. John Carter's Indicator
b. Slope Based (my addition).
Future Improvement Planned.
1. Will Convert this into a system based on John's Indicator from TS.
2. Custom Options for Slope and MA setting for Trade filter.

Bandpass Filter Strategy The related article is copyrighted material from
Stocks & Commodities Mar 2010
You can use in the xPrice any series: Open, High, Low, Close, HL2, HLC3, OHLC4 and ect...
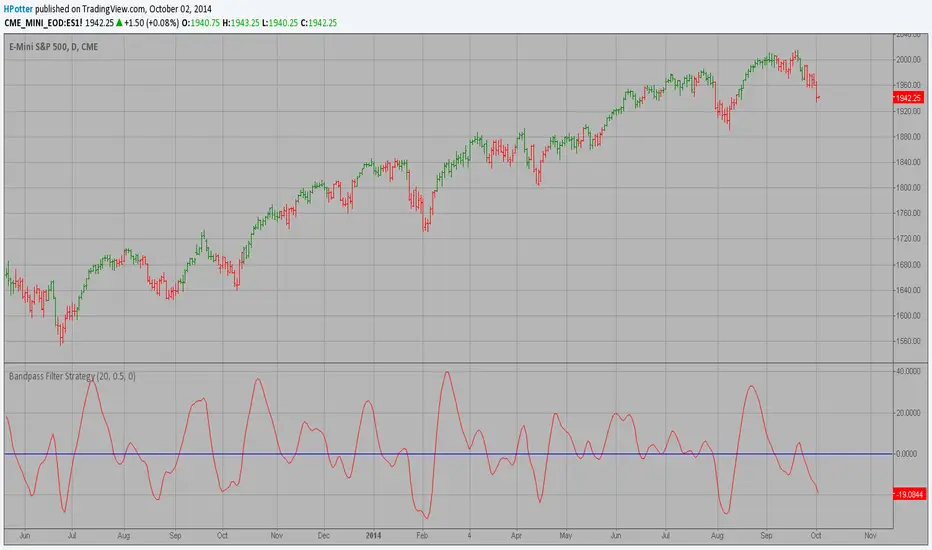
Bandpass Filter The related article is copyrighted material from
Stocks & Commodities Mar 2010
You can use in the xPrice any series: Open, High, Low, Close, HL2, HLC3, OHLC4 and ect...

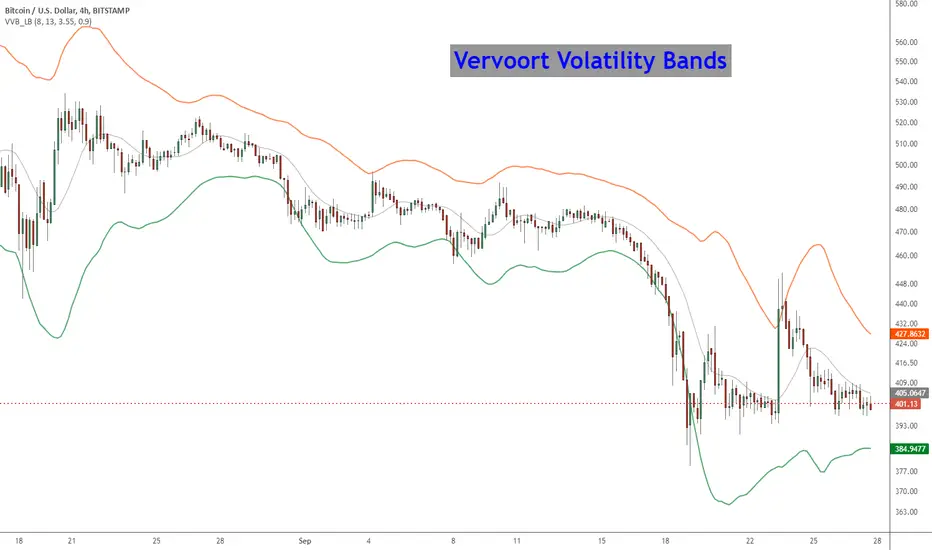
Vervoort Volatility Bands [LazyBear]This is Mr. Vervoort's take on volatility bands. Sticking to his style, he uses highly smoothed data everywhere, also improves on the way the bands are calculated. Is this better than others? I will let you guys decide :)
More info:
www.traders.com
List of my other indicators:
- Chart:
- GDoc: docs.google.com
RSI BandsPlots adaptive ATR bands around the 27-EMA to approximate RSI overbought and oversold zones directly on price. Provides a clean visual reference for RSI-like extremes without displaying the RSI itself.

Bollinger Band Touch with EMA Filter (Inverted, Alerts)Bollinger Band Touch with EMA Filter above or below the 100 nd 200 emas
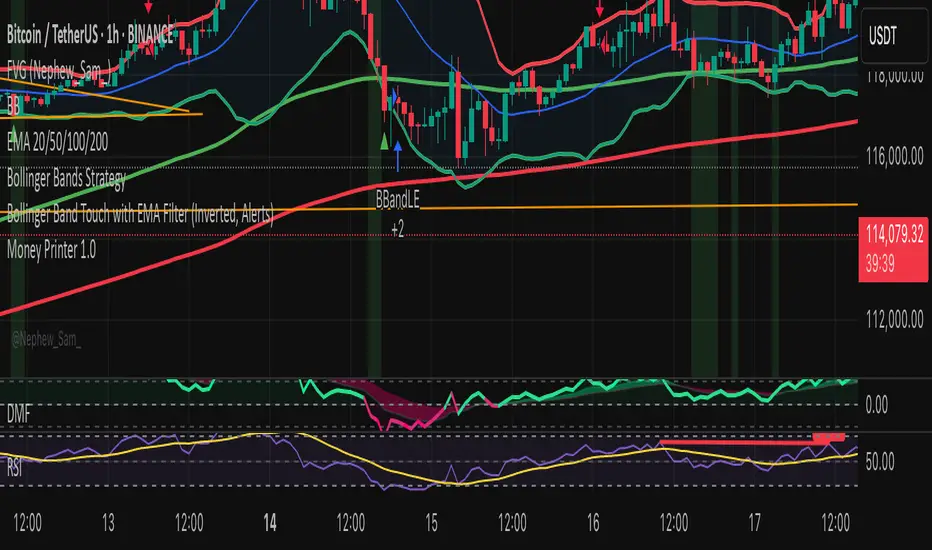
Bollinger Band Touch with EMA Filterbollomger band strategy above and below the 100 and above the 200

Bollinger Bands Volatility Arrows
Explanation of Changes:
Arrow Style:
Green Up Arrow (▲): Indicates increasing volatility with a positive value.
Red Down Arrow (▼): Indicates decreasing volatility with a negative value.
Labels with Arrows:
label.new is used to create arrows with the label.style_label_up or label.style_label_down styles.
The numerical value of the volatility is displayed beside the arrow using str.tostring.
Label Position:
For increasing volatility, the green arrow is placed near the high of the candle.
For decreasing volatility, the red arrow is placed near the low of the candle.
Text Format:
Includes the arrow symbol and the volatility value (formatted to 4 decimal places).
How It Works:
You’ll see green upward arrows for increasing volatility and red downward arrows for decreasing volatility.
Each arrow includes the exact value of the Bollinger Bands width at that moment.

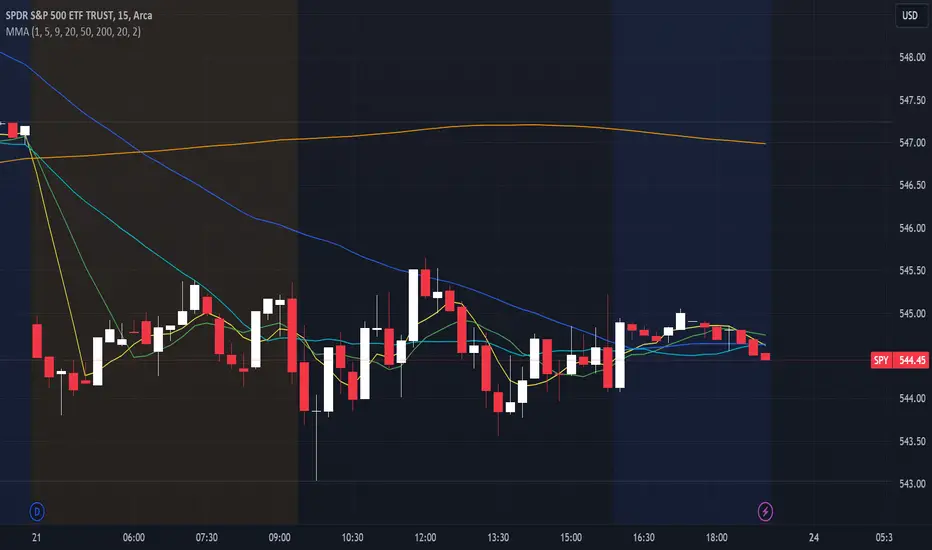
Multiple Moving Averages, Bollinger Bands, VWAP Options - Lett5 simple moving averages.
You decide:
1. The type of moving average
2. The length of the moving average
3. To show Bollinger Bands
4. To show VWAP.
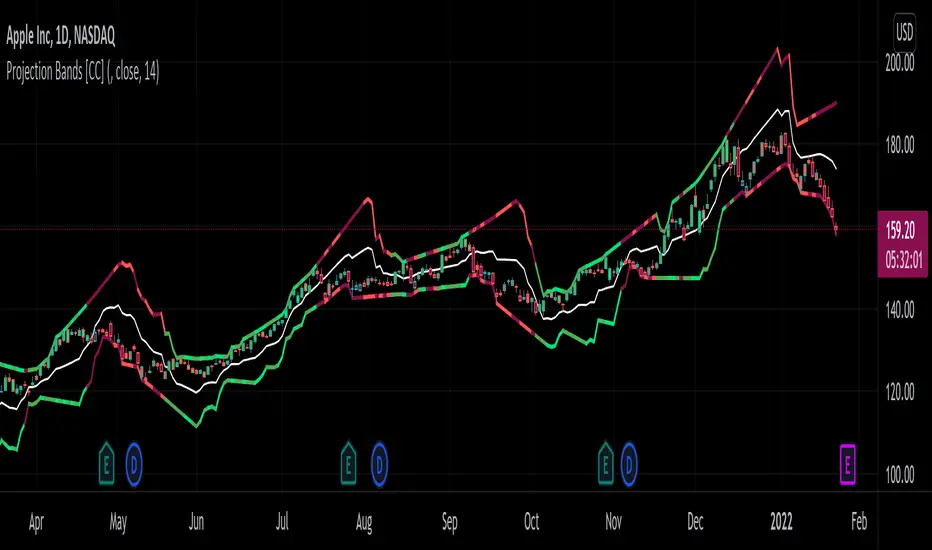
Projection Bands [CC]The Projection Bands were created by Mel Widner (Stocks and Commodities Jul 1995) and this indicator and the other two that rely on this one (I will publish them later) are very underappreciated in my humble opinion. The biggest strength of this indicator is the fact that it is a leading indicator for dramatic price movements. As you can see in my example chart it consistently gives great exit points before a downturn. I have included strong buy and sell signals in addition to normal ones so strong signals are darker in color and normal signals are lighter in color. Buy when the line turns green and sell when it turns red.
Let me know if there are any other indicators or scripts you would like to see me publish!
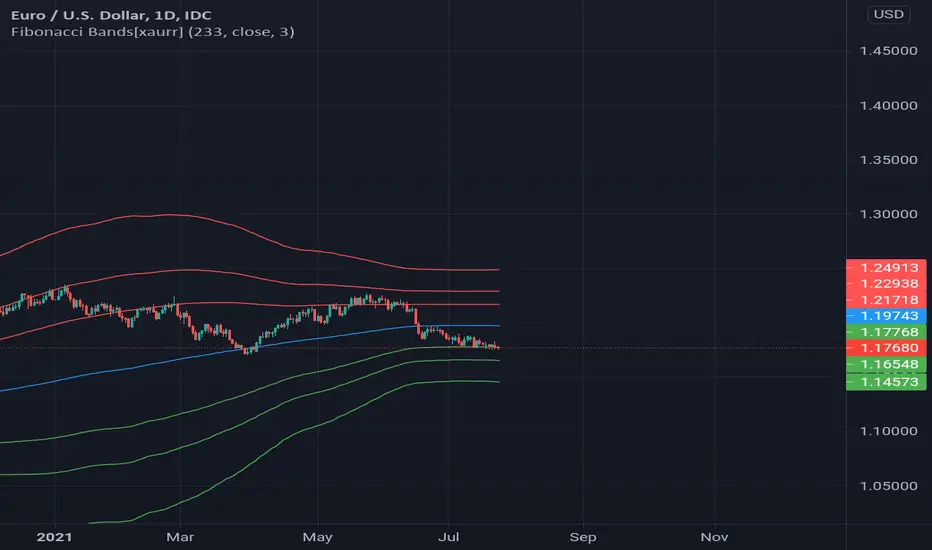
Fibonacci Bands[xaurr]This script draws Fibonacci bands according to std deviation using moving avarage with 233 periods, its the well know fibonacci number for following trend.
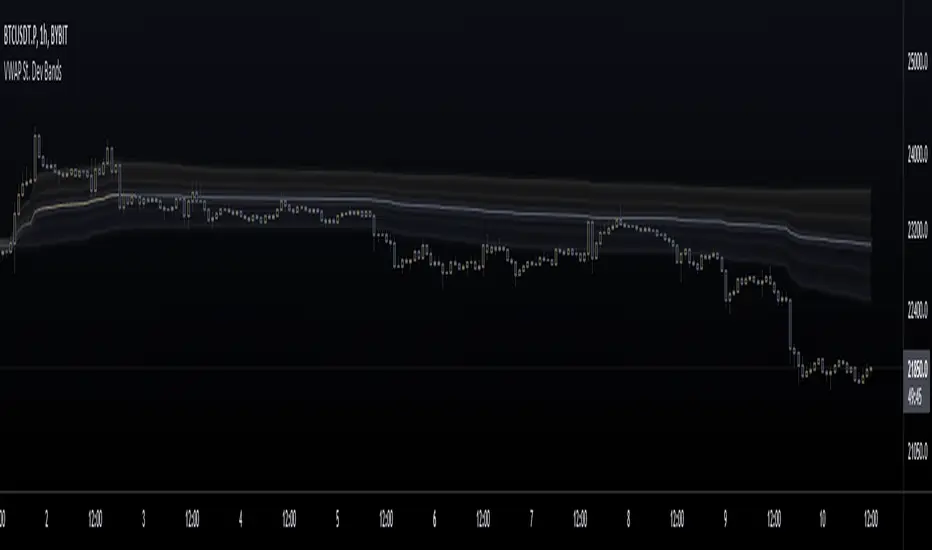
VWAP St. Dev BandsThis indicator allows you to add up to 3 volatility bands to VWAP based on its Standard Deviation.
Best use is for intraday but you can choose higher timeframes too.
For day trading a band of 3 standard deviations usually works well as an overbought/oversold region, allowing for mean reversion trading, but you are free to come up with your own strategies.
Enjoy!
Crypto EMA Bands - Support and ResistanceEMA Bands for crypto markets shows support and resistance lines. Helps identify bull and bear market trends. SMA200 is white and turns yellow to signal pressure. Can also be useful for identifying Elliot waves and breakouts.
